Embed Size (px)
Citation preview
Unit 1: Functions and Graphs
Unit 2: Polynomial, Power, and Rational Functions
Unit 3: Exponential, Logistic, and Logarithmic Functions
Unit 4: Trigonometric Functions
Unit 5: Analytic Trigonometry
Unit 6: Applications of Trigonometry
Unit 7: Systems, Sequences, and Series
Unit 8: An Introduction to Limits
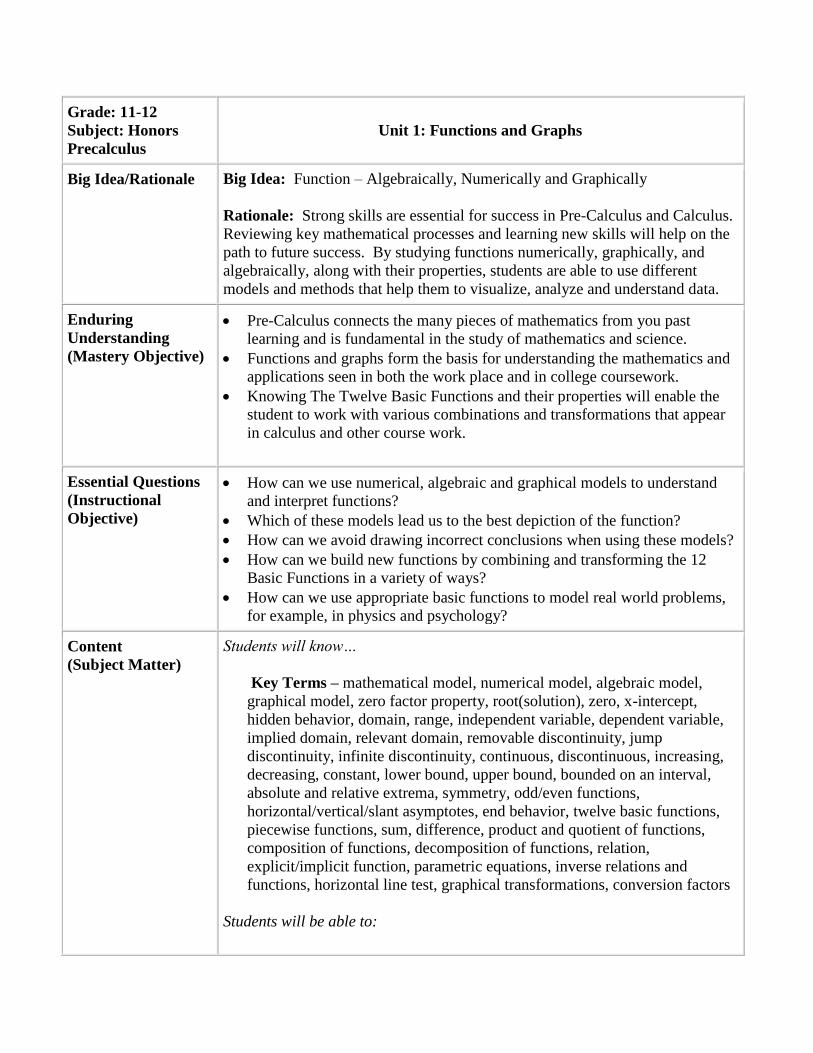
Grade: 11-12
Subject: Honors
Precalculus
Unit 1: Functions and Graphs
Big Idea/Rationale
Big Idea: Function – Algebraically, Numerically and Graphically
Rationale: Strong skills are essential for success in Pre-Calculus and Calculus.
Reviewing key mathematical processes and learning new skills will help on the
path to future success. By studying functions numerically, graphically, and
algebraically, along with their properties, students are able to use different
models and methods that help them to visualize, analyze and understand data.
Enduring
Understanding
(Mastery Objective)
Pre-Calculus connects the many pieces of mathematics from you past
learning and is fundamental in the study of mathematics and science.
Functions and graphs form the basis for understanding the mathematics and
applications seen in both the work place and in college coursework.
Knowing The Twelve Basic Functions and their properties will enable the
student to work with various combinations and transformations that appear
in calculus and other course work.
Essential Questions
(Instructional
Objective)
How can we use numerical, algebraic and graphical models to understand
and interpret functions?
Which of these models lead us to the best depiction of the function?
How can we avoid drawing incorrect conclusions when using these models?
How can we build new functions by combining and transforming the 12
Basic Functions in a variety of ways?
How can we use appropriate basic functions to model real world problems,
for example, in physics and psychology?
Content
(Subject Matter)
Students will know…
Key Terms – mathematical model, numerical model, algebraic model,
graphical model, zero factor property, root(solution), zero, x-intercept,
hidden behavior, domain, range, independent variable, dependent variable,
implied domain, relevant domain, removable discontinuity, jump
discontinuity, infinite discontinuity, continuous, discontinuous, increasing,
decreasing, constant, lower bound, upper bound, bounded on an interval,
absolute and relative extrema, symmetry, odd/even functions,
horizontal/vertical/slant asymptotes, end behavior, twelve basic functions,
piecewise functions, sum, difference, product and quotient of functions,
composition of functions, decomposition of functions, relation,
explicit/implicit function, parametric equations, inverse relations and
functions, horizontal line test, graphical transformations, conversion factors
Students will be able to:
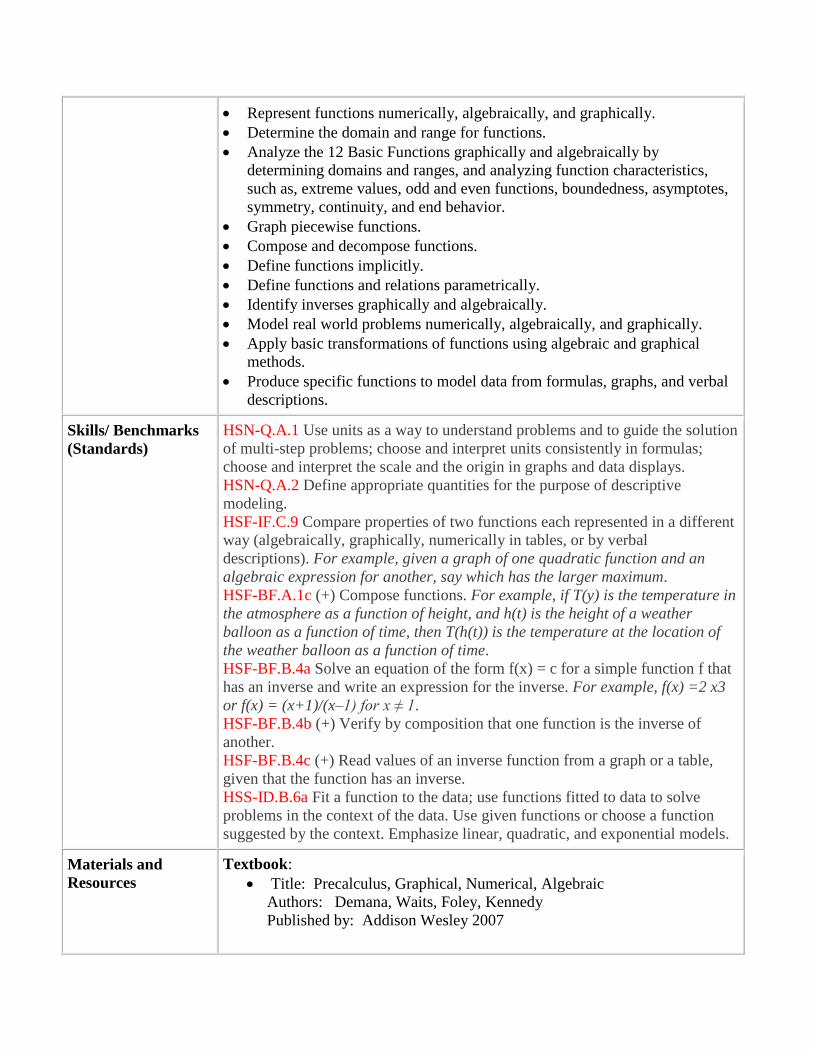
Represent functions numerically, algebraically, and graphically.
Determine the domain and range for functions.
Analyze the 12 Basic Functions graphically and algebraically by
determining domains and ranges, and analyzing function characteristics,
such as, extreme values, odd and even functions, boundedness, asymptotes,
symmetry, continuity, and end behavior.
Graph piecewise functions.
Compose and decompose functions.
Define functions implicitly.
Define functions and relations parametrically.
Identify inverses graphically and algebraically.
Model real world problems numerically, algebraically, and graphically.
Apply basic transformations of functions using algebraic and graphical
methods.
Produce specific functions to model data from formulas, graphs, and verbal
descriptions.
Skills/ Benchmarks
(Standards)
HSN-Q.A.1 Use units as a way to understand problems and to guide the solution
of multi-step problems; choose and interpret units consistently in formulas;
choose and interpret the scale and the origin in graphs and data displays.
HSN-Q.A.2 Define appropriate quantities for the purpose of descriptive
modeling.
HSF-IF.C.9 Compare properties of two functions each represented in a different
way (algebraically, graphically, numerically in tables, or by verbal
descriptions). For example, given a graph of one quadratic function and an
algebraic expression for another, say which has the larger maximum.
HSF-BF.A.1c (+) Compose functions. For example, if T(y) is the temperature in
the atmosphere as a function of height, and h(t) is the height of a weather
balloon as a function of time, then T(h(t)) is the temperature at the location of
the weather balloon as a function of time.
HSF-BF.B.4a Solve an equation of the form f(x) = c for a simple function f that
has an inverse and write an expression for the inverse. For example, f(x) =2 x3
or f(x) = (x+1)/(x–1) for x ≠ 1.
HSF-BF.B.4b (+) Verify by composition that one function is the inverse of
another.
HSF-BF.B.4c (+) Read values of an inverse function from a graph or a table,
given that the function has an inverse.
HSS-ID.B.6a Fit a function to the data; use functions fitted to data to solve
problems in the context of the data. Use given functions or choose a function
suggested by the context. Emphasize linear, quadratic, and exponential models.
Materials and
Resources
Textbook:
Title: Precalculus, Graphical, Numerical, Algebraic
Authors: Demana, Waits, Foley, Kennedy
Published by: Addison Wesley 2007
Resource Manual-Chapter 1
Precalculus Express Power Point Slides
Technology: Graphing Calculators-TI 83 Plus
Notes
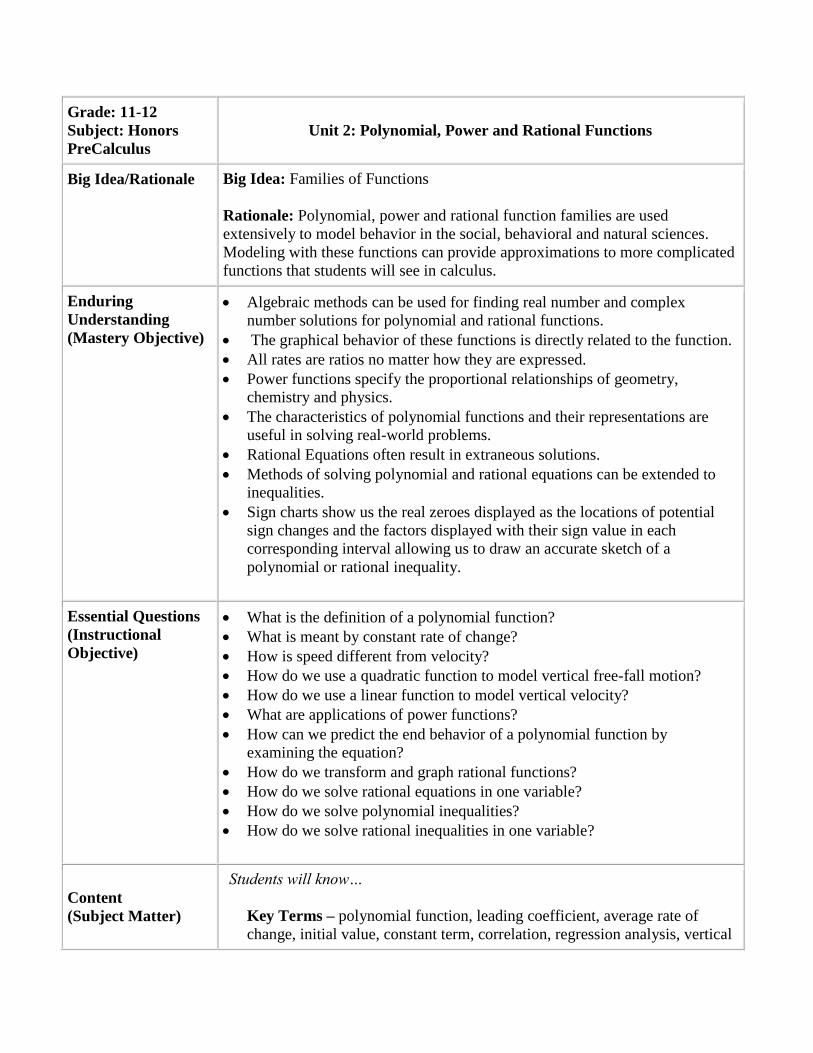
Grade: 11-12
Subject: Honors
PreCalculus
Unit 2: Polynomial, Power and Rational Functions
Big Idea/Rationale Big Idea: Families of Functions
Rationale: Polynomial, power and rational function families are used
extensively to model behavior in the social, behavioral and natural sciences.
Modeling with these functions can provide approximations to more complicated
functions that students will see in calculus.
Enduring
Understanding
(Mastery Objective)
Algebraic methods can be used for finding real number and complex
number solutions for polynomial and rational functions.
The graphical behavior of these functions is directly related to the function.
All rates are ratios no matter how they are expressed.
Power functions specify the proportional relationships of geometry,
chemistry and physics.
The characteristics of polynomial functions and their representations are
useful in solving real-world problems.
Rational Equations often result in extraneous solutions.
Methods of solving polynomial and rational equations can be extended to
inequalities.
Sign charts show us the real zeroes displayed as the locations of potential
sign changes and the factors displayed with their sign value in each
corresponding interval allowing us to draw an accurate sketch of a
polynomial or rational inequality.
Essential Questions
(Instructional
Objective)
What is the definition of a polynomial function?
What is meant by constant rate of change?
How is speed different from velocity?
How do we use a quadratic function to model vertical free-fall motion?
How do we use a linear function to model vertical velocity?
What are applications of power functions?
How can we predict the end behavior of a polynomial function by
examining the equation?
How do we transform and graph rational functions?
How do we solve rational equations in one variable?
How do we solve polynomial inequalities?
How do we solve rational inequalities in one variable?
Content
(Subject Matter)
Students will know…
Key Terms – polynomial function, leading coefficient, average rate of
change, initial value, constant term, correlation, regression analysis, vertical
free fall, acceleration due to gravity, power function, constant of variation,
direct variation, inverse variation, leading coefficient test for polynomial
end behavior, zeros of odd and even multiplicity, x and y intercepts, vertical
asymptotes and end behavior asymptotes of a rational function, remainder
and factor theorems, synthetic and long division, fundamental theorem of
algebra, linear factorization theorem, zeros of complex conjugates,
extraneous solutions, sign chart,
Students will be able to…
Model real world problems using Linear and Quadratic Functions
Find the average rate of change
Model Free-Fall Motion
Analyze Power Functions
Model Power Functions using Direct and Inverse Variation
Graph Power Functions
Analyze Monomial Functions
Analyze and graph Polynomial Functions
Determine the end behavior of Polynomial Functions
Find the Zeros of Polynomial Functions
Sketch the graph of a Polynomial Function
Analyze Graphs of Rational Functions
Determine limits, asymptotes, x and y intercepts of Rational Functions
Sketch the graph of a Rational Function
Solve Rational Equations
Finding a Minimum Perimeter given the area
Solve polynomial, rational and other inequalities using a Sign Chart
Skills/ Benchmarks
(Standards)
HSN-Q.A.1 Use units as a way to understand problems and to guide the solution
of multi-step problems; choose and interpret units consistently in formulas;
choose and interpret the scale and the origin in graphs and data displays.
HSN-Q.A.2 Define appropriate quantities for the purpose of descriptive
modeling.
HSN-CN.A.1 Know there is a complex number i such that i2 = –1, and every
complex number has the form a + bi with a and b real.
HSN-CN.A.2 Use the relation i2 = –1 and the commutative, associative, and
distributive properties to add, subtract, and multiply complex numbers.
HSN-CN.C.7 Solve quadratic equations with real coefficients that have complex
solutions.
HSN-CN.C.8 (+) Extend polynomial identities to the complex numbers. For
example, rewrite x2 + 4 as (x + 2i)(x – 2i).
HSN-CN.C.9 (+) Know the Fundamental Theorem of Algebra; show that it is
true for quadratic polynomials.
HSA-APR.B.2 Know and apply the Remainder Theorem: For a polynomial p(x)
and a number a, the remainder on division by x – a is p(a), so p(a) = 0 if and
only if (x – a) is a factor of p(x).
HSA-APR.D.6 Rewrite simple rational expressions in different forms; write a(x)
/b(x) in the form q(x) + r(x)
/b(x), where a(x), b(x), q(x), and r(x) are polynomials
with the degree of r(x) less than the degree of b(x), using inspection, long
division, or, for the more complicated examples, a computer algebra system.
HSA-APR.D.7 (+) Understand that rational expressions form a system
analogous to the rational numbers, closed under addition, subtraction,
multiplication, and division by a nonzero rational expression; add, subtract,
multiply, and divide rational expressions.
HSA-REI.A.2 Solve simple rational and radical equations in one variable, and
give examples showing how extraneous solutions may arise.
HSS-ID.B.6a Fit a function to the data; use functions fitted to data to solve
problems in the context of the data. Use given functions or choose a function
suggested by the context. Emphasize linear, quadratic, and exponential models.
Materials and
Resources Textbook:
Title: Precalculus, Graphical, Numerical, Algebraic
Authors: Demana, Waits, Foley, Kennedy
Published by: Addison Wesley 2007
Resource Manual-Chapter 2
Precalculus Express Power Point Slides
Technology: Graphing Calculators-TI 83 Plus
Notes Appendix A.2 Factoring Polynomials
Grade: 11-12
Subject: Honors
Precalculus
Unit 3: Exponential, Logistic, and Logarithmic Functions
Big Idea/Rationale Big Idea: Transcendental Functions
Rationale: Transcendental Functions go beyond their algebraic cousins and
can be used to model a variety of real world applications such as:
unrestricted/restricted population growth, the decay of radioactive substances,
the spread of rumors and diseases, the Richter Scale of earthquake intensity,
the pH scale and the decibel measurement of sound.
Enduring
Understanding
(Mastery Objective)
Exponential, logarithmic and logistic functions are transcendental functions
that have wide spread applications.
Exponential and logarithmic functions are inverses of each other and their
graphs are reflections of each other.
Exponential and logarithmic functions can be used to model behavior which
will enable us to predict the future and rediscover the past.
Algebraic and numerical methods can be used for finding real number
solutions for Exponential, Logistic, and Logarithmic Functions which can be
related to the graphical behavior of these functions.
Essential Questions
(Instructional
Objective)
What are the properties of Exponential, Logistic, and Logarithmic Functions
and their graphs?
How can an exponential function represent a real world scenario?
What is a logarithm?
How can the properties of logarithms be used to solve equations?
How do you solve Exponential, Logistic, and Logarithmic equations
algebraically? Graphically?
How do we use these equations to model and solve real world situations as
enumerated above?
Why is the number e important?
Content
(Subject Matter)
Students will know…
Key Terms – Algebraic functions, transcendental functions, exponential
function, base, exponential growth function, growth factor, exponential
decay function, decay function, the natural number e, logistic growth
function, limit to growth constant, logistic decay function, logistic function,
exponential population model, exponential growth and decay models,
radioactive decay, half-life, maximum sustainable population, logarithmic
function, common logarithm, natural logarithm, decibels, properties of
logarithms, change of base formula, Newton’s Law of Cooling, compound
interest, annual percentage yield.
Students will be able to….
Identify, graph and model using Exponential and Logistic functions with
appropriate bases including e
Identify the Constant Percentage Rate, apply exponential model to bacteria
growth and radioactive decay
Apply logistic models to predict spread of disease, restricted population
growth and spread of rumors.
Convert between exponential and logarithmic form
Evaluate expressions containing logs base b, common logs base 10 and
natural logs base e
Graph Logarithmic Functions of any base and analyze the graphs.
Apply the properties of logarithms to solve exponential and logarithmic
equations algebraically and solve application problems using these
equations.
Solve business and finance applications related to compound interest.
Skills/ Benchmarks
(Standards)
A.SSE.B.3.C Use the properties of exponents to transform expressions for
exponential functions. For example the expression 1.15t can be rewritten as
(1.151/12
)12t
≈ 1.01212t
to reveal the approximate equivalent monthly interest rate
if the annual rate is 15%.
A.CED.A.1 Create equations and inequalities in one variable and use them to
solve problems. Include equations arising from linear and quadratic functions,
and simple rational and exponential functions.
F.IF.C.7.E Graph exponential and logarithmic functions, showing intercepts and
end behavior, and trigonometric functions, showing period, midline, and
amplitude.
F.IF.C.8.B Use the properties of exponents to interpret expressions for
exponential functions. For example, identify percent rate of change in functions
such as y = (1.02)ᵗ, y = (0.97)ᵗ, y = (1.01)12ᵗ, y = (1.2)ᵗ/10, and classify them as
representing exponential growth or decay.
F.BF.B.3 Identify the effect on the graph of replacing f(x) by f(x)
+ k, k f(x), f(kx), and f(x + k) for specific values of k (both positive and
negative); find the value of k given the graphs. Experiment with cases and
illustrate an explanation of the effects on the graph using technology. Include
recognizing even and odd functions from their graphs and algebraic expressions
for them.
F.BF.B.5 (+) Understand the inverse relationship between exponents and
logarithms and use this relationship to solve problems involving logarithms and
exponents.
F.LE.A.1 Distinguish between situations that can be modeled with linear
functions and with exponential functions.
a. Prove that linear functions grow by equal differences over equal intervals,
and that exponential functions grow by equal factors over equal intervals.
c. Recognize situations in which a quantity grows or decays by a constant
percent rate per unit interval relative to another.
F.LE.A.2 Construct linear and exponential functions, including arithmetic and
geometric sequences, given a graph, a description of a relationship, or two
input-output pairs (include reading these from a table).
F.LE.A.3 Observe using graphs and tables that a quantity increasing
exponentially eventually exceeds a quantity increasing linearly, quadratically, or
(more generally) as a polynomial function.
F.LE.A.4 For exponential models, express as a logarithm the solution
to abct = d where a, c, and d are numbers and the base b is 2, 10, or e; evaluate
the logarithm using technology.
F.LE.B.5 Interpret the parameters in a linear or exponential function in terms of
a context.
Materials and
Resources Textbook:
Title: Precalculus, Graphical, Numerical, Algebraic
Authors: Demana, Waits, Foley, Kennedy
Published by: Addison Wesley 2007
Resource Manual-Chapter 3
Precalculus Express Power Point Slides
Technology: Graphing Calculators-TI 83 Plus
Notes
Grade: 11-12
Subject: Honors
Precalculus
Unit 4: Trigonometric Functions
Big Idea/Rationale
Big Idea: The Study of Trigonometry Functions – Old and New
Rationale: Students began their study of trigonometry in previous math
courses with right triangles. They will extend their knowledge to understand
how this information can help them solve a variety of real world problems. The
study of calculus has made the knowledge of trigonometric functions more
important than ever. Sinusoidal equations are especially useful in modeling
periodic behavior in real world applications including average monthly
temperatures, daylight hours, tides, sales forecasts, and blood pressure. These
functions can help us predict future behavior.
Enduring
Understanding
(Mastery Objective)
Angles are the domain elements of the trigonometric functions.
The radian allows mathematicians a link between an angle’s measure and
the length of its radius.
Real world data can be modeled with a sinusoidal function.
There exists a definite and distinct bridge between the fields of trigonometry
and physics.
Right triangles can be used to model and solve real world problems.
Members within a family of functions, including the trigonometric
functions, have common characteristics.
Essential Questions
(Instructional
Objective)
What is a radian and how is it related to a degree?
How are linear and angular velocities similar? Different?
Describe the difference between an angle with a positive measure and an
angle with a negative measure.
What is a quick way to verify coterminal angles?
What are the reciprocal ratios of sine, cosine, and tangent?
Explain the process of evaluating a trigonometric function using reference
angles and the unity circle.
How do the values on the unit circle correlate to the rectangular graph of a
trigonometric function?
Function composition extends our ability to model periodic phenomena like
heartbeats and sound waves.
Why is it necessary to restrict the domain in order to discuss inverse
trigonometric functions?
What does it mean to find the exact value of a trigonometric function?
Why are trigonometric functions periodic?
What is the effect of A, B, h, and k on the graph of a Sine or Cosine curve using the
equationssin ( )
cos ( )
y A B x h k
y A B x h k
?
How do we apply the trig ratios to solve for the parts of a right triangle?
How do we extend the trig functions to solve problems involving periodic
behavior and real numbers?
How do we transform graphs of sine and cosine functions?
How do we relate the concept of inverse function to trig functions?
How do we solve a trig equation?
Content
(Subject Matter)
Students will know…
Key Terms - radian, circular arc, central angle, length of an arc, sector, area
of a circular sector, angular displacement, angular velocity, dimensional
analysis, linear velocity, right triangle trigonometric ratios, trigonometric
functions of special angles, unit circle, vertex, initial side, terminal side,
standard position, degree, minutes, seconds, quadrantal angle, coterminal
angle, reference angle, cofunction, angle of elevation, angle of depression,
periodic function, period, amplitude, phase shift, frequency, compound
functions, sinusoidal function, inverse trigonometric functions
Students will be able to:
Convert between degree measures to degrees, minutes, seconds and vice
versa.
Convert between degrees and radians.
Determine arc length using the appropriate formula.
Use the relationships in the 2 special right triangles to evaluate the 6
trigonometric functions.
Recognize 4 common calculator errors when evaluating trigonometric
function.
Evaluate the trigonometric functions of any angle.
Use reference triangles to find trigonometric functions of real numbers.
Find the amplitude, the period, the phase shift, and the vertical shift for
trigonometric functions
Sketch transformations of graphs of sine, cosine tangent, secant, cosecant,
and cotangent and analyze their characteristics.
Model periodic behavior with sinusoids.
Write trigonometric equations to model a given situation
Use graphs of inverse sine, cosine and tangent functions with their
respective domains to solve equations.
Solve applications of right triangles.
Skills/ Benchmarks
(Standards)
HSN-Q.A.1 Use units as a way to understand problems and to guide the solution
of multi-step problems; choose and interpret units consistently in formulas;
choose and interpret the scale and the origin in graphs and data displays.
HSN-Q.A.2 Define appropriate quantities for the purpose of descriptive
modeling.
HSF-IF.B.4 For a function that models a relationship between two quantities,
interpret key features of graphs and tables in terms of the quantities, and sketch
graphs showing key features given a verbal description of the relationship. Key
features include: intercepts; intervals where the function is increasing,
decreasing, positive, or negative; relative maximums and minimums;
symmetries; end behavior; and periodicity.*
HSF-IF.B.5 Relate the domain of a function to its graph and, where applicable,
to the quantitative relationship it describes. For example, if the function h(n)
gives the number of person-hours it takes to assemble n engines in a factory,
then the positive integers would be an appropriate domain for the function.*
HSF-BF.B.3 Identify the effect on the graph of replacing f(x) by f(x) + k, k f(x),
f(kx), and f(x + k) for specific values of k (both positive and negative); find the
value of k given the graphs. Experiment with cases and illustrate an explanation
of the effects on the graph using technology. Include recognizing even and odd
functions from their graphs and algebraic expressions for them.
HSF-BF.B.4d (+) Produce an invertible function from a non-invertible function
by restricting the domain.
HSF-TF.A.1 Understand radian measure of an angle as the length of the arc on
the unit circle subtended by the angle.
HSF-TF.A.2 Explain how the unit circle in the coordinate plane enables the
extension of trigonometric functions to all real numbers, interpreted as radian
measures of angles traversed counterclockwise around the unit circle.
HSF-TF.A.3 (+) Use special triangles to determine geometrically the values of
sine, cosine, tangent for π/3, π/4 and π/6, and use the unit circle to express the
values of sine, cosine, and tangent for x, π + x, and 2π – x in terms of their
values for x, where x is any real number.
HSF-TF.A.4 (+) Use the unit circle to explain symmetry (odd and even) and
periodicity of trigonometric functions.
HSF-TF.B.5 Choose trigonometric functions to model periodic phenomena with
specified amplitude, frequency, and midline.*
HSF-TF.B.6 (+) Understand that restricting a trigonometric function to a
domain on which it is always increasing or always decreasing allows its inverse
to be constructed.
Materials and
Resources Textbook:
Title: Precalculus, Graphical, Numerical, Algebraic
Authors: Demana, Waits, Foley, Kennedy
Published by: Addison Wesley 2007
Resource Manual-Chapter 4
Precalculus Express Power Point Slides
Technology: Graphing Calculators-TI 83 Plus

Notes Omit Section 4.6
Grade: 11-12
Subject: Honors
Precalculus
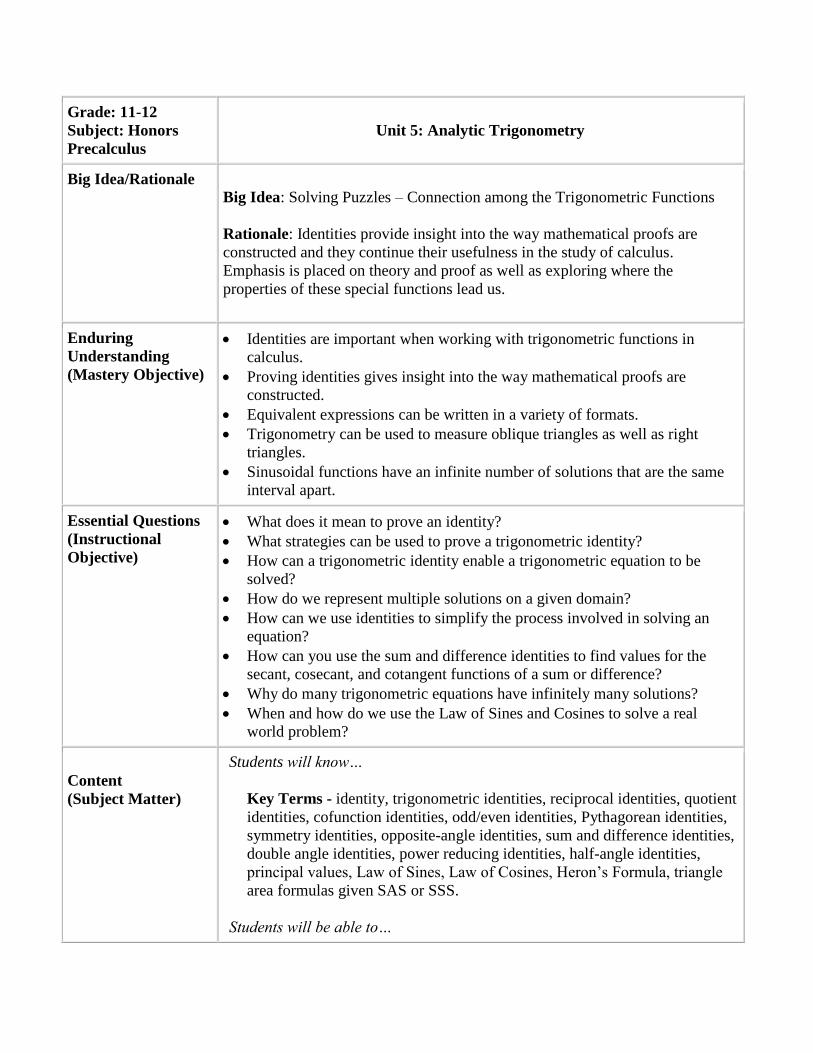
Unit 5: Analytic Trigonometry
Big Idea/Rationale
Big Idea: Solving Puzzles – Connection among the Trigonometric Functions
Rationale: Identities provide insight into the way mathematical proofs are
constructed and they continue their usefulness in the study of calculus.
Emphasis is placed on theory and proof as well as exploring where the
properties of these special functions lead us.
Enduring
Understanding
(Mastery Objective)
Identities are important when working with trigonometric functions in
calculus.
Proving identities gives insight into the way mathematical proofs are
constructed.
Equivalent expressions can be written in a variety of formats.
Trigonometry can be used to measure oblique triangles as well as right
triangles.
Sinusoidal functions have an infinite number of solutions that are the same
interval apart.
Essential Questions
(Instructional
Objective)
What does it mean to prove an identity?
What strategies can be used to prove a trigonometric identity?
How can a trigonometric identity enable a trigonometric equation to be
solved?
How do we represent multiple solutions on a given domain?
How can we use identities to simplify the process involved in solving an
equation?
How can you use the sum and difference identities to find values for the
secant, cosecant, and cotangent functions of a sum or difference?
Why do many trigonometric equations have infinitely many solutions?
When and how do we use the Law of Sines and Cosines to solve a real
world problem?
Content
(Subject Matter)
Students will know…
Key Terms - identity, trigonometric identities, reciprocal identities, quotient
identities, cofunction identities, odd/even identities, Pythagorean identities,
symmetry identities, opposite-angle identities, sum and difference identities,
double angle identities, power reducing identities, half-angle identities,
principal values, Law of Sines, Law of Cosines, Heron’s Formula, triangle
area formulas given SAS or SSS.
Students will be able to…
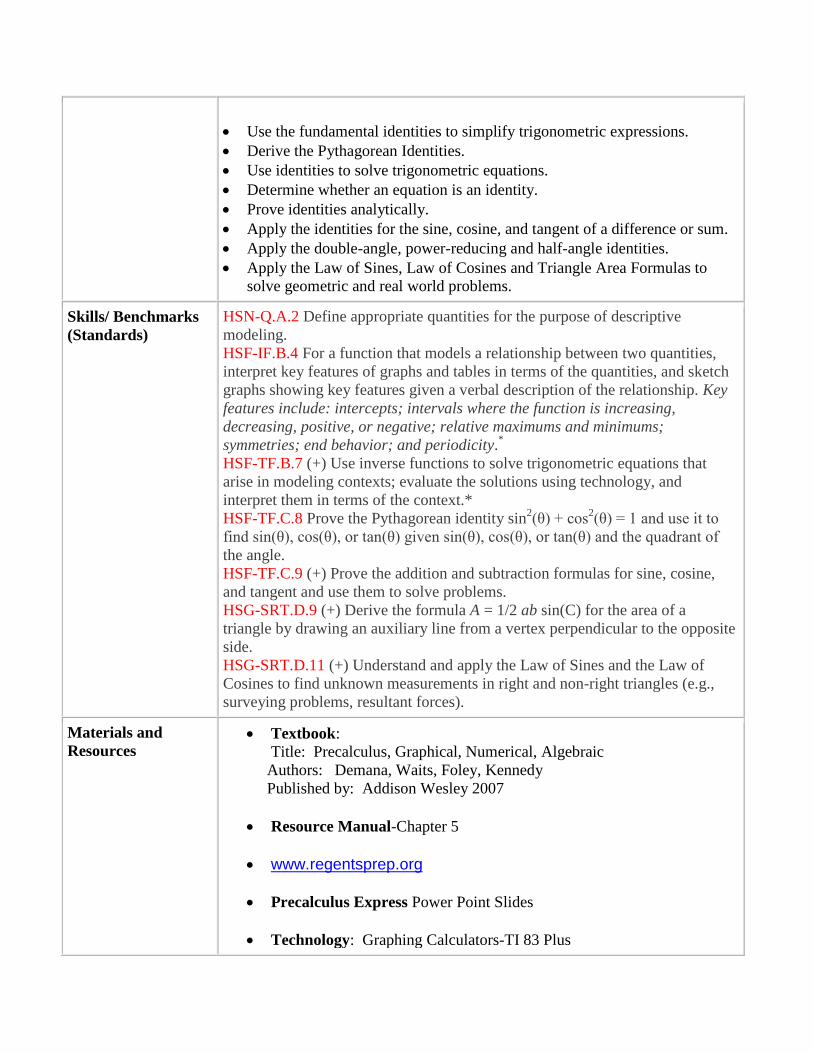
Use the fundamental identities to simplify trigonometric expressions.
Derive the Pythagorean Identities.
Use identities to solve trigonometric equations.
Determine whether an equation is an identity.
Prove identities analytically.
Apply the identities for the sine, cosine, and tangent of a difference or sum.
Apply the double-angle, power-reducing and half-angle identities.
Apply the Law of Sines, Law of Cosines and Triangle Area Formulas to
solve geometric and real world problems.
Skills/ Benchmarks
(Standards)
HSN-Q.A.2 Define appropriate quantities for the purpose of descriptive
modeling.
HSF-IF.B.4 For a function that models a relationship between two quantities,
interpret key features of graphs and tables in terms of the quantities, and sketch
graphs showing key features given a verbal description of the relationship. Key
features include: intercepts; intervals where the function is increasing,
decreasing, positive, or negative; relative maximums and minimums;
symmetries; end behavior; and periodicity.*
HSF-TF.B.7 (+) Use inverse functions to solve trigonometric equations that
arise in modeling contexts; evaluate the solutions using technology, and
interpret them in terms of the context.*
HSF-TF.C.8 Prove the Pythagorean identity sin2(θ) + cos
2(θ) = 1 and use it to
find sin(θ), cos(θ), or tan(θ) given sin(θ), cos(θ), or tan(θ) and the quadrant of
the angle.
HSF-TF.C.9 (+) Prove the addition and subtraction formulas for sine, cosine,
and tangent and use them to solve problems.
HSG-SRT.D.9 (+) Derive the formula A = 1/2 ab sin(C) for the area of a
triangle by drawing an auxiliary line from a vertex perpendicular to the opposite
side.
HSG-SRT.D.11 (+) Understand and apply the Law of Sines and the Law of
Cosines to find unknown measurements in right and non-right triangles (e.g.,
surveying problems, resultant forces).
Materials and
Resources Textbook:
Title: Precalculus, Graphical, Numerical, Algebraic
Authors: Demana, Waits, Foley, Kennedy
Published by: Addison Wesley 2007
Resource Manual-Chapter 5
www.regentsprep.org
Precalculus Express Power Point Slides
Technology: Graphing Calculators-TI 83 Plus

Notes
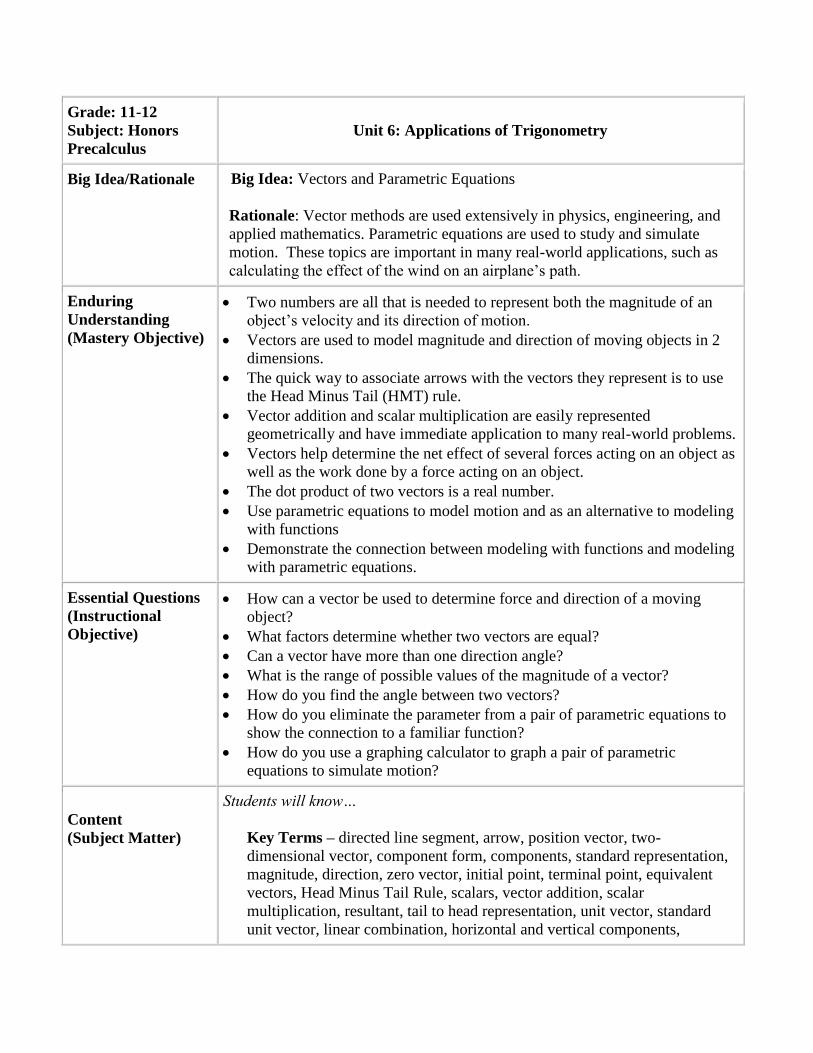
Grade: 11-12
Subject: Honors
Precalculus
Unit 6: Applications of Trigonometry
Big Idea/Rationale
Big Idea: Vectors and Parametric Equations
Rationale: Vector methods are used extensively in physics, engineering, and
applied mathematics. Parametric equations are used to study and simulate
motion. These topics are important in many real-world applications, such as
calculating the effect of the wind on an airplane’s path.
Enduring
Understanding
(Mastery Objective)
Two numbers are all that is needed to represent both the magnitude of an
object’s velocity and its direction of motion.
Vectors are used to model magnitude and direction of moving objects in 2
dimensions.
The quick way to associate arrows with the vectors they represent is to use
the Head Minus Tail (HMT) rule.
Vector addition and scalar multiplication are easily represented
geometrically and have immediate application to many real-world problems.
Vectors help determine the net effect of several forces acting on an object as
well as the work done by a force acting on an object.
The dot product of two vectors is a real number.
Use parametric equations to model motion and as an alternative to modeling
with functions
Demonstrate the connection between modeling with functions and modeling
with parametric equations.
Essential Questions
(Instructional
Objective)
How can a vector be used to determine force and direction of a moving
object?
What factors determine whether two vectors are equal?
Can a vector have more than one direction angle?
What is the range of possible values of the magnitude of a vector?
How do you find the angle between two vectors?
How do you eliminate the parameter from a pair of parametric equations to
show the connection to a familiar function?
How do you use a graphing calculator to graph a pair of parametric
equations to simulate motion?
Content
(Subject Matter)
Students will know…
Key Terms – directed line segment, arrow, position vector, two-
dimensional vector, component form, components, standard representation,
magnitude, direction, zero vector, initial point, terminal point, equivalent
vectors, Head Minus Tail Rule, scalars, vector addition, scalar
multiplication, resultant, tail to head representation, unit vector, standard
unit vector, linear combination, horizontal and vertical components,
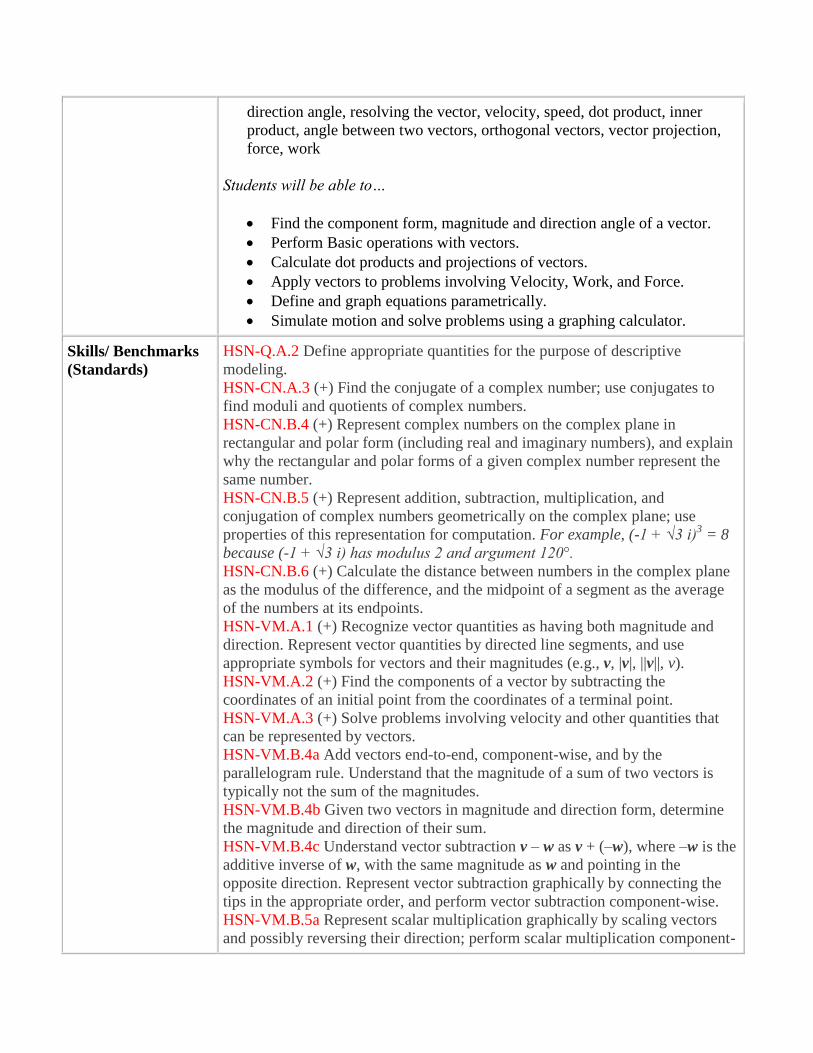
direction angle, resolving the vector, velocity, speed, dot product, inner
product, angle between two vectors, orthogonal vectors, vector projection,
force, work
Students will be able to…
Find the component form, magnitude and direction angle of a vector.
Perform Basic operations with vectors.
Calculate dot products and projections of vectors.
Apply vectors to problems involving Velocity, Work, and Force.
Define and graph equations parametrically.
Simulate motion and solve problems using a graphing calculator.
Skills/ Benchmarks
(Standards)
HSN-Q.A.2 Define appropriate quantities for the purpose of descriptive
modeling.
HSN-CN.A.3 (+) Find the conjugate of a complex number; use conjugates to
find moduli and quotients of complex numbers.
HSN-CN.B.4 (+) Represent complex numbers on the complex plane in
rectangular and polar form (including real and imaginary numbers), and explain
why the rectangular and polar forms of a given complex number represent the
same number.
HSN-CN.B.5 (+) Represent addition, subtraction, multiplication, and
conjugation of complex numbers geometrically on the complex plane; use
properties of this representation for computation. For example, (-1 + √3 i)3 = 8
because (-1 + √3 i) has modulus 2 and argument 120°.
HSN-CN.B.6 (+) Calculate the distance between numbers in the complex plane
as the modulus of the difference, and the midpoint of a segment as the average
of the numbers at its endpoints.
HSN-VM.A.1 (+) Recognize vector quantities as having both magnitude and
direction. Represent vector quantities by directed line segments, and use
appropriate symbols for vectors and their magnitudes (e.g., v, |v|, ||v||, v).
HSN-VM.A.2 (+) Find the components of a vector by subtracting the
coordinates of an initial point from the coordinates of a terminal point.
HSN-VM.A.3 (+) Solve problems involving velocity and other quantities that
can be represented by vectors.
HSN-VM.B.4a Add vectors end-to-end, component-wise, and by the
parallelogram rule. Understand that the magnitude of a sum of two vectors is
typically not the sum of the magnitudes.
HSN-VM.B.4b Given two vectors in magnitude and direction form, determine
the magnitude and direction of their sum.
HSN-VM.B.4c Understand vector subtraction v – w as v + (–w), where –w is the
additive inverse of w, with the same magnitude as w and pointing in the
opposite direction. Represent vector subtraction graphically by connecting the
tips in the appropriate order, and perform vector subtraction component-wise.
HSN-VM.B.5a Represent scalar multiplication graphically by scaling vectors
and possibly reversing their direction; perform scalar multiplication component-
wise, e.g., as c(vx, vy) = (cvx, cvy).
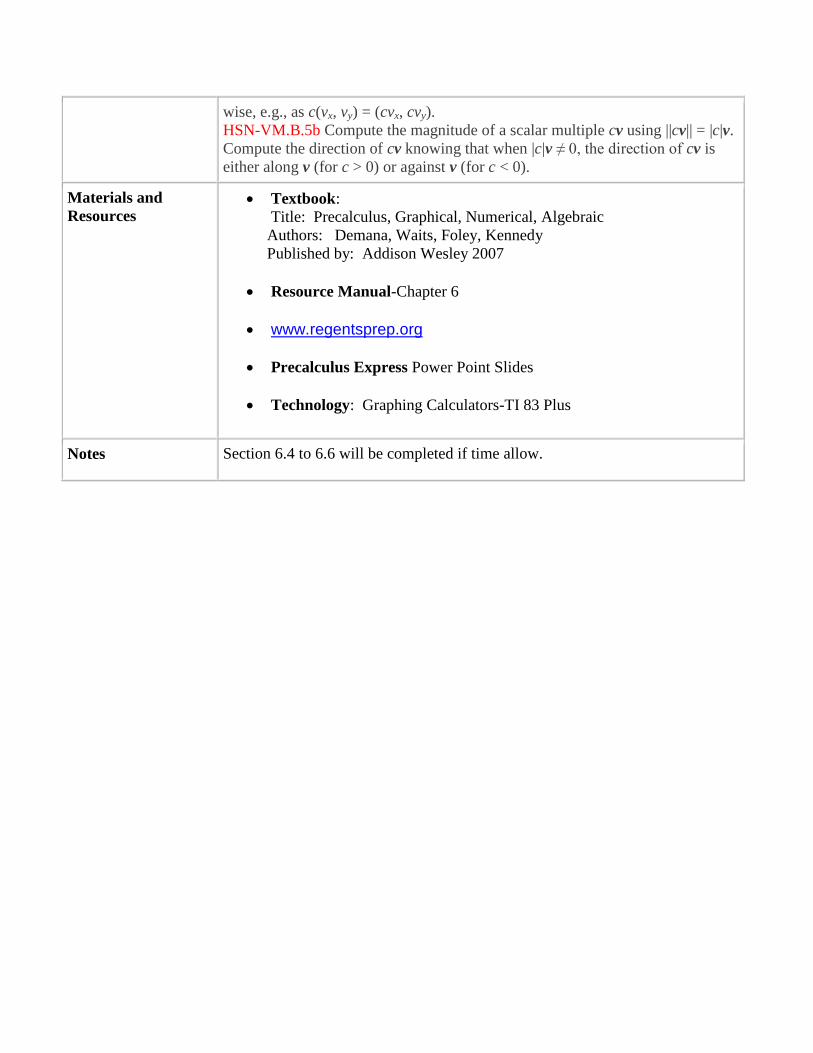
HSN-VM.B.5b Compute the magnitude of a scalar multiple cv using ||cv|| = |c|v.
Compute the direction of cv knowing that when |c|v ≠ 0, the direction of cv is
either along v (for c > 0) or against v (for c < 0).
Materials and
Resources Textbook:
Title: Precalculus, Graphical, Numerical, Algebraic
Authors: Demana, Waits, Foley, Kennedy
Published by: Addison Wesley 2007
Resource Manual-Chapter 6
www.regentsprep.org
Precalculus Express Power Point Slides
Technology: Graphing Calculators-TI 83 Plus
Notes Section 6.4 to 6.6 will be completed if time allow.
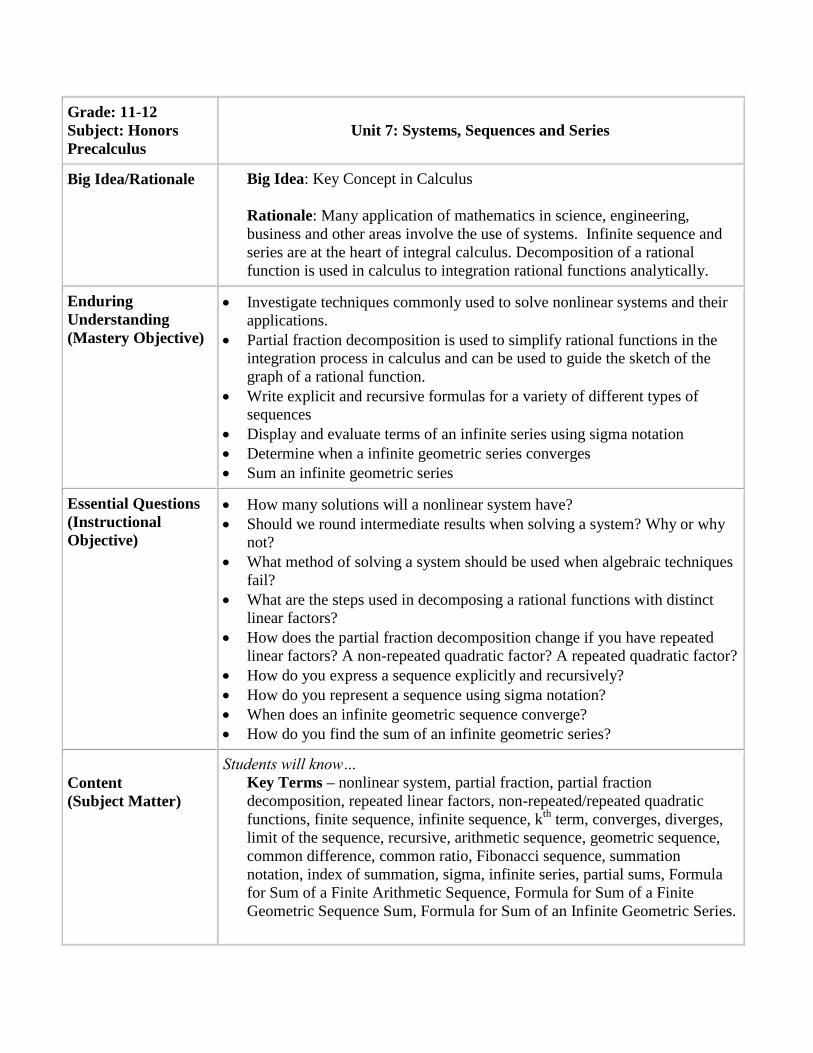
Grade: 11-12
Subject: Honors
Precalculus
Unit 7: Systems, Sequences and Series
Big Idea/Rationale
Big Idea: Key Concept in Calculus
Rationale: Many application of mathematics in science, engineering,
business and other areas involve the use of systems. Infinite sequence and
series are at the heart of integral calculus. Decomposition of a rational
function is used in calculus to integration rational functions analytically.
Enduring
Understanding
(Mastery Objective)
Investigate techniques commonly used to solve nonlinear systems and their
applications.
Partial fraction decomposition is used to simplify rational functions in the
integration process in calculus and can be used to guide the sketch of the
graph of a rational function.
Write explicit and recursive formulas for a variety of different types of
sequences
Display and evaluate terms of an infinite series using sigma notation
Determine when a infinite geometric series converges
Sum an infinite geometric series
Essential Questions
(Instructional
Objective)
How many solutions will a nonlinear system have?
Should we round intermediate results when solving a system? Why or why
not?
What method of solving a system should be used when algebraic techniques
fail?
What are the steps used in decomposing a rational functions with distinct
linear factors?
How does the partial fraction decomposition change if you have repeated
linear factors? A non-repeated quadratic factor? A repeated quadratic factor?
How do you express a sequence explicitly and recursively?
How do you represent a sequence using sigma notation?
When does an infinite geometric sequence converge?
How do you find the sum of an infinite geometric series?
Content
(Subject Matter)
Students will know…
Key Terms – nonlinear system, partial fraction, partial fraction
decomposition, repeated linear factors, non-repeated/repeated quadratic
functions, finite sequence, infinite sequence, kth
term, converges, diverges,
limit of the sequence, recursive, arithmetic sequence, geometric sequence,
common difference, common ratio, Fibonacci sequence, summation
notation, index of summation, sigma, infinite series, partial sums, Formula
for Sum of a Finite Arithmetic Sequence, Formula for Sum of a Finite
Geometric Sequence Sum, Formula for Sum of an Infinite Geometric Series.
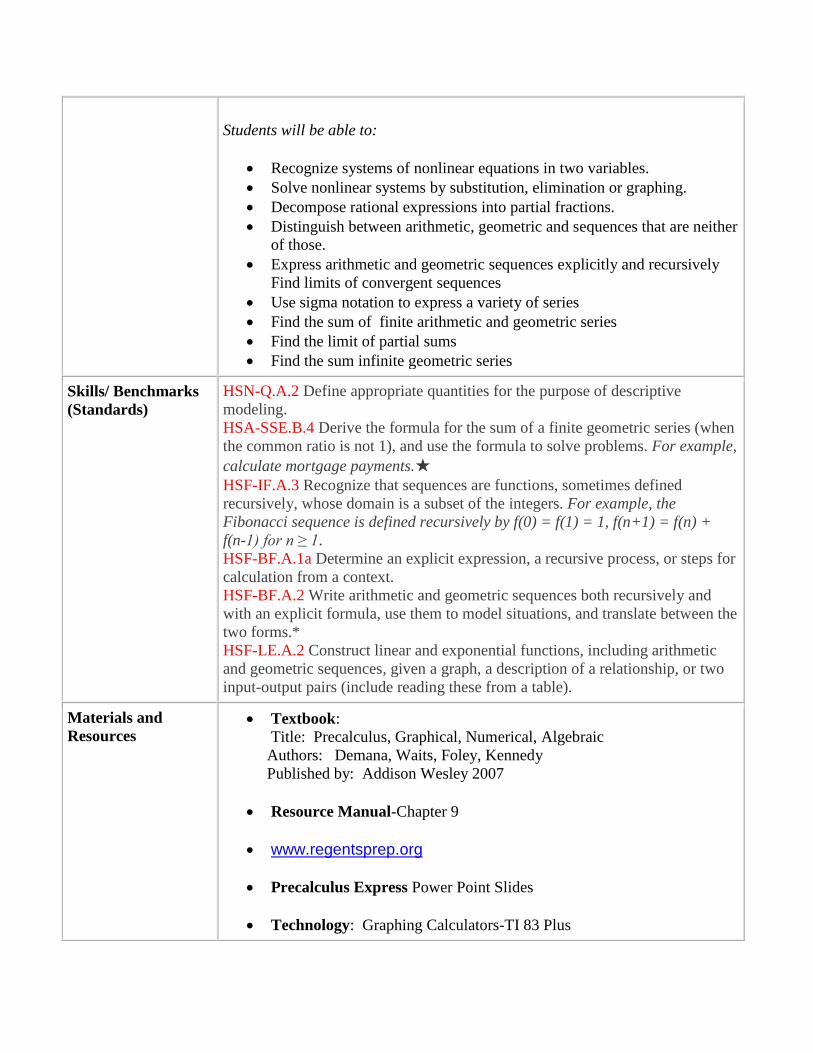
Students will be able to:
Recognize systems of nonlinear equations in two variables.
Solve nonlinear systems by substitution, elimination or graphing.
Decompose rational expressions into partial fractions.
Distinguish between arithmetic, geometric and sequences that are neither
of those.
Express arithmetic and geometric sequences explicitly and recursively
Find limits of convergent sequences
Use sigma notation to express a variety of series
Find the sum of finite arithmetic and geometric series
Find the limit of partial sums
Find the sum infinite geometric series
Skills/ Benchmarks
(Standards)
HSN-Q.A.2 Define appropriate quantities for the purpose of descriptive
modeling.
HSA-SSE.B.4 Derive the formula for the sum of a finite geometric series (when
the common ratio is not 1), and use the formula to solve problems. For example,
calculate mortgage payments.★
HSF-IF.A.3 Recognize that sequences are functions, sometimes defined
recursively, whose domain is a subset of the integers. For example, the
Fibonacci sequence is defined recursively by f(0) = f(1) = 1, f(n+1) = f(n) +
f(n-1) for n ≥ 1.
HSF-BF.A.1a Determine an explicit expression, a recursive process, or steps for
calculation from a context.
HSF-BF.A.2 Write arithmetic and geometric sequences both recursively and
with an explicit formula, use them to model situations, and translate between the
two forms.*
HSF-LE.A.2 Construct linear and exponential functions, including arithmetic
and geometric sequences, given a graph, a description of a relationship, or two
input-output pairs (include reading these from a table).
Materials and
Resources Textbook:
Title: Precalculus, Graphical, Numerical, Algebraic
Authors: Demana, Waits, Foley, Kennedy
Published by: Addison Wesley 2007
Resource Manual-Chapter 9
www.regentsprep.org
Precalculus Express Power Point Slides
Technology: Graphing Calculators-TI 83 Plus

Notes
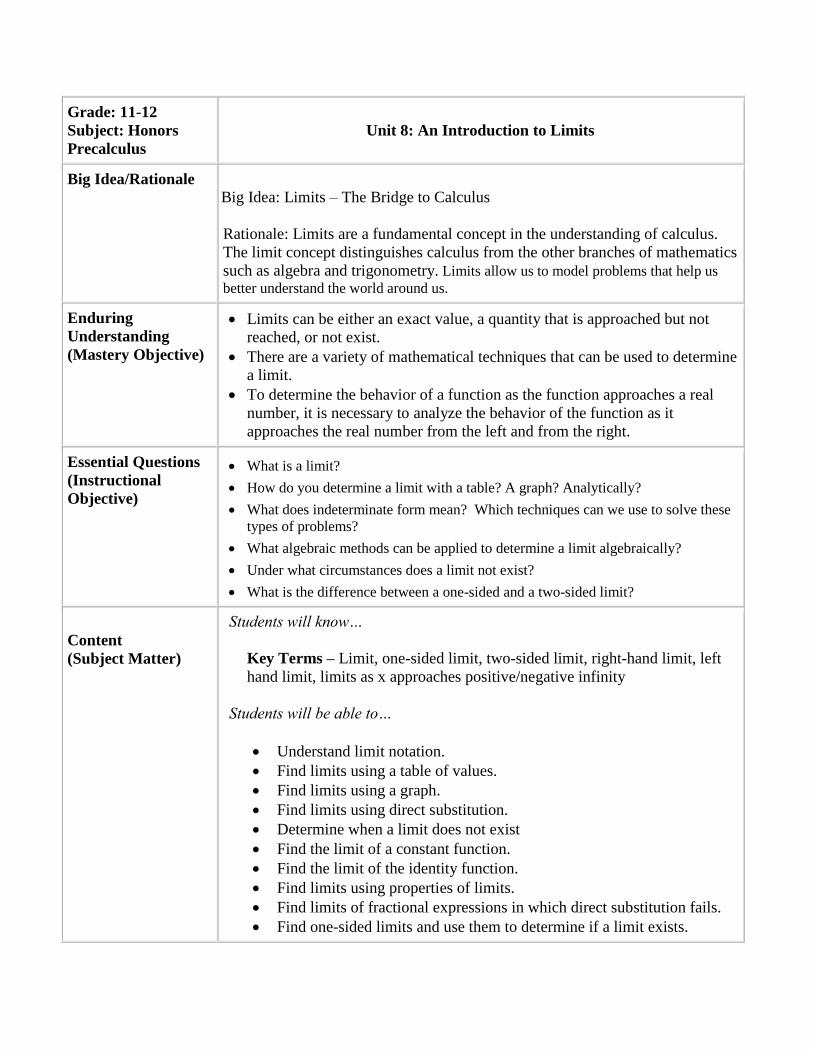
Grade: 11-12
Subject: Honors
Precalculus
Unit 8: An Introduction to Limits
Big Idea/Rationale
Big Idea: Limits – The Bridge to Calculus
Rationale: Limits are a fundamental concept in the understanding of calculus.
The limit concept distinguishes calculus from the other branches of mathematics
such as algebra and trigonometry. Limits allow us to model problems that help us
better understand the world around us.
Enduring
Understanding
(Mastery Objective)
Limits can be either an exact value, a quantity that is approached but not
reached, or not exist.
There are a variety of mathematical techniques that can be used to determine
a limit.
To determine the behavior of a function as the function approaches a real
number, it is necessary to analyze the behavior of the function as it
approaches the real number from the left and from the right.
Essential Questions
(Instructional
Objective)
What is a limit?
How do you determine a limit with a table? A graph? Analytically?
What does indeterminate form mean? Which techniques can we use to solve these
types of problems?
What algebraic methods can be applied to determine a limit algebraically?
Under what circumstances does a limit not exist?
What is the difference between a one-sided and a two-sided limit?
Content
(Subject Matter)
Students will know…
Key Terms – Limit, one-sided limit, two-sided limit, right-hand limit, left
hand limit, limits as x approaches positive/negative infinity
Students will be able to…
Understand limit notation.
Find limits using a table of values.
Find limits using a graph.
Find limits using direct substitution.
Determine when a limit does not exist
Find the limit of a constant function.
Find the limit of the identity function.
Find limits using properties of limits.
Find limits of fractional expressions in which direct substitution fails.
Find one-sided limits and use them to determine if a limit exists.
Find limits at infinity
Skills/ Benchmarks
(Standards)
The concept of “limits” goes beyond the scope of the Common Core State
Standards. However, the skills learned in this unit are necessary for a study of
Calculus so this unit is included in this course.
Materials and
Resources
Textbooks:
Title: Graphical Approach to Precalculus with Limits, 3rd
edition
Authors: Hornsby, Lial, Rockwold
Published by: Addison Wesley
Title: Precalculus
Author: Blitzer
Published by: Prentice Hall 2004
Title: Precalculus, Graphical, Numerical, Algebraic
Authors: Demana, Waits, Foley, Kennedy
Published by: Addison Wesley 2007
Technology: Graphing Calculators-TI 83/84 Plus
Notes