Embed Size (px)
Citation preview

Motion Sensor
CHAPTER 1
ACTIVITY 1: Measuring Speed
LEARNING TARGET: You will analyze and interpret speed-vs.-time graphs using motion sensors.
PURPOSE:Take a moment to think about all of the ways things move. Think about how fast you’ll need to walk in order to get to school on time. Or think about how hard you’ll need to kick a soccer ball across a field.
In the first few chapters of this course you will be exploring how objects move and collide with other objects. To collect information about motion, you will be measuring speed using a Motion Sensor. In this activity, you will learn to use the motion sensor and the data collection device that works with it.
How can you represent the motion of an object speeding up, slowing down, and moving at a constant speed?
INITIAL IDEAS:Imagine taking a short trip in your car. When you first start, you push on the gas pedal and the car starts moving and then picks up speed. Once you reach the speed limit, you drive at a constant speed for a while. Then, you come up to a stop sign and you use the brakes to slow the car down and make it stop.
Complete the following question individually in your lab notebook:
1. Draw two different ways of showing the motion of the car during its drive. Label when the car was: speeding up, moving at a constant speed, and slowing down.
Share your ideas with your group members.
On a presentation board, record your group’s thoughts about the Initial Ideas.
© 2014 PET-hs Page 1
1.1: Measuring Speed
READING: TOOLS OF THE TRADE
The LabQuest2
The LabQuest2 is able to show motion data using graphs and tables. It is capable of graphing position, velocity, and acceleration. In this course we will begin by learning about speed. For this activity, we will use velocity and speed to mean the same thing.
General Settings:
Plug the motion sensor into the LabQuest2
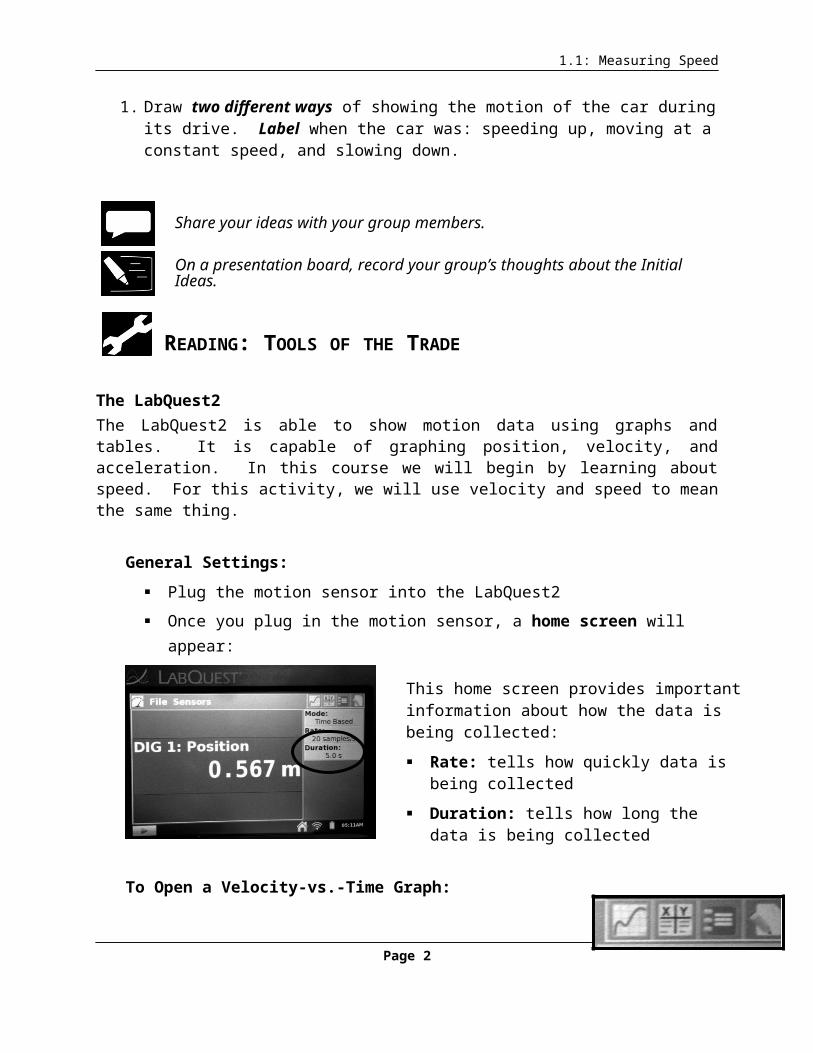
Once you plug in the motion sensor, a home screen will appear:
To Open a Velocity-vs.-Time Graph:
1. From the opening screen, click the logger pro icon that is on the upper right corner of the display.
2. Two graphs appear: position-vs.-time and velocity-vs.-time.
3. For the first several labs, we will only be analyzing a velocity-vs.-time graph, so we will need to remove the position-vs.-time graph.
4. Remove the position-vs.-time graph by selecting the Graph tab and then selecting Show Graph.
5. Select Graph 2.
Page 2
This home screen provides important information about how the data is being collected:
Rate: tells how quickly data is being collected
Duration: tells how long the data is being collected
To change the rate or duration, from the home screen, use the sensors tab to make changes.

1.1: Measuring Speed
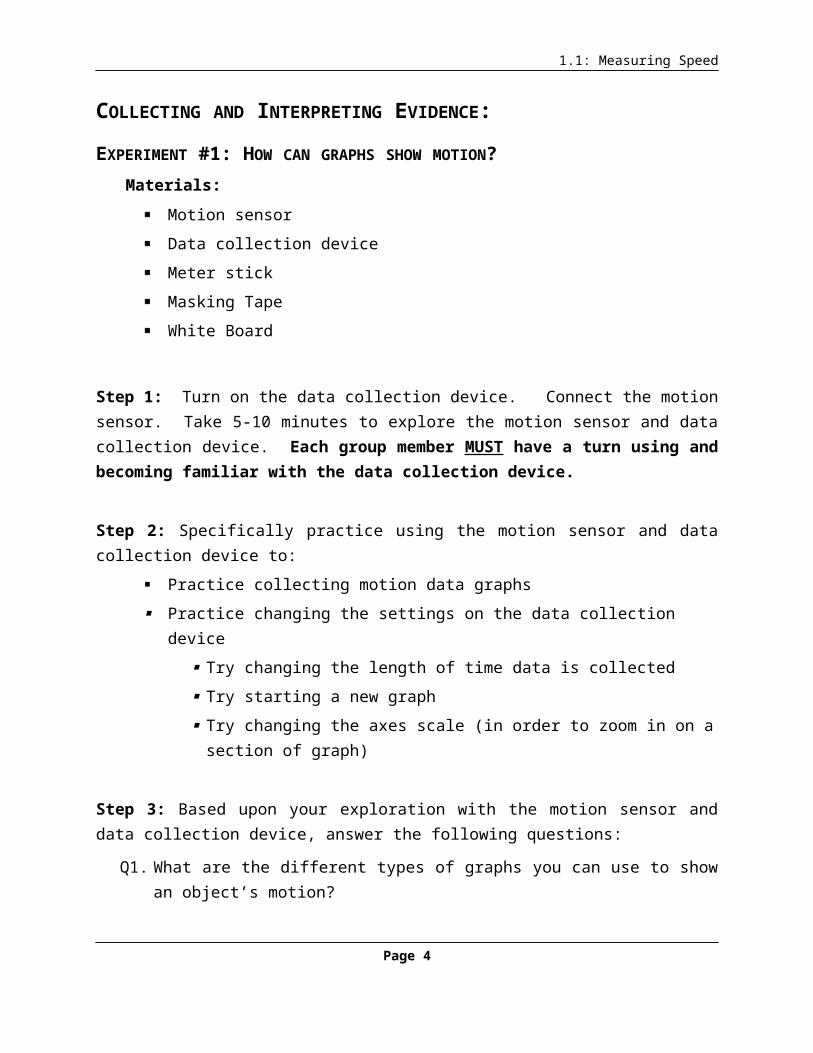
COLLECTING AND INTERPRETING EVIDENCE:
EXPERIMENT #1: HOW CAN GRAPHS SHOW MOTION?
Materials:
Motion sensor
Data collection device
Meter stick
Masking Tape
White Board
Step 1: Turn on the data collection device. Connect the motion sensor. Take 5-10 minutes to explore the motion sensor and data collection device. Each group member MUST have a turn using and becoming familiar with the data collection device.
Step 2: Specifically practice using the motion sensor and data collection device to:
Practice collecting motion data graphs
Practice changing the settings on the data collection device
Try changing the length of time data is collected
Try starting a new graph
Try changing the axes scale (in order to zoom in on a section of graph)
Step 3: Based upon your exploration with the motion sensor and data collection device, answer the following questions:
Q1. What are the different types of graphs you can use to show an object’s motion?
Q2. What settings were you able to change on the data collection device? What is the purpose of changing each setting?
In this lab, you will collect data about a person’s speed. We can use a velocity-vs.-time graph to collect this data. For now, we will ignore the negative values on the graph by always walking away from the motion sensor. In the next lab, you will learn about the differences between speed and velocity and what negative values mean.
Page 3
1.1: Measuring Speed
Step 4: Using the data collection device, open a blank velocity-vs.-time graph. Check that the Duration (amount of time data is collected) is set to 5 seconds.
Step 5: Place the motion sensor on a stable surface and make sure there is a clear path across the floor for 3 meters. Using the meter stick, place masking tape on the floor at 1, 2, and 3 meters away from the motion sensor. Set the motion sensor to collect “long range” (person) data (if your sensor has this option).
Step 6: Have one member of your group stand 1 meter from the motion sensor using a white board in front of them. Begin collecting data by pressing PLAY on your data collection device. The person should:
Stand still for 2 seconds
Walk away from the sensor to the
3 meter mark in 1 second
Stand still again for 2 seconds
Q3. Claim: What do you think happened to the person’s speed when he/she walked away from the sensor?
Q4. Evidence: Draw a graph of your data (on a graph like the one shown on the right).
Q5. Reasoning: Explain how the graph supports your claim in Q3.
Page 4
3 meters 2 meters 1 meter

1.1: Measuring Speed
Step 7: Below are six velocity-vs.-time graphs. Try to recreate the graphs by moving in front of the motion sensor and collecting velocity-time graphs with the data collection device.
a. b.
c. d.
e. f.
Step 8: Draw each graph in your lab notebook and describe what you did to recreate the graph. Describe how fast you were moving, whether your speed was changing, and whether you were moving toward or away from the motion detector.
Step 9: Talk with your group members about what you have learned about graphing speed.
Q6. In 2-3 sentences, summarize how to graph speed-vs.-time. Write your explanation like you are trying to teach someone who hasn’t done it before.
Q7. How has your thinking about graphing speed and time changed in this lab?
Page 5

1.1: Measuring Speed
COLLECTING AND INTERPRETING EVIDENCE:
EXPERIMENT #2: HOW GRAPHS SHOW SPEEDING UP, SLOWING DOWN, AND CONSTANT SPEED OF AN OBJECT?
Materials:
Motion sensor
Data collection device
Cart
Track
Step 1: In the previous experiment, you walked in front of the motion sensor to show your speed on a velocity-vs.-time graph. In this experiment, your goal is to graph the speed of a cart moving on a track.
Q1. Draw a blank velocity-vs.-time graph (like the one on the right). Predict what the graph will look like for the cart speeding up, moving at a constant speed, and then slowing down.
Step 2: Using the motion sensor, test your prediction from the previous question.
When using the motion sensor for the cart, it needs to be on the “short range” (cart) setting.
Be sure to do your tests with the cart moving away from the motion sensor.
Q2. Using a colored pencil, on the same axes as the previous question, draw the graph you observed with the data collection device. Label the two graphs as “prediction” and “observation.”
Q3. Compare your “prediction” and “observation” graphs. Describe any differences between the two and give possible reasons for the differences.
Page 6

1.1: Measuring Speed
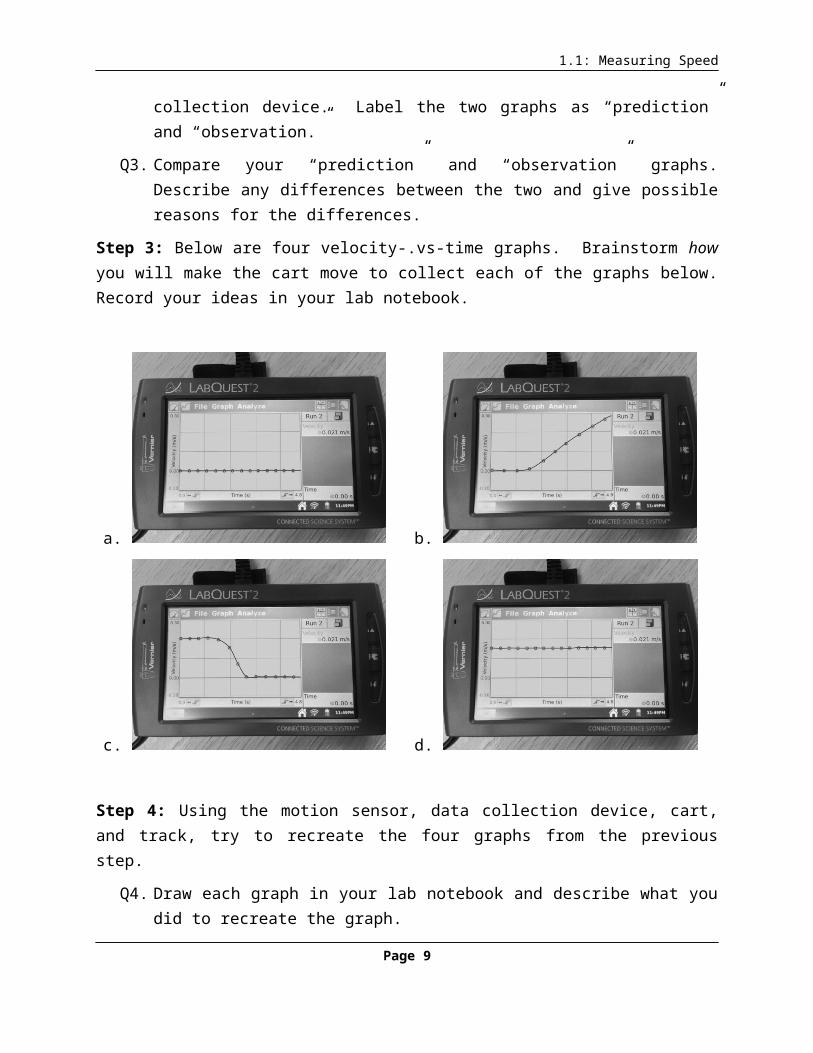
Step 3: Below are four velocity-.vs-time graphs. Brainstorm how you will make the cart move to collect each of the graphs below. Record your ideas in your lab notebook.
a. b.
c. d.
Step 4: Using the motion sensor, data collection device, cart, and track, try to recreate the four graphs from the previous step.
Q4. Draw each graph in your lab notebook and describe what you did to recreate the graph.
Q5. Think back to the previous experiment when you collected velocity-vs.-time graphs of a person moving in front of a motion sensor. What method do you prefer for producing motion graphs: having people move in front of the sensor, or using the cart moving along the track? Describe why.
Page 7

1.1: Measuring Speed
SUMMARIZING QUESTIONS Name: _______________________________
How can you represent the motion of an object speeding up, slowing down, and moving at a constant speed?
LEARNING TARGET: You will analyze and interpret speed-time graphs using motion sensors.
1. A car was stopped at a stoplight for 30 seconds, the car quickly sped up to the speed limit (35 miles per hour). It then traveled for 20 seconds at 35 miles per hour and then came up to a school zone. The car slowed its speed to 20 miles per hour for 20 seconds while traveling in the school zone. Draw this car’s journey:
2. On the right is a speed-vs.-time graph for one minute (60 s) of a student’s walk to school.
Note: 5 meters per second is approximately 10 miles per hour (a jogging pace).
a. On the graph, circle and label when the student is traveling at the greatest speed and when the student is stopped.
b. Describe the student’s motion.
Page 8
1.1: Measuring Speed
3. The graph on the right shows a cart that was already in motion at a constant speed and then was pushed (by a hand) to slow it down to a stop. How long (for what amount of time, in seconds) did the cart take to slow down to a stop? How do you know (from the graph)?
4. On the axes on the right, use two different colors to draw two velocity time graphs:
a. One for an object that is stopped, speeds up, moves at a constant speed, and then slows down. Label each part of the graph.
b. The second for an object that is already moving when data collection starts, then it speeds up, and then it travels at a constant speed.
5. A group of students collected the graph data shown on the right. Describe how you think the students collected the data (walking or with a cart) and what the graph shows about the object’s motion.
Page 9

Stopped Constant SpeedSpeedingUp
StoppedSlowingDown
ConstantSpeed
1.1: Measuring Speed
1.1 SCIENTIST IDEAS READING
Instructions: Read the Scientist Ideas, paying careful attention to each key idea. When you read, try to think about how the key ideas relate to the evidence you collected in the activity.
Graphs Tell a Story Idea: Graphs are used in science as a way of visually showing (or representing) data. A graph can tell a story about the motion of an object.
As you saw in this activity, graphs can be used to describe the story of an object’s motion. You used velocity-vs.-time graphs to show the speed of a car, a person, and a cart.
Parts of a Graph Idea: Graphs have two axes: the X-axis and the Y-axis. Graphs need to include a title and labels with units for each axis.
You may have heard of graph axes in your math class. The axes are two lines: the horizontal axis (side-to-side) and the vertical axis (up-and-down). Axes is plural word for axis, meaning that when talking about both the X-axis and Y-axis, scientists say axes.
All graphs need to include a title and labels for the X- and Y-axes (including units). The graphs you made in this activity represented “speed” on the Y-axis and “time” on the X-axis. Usually when graphing a variable and time, time will be on the X-axis of the graph.
Speed-vs.-Time Graph Idea: In speed-vs.-time graphs, the X-axis represents time and the Y-axis represents speed. Speed-vs.-time graphs show when an object is stopped, speeding up, slowing down, or moving at a constant speed.
Velocity-vs.-Time Graph Velocity-vs.-Time Graph
Page 10

1.1: Measuring Speed
Type of Graphs Idea: Different stories require different types of graphs. Two common graphs are the bar graph and the line graph.
There are many different types of graphs. Scientists carefully select the type of graph they use based upon the data they are trying to present. For example, bar graphs are useful when comparing data for different groups. When representing data over time, scientists often use a line graph. This is why line graphs are used to represent how the speed changes over time. Examples of each of these graphs are shown on the right.
Respond to the following questions individually in your lab notebook:
1. Describe how graphs are used to tell a story of an object’s motion.2. When making a graph, what must always be present on the graph (no matter
whether the graph is a line graph or a bar graph)?3. What type of graph did we use in this activity to show speed and time? Why?4. Describe why a scientist might decide to present temperature data with a bar graph. 5. Describe the speed of the object from each of the graphs below. (Include when the
object is moving at a constant speed, speeding up, slowing down or stopped.Velocity-vs.-Time Graph Velocity-vs.-Time Graph
a. b.
Velocity-vs.-Time Graph Velocity-vs.-Time Graph
c. d.
Page 11
Bar Graph Line Graph