Embed Size (px)
Citation preview
Uniqueness of Bacterial RibosomesAuthor(s): Marion M. Taylor and R. StorckSource: Proceedings of the National Academy of Sciences of the United States of America,Vol. 52, No. 4 (Oct. 15, 1964), pp. 958-965Published by: National Academy of SciencesStable URL: http://www.jstor.org/stable/72392 .
Accessed: 07/05/2014 14:21
Your use of the JSTOR archive indicates your acceptance of the Terms & Conditions of Use, available at .http://www.jstor.org/page/info/about/policies/terms.jsp
.JSTOR is a not-for-profit service that helps scholars, researchers, and students discover, use, and build upon a wide range ofcontent in a trusted digital archive. We use information technology and tools to increase productivity and facilitate new formsof scholarship. For more information about JSTOR, please contact [email protected].
.
National Academy of Sciences is collaborating with JSTOR to digitize, preserve and extend access toProceedings of the National Academy of Sciences of the United States of America.
http://www.jstor.org
This content downloaded from 169.229.32.136 on Wed, 7 May 2014 14:21:17 PMAll use subject to JSTOR Terms and Conditions
958 MICROBIOLOGY: TAYYLOR AND STORCK PROC. N. A. S.
24 Boyse, E. A., L. J. Old, G. Geering, and E. Stockert, unpublished observations. 25 Cells from 4 cases of human leukemia (acute leukemia in a child, acute myeloid leukemia,
chronic myeloid leukemia, and chronic lymphatic leukemia) were obtained through the courtesy of Dr. B. Clarkson, Dr. L. Murphy, and Dr. C. Tan of Sloan-Kettering Institute. These cells did not acquire sensitivity to Rauscher antiserum after exposure to the plasma of BALB/c mice infected with Rauscher virus.
UNIQUENESS OF BACTERIAL RIBOSOMES*
BY iVIARION MVI. TAYLOR AND R. STORCK
DEPAPRTMENT OF MICROBIOLOGY, THE UNIVERSITY OF TEXAS, AUSTIN
Communicated by Wilson S. Stone, August 3, 1964
Ribosomes can be identified during the ultracentrifugation of cell extracts with boundaries having sedimentation coefficients from 20 to 100 Svedberg units (S). The 70-80S class, which is required for protein synthesis, predominates at Mg\1++ concentrations between 0.01 Mll and 0.001 M.
lMFany S determinations have been made on this class of ribonucleoprotein parti- cles from several species of microorganisms, plants, and animals. The reported values do not always agree, even for the same species, often because the physico- chemical conditions differed. Since sedimentation velocities vary with concentra- tion, viscosity, and temperature, corrections must be applied in order to obtain values which can be compared. Although only a few such values are available, it is generally assumed that bacterial ribosomes belong to the 70S class whereas all others belong to the 80S class.
In the present work the corrected S values of ribosomes from 25 species of bac- teria and 26 of fungi have been determined. Statistical evidence for the existence of two distinct classes has been obtained. It is suggested that the uniqueness of the sedimentation coefficient of the ribosomes from bacteria should be used to define this group of organisms.
Materials and M-ethods.-Selection of organisms: MVJycelial and yeast forms belonging to the following classes were analyzed: Zygomycetes, Ascomycetes, Deuteromycetes, and Phycomycetes. Bacteria were selected so as to cover a range of 34-80% guanine plus cytosine (GC) content of their DNA. Within each group, the organisms were chosen on the basis of their availability in pure form, their ability to grow rapidly in a liquid medium, and their nonpathogenicity. All organisms were grown under physicochemical conditions eliciting a maximum rate of growth and harvested during the growth phase.
Preparation of extracts: Cells and filaments were washed with and resuspended in Tris buffer (10-2 M), pH 7.4, containing 10 ,umoles per ml of MgCl2 (Tris-Mg). All yeasts and a few molds were disrupted with glass beads in a Nossal disintegrator. Most molds were ground with washed, 50-mesh sea sand and bacteria with levigated alumina. The pH was readjusted to 7.4, and beads, sand, or alumina were removed by centrifugation. The extract was clarified by two centrifuga- tions at 25,000 X g and 4?C, and the supernatant was used for ultracentrifugal analysis.
For blue-green algae, it was necessary to eliminate the pigments from this supernatant. It was therefore centrifuged through a 3-20% linear gradient of sucrose in Tris-Mg, at 25,000 rpm for 255 min in the SW25 rotor of the Spinco model L preparative ultracentrifuge. One-ml frac- tions were collected after piercing the bottom of the tube. The optical density at 260 m/t (OD260) of each fraction was measured, and those fractions corresponding to the ribosomal peak were pooled and washed by two centrifugations at 40,000 rpm for 120 min. The ribosomal pellets were resuspended in Tris-Mg.
This content downloaded from 169.229.32.136 on Wed, 7 May 2014 14:21:17 PMAll use subject to JSTOR Terms and Conditions
VOL. 52, 1964 MICROBIOLOGY: TAYLOR AND STORCK 959
Purified ribosome suspensions from other microorganisms were obtained by the same method except that preliminary separation by sucrose density gradient centrifugation was omitted.
Determination of sedimentation coefficients: Extracts were used either immediately after prep- aration or after storage at -90?C for up to 1 week. In either case, the results of the S deter- minations were identical. Extracts were diluted with Tris-Mg in order to obtain a range of con- centrations from 3.0 to 0.5 m,g RNA/ml. The concentration was estimated by assuming that an OD260 of 1.0 is equal to 50 ,ug RNA/ml. The dilutions were centrifuged at 39,460 rpm and 20?C in the Spinco model E analytical ultracentrifuge equipped with schlieren optics. Pictures were taken at 4-min intervals after this speed had been attained. The distance from the bound- aries to the reference line was measured with a Nikon Shadowgraph Model 6C comparator. The S020,o value for four concentrations of each extract was obtained by the procedure described by Schachman.1
The viscosity of Tris-Mg at 20?C was determined with an Ostwald viscosimeter having an average flow time of 186.2 sec for distilled water at 20?C. A value of 0.65 was used for the partial specific volume of ribosomes,2 and a factor equal to 1.02075 was used to convert 800, Trim-g into S020,,o.
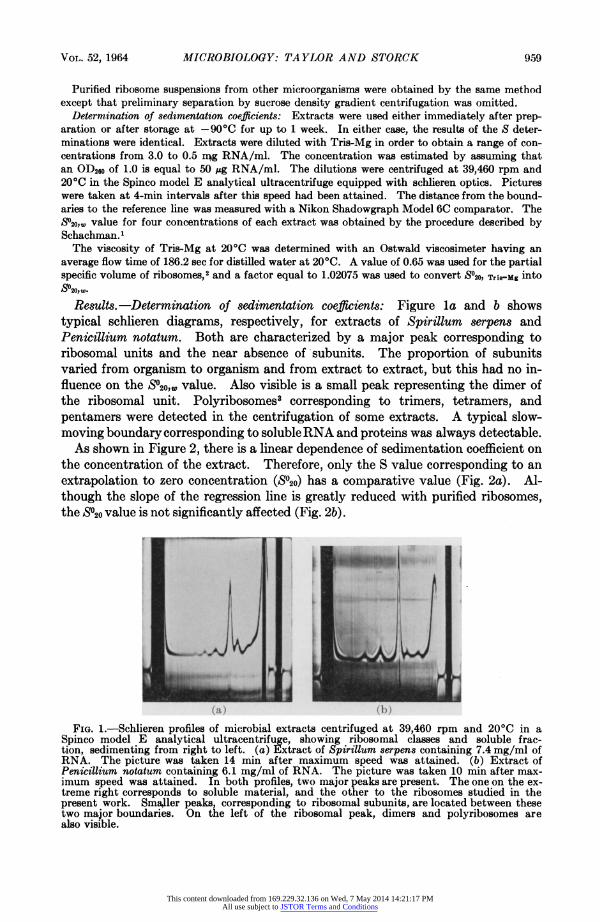
Results. -Determination of sedimentation coefficients: Figure la and b shows typical schlieren diagrams, respectively, for extracts of Spirillum serpens and Penicillium notatum. Both are characterized by a major peak corresponding to ribosomal units and the near absence of subunits. The proportion of subunits varied from organism to organism and from extract to extract, but this had no in- fluence on the S020,1, value. Also visible is a small peak representing the dimer of the ribosomal unit. Polyribosomes3 corresponding to trimers, tetramers, and pentamers were detected in the centrifugation of some extracts. A typical slow- moving boundary corresponding to soluble RNA and proteins was always detectable.
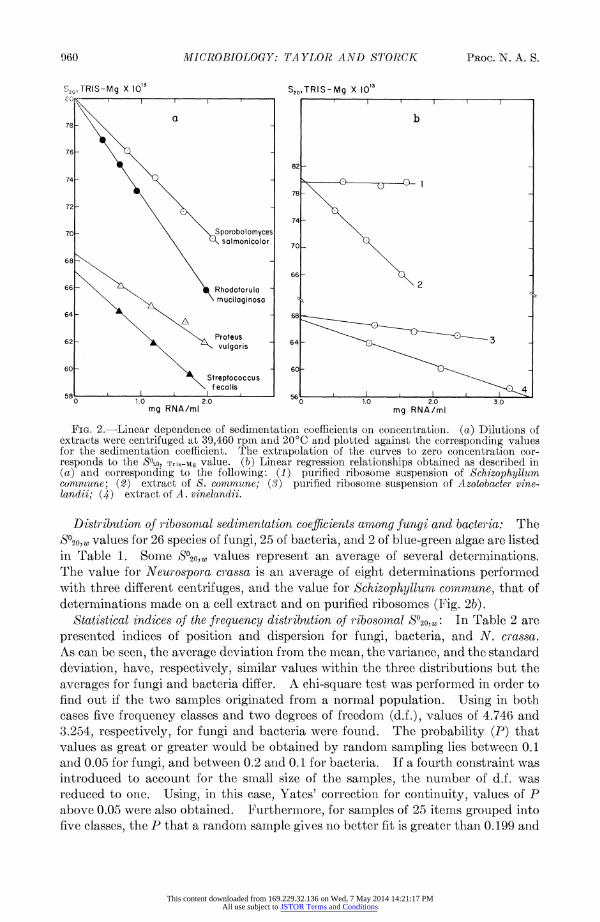
As shown in Figure 2, there is a linear dependence of sedimentation coefficient on the concentration of the extract. Therefore, only the S value corresponding to an extrapolation to zero concentration (820) has a comparative value (Fig. 2a). Al- though the slope of the regression line is greatly reduced with purified ribosomes, the S?20 value is not significantly affected (Fig. 2b).
y | .. I . | _ t.a,c I~~~~~~~~~~~~~~~~~~~~~~~~~~~~~~~~~~~~~~~~~~~~~~~~~~~~~~~~~~~~~~~~~~~~~~~~~~~~~~~~~~~~~~~~~~~~.. ....
v~~~~~~~~~~~~~~~~~~~~~~~~~~~~~~~~~~~~~~~~ .. .. ..X.._
...... ......... .. :.....
(a) (b)
FIG. 1.-Schlieren profiles of microbial extracts centrifuged at 39,460 rpm and 20?C in a Spinco model E analytical ultracentrifuge, showing ribosomal classes and soluble frac- tion, sedimenting from right to left. (a) Extract of Spirillum serpens containing 7.4 mg/ml of RNA. The picture was taken 14 min after maximum speed was attained. (b) Extract of Penicillium notatum containing 6.1 mg/ml of RNA. The picture was taken 10 min after max- imum speed was attained. In both profiles, two major peaks are present. The one on the ex- treme right corresponds to soluble material, and the other to the ribosomes studied in the present work. Sma,ller peaks, corresponding to ribosomal subunits, are located between these two major boundaries. On the left of the ribosomal peak, dimers and polyribosomes are also visible.
This content downloaded from 169.229.32.136 on Wed, 7 May 2014 14:21:17 PMAll use subject to JSTOR Terms and Conditions
960 MICROBIOLOGY: TAYLOR AND STORCK PROC. N. A. S.
520,TRIS-Mg X 1013 S20,TRIS-Mg X 103 CC) l I I I
66 - \ > Rhodotorula .b 76
76-
82-
74 -
1S -U te 78
72-
74-
70 Sporobolomyces solmonicoloru
68
66
66 Rhodotorula 2
muciloginoso 64 -68
62 - ~~~~~~~~Proteus 6
vulgoris__ _ _ _ _ _ _ _ _ _ _ _ _ _ _ _ _ _ _ _ _ 60 -60-
Streptococcus
50 1.0 2.0 50 1.0 2.0 3.0 mg RNA/ml mg RNA/ml
FIG. 2.-Linear dependence of sedimentation coefficients on concentration. (a) Dilutions of extracts were centrifuged at 39,460 rpm and 200C and plotted against the corresponding values for the sedimentation coefficient. The extrapolation of the curves to zero concentration cor- responds to the S020, Tris-Mg value. (b) Linear regression relationships obtained as described in (a) and corresponding to the following: (1) purified ribosome suspension of Schizophyllum commune; (2) extract of S. commune; (3) purified ribosome suspension of Azotobacter vine- landii; (4) extract of A. vinelandii.
Distribution of ribosomal sedimnentation coefficients among fungi and bacteria: The s%o20, values for 26 species of fungi, 25 of bacteria, and 2 of blue-green algae are listed in Table 1. Some S?20,W values represent an average of several determinations. The value for Neurospora crassa is an average of eight determinations performed with three different centrifuges, and the value for Schizophylluin conmmune, that of determinations made on a cell extract and on purified ribosomes (Fig. 2b).
Statistical indices of the frequency distribution of ribosomal S20,w: In Table 2 are presented indices of position and dispersion for fungi, bacteria, and N. crassa. As can be seen, the average deviation from the mean, the variance, and the standard deviation, have, respectively, similar values within the three distributions but the averages for fungi and bacteria differ. A chi-square test was performed in order to find out if the two samples originated from a norinal population. Using in both cases five frequency classes and two degrees of freedom (d.f.), values of 4.746 and 3.254, respectively, for fungi and bacteria were found. The probability (P) that values as great or greater would be obtained by random sampling lies between 0.1 and 0.05 for fungi, and betweel 0.2 and 0.1 for bacteria. If a fourth constraint was introduced to account for the small size of the samples, the number of d.f. was reduced to one. Using, in this case, Yates' correction for continuity, values of P above 0.05 were also obtained. Furthermnore, for samples of 25 items grouped into five classes, the P that a random sample gives no better fit is greater than 0.199 and
This content downloaded from 169.229.32.136 on Wed, 7 May 2014 14:21:17 PMAll use subject to JSTOR Terms and Conditions
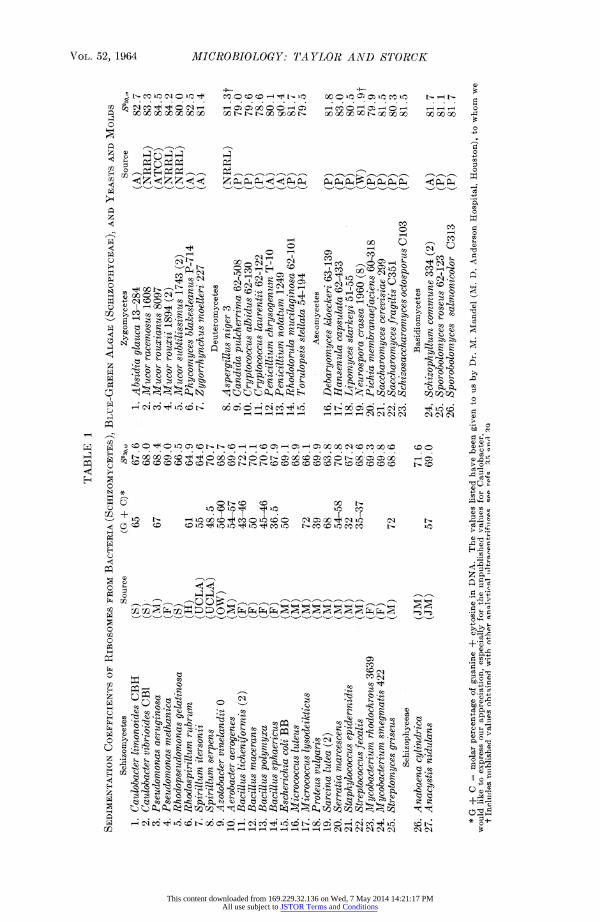
TABLE 1 7
SEDIMENTATION COEFFICIENTS OF RIBOSOMES FROM BACTERIA (SCHIZOMYCETES), BLUE-GREEN ALGAE (SCHIZOPHYCEAE), AND YEASTS AND MOLDS
Schizomycetes Source (G + C)* S020cw Zygomycetes Source 5?20t. 1. Caulobacter limonoides CBH (S) 65 67.6 1. Absidia glauca 13-284 (A) 82.7 A 2. Caulobacter vibrioides CB1 (S) 68.0 2. Mucor racemosus 1608 (NI{RL) 83.3 3. Pseudomonas aeruginosa (M) 67 68.4 3. Mucor rouxianus 8097 (ATCC) 84.5 4. Pseudomonas methanica (F) 69.0 4. Mucor rouxii 1894 (2) (NRRL) 84.2 5. Rhodopseudomonas gelatinosa (S) 66.5 5. Mucor subtilissimus 1743 (2) (NRRL) 80.0 6. Rhodospirillum rubrum (H) 61 64.9 6. Phycomyces blakesleanus P-714 (A) 82.5 7. Spirillunt itersonii (UCLA) 55 64.6 7. Zygorrhynchus moelleri 227 (A) 81.4 8. Spirillum serpens (UCLA) 48.5 70.7 9. Azotobacter vinelandii 0 (OW) 56-60 68.7 Deuteromycetes
10. Aerobacter aerogenes (M) 54-57 69.6 8. Aspergillus niger 3 (NRRL) 81. 3t o 11. Bacillus licheniformis (2) (F) 43-46 72. 1 9. Candida putlcherrima 62-508 (P) 79.0 t 12. Bacillus macerans (F) 50 70. 1 10. Cryptococcus albidus 62-130 (P) 79.6 13. Bacillus polymya a (F) 45-46 70.6 11. Cryptococcus laurentii 62-122 (P) 78.6 z 14. Bacillus sphaericus (F) 36.5 67.9 12. Penicillium chrysoenumT-10 (A) 80.1 .
15. Escherichia coli BB (M) 50 69. 1 14. Rhdtorla mucilagns 62-0 (P) 81 7 16. Micrococcus luteus (M) 68.9 14. Rhodotorula mucilaginosa62-101 (P) 81.57 17. Micrococcus lysodeikticus (M) 72 66.1 15. Torulops1sstellata54-194 (P) 79. a- 18. Proteus vulgaris (M) 39 69.9 Ascomycetes 19. Sarcina lutea (2) (M) 68 63.8 16. Debaryomyces kloeckeri 63-139 (P) 81.8 o 20. Serratia marcescens (M) 54-58 70.8 17. Hansenula capsulata 62-433 (P) 83.0 > 21. Staphylococcus epidermidis (M) 32 67.2 18. Lipomyces starkeyi 51-55 (P) 80.5 0 22. Streptococcus fecalis (M) 35-37 68.6 19. Neurospora crassa 1960 (8) (W) 81.9t + 23. Mycobacterium rhodochrous 3639 (F) 69.3 20. Pichia membranaefaciens 60-318 (P) 79.9 t 24. Mycobacterium smegmatis 422 (F) 69.8 21. Saccharomyces cerevisiae 299 (P) 81.5 z 25. Streptomyces griseus (M) 72 68.6 22. Saccharomyces fragilis C351 (P) 80.3 <
Schizophyceae 23. Schizosaccharomyces octosporus C103 (P) 81.5 26. Anabaena cylindrica (JM) 71.6 Basidiomycetes 27. Anacystis nidulans (JM) 57 69.0 24. Schizophyllum commune 334 (2) (A) 81.7
25. Sporobolomyces roseus 62-123 (P) 81.1 26. Sporobolomyces salmonicolor C313 (P) 81.7
* G + C = molar percentage of guanine + cytosine in DNA. The values listed have been given to us by Dr. M. Mandel (M. D. Anderson Hospital, Houston), to whom we would like to express our appreciation, especially for the unpublished values for Caulobacter.
t Ineliides nriblished valiues ohbtinpd with nther ann.lvtiren.1 qPR rpfs RA, 2nd -0
This content downloaded from 169.229.32.136 on Wed, 7 May 2014 14:21:17 PMAll use subject to JSTOR Terms and Conditions
962 MICROBIOLOGY: TA-YLOP? AND S'OIOCK PROC. N. A. S.
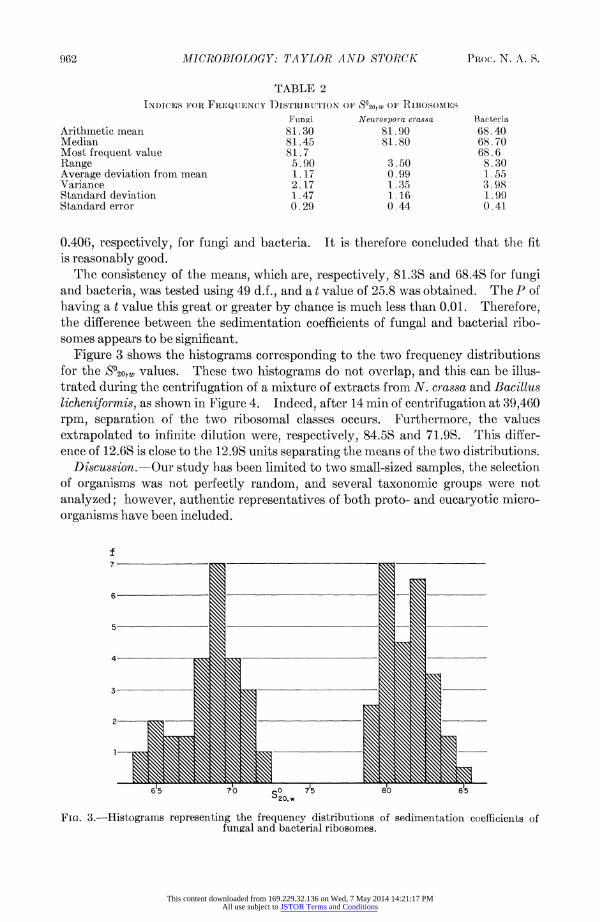
TABLE 2
INDICES FOR FREQUTENCY D)ISTRIBUTION OF SO20,w OF RLBOSOMES
Fungi Neurospora crassa Bacteria Arithmetic mean 81.30 81 .90 68.40 Median 81.45 81.80 68.70 Most frequent value 81.7 68.6 Range 5.90 3.50 8.30 Average deviation from mean 1. 17 0.99 1 .55 Variance 2.17 1.35 3.98 Standard deviation 1.47 1.16 1.99 Standard error 0.29 0.44 0.41
0.406, respectively, for fungi and bacteria. It is therefore concluded that the fit is reasonably good.
The consistency of the means, which are, respectively, 81.3S and 68.4S for fungi and bacteria, was tested using 49 d.f., and a t value of 25.8 was obtained. The P of having a t value this great or greater by chance is much less than 0.01. Therefore, the difference between the sedimentation coefficients of fungal and bacterial ribo- somes appears to be significant.
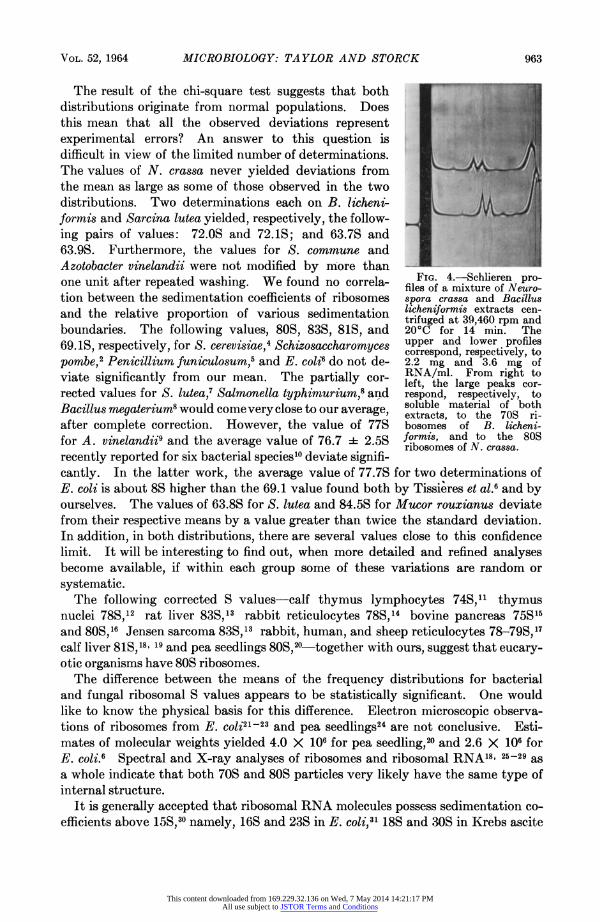
Figure 3 shows the histograms corresponding to the two frequency distributions for the S120w, values. These two histograms do not overlap, and this can be illus- trated during the centrifugation of a mixture of extracts from N. crassa and Bacillus licheniformis, as shown in Figure 4. Indeed, after 14 min of centrifugation at 39,460 rpm, separation of the two ribosomal classes occurs. Furthermore, the values extrapolated to infinite dilution were, respectively, 84.5S and 71.9S. This differ- ence of 12.6S is close to the 12.9S units separating the means of the two distributions.
Discussion. -Our study has been limited to two small-sized samples, the selection of organisms was not perfectly random, and several taxonomic groups were not analyzed; however, authentic representatives of both proto- and eucaryotic micro- organisms have been included.
f 7
6
5
4
3
2
615 70 SO 7 810 815 20,w
FIG. 3.-Histograms representing the frequency distributions of sedimentation coefficients of funaal and bacterial ribosomes.
This content downloaded from 169.229.32.136 on Wed, 7 May 2014 14:21:17 PMAll use subject to JSTOR Terms and Conditions
VOL. 52, 1964 MICROBIOLOGY: TAYLOR AND STORCK 963
The result of the chi-square test suggests that both distributions originate from normal populations. Does this mean that all the observed deviations represent experimental errors? An answer to this question is difficult in view of the limited number of determinations. The values of N. crassa never yielded deviations from the mean as large as some of those observed in the two distributions. Two determinations each on B. licheni- formis and Sarcina lutea yielded, respectively, the follow- ing pairs of values: 72.OS and 72.1S; and 63.7S and 63.9S. Furthermore, the values for S. commune and Azotobacter vinelandii were not modified by more than one unit after repeated washing. We found no correla- tion between the sedimentation coefficients of ribosomes and the relative proportion of various sedimentation boundaries. The following values, 80S, 83S, 81S, and 69.1S, respectively, for S. cerevisiae,4 Schizosaccharomyces pombe,2 Penicillium funiculosum,5 and E. coli6 do not de- viate significantly from our mean. The partially cor- rected values for S. lutea,7 Salmonella typhimurium,8 and Bacillus megaterium8 would comevery close to our average, after complete correction. However, the value of 77S for A. vinelandii9 and the average value of 76.7 i 2.5S recently reported for six bacterial species'0 deviate signifi- cantly. In the latter work, the average value of 77.7S for two determinations of E. coli is about 8S higher than the 69.1 value found both by Tissieres et al.6 and by ourselves. The values of 63.8S for S. lutea and 84.5S for Mucor rouxianus deviate from their respective means by a value greater than twice the standard deviation. In addition, in both distributions, there are several values close to this confidence limit. It will be interesting to find out, when more detailed and refined analyses become available, if within each group some of these variations are random or systematic.
The following corrected S values-calf thymus lymphocytes 74S,11 thymus nuclei 78S,12 rat liver 83S,1' rabbit reticulocytes 78S,14 bovine pancreas 75S15 and 80S,16 Jensen sarcoma 83S,13 rabbit, human, and sheep reticulocytes 78-79S,17 calf liver 81S,18 19 and pea seedlings 80S,20-together with ours, suggest that eucary- otic organisms have 80S ribosomes.
The difference between the means of the frequency distributions for bacterial and fungal ribosomal S values appears to be statistically significant. One would like to know the physical basis for this difference. Electron microscopic observa- tions of ribosomes from E. co1i21-23 and pea seedlings24 are not conclusive. Esti- mates of molecular weights yielded 4.0 X 10⁶ for pea seedling,20 and 2.6 X 10⁶ for E. coli.6 Spectral and X-ray analyses of ribosomes and ribosomal RNA18 25-29 as a whole indicate that both 70S and 80S particles very likely have the same type of internal structure.
It is generally accepted that ribosomal RNA molecules possess sedimentation co- efficients above 15S,30 namely, 16S and 23S in E. coli,31 18S and 30S in Krebs ascite
FIG. 4. Schlieren pro- files of a mixture of Neuro- spora crassa and Bacillus licheniformis extracts cen- trifuged at 39,460 rpm and 20?C for 14 min. The upper and lower profiles correspond, respectively, to 2.2 mg and 3.6 mg of RNA/ml. From right to left, the large peaks cor- respond, respectively, to soluble material of both extracts, to the 70S ri- bosomes of B. licheni- formis, and to the 80S ribosomes of N. crassa.
This content downloaded from 169.229.32.136 on Wed, 7 May 2014 14:21:17 PMAll use subject to JSTOR Terms and Conditions
964 MICRIOBIOLOGY: TA YLOR AND STORCK PROC. N. A. S.
cells;32 17S and 26S in calf thymus;33 19S anld 28S in S. cerevisiae,34 18S and 28S in calf liver;18 and 19S anid 28S in N. crassa.35 However, Spirin36 found, at an iOnlic strength of 0.1 and in the presence of 0.01 M EDTA, the following pairs of values: 13.9S and 25.1S; 14.5S and 24.5S; and 16.7S and 23S, respectively, for pea seed- lings, rabbit cells, and E. coli. On the basis of these values, and on the assumption that 80S and 70S ribosomes contain, respectively, 40 per cent and 60 per cent RNA on a dry weight basis, Spirin36 has suggested that the total mnass of RNA is the same in both. On the other hand, 80S ribosomes from various sources contain 60 per cent or more RNA on a dry weight basis.1" 12, 35 It appears in conclusion that no good explanation is yet available for the difference in sedimentation coefficient between the ribosomes from proto- and eucaryotic organisms.
As pointed out by Stanier,37 bacteria and blue-greeni algae are unique because they are devoid of nuclear membrane, endoplasmic reticulum, intracellular Brown- ian movement, mitochondria, and chloroplasts; and have mucocomplexes in the cell wall. As a consequence of the present work, it is suggested that bacteria and blue-green algae be further defined as the organisms possessing "70S" ribosomes, in contrast to eucaryotic organisms which contain ribosomes of the 80S type.
The existence of two distinct classes of ribosomes raises the question of their origin. One might ask whether one class derived from the other or whether they both had a common ancestor, and if, as suggested by Bernal,38 ribonucleoprotein particles antedate cells during biopoesis, one might also wonder if the two classes coexisted at that stage.
Summary.-A comparison of the sedimentation coefficients of ribosomes from 26 species of molds and yeasts, 25 species of bacteria, and 2 species of blue-green algae shows that they belong to two distinct classes, characterized, respectively, by mean values of 68.4 S02O,w and 81.3 S020,w. It is therefore suggested that the unique value of sedimentation coefficient of ribosomes of bacteria and blue-green algae be used to define this group further.
The authors would like to express their appreciation to Mr. Carl Hartt and Mrs. Reba Morrill for their excellent technical assistance.
* This investigation was supported by IJSPHS grant AI-04431-03. 1 Schachman, H. K., in Methods in Enzymology, ed. S. P. Colowick and N. 0. Kaplan (New
York: Academic Press, 1957), vol. 4, p. 55. 2 Lederberg, S., and J. M. Mitchison, Biochirn. Biophys. Acta, 55, 104 (1962). 3Warner, J. R., A. Rich, and C. E. Hall, Science, 138, 1399 (1962). 4Chao, F. C., Arch. Biochem. Biophys., 70, 426 (1957). 'Lewis, V. J., E. L. Rickles, L. McClelland, and N. G. Brink, J. Am. Chem. Soc., 81, 4115
(1959). 6Tissieres, A., J. D. Watson, D. Schlessinger, and B. R. Hollingworth, J. Mol. Biol., 1, 221
(1959). 7Brown, J. W., and C. F. Rosenberg, Biochim. Biophys. Acta, 61, 657 (1962). 8 Schaechter, M., J. Mol. Biol., 7, 561 (1963). 9 Gillchriest, W. C., and R. M. Bock, in Microsomal Particles and Protein Synthesis, ed. R. B.
Roberts (New York: Pergamon Press, 1958). 10 DeLey, J., J. Gen. Microbiol., 34, 219 (1964).
E Hess, E. L., and S. E. Lagg, Biochemistry, 2, 726 (1963). 12 Pogo, A. O., B. B. Pogo, V. C. Littau, V. G. Allfrey, A. E. Mirsky, and M. G. Hamilton,
Biochim. Biophys. Acta, 55, 849 (1962).
This content downloaded from 169.229.32.136 on Wed, 7 May 2014 14:21:17 PMAll use subject to JSTOR Terms and Conditions
VOL. 52, 1'964 GENETICS: C. M. RADDING 965
13 Petermmn, M. L., and M. G. Hamilton, in Protein Biosynthesis, ed. R. J. C. Harris (New York: Academic Press, 1961), p. 233.
14 Dintzis, H. M., H. Borsook, and J. Vinograd in Microsomal Particles and Protein Synthesis, ed. R. B. Roberts (New York: Pergamon Press, 1958), p. 95.
15 Keller, P. J., E. Cohen, and R. D. Wade, Biochemistry, 2, 315 (1963). 16 Madison, J. T., and S. R. Dickman, Biochemistry, 2, 321 (1963). 17 Ts'o, P. 0. P., and J. Vinograd, Biochim. Biophys. Acta, 49, 113 (1961). 18Hall, B. D., and P. I)oty, J. Mol. Biol., 1, 111 (1959). 19 Sherman, J. H., and M. L. Peterman, Biochim. Biophys. Acta, 47, 188 (1961). 20 Ts'o, P. 0. P., J. Bonner, and J. Vinograd, Biochim. Biophys. Acta, 30, 570 (1958). 21 Hall, C. E., and H. S. Slayter, J. Mol. Biol., 1, 329 (1959). 22 Huxley, H. E., and G. Zubay, J. Mol. Biol., 2, 10 (1960). 23 Beer, M., P. J. Highton, and B. J. McCarthy, J. Mol. Biol., 2, 447 (1960). 24 Bayley, S. T., J. Mol. Biol., 8, 231 (1964). 25 Zubay, G., and M. H. F. Wilkins, J. Mol. Biol., 2,105 (1960). 26 Schlessinger, D., J. Mol. Biol., 2, 92 (1960). 27 Spencer, M., W. Fuller, M. H. F. Wilkins, and G. L. Brown, Nature, 194, 1014 (1962). 28 Timasheff, S. N., J. Witz, and V. Luzzati, Biophys. J., 1, 525 (1961). 29 Langridge, R., Science, 140, 1000 (1963). 30 Moller, W., and H. Boedtker, in Colloque International sur les Acides Ribonucleiques et les
Polyphosphates (Strasbourg: C.N.R.S., 1961), p. 99. 31 Kurland, C. G., J. Mol. Biol., 2, 83 (1960). 32 Montagnier, L., and A. D. Bellamy, Biochim. Biophys. Acta, 80, 157 (1964). 33 Wang, T.-Y., Biochim. Biophys. Acta, 72, 335 (1963). 34 Maeda, A., J. Biochem., 50, 377 (1961). 36 Henney, H., and R. Storek, Science, 142, 1674 (1963). 36 Spirin, A. S., in Progress in Nucleic Acid Research, ed. J. N. Davidson and W. E. Cohn (New
York: Academic Press, 1963), p. 301. 3 Stanier, R. Y., Ann. Inst. Pasteur, 101, 297 (1961). 38 Bernal, J. D., in Aspects of the Origin of Life, ed. M. Florkin (New York: Pergamon Press,
1960), p. 30. 39 Moyer, R. C., and R. Storek, Arch. Biochem. Biophys., 104, 193 (1964).
NUCLEASE ACTIVITY IN DEFECTIVE LYSOGENS OF J'HAGE X, II. A HYPERACTIVE MUTANT
BY CHARLES M. RADDING
DEPARTMENT OF HUMAN GENETICS, UNIVERSITY OF MICHIGAN MEDICAL SCHOOL, ANN ARBOR
Communicated by James V. Neel, August 3, 1964
Defective lysogens are bacterial cells bearing mutant, defective prophages; they offer an opportunity to study lethal mutations of the bacteriophage whose genome can be propagated as prophage along with the host genome but is unable to lead to the production of mature phage particles.1 Jacob et al.,2 2 and Brooks, 4
studying defective lysogens of X, have described and characterized mutants falling into two classes: (1) early mutants which are blocked prior to vegetative replica- tion of the phage genome, and (2) late mutants which are blocked in some subse- quent maturative function. To explore biochemical aspects of early mutants, we have examined defective lysogens for the increase in nuclease activity associated with induction of lysogens of phage X.5 Two altered biochemical phenotypes have thus been found: (1) one which is characterized by a deficiency in nuclease activity
This content downloaded from 169.229.32.136 on Wed, 7 May 2014 14:21:17 PMAll use subject to JSTOR Terms and Conditions