Embed Size (px)
Citation preview
Waters, ACQUITY, ACQUITY UPLC, UPLC, OBD and BEH Technology are trademarks of Waters Corporation. ©2006 Waters Corporation Produced in the U.S.A. August 2006 720001821EN MC–UG
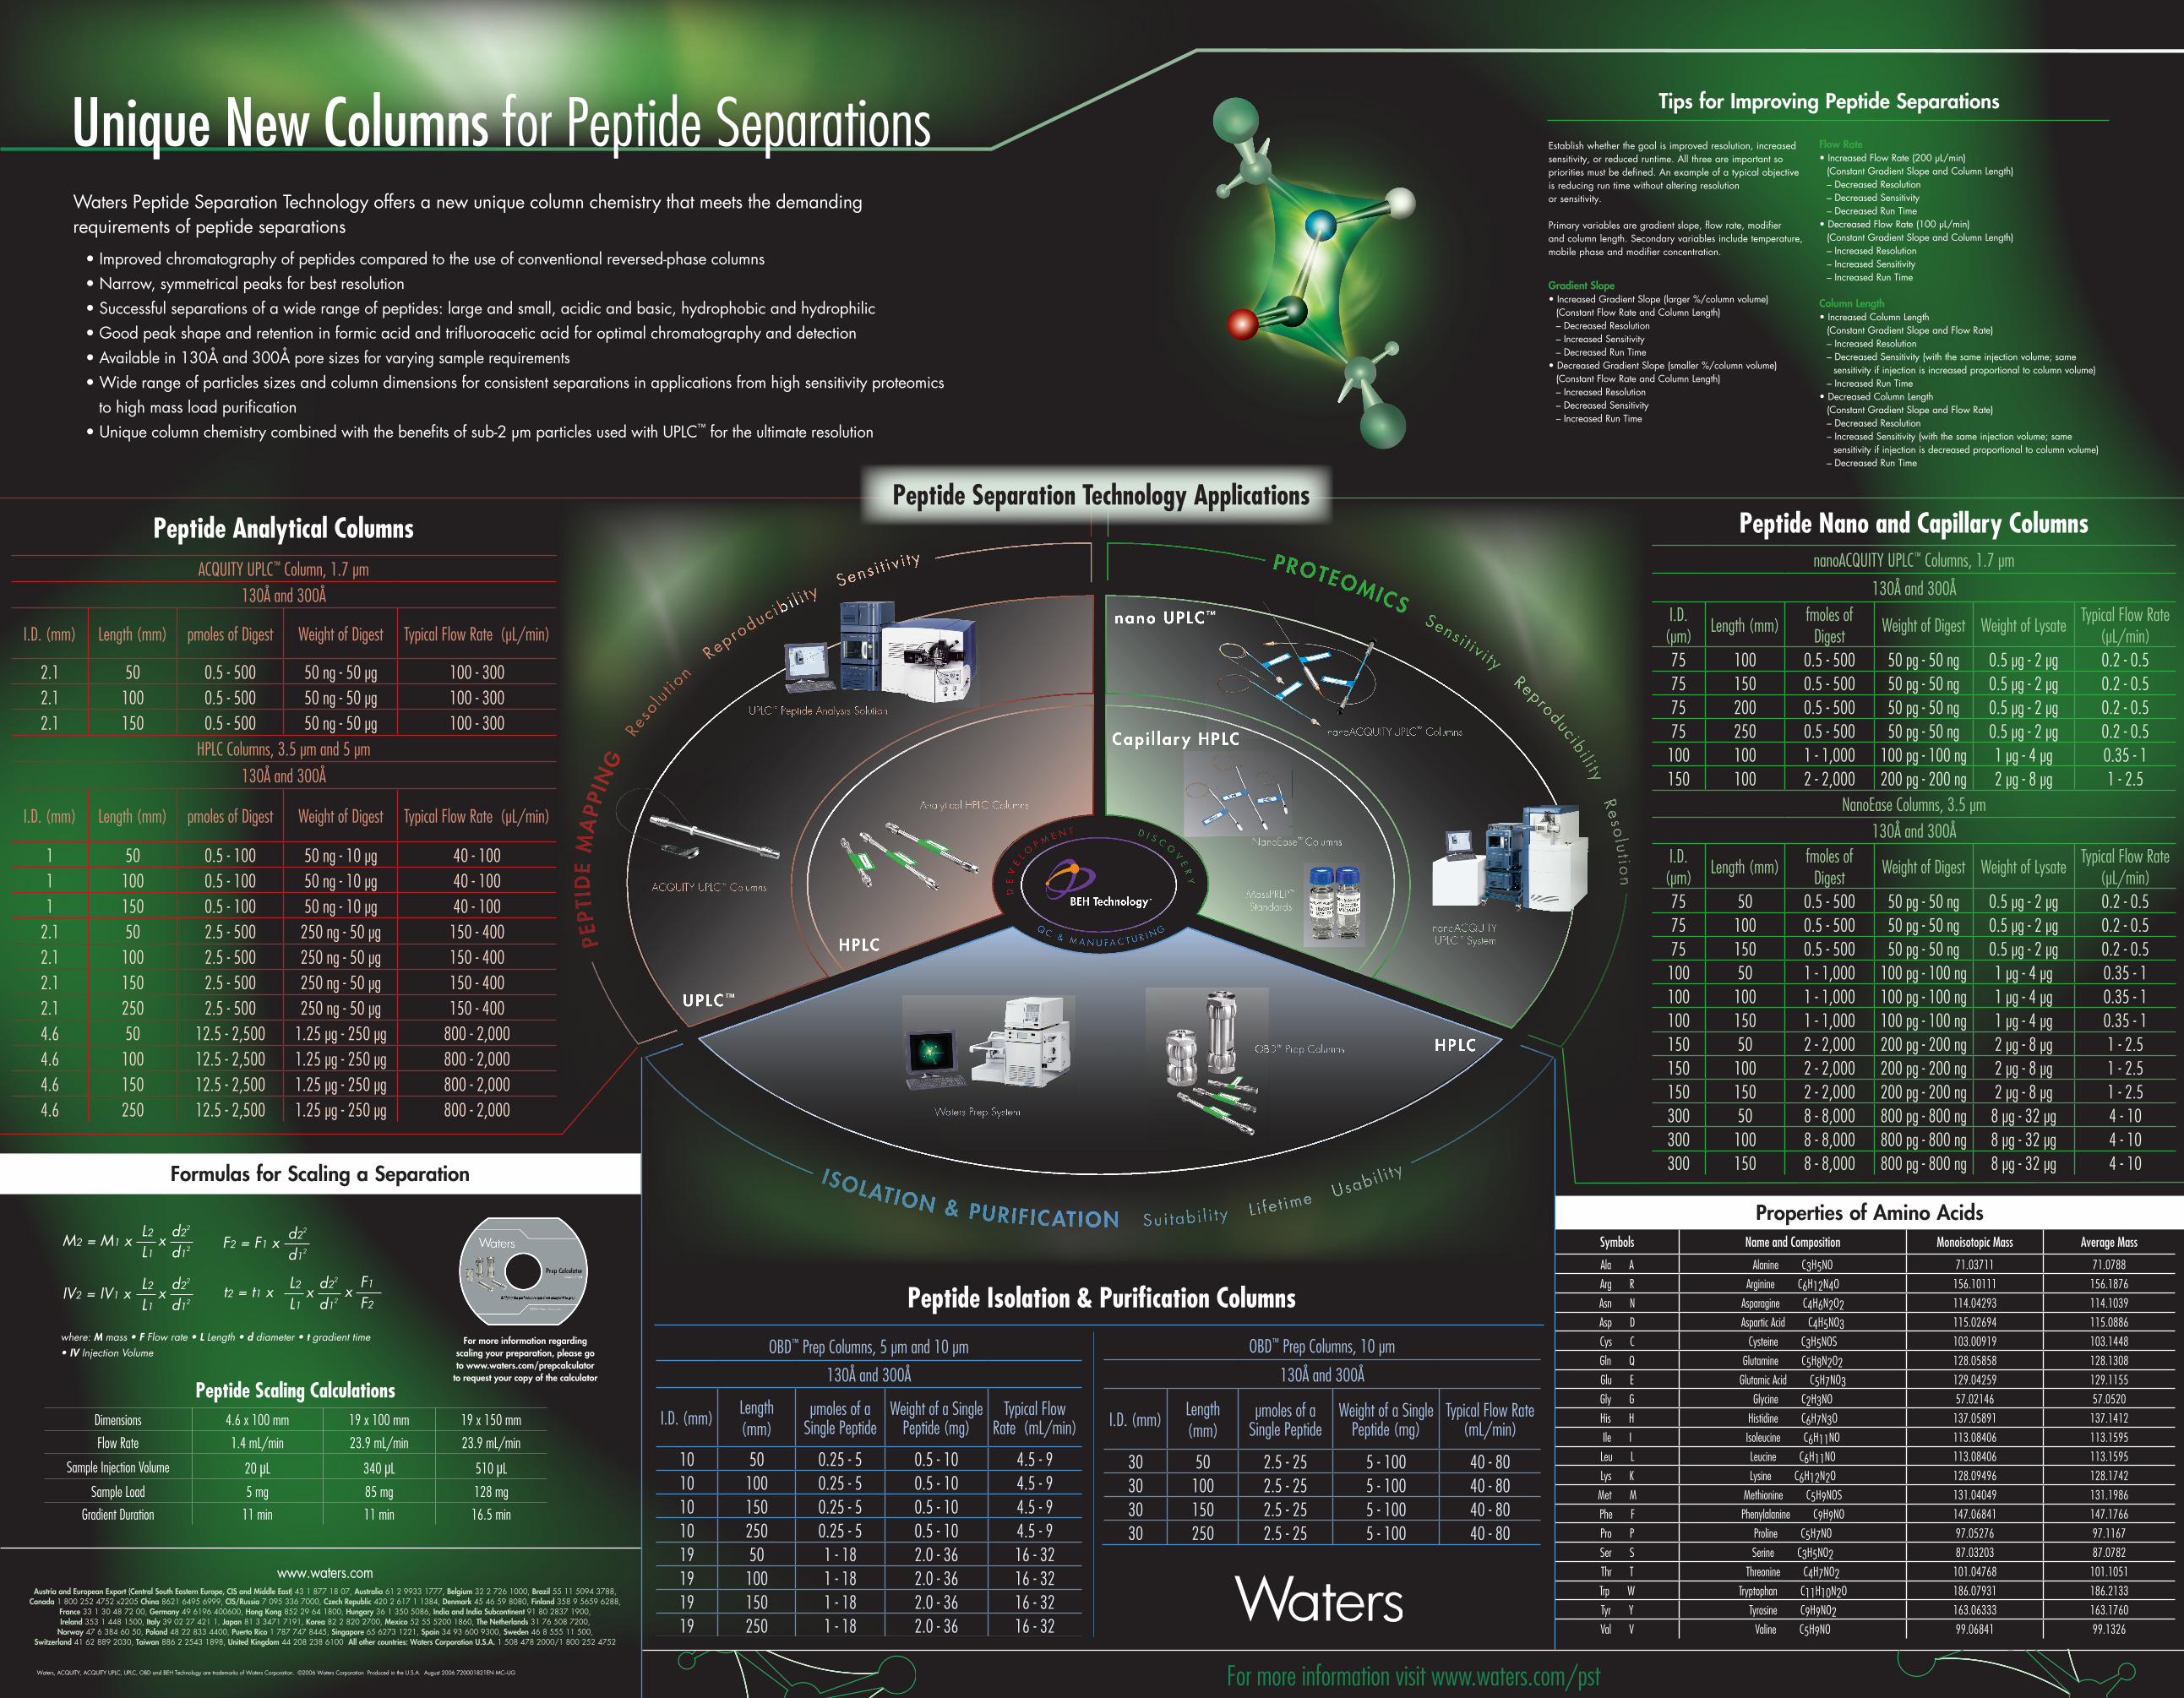
Peptide Scaling CalculationsDimensions 4.6 x 100 mm 19 x 100 mm 19 x 150 mm
Flow Rate 1.4 mL/min 23.9 mL/min 23.9 mL/min
Sample Injection Volume 20 µL 340 µL 510 µL
Sample Load 5 mg 85 mg 128 mg
Gradient Duration 11 min 11 min 16.5 min
Waters Peptide Separation Technology offers a new unique column chemistry that meets the demanding requirements of peptide separations
• Improved chromatography of peptides compared to the use of conventional reversed-phase columns • Narrow, symmetrical peaks for best resolution • Successful separations of a wide range of peptides: large and small, acidic and basic, hydrophobic and hydrophilic • Good peak shape and retention in formic acid and trifluoroacetic acid for optimal chromatography and detection • Available in 130Å and 300Å pore sizes for varying sample requirements • Wide range of particles sizes and column dimensions for consistent separations in applications from high sensitivity proteomics to high mass load purification • Unique column chemistry combined with the benefits of sub-2 µm particles used with UPLC™ for the ultimate resolution
where: M mass • F Flow rate • L Length • d diameter • t gradient time • IV Injection Volume
Symbols Name and Composition Monoisotopic Mass Average Mass
Ala A Alanine C3H5NO 71.03711 71.0788
Arg R Arginine C6H12N4O 156.10111 156.1876
Asn N Asparagine C4H6N2O2 114.04293 114.1039
Asp D Aspartic Acid C4H5NO3 115.02694 115.0886
Cys C Cysteine C3H5NOS 103.00919 103.1448
Gln Q Glutamine C5H8N2O2 128.05858 128.1308
Glu E Glutamic Acid C5H7NO3 129.04259 129.1155
Gly G Glycine C2H3NO 57.02146 57.0520
His H Histidine C6H7N3O 137.05891 137.1412
Ile I Isoleucine C6H11NO 113.08406 113.1595
Leu L Leucine C6H11NO 113.08406 113.1595
Lys K Lysine C6H12N2O 128.09496 128.1742
Met M Methionine C5H9NOS 131.04049 131.1986
Phe F Phenylalanine C9H9NO 147.06841 147.1766
Pro P Proline C5H7NO 97.05276 97.1167
Ser S Serine C3H5NO2 87.03203 87.0782
Thr T Threonine C4H7NO2 101.04768 101.1051
Trp W Tryptophan C11H10N2O 186.07931 186.2133
Tyr Y Tyrosine C9H9NO2 163.06333 163.1760
Val V Valine C5H9NO 99.06841 99.1326
For more information visit www.waters.com/pst
F2 = F1 x M2 = M1 x
IV2 = IV1 x t2 = t1 x F1
F2
L2 d22
L1 d12x x L2 d22
L1 d12x
L2 d22
L1 d12x d22
d12
NanoEase™ Columns
nanoACQUITY UPLC™ Columns
nanoACQUITY
UPLC™ System
ACQUITY UPLC™ Columns
UPLC™ Peptide Analysis Solution
DE
VE
L OP M E N T D I S C O
VE
RY
Q C & M A N U F A C T U R I N G
Analytical HPLC Columns
OBD™ Prep Columns
Waters Prep System
PEPT
IDE
MA
PPIN
G
Res
olu t
ion
Reproducibi l i ty S
ensi t iv i ty PROTEOMICS Sensi t iv i ty Reproducibi l i ty Resolution
ISOLATION & PURIFICATION Sui tabi l i ty L i fe t ime Usabi l i ty
MassPREP™
Standards
HPLC
Capi l lar y HPLC
HPLC
UPLC™
nano UPLC™
Peptide Isolation & Purification Columns
Formulas for Scaling a Separation
For more information regarding scaling your preparation, please go to www.waters.com/prepcalculator
to request your copy of the calculator
www.waters.comAustria and European Export (Central South Eastern Europe, CIS and Middle East) 43 1 877 18 07, Australia 61 2 9933 1777, Belgium 32 2 726 1000, Brazil 55 11 5094 3788,
Canada 1 800 252 4752 x2205 China 8621 6495 6999, CIS/Russia 7 095 336 7000, Czech Republic 420 2 617 1 1384, Denmark 45 46 59 8080, Finland 358 9 5659 6288, France 33 1 30 48 72 00, Germany 49 6196 400600, Hong Kong 852 29 64 1800, Hungary 36 1 350 5086, India and India Subcontinent 91 80 2837 1900, Ireland 353 1 448 1500, Italy 39 02 27 421 1, Japan 81 3 3471 7191, Korea 82 2 820 2700, Mexico 52 55 5200 1860, The Netherlands 31 76 508 7200,
Norway 47 6 384 60 50, Poland 48 22 833 4400, Puerto Rico 1 787 747 8445, Singapore 65 6273 1221, Spain 34 93 600 9300, Sweden 46 8 555 11 500, Switzerland 41 62 889 2030, Taiwan 886 2 2543 1898, United Kingdom 44 208 238 6100 All other countries: Waters Corporation U.S.A. 1 508 478 2000/1 800 252 4752
Properties of Amino Acids
Unique New Columns for Peptide Separations Tips for Improving Peptide Separations
Establish whether the goal is improved resolution, increased sensitivity, or reduced runtime. All three are important so priorities must be defined. An example of a typical objective is reducing run time without altering resolution or sensitivity. Primary variables are gradient slope, flow rate, modifier and column length. Secondary variables include temperature, mobile phase and modifier concentration.
Gradient Slope • Increased Gradient Slope (larger %/column volume) (Constant Flow Rate and Column Length) – Decreased Resolution – Increased Sensitivity – Decreased Run Time • Decreased Gradient Slope (smaller %/column volume) (Constant Flow Rate and Column Length) – Increased Resolution – Decreased Sensitivity – Increased Run Time
Flow Rate • Increased Flow Rate (200 µL/min) (Constant Gradient Slope and Column Length) – Decreased Resolution – Decreased Sensitivity – Decreased Run Time • Decreased Flow Rate (100 µL/min) (Constant Gradient Slope and Column Length) – Increased Resolution – Increased Sensitivity – Increased Run Time Column Length • Increased Column Length (Constant Gradient Slope and Flow Rate) – Increased Resolution – Decreased Sensitivity (with the same injection volume; same sensitivity if injection is increased proportional to column volume) – Increased Run Time • Decreased Column Length (Constant Gradient Slope and Flow Rate) – Decreased Resolution – Increased Sensitivity (with the same injection volume; same sensitivity if injection is decreased proportional to column volume) – Decreased Run Time
OBD™ Prep Columns, 10 µm
130Å and 300Å
I.D. (mm)Length (mm)
µmoles of a Single Peptide
Weight of a Single Peptide (mg)
Typical Flow Rate (mL/min)
30 50 2.5 - 25 5 - 100 40 - 8030 100 2.5 - 25 5 - 100 40 - 8030 150 2.5 - 25 5 - 100 40 - 8030 250 2.5 - 25 5 - 100 40 - 80
OBD™ Prep Columns, 5 µm and 10 µm
130Å and 300Å
I.D. (mm)Length (mm)
µmoles of a Single Peptide
Weight of a Single Peptide (mg)
Typical Flow Rate (mL/min)
10 50 0.25 - 5 0.5 - 10 4.5 - 910 100 0.25 - 5 0.5 - 10 4.5 - 910 150 0.25 - 5 0.5 - 10 4.5 - 910 250 0.25 - 5 0.5 - 10 4.5 - 919 50 1 - 18 2.0 - 36 16 - 3219 100 1 - 18 2.0 - 36 16 - 3219 150 1 - 18 2.0 - 36 16 - 3219 250 1 - 18 2.0 - 36 16 - 32
Peptide Analytical ColumnsACQUITY UPLC™ Column, 1.7 µm
130Å and 300Å
I.D. (mm) Length (mm) pmoles of Digest Weight of Digest Typical Flow Rate (µL/min)
2.1 50 0.5 - 500 50 ng - 50 µg 100 - 3002.1 100 0.5 - 500 50 ng - 50 µg 100 - 3002.1 150 0.5 - 500 50 ng - 50 µg 100 - 300
HPLC Columns, 3.5 µm and 5 µm
130Å and 300Å
I.D. (mm) Length (mm) pmoles of Digest Weight of Digest Typical Flow Rate (µL/min)
1 50 0.5 - 100 50 ng - 10 µg 40 - 1001 100 0.5 - 100 50 ng - 10 µg 40 - 1001 150 0.5 - 100 50 ng - 10 µg 40 - 100
2.1 50 2.5 - 500 250 ng - 50 µg 150 - 4002.1 100 2.5 - 500 250 ng - 50 µg 150 - 4002.1 150 2.5 - 500 250 ng - 50 µg 150 - 4002.1 250 2.5 - 500 250 ng - 50 µg 150 - 4004.6 50 12.5 - 2,500 1.25 µg - 250 µg 800 - 2,0004.6 100 12.5 - 2,500 1.25 µg - 250 µg 800 - 2,0004.6 150 12.5 - 2,500 1.25 µg - 250 µg 800 - 2,0004.6 250 12.5 - 2,500 1.25 µg - 250 µg 800 - 2,000
Peptide Nano and Capillary ColumnsnanoACQUITY UPLC™ Columns, 1.7 µm
130Å and 300ÅI.D.
(µm)Length (mm)
fmoles of Digest
Weight of Digest Weight of LysateTypical Flow Rate
(µL/min)75 100 0.5 - 500 50 pg - 50 ng 0.5 µg - 2 µg 0.2 - 0.575 150 0.5 - 500 50 pg - 50 ng 0.5 µg - 2 µg 0.2 - 0.575 200 0.5 - 500 50 pg - 50 ng 0.5 µg - 2 µg 0.2 - 0.575 250 0.5 - 500 50 pg - 50 ng 0.5 µg - 2 µg 0.2 - 0.5100 100 1 - 1,000 100 pg - 100 ng 1 µg - 4 µg 0.35 - 1150 100 2 - 2,000 200 pg - 200 ng 2 µg - 8 µg 1 - 2.5
NanoEase Columns, 3.5 µm
130Å and 300ÅI.D.
(µm)Length (mm)
fmoles of Digest
Weight of Digest Weight of LysateTypical Flow Rate
(µL/min)75 50 0.5 - 500 50 pg - 50 ng 0.5 µg - 2 µg 0.2 - 0.575 100 0.5 - 500 50 pg - 50 ng 0.5 µg - 2 µg 0.2 - 0.575 150 0.5 - 500 50 pg - 50 ng 0.5 µg - 2 µg 0.2 - 0.5100 50 1 - 1,000 100 pg - 100 ng 1 µg - 4 µg 0.35 - 1100 100 1 - 1,000 100 pg - 100 ng 1 µg - 4 µg 0.35 - 1100 150 1 - 1,000 100 pg - 100 ng 1 µg - 4 µg 0.35 - 1150 50 2 - 2,000 200 pg - 200 ng 2 µg - 8 µg 1 - 2.5150 100 2 - 2,000 200 pg - 200 ng 2 µg - 8 µg 1 - 2.5150 150 2 - 2,000 200 pg - 200 ng 2 µg - 8 µg 1 - 2.5300 50 8 - 8,000 800 pg - 800 ng 8 µg - 32 µg 4 - 10300 100 8 - 8,000 800 pg - 800 ng 8 µg - 32 µg 4 - 10300 150 8 - 8,000 800 pg - 800 ng 8 µg - 32 µg 4 - 10
Peptide Separation Technology Applications