Embed Size (px)
Citation preview
Task Order No. 24
CONTRACT NO. HHSF223200810017I
FINAL REPORT
UNIQUE DEVICE IDENTIFICATION (UDI) FOR MEDICAL DEVICES
SUBMITTED TO: FOOD AND DRUG ADMINISTRATION
OFFICE OF POLICY & PLANNING 10902 New Hampshire Avenue
Building 32, Room 3254 Silver Spring, MD 20903
SUBMITTED BY: EASTERN RESEARCH GROUP, INC.
110 HARTWELL AVENUE LEXINGTON, MA 02421
WWW.ERG.COM
ERG TASK NO. 0259.03.024.001
DATE: MAY 2012


iii
TAB L E OF C ONT E NT S
TABLE OF CONTENTS ........................................................................................................... III
LIST OF TABLES .......................................................................................................................VI
SECTION ONE EXECUTIVE SUMMARY ........................................................................ 1-1
1.1 SUMMARY OF THE PROPOSED RULE ............................................................................................... 1-2
1.2 LABELER COSTS TO IMPLEMENT UNIQUE DEVICE IDENTIFICATION ............................................. 1-2
1.2.1 Immediate Implementation Cost Scenario .............................................................................. 1-3 1.2.2 Proposed Implementation Schedule ....................................................................................... 1-5
1.3 IMPACTS ON LABELING FIRMS AND ESTABLISHMENTS ................................................................ 1-6
SECTION TWO INTRODUCTION ..................................................................................... 2-1
2.1 BACKGROUND AND ORGANIZATION OF THE REPORT .................................................................... 2-1
2.2 SUMMARY OF THE PROPOSED UDI RULE ........................................................................................ 2-1
2.2.1 Components of the UDI .......................................................................................................... 2-2 2.2.2 Display of UDI on Label ........................................................................................................ 2-2 2.2.3 Exceptions to the Rule ............................................................................................................ 2-3 2.2.4 Issuance of UDIs and Global Unique Identification Database .............................................. 2-4
SECTION THREE PROFILE OF THE AFFECTED ENTITIES ................................... 3-1
3.1 IDENTIFYING THE AFFECTED UNIVERSE OF MEDICAL DEVICE LABELERS ................................... 3-1
3.2 PROFILE OF AFFECTED ESTABLISHMENTS ..................................................................................... 3-3
3.2.1 Manufacturers of Medical Devices ........................................................................................ 3-3 3.2.2 Reprocessors of Medical Devices ........................................................................................... 3-8 3.2.3 Specification Developers ...................................................................................................... 3-10 3.2.4 Repackagers and Relabelers of Medical Devices ................................................................. 3-13
SECTION FOUR DIRECT REGULATORY COSTS ....................................................... 4-1
4.1 INTRODUCTION .............................................................................................................................. 4-1
4.2 KEY COSTING ASSUMPTIONS .......................................................................................................... 4-1
4.2.1 Assumptions—UDI Structure ................................................................................................. 4-1 4.2.2 Assumptions—Baseline Compliance and Exceptions from the Proposed Rule ...................... 4-2 4.2.3 Assumptions—Display of UDI on Label ................................................................................. 4-3 4.2.4 Assumptions—Barcoding Used to Represent UDI ................................................................. 4-5 4.2.5 Assumptions—Incremental Costs Due to the Proposed Rule ................................................. 4-7
iv
4.3 COSTS TO AFFECTED ENTITIES ...................................................................................................... 4-8
4.3.1 Cost Estimate for Manufacturers, Reprocessors, and Specification Developers ................... 4-8 4.3.2 Costs for Repackagers and Relabelers ................................................................................. 4-58 4.3.3 Total Costs to U.S. Industry ................................................................................................. 4-66 4.3.4 Costs to the Issuing Agencies ............................................................................................... 4-67 4.3.5 All Costs of UDI to All U.S. Entities .................................................................................... 4-69 4.3.6 Costs for Foreign Entities and All Affected Entities ............................................................. 4-70
4.4 TIMING OF INVESTMENTS ............................................................................................................ 4-70
SECTION FIVE ECONOMIC IMPACTS ........................................................................... 5-1
5.1 IMPACTS ON DEVICE MANUFACTURING, REPROCESSING, AND SPECIFICATION DEVELOPMENT FIRMS
5-1
5.2 IMPACTS ON REPACKAGING AND RELABELING (R/R FIRMS ......................................................... 5-10
5.3 SUMMARY OF IMPACTS ON MEDICAL DEVICE LABELING FIRMS.................................................. 5-13
5.4 IMPACTS ON MEDICAL DEVICE LABELING ESTABLISHMENTS ....................................................... 5-13
SECTION SIX ALTERNATIVES TO THE PROPOSED RULE ..................................... 6-1
6.1 NO ACTION—VOLUNTARY ADOPTION ........................................................................................... 6-1
6.2 LABELING ONLY ............................................................................................................................. 6-4
6.3 ONLY CLASS II AND CLASS III DEVICES REQUIRE UDI ................................................................ 6-5
6.3.1 Methodology for Identifying Class II and Class III Device Labelers ..................................... 6-5 6.3.2 Costs and Impacts of an Alternative Covering Only Class II and Class III Devices ............. 6-9
6.4 ONLY CLASS III DEVICES REQUIRE UDI ....................................................................................... 6-9
6.4.1 Methodology for Identifying Class III Device Labelers ....................................................... 6-11 6.4.2 Costs of an Alternative Covering Only Class III Devices .................................................... 6-14
6.5 STATIC BARCODE UDI ................................................................................................................. 6-15
6.5.1 Manufacturers, Reprocessors, and Specification Developers .............................................. 6-17 6.5.2 Relabelers/Repackagers ....................................................................................................... 6-23
6.6 CLASS II/III WITH VARIABLE BARCODING AND CLASS I WITH STATIC BARCODING (GMP-EXEMPT
DEVICES EXCLUDED) ............................................................................................................................... 6-25
6.6.1 Cost Savings for Initial Labelers .......................................................................................... 6-29 6.6.2 Cost Savings for R/Rs ........................................................................................................... 6-35 6.6.3 Cost Savings Realized by the Class I Static Alternative, Total Cost of the Alternative, and
Impacts of the Alternative ............................................................................................................................... 6-35 6.6.4 Timing of Investments under the Class I Only Static Barcoding Alternative ....................... 6-41
6.7 COSTS TO FDA FOR ESTABLISHING THE GUDID UNDER FURLS ............................................... 6-41
v
6.7.1 Initial Development and Deployment ................................................................................... 6-43 6.7.2 Operation and Maintenance ................................................................................................. 6-44 6.7.3 Annualized Costs to FDA of the GUDID System ................................................................. 6-44
SECTION SEVEN INITIAL REGULATORY FLEXIBILITY ANALYSIS ................... 7-1
7.1 NEED FOR THE PROPOSED RULE ..................................................................................................... 7-1
7.2 OBJECTIVES AND LEGAL BASIS OF THE PROPOSED RULE ............................................................... 7-1
7.3 ESTIMATE OF SMALL ENTITIES AFFECTED BY THE PROPOSED RULE .............................................. 7-2
7.4 RECORDKEEPING, REPORTING AND OTHER COMPLIANCE REQUIREMENTS OF THE PROPOSED RULE
7-2
7.4.1 Recordkeeping and Reporting Requirements ......................................................................... 7-2 7.4.2 Other Compliance Tasks ........................................................................................................ 7-5
7.5 OTHER FEDERAL RULES ................................................................................................................. 7-5
7.6 COSTS TO AND IMPACTS ON SMALL ENTITIES AS A RESULT OF THE PROPOSED RULE .................... 7-5
7.7 SIGNIFICANT ALTERNATIVES TO THE PROPOSED RULE .................................................................. 7-7
7.7.1 Labeling Only Alternative ...................................................................................................... 7-7 7.7.2 Class II/Class III UDI Requirement ....................................................................................... 7-7 7.7.3 Static Barcode Alternative...................................................................................................... 7-8 7.7.4 Class II/III Variable, Class I Static Barcoding Alternative .................................................... 7-8
SECTION EIGHT UNCERTAINTY ANALYSIS ............................................................. 8-1
REFERENCES ........................................................................................................................... R-1
APPENDIX A DEVELOPMENT OF COUNTS OF LABELERS POTENTIALLY SUBJECT
TO THE PROPOSED RULE.................................................................................................... A-1
APPENDIX B SUMMARY OF DEVICE MANUFACTURER INTERVIEWS ........... B-1

vi
L I ST OF TAB L E S
Table 1-1. Costs of the Base Case for All Affected Entities ...................................................................... 1-4
Table 1-2. Costs of the Class I Static Barcoding Alternative for All Affected Entities ............................. 1-5
Table 3-1. Affected Entities (Labelers) ...................................................................................................... 3-2
Table 3-2. Medical Device Manufacturing Industry (2007 Data) .............................................................. 3-3
Table 3-3. Number of Medical Device Establishments by Employment Size Class According to Census
Bureau (2010b) Data .......................................................................................................................... 3-4
Table 3-4. Registrant (Establishment) Counts from FDA's Registration and Listing On-Line Database .. 3-6
Table 3-5. Number of Domestic Medical Device Establishments, Distributed Using 2007 Census Data on
NAICS and Establishment Size Class ................................................................................................ 3-7
Table 3-6. Number of Firms with Labeling Establishments in FDA's Registration and Listing Database 3-8
Table 3-7. Distribution of Domestic Registrant (Establishment) Owner Firms of Manufacturing
Establishments by NAICS and Employment Size Categories ........................................................... 3-9
Table 3-8. Distribution of Domestic Reprocessors and Specification Developers (Establishments) by Size
......................................................................................................................................................... 3-11
Table 3-9. Distribution of Reprocessor and Specification Developer Firms with Total Firms Analyzed as
Domestic Initial Labelers ................................................................................................................. 3-12
Table 3-10. Industry Size Distributions for Domestic R/Rs Based on 2007 Census Data ...................... 3-16
Table 3-11. Distribution of Domestic R/R Firms by Employment Size .................................................. 3-16
Table 4-1. First Year Administrative and Planning Costs per Establishment by Employee Size Class .. 4-12
Table 4-2. Aggregate Cost of UDI Plan Development ............................................................................ 4-14
Table 4-3. Numbers of Firms Assumed Needing to Register for Barcodes ............................................. 4-16
Table 4-4. Costs for Barcode Registration ............................................................................................... 4-17
Table 4-5. Characteristics of Manufacturer Baselines and of Expected Compliance Responses (b) ...... 4-21
Table 4-6. First-Year Investments per Production Line and Establishment for Barcode, Printer, Verifier,
and Overhead Costs ......................................................................................................................... 4-29
Table 4-7. Equipment Investments for UDI Requirements ..................................................................... 4-31
Table 4-8. Costs for Establishments to Document Exceptions to the Direct Marking Requirements ..... 4-34
Table 4-9. Costs for Software Upgrades and Redesign Costs for Establishments Already Marking Devices
......................................................................................................................................................... 4-36
Table 4-10. Costs to Install and Operate Direct Marking Equipment among Establishments Not Currently
Marking ............................................................................................................................................ 4-38
vii
Table 4-11. Derivation of Incremental Device Labeling Redesign Cost, per Establishment and Total .. 4-41
Table 4-12. Derivation of Incremental Device Labeling Materials Cost, per Establishment and in
Aggregate ......................................................................................................................................... 4-43
Table 4-13. Software and Associated Costs for UDI Compliance ........................................................... 4-48
Table 4-14. Per Establishment and Total Cost to Upload UDI Data to the GUDID ............................... 4-56
Table 4-15. Total Investment and Annual Recurring Costs for UDI Implementation for Medical Device
Manufacturers, Reprocessors and Specification Developers ........................................................... 4-57
Table 4-16. First Year Administrative and Planning Costs for R/Rs ....................................................... 4-58
Table 4-17. Distribution of R/R Firms Using SBA Firm Data for Two Key NAICS .............................. 4-59
Table 4-18. Costs for Barcode Registration for R/Rs .............................................................................. 4-60
Table 4-19. Equipment Investments for UDI Requirements for R/Rs ..................................................... 4-61
Table 4-20. Derivation of Incremental Device Labeling Redesign Cost, per Establishment and in
Aggregate for R/Rs .......................................................................................................................... 4-63
Table 4-21. Derivation of Incremental Device Labeling Materials Cost and Time, Per Establishment, For
Relabelers and Repackagers ............................................................................................................. 4-63
Table 4-22. Software and Associated Costs for UDI Compliance for R/Rs ............................................ 4-64
Table 4-23. Per Establishment and Total Cost for R/Rs to Upload UDI Data to the GUDID ................. 4-65
Table 4-24. Total Investment and Annual Recurring Costs for UDI Implementation for R/Rs .............. 4-66
Table 4-25. Total Investment and Annual Recurring Costs for UDI Implementation under Proposed
Rule—Manufacturers, Reprocessors, Specification Developers, and R/Rs ..................................... 4-67
Table 4-26. Costs to Issuing Agencies for Meeting FDA Requirements (Assumes Two Agencies) ....... 4-69
Table 4-27. Costs of the Proposed Rule for All Affected Entities ........................................................... 4-70
Table 4-28. Numbers and Percentages of Labeling Establishments with Class III, Class II, and Class I
Devices ............................................................................................................................................. 4-73
Table 4-29. Total Costs of the Proposed Rule to All Labelers with Timing of Outlays Occurring in Years
Corresponding to Compliance Dates One Year, Three Years, and Five Years from Promulgation,
Depending on Class of Device Labeled ........................................................................................... 4-74
Table 5-1. Total Costs by Establishment Employment Size Group for Initial Labelers (Excludes Software
and Computer-Related Costs) ............................................................................................................ 5-2
Table 5-2. Annualized Costs and Per-Establishment Costs for Initial Labelers (Excluding Software and
Computer-Related Costs) ................................................................................................................... 5-4
Table 5-3. Assignment of Establishment Costs to Initial Labeler Firms (Includes Software and Computer-
Related Costs) .................................................................................................................................... 5-6

viii
Table 5-4. Estimated Revenues by Firm Size and Industry (2007) ........................................................... 5-7
Table 5-5. Costs per Firm Consolidated to Match Firm Sizes for Which Revenue Data Are Available ... 5-8
Table 5-6. Impacts of the Proposed Rule on Initial Labelers (i.e., Manufacturers, Reprocessors,
Specification Developers) .................................................................................................................. 5-9
Table 5-7. Impacts of the Proposed Rule on Firms Required to Direct Mark ......................................... 5-11
Table 5-8. Aggregate Costs and Annualized Cost per Establishment for R/Rs ....................................... 5-11
Table 5-9. Annualized Costs per R/R Firm, Revenues per Firm and Impacts of the Proposed Rule ...... 5-12
Table 5-10. Number of Firms with Costs Exceeding 1%, 3%, and 5% of Revenues, With and Without DM
Considered ....................................................................................................................................... 5-14
Table 5-11. Estimated Revenues per Employee in the Medical Device Industries ................................. 5-15
Table 5-12. Impacts of Proposed Rule on Medical Device Labeling Establishments ............................. 5-16
Table 6-1. Twenty-year Horizon of Annualized Costs Assuming Either Voluntary (over 15 Years) or
Regulatory (Over 5 Years) Adoption of UDI .................................................................................... 6-3
Table 6-2 Total Investment and Annual Recurring Costs for UDI Implementation for Medical Device
Manufacturers and R/Rs under Label-Only Alternative .................................................................... 6-4
Table 6-3. Number of U.S. Medical Device Manufacturing Establishments, Distributed Using 2007
Census Data on NAICS and Establishment Size Class under a Class II/Class III UDI Alternative .. 6-6
Table 6-4. Distribution of Reprocessors and Specification Developers (Establishments) by Size under a
Class II/Class III UDI Alternative ..................................................................................................... 6-7
Table 6-5. Count of Initial Labeling Firms by Employment Size Class under a ClassII/Class III UDI
Alternative .......................................................................................................................................... 6-7
Table 6-6. Industry Size Distributions for R/R Establishments Based on 2007 Census Data under a Class
II/Class III UDI Alternative ............................................................................................................... 6-8
Table 6-7. Distribution of R/R Firms by Size under a Class II/Class III UDI Alternative ........................ 6-9
Table 6-8. Aggregate Annualized Costs to All Labelers under the Class II/Class III UDI Alternative
Relative to the Proposed Rule .......................................................................................................... 6-10
Table 6-9. Number of U.S. Medical Device Manufacturing Establishments, Distributed Using 2007
Census Data on NAICS and Establishment Size Class under a Class III UDI Alternative ............. 6-12
Table 6-10. Distribution of Reprocessors and Specification Developers (Establishments) by Size under a
Class III UDI Alternative ................................................................................................................. 6-13
Table 6-11. Count of Initial Labeling Firms by Employment Size Class under a Class III UDI Alternative
......................................................................................................................................................... 6-13
ix
Table 6-12. Industry Size Distributions for R/R Establishments Based on 2007 Census Data under a Class
III UDI Alternative .......................................................................................................................... 6-14
Table 6-13. Distribution of R/R Firms by Size under a Class III UDI Alternative ................................. 6-15
Table 6-14. Aggregate Annualized Costs to All Labelers under the Class III UDI Alternative Relative to
the Proposed Rule ............................................................................................................................ 6-16
Table 6-15. First-Year Administrative and Planning Costs per Establishment, by Employee Size Class
under a Static Barcoding Alternative ............................................................................................... 6-18
Table 6-16. First-Year Administrative and Planning Costs per Establishment, by Employee Size Class
under a Static Barcoding Alternative ............................................................................................... 6-20
Table 6-17. Derivation of Incremental Device Labeling Materials Cost, Per Establishment and Aggregate
for a Static Barcode Alternative ....................................................................................................... 6-21
Table 6-18. Total Investment and Annual Recurring Costs for UDI Implementation for Medical Device
Manufacturers under a Static Barcode Alternative .......................................................................... 6-22
Table 6-19. Administrative and Planning Costs for R/Rs under the Static Barcode Alternative ............. 6-23
Table 6-20. Derivation of Incremental Device Labeling Materials Cost for R/Rs, Per Establishment and
Aggregate for a Static Barcode Alternative ..................................................................................... 6-24
Table 6-21. Total Investment and Annual Recurring Costs for UDI Implementation under a Static
Barcode Alternative for R/Rs ........................................................................................................... 6-24
Table 6-22. Total Investment and Annual Recurring Costs for UDI Implementation for Medical Device
Manufacturers and R/Rs under Static Barcode Alternative ............................................................. 6-25
Table 6-23. Numbers of Establishments Affected by Either Variable or Static Requirements, or Exempt
from Most Requirements ................................................................................................................. 6-27
Table 6-24. Distribution of Initial Labelers by Size, Adjustments for Excluded Establishments, and Final
Counts of Initial Labelers Expected to Realize Cost Savings under the Class I Static Barcoding
Alternative ........................................................................................................................................ 6-28
Table 6-25. GMP-Exempt R/R Establishments and R/R Establishments Subject to Static Barcoding
Requirements Arrayed by Establishment Size ................................................................................. 6-29
Table 6-26. Initial Labelers: Estimated Cost Savings Associated with Administrative & Planning
Expenditures Due to Class I Static Barcoding Alternative (Includes Savings from GMP-Exempt
Device Exclusion) ............................................................................................................................ 6-30
Table 6-27. Initial Labelers: Estimated Cost Savings Associated with Barcode Registration under the
Class I Static Barcoding Alternative ................................................................................................ 6-31

x
Table 6-28. Initial Labelers: Estimated Cost Savings Associated with Equipment Expenditures under the
Class I Static Barcoding Alternative (Includes Savings from GMP-Exempt Device Exclusion) .... 6-31
Table 6-29. Initial Labelers: Estimated Costs Savings for Label Materials and Printer Coordination under
the Class I Static Barcoding Alternative .......................................................................................... 6-32
Table 6-30. Initial Labelers: Estimated Cost Savings Associated with Software Expenditures under the
Class I Static Barcoding Alternative (Includes Savings from GMP-Exempt Device Exclusion) (a)
.. 6-
34
Table 6-31. Initial Labelers: Estimated Costs Savings Associated with GUDID under the Class I Static
Barcoding Alternative ...................................................................................................................... 6-34
Table 6-32. Initial Labelers: Total Costs Savings under the Class I Static Barcoding Alternative (Includes
Savings from GMP-Exempt Device Exclusion) .............................................................................. 6-35
Table 6-33. Repackagers/Relabelers: Estimated Cost Savings Associated with Administrative & Planning
Expenditures under the Class I Static Barcoding Alternative (Includes Savings from GMP-Exempt
Device Exclusion) ............................................................................................................................ 6-36
Table 6-34. Repackagers/Relabers: Estimated Cost Savings Associated with Barcode Registration under
the Class I Static Barcoding Alternative .......................................................................................... 6-36
Table 6-35. Repackagers/Relabelers: Estimated Cost Savings Associated with Equipment Expenditures
under the Class I Static Barcoding Alternative (Includes Savings from GMP-Exempt Device
Exclusion) ........................................................................................................................................ 6-37
Table 6-36. Repackagers/Relabelers: Estimated Cost Savings Associated with Label Materials and
Printer Coordination under the Class I Static Barcoding Alternative .............................................. 6-37
Table 6-37. Repackagers/Relabelers: Estimated Cost Savings Associated with Software Expenditures
under the Class I Static Barcoding Alternative (Includes Savings from GMP-Exempt Device
Exclusion) ........................................................................................................................................ 6-38
Table 6-38. Repackagers/Relabelers: Estimated Costs Savings Associated with GUDID under the Class I
Static Barcoding Alternative ............................................................................................................ 6-38
Table 6-39. Repackagers/Relablers: Total Estimated Cost Savings under the Class I Static Barcoding
Alternative (Includes Savings from GMP-Exempt Exclusion) ........................................................ 6-39
Table 6-40. Total Cost Savings for All Labelers under the Class I Static Barcoding Alternative (Includes
Savings from GMP-Exempt Exclusion) .......................................................................................... 6-39
Table 6-41. Total Costs Savings and Total Costs of the Class I Static BarcodingAlternative ................ 6-40
Table 6-42. Class I Static Barcoding with GMP-Exempt Devices Excluded and with Implementation
Time Considered .............................................................................................................................. 6-42

xi
Table 6-43. Cost to FDA of Creating and Maintaining the GUDID within the FURLS System ............. 6-45
Table 7-1. Number of Small Entities Affected by the Proposed Rule ....................................................... 7-3
Table 7-2. Aggregate Annualized Costs of Proposed Rule to Small Entities ............................................ 7-6
Table 7-3. Aggregate Annualized Costs to Small Entities under the ClassII/Class III UDI Alternative ... 7-9
Table 7-4. Count of Affected Small Firms Adjusted for Static Barcoding Assumption ......................... 7-10
Table 7-5. Number of Small Entities Affected under the Class I Static Barcoding Alternative .............. 7-11
Table 7-6. Cost Savings and Total Costs per Small Initial Labeling Firm Handling Class I Only Devices
under the Class I Static Alternative (a) ............................................................................................ 7-12
Table 7-7. Cost Savings and Total Costs per Small R/R Firm Handling Class I Only Devices under the
Class I Static Alternative (a) ............................................................................................................ 7-12
Table 8-1. Bounding Assumptions for the Major Cost Categories ............................................................ 8-2
Table 8-2. Bounding Estimates Reflecting Uncertainty in the Estimates Presented in Section Four ........ 8-6
Table 8-3. Bounding Estimates Reflecting Uncertainty in the Estimates Presented for the Class I Static
Barcoding Alternative ........................................................................................................................ 8-7
Table A-1. Identification of Labelers ........................................................................................................ A-2
Table A-2. Establishment Type Field Codes in FDA’s Registration and Listing Database ..................... A-4
Table A-1. Count of Labelers Using FDA’s Online Registration and Listing Database .......................... A-8
Table A-2. Number of Firms with Labeling Establishments Listed in FDA’s Registration and Listing
Database ............................................................................................................................................ A-9
Table A-1. Numbers of Domestic and Foreign Establishments by Location of Owner Firm ................. A-10


1-1
SE C T I ON ONE
E X E C UT I V E SUM M AR Y
The U.S. Food and Drug Administration (FDA) is proposing a rule requiring unique device
identification (UDI) for medical devices to meet the requirements of the Food and Drug Administration
Amendments Act (FDAAA) and to improve device safety and the reporting of device-related adverse
events. A UDI would be a unique numeric or alphanumeric identifier assigned to each device product,
consisting of a device identifier, which identifies the product and the labeler, and, in many cases, a
production identifier (lot, batch, serial number, or date). Lack of unique identifiers for medical devices
hinders identifying devices throughout their distribution and use, the reporting and analysis of adverse
event data, and the timely removal of recalled devices from medical uses.
Most of this report analyzes the requirements of a base case alternative that incorporates all of the
provisions of the proposed rule, but has more stringent requirements for class I devices. This base case
alternative was ultimately rejected by FDA. It would have required all classes of devices to be labeled
with both the device identifier and the production identifier (i.e., a variable barcode). FDA has, however,
selected an alternative that is identical to the base case except for the treatment of Class I devices. In the
selected alternative FDA has reduced the regulatory burden. Class II and Class III devices would be
required to have both the device identifier and the production identifier on their labels, but the selected
alternative would allow Class I devices to be labeled with just the device identifier (i.e., a static barcode).
FDA also added an exclusion to the original list of device exclusions that were used in most of the
analyses in this report. This exclusion applies to devices that are exempt from good manufacturing
practice (GMP) requirements. Such devices include bed pans and home-use toothbrushes, and FDA
proposes that these devices would not to be subject to UDI requirements.
Most of this report, therefore, estimates the costs that would be incurred by industry, UDI issuing
agencies, and FDA under a more costly regulatory alternative and uses these costs to assess the impacts of
the proposal on affected establishments, firms, and small businesses. This executive summary and Section
6.7 (in a section on regulatory alternatives) discusses the differences between the “base case” presented in
most sections of this report and FDA’s chosen alternative. These sections also discuss the costs savings
compared to the base case and present the total first year, recurring and annualized costs of the chosen
alternative.

1-2
1.1 SUM M AR Y OF T H E PR OPOSE D R UL E
The proposed UDI rule would require a numeric or alphanumeric identifier to be placed on the
label of most medical devices that are marketed and sold in the U.S., as well as on their device packages.1
The UDI would be required to appear both in a text format and in automatic identification and data
capture (AIDC) format (most typically, a machine-readable barcode). The form of this UDI would be
consistent with current barcoding configurations of two major barcoding organizations, GS1 (which is the
issuing body for UPC and similar trade-related codes) and the Health Industries Business
Communications Council (HIBCC). As noted above, the UDI is considered to consist of a device
identifier and a production identifier. The selected regulatory alternative for this proposal would allow
Class I devices to use just the device identifier as the UDI on those devices. Certain devices (e.g.,
implants, reusable surgical instruments (multi-use devices), and standalone software [software that is not
an integral component of a device]) would be required to have the UDI directly marked on the device
itself.2
Additionally, the UDI, certain basic identification and contact information, and key attributes of
the devices (e.g., sterile, or containing latex) would need to be uploaded to a database that would be
created and maintained by FDA. Medical device records throughout the required recordkeeping and
reporting systems would need to be modified so that UDIs can be included in such records. Additionally,
any dates appearing on medical device labels would need to be presented in a prescribed format.
In the remainder of this report following this executive summary, any mention of proposed rule
means the base case, unless specifically noted otherwise.
1.2 L AB E L E R C OST S T O I M PL E M E NT UNI QUE DE V I C E I DE NT I F I C AT I ON
ERG identified a number of costs facing medical device labelers as they comply with the
proposed rule, including planning costs, equipment costs (such as for digital printers for those
establishments needing to print variable barcodes), or increased printing costs (for those printing variable
barcodes who outsource printing), costs to obtain a UDI and register barcodes, costs to laser–etch (for
example) UDIs on medical devices for which direct marking (DM) is required, costs to change labels to
meet the requirements, costs to integrate UDI throughout the information systems at labeling firms to
ensure integration among processing systems and to ensure all relevant records contain UDIs, and costs to 1 Generally, the device package is the package containing one or more labeled devices of the same model or
version. 2 In the case of software, the UDI would need to be contained within the software, such as on a start-up
page.

1-3
meet data uploading requirements. Costs to all domestic medical device labelers are estimated for the base
case to be $396.3 million in the first year and $73.6 million in subsequent years. The chosen alternative
reduces these costs to $292.8 million in the first year and $46.7 million in subsequent years.
For comparison purposes with various alternatives and to show the effect of FDA’s proposal to
have implementation periods of up to 5 years (for Class I devices) and between 3 and 7 years for DM
requirements, total annualized costs are presented on two bases: (1) immediate implementation and (2)
under the proposed implementation schedule. Because any delay in outlays results in lower costs over
time, FDA’s proposed implementation schedule results in substantially lower costs than a scenario in
which all device labelers must immediately implement UDI, i.e., in the first scenario.3
1.2.1 I mmediate I mplementation C ost Scenar io
Under the immediate implementation assumption and with costs annualized at 7 percent over 10
years, first year costs are estimated at $56.4 million per year in the base case. With recurring costs added
in, total annualized costs to U.S. industry are estimated at $130.1 million per year in the base case.
FDA’s chosen alternative reduces these costs to $41.7 (annualized first year costs) and $88.4 million
(total annualized costs).
Issuing agencies are given responsibilities under the proposed regulation. Two organizations,
GS1 and HIBCC, already perform functions quite similar to the proposed requirements for issuing
agencies. Nevertheless, ERG assumed that organizations applying to become accredited issuing agencies
would incur costs to ensure that they understand and are comfortable with their legal responsibilities
under this proposal. ERG estimates the costs to the issuing agencies at $529,000 in the first year, nearly
all of which is allocated to executive and legal reviews of the FDA proposal. The recurring annual costs
are estimated at $54,800, including an allowance for ongoing executive and legal reviews. The total
annualized costs to the two organizations performing functions similar to issuing agencies are estimated at
$130,000 per year. (These costs are assumed to be incurred in the first year after promulgation of the
proposed rule, regardless of implementation scenario). FDA has made no changes to these costs under the
selected proposed rule. Under the immediate implementation scenario in the base case, total annualized 3 The immediate implementation scenario is not intended to consider the cost implications associated with
the difficulties of implementing such a complex rule in a short time frame. The cost estimated under this scenario, however, is used in Section Six to allow comparisons among several regulatory alternatives. This $130.1 million per year cost is not the regulatory cost of the rule because it does not take into account the additional time proposed by FDA for implementation.
1-4
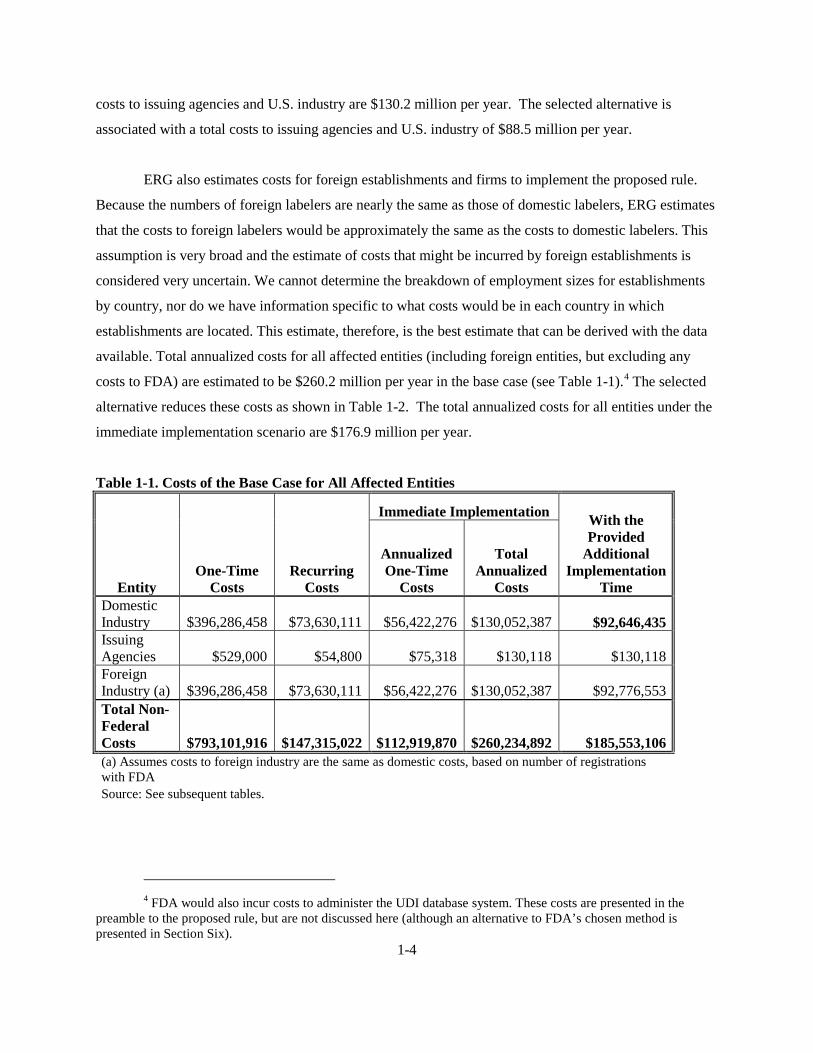
costs to issuing agencies and U.S. industry are $130.2 million per year. The selected alternative is
associated with a total costs to issuing agencies and U.S. industry of $88.5 million per year.
ERG also estimates costs for foreign establishments and firms to implement the proposed rule.
Because the numbers of foreign labelers are nearly the same as those of domestic labelers, ERG estimates
that the costs to foreign labelers would be approximately the same as the costs to domestic labelers. This
assumption is very broad and the estimate of costs that might be incurred by foreign establishments is
considered very uncertain. We cannot determine the breakdown of employment sizes for establishments
by country, nor do we have information specific to what costs would be in each country in which
establishments are located. This estimate, therefore, is the best estimate that can be derived with the data
available. Total annualized costs for all affected entities (including foreign entities, but excluding any
costs to FDA) are estimated to be $260.2 million per year in the base case (see Table 1-1).4
The selected
alternative reduces these costs as shown in Table 1-2. The total annualized costs for all entities under the
immediate implementation scenario are $176.9 million per year.
Table 1-1. Costs of the Base Case for All Affected Entities
Entity One-Time
Costs Recurring
Costs
Immediate Implementation With the Provided
Additional Implementation
Time
Annualized One-Time
Costs
Total Annualized
Costs Domestic Industry $396,286,458 $73,630,111 $56,422,276 $130,052,387 $92,646,435 Issuing Agencies $529,000 $54,800 $75,318 $130,118 $130,118 Foreign Industry (a) $396,286,458 $73,630,111 $56,422,276 $130,052,387 $92,776,553 Total Non-Federal Costs $793,101,916 $147,315,022 $112,919,870 $260,234,892 $185,553,106 (a) Assumes costs to foreign industry are the same as domestic costs, based on number of registrations with FDA Source: See subsequent tables.
4 FDA would also incur costs to administer the UDI database system. These costs are presented in the
preamble to the proposed rule, but are not discussed here (although an alternative to FDA’s chosen method is presented in Section Six).
1-5
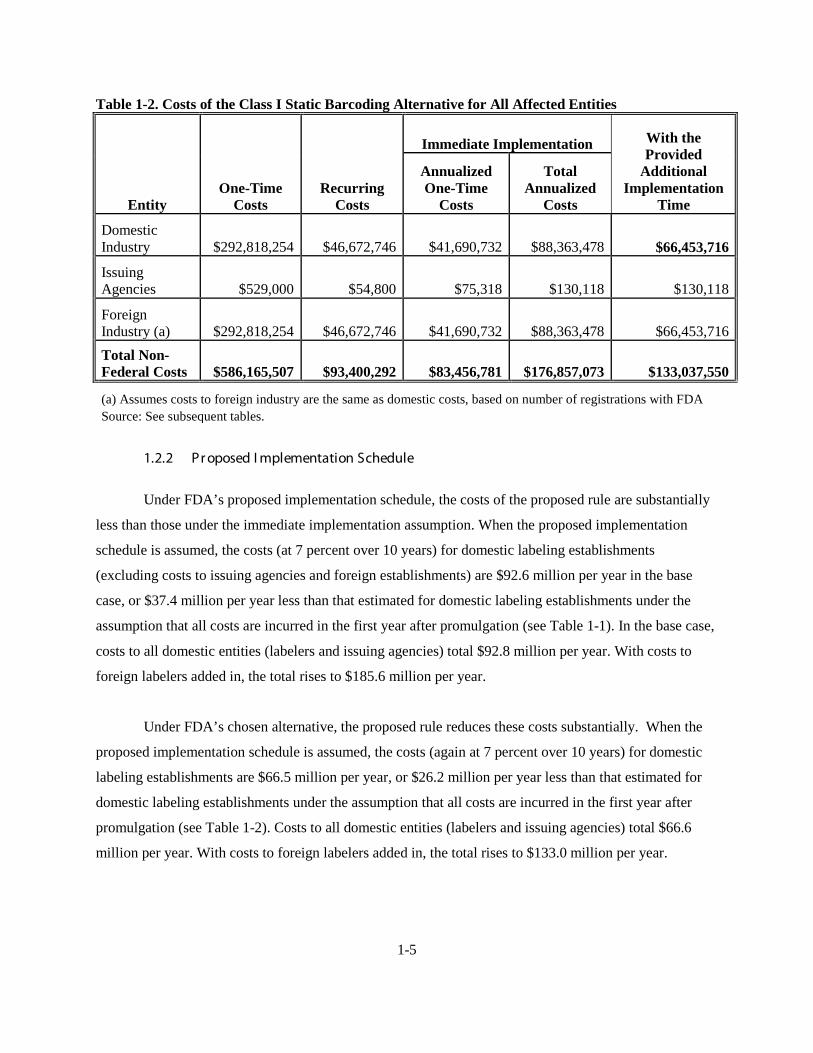
Table 1-2. Costs of the Class I Static Barcoding Alternative for All Affected Entities
Entity One-Time
Costs Recurring
Costs
Immediate Implementation With the Provided
Additional Implementation
Time
Annualized One-Time
Costs
Total Annualized
Costs
Domestic Industry $292,818,254 $46,672,746 $41,690,732 $88,363,478 $66,453,716
Issuing Agencies $529,000 $54,800 $75,318 $130,118 $130,118
Foreign Industry (a) $292,818,254 $46,672,746 $41,690,732 $88,363,478 $66,453,716 Total Non-Federal Costs $586,165,507 $93,400,292 $83,456,781 $176,857,073 $133,037,550
(a) Assumes costs to foreign industry are the same as domestic costs, based on number of registrations with FDA Source: See subsequent tables.
1.2.2 Pr oposed I mplementation Schedule
Under FDA’s proposed implementation schedule, the costs of the proposed rule are substantially
less than those under the immediate implementation assumption. When the proposed implementation
schedule is assumed, the costs (at 7 percent over 10 years) for domestic labeling establishments
(excluding costs to issuing agencies and foreign establishments) are $92.6 million per year in the base
case, or $37.4 million per year less than that estimated for domestic labeling establishments under the
assumption that all costs are incurred in the first year after promulgation (see Table 1-1). In the base case,
costs to all domestic entities (labelers and issuing agencies) total $92.8 million per year. With costs to
foreign labelers added in, the total rises to $185.6 million per year.
Under FDA’s chosen alternative, the proposed rule reduces these costs substantially. When the
proposed implementation schedule is assumed, the costs (again at 7 percent over 10 years) for domestic
labeling establishments are $66.5 million per year, or $26.2 million per year less than that estimated for
domestic labeling establishments under the assumption that all costs are incurred in the first year after
promulgation (see Table 1-2). Costs to all domestic entities (labelers and issuing agencies) total $66.6
million per year. With costs to foreign labelers added in, the total rises to $133.0 million per year.

1-6
1.3 I M PAC T S ON L AB E L I NG F I R M S AND E ST AB L I SH M E NT S
ERG investigated impacts of the costs to implement UDI on all domestic labeling firms.
Measureable impacts were defined as costs as a percentage of revenues exceeding 1 percent. Among all
domestic labelers under the base case, costs as a percentage of revenues exceed 1 percent only for a small
number of firms that would be required to directly mark certain devices. A total of 32 firms out of an
estimated 5,234 firms (0.6 percent) are estimated to incur compliance costs in excess of 1 percent of
revenues.5
If costs for DM are excluded, no firms would experience costs exceeding 1 percent of
revenues. DM requirements are associated with costly equipment such as laser markers that must be used
to inscribe the device identifier (but not the production identifier) on the device
Among those estimated to experience costs greater than 1 percent of revenues, all are considered
small businesses. These 32 firms are also 0.6 percent of an estimated 5,010 small businesses subject to the
rule as characterized in the base case.
For establishments, no establishments are expected to incur compliance costs greater than 1
percent of establishment revenues under the base case, unless they must satisfy DM requirements. When
DM requirements are considered, 32 establishments are estimated to incur costs greater than 1 percent of
revenues. These establishments are all considered single-facility firms and, therefore, are the same 32
entities identified in the firm impact analysis.
The impacts discussed for the base case are not expected to be much different under FDA’s
chosen alternative for the proposed rule. Because the only establishments that are estimated to incur costs
greater than one percent are a subset of those that must meet DM requirements and because DM would be
required under this alternative, as well, the impacts on firms discussed above could still occur. However,
some multi-use device manufacturers that are required to direct mark these primarily Class I devices,
could face substantially reduced total costs if all of their device labels require static barcodes only, rather
than the more costly variable barcodes. To the extent that this situation occurs, this alternative could
possibly reduce the number of firms estimated to incur costs exceeding 1 percent of revenues. We do not,
however, have any information on whether firms that only manufacture Class I devices and must direct
5 The count of 5,234 firms excludes those that are expected to meet exceptions or are considered to be in
compliance with the proposed rule in the baseline due to use of UPCs, but do include counts of those assumed to be in compliance with UDI requirements in the baseline.

1-7
mark some or all of those devices are among the groups of firms considered likely to face costs exceeding
1 percent of revenues.

2-1
SE C T I ON T W O
I NT R ODUC T I ON
2.1 B AC K G R OUND AND OR G ANI ZAT I ON OF T H E R E POR T
The Food and Drug Administration Amendments Act (FDAAA) of 2007 requires FDA to
propose a system for uniquely identifying medical devices using a unique device identifier (UDI). FDA
has worked for many years with the various stakeholders to create a proposed rule that is effective and is
compatible with systems that are in place for identifying medical devices for trade purposes and
Department of Defense (DOD) requirements.
This report provides information on the costs and impacts of the proposed rulemaking developed
by FDA. Section Two (this section) summarizes the rule. Section Three presents a profile of the entities
expected to be affected by the requirements to provide UDIs on medical devices. Section Four provides
an estimate of the costs of the proposed rule. Section Five presents the impacts of the rule on the affected
entities, both at the establishment and firm levels. Section Six provides costs and impacts of several
alternatives to the proposed rule. Section Seven presents the Initial Regulatory Impact Analysis, and
Section Eight presents the results of an uncertainty analysis.
2.2 SUM M AR Y OF T H E PR OPOSE D UDI R UL E
FDA is proposing that medical device labels must bear a UDI, and this rule is directed at labelers
of those devices. Labelers include both the original labelers of devices (typically the manufacturer of the
device) and relabelers (often an importer or a distributor of devices).6
6 Most distributors and many importers would not be considered labelers under this definition. Only those
distributors and importers that are subject to registration and listing requirements as relabelers/repackagers because they change the information appearing on a label are considered labelers. Distributors that add a “distributed by” note on a label but change no other information are not considered relabelers subject to registration and listing requirements.
Labelers are generally those who
place a label on a device, but, for the purposes of the proposed rule, some labelers are defined as such
because they “cause” a label to be placed (that is, manufacturers, labelers, and packagers acting under
contract to another establishment are not the labelers; the other establishments contracting with such
entities are the labelers). The requirements set forth in the proposed rule cover all classes of devices, with
2-2
the earliest deadlines applying to Class III devices (1 year after final publication of the rule),7
and
subsequent deadlines for Class II and Class I (and unclassified) devices (3 and 5 years after final
publication of the rule, respectively). FDA is defining medical devices to include: (1) kits (which contain
two or more devices packaged together for convenience of use) and (2) combination products (i.e., a
combination of a drug and a device) that are considered devices.
2.2.1 C omponents of the UDI
The UD I would comprise two parts: the device identifier and the production identifier. The
device identifier must identify both the labeler and the product. These identifiers would remain
unchanged as long as the device is manufactured and sold (thus, this portion of the UDI is known as the
static portion). The UDI must also identify whatever production identifiers are currently printed or
stamped on the labeling, for example, lot, batch or serial numbers, date of manufacture, or expiration date
(only one of these is required). Because they change frequently, production identifiers are considered the
variable portion of the UDI. Existing numbering systems could be used (assuming their issuing
organizations are accredited as issuing agencies by FDA).
2.2.2 Display of UDI on L abel
The UDI must be displayed in both easily readable plain-text (alphanumeric) and machine-
readable format (e.g., barcode); the machine-readable format (symbology) is not specified in the proposed
rule. FDA intends that the proposed rule be flexible and allow for changes in technology over time. By
not specifying a particular technology, FDA ensures that as technologies evolve, UDI displays can evolve
with them.
Certain items would also need to have the UDI marked directly and permanently on the device if
they do not have a label permanently affixed to them. These marks must be either easily read plain text or
in a machine-readable format. The devices affected include:
• Implantable devices (those to be implanted for more than 30 days).
• Devices used multiple times and intended to be sterilized (for example, surgical instruments).
7 Also requires devices licensed under the Public Health and Safety Act (PHSA) to come into compliance
within a year; few devices are licensed under this Act.

2-3
• Standalone software (i.e., software that is not a component of a medical device), which must be marked by inserting the UDI into the start up screen or into the “about” screen usually located under the help menu.
Reprocessed single-use devices are excluded from direct marking (DM) requirements.
No particular technology for DM is specified to allow for changing technologies; current
technologies might include laser etching, for example. The requirements for DM are subject to several
exceptions. If it is not technologically possible to mark the device (for example, the device’s material is
not suitable for DM), or marking the device would interfere with safe and effective use, DM is not
required, but an exception must be noted the design history file and notice provided to FDA. Furthermore,
exceptions are provided for devices that are intended for implanting for less than 30 days, software that is
a device component, and any device that was previously marked (therefore, previously marked devices
that are contained in a kit, are a part of a combination product, or are relabeled do not need to be re-
marked). In these cases, the reason for not marking the device would be included in the design history
file, but notice to FDA would not be required. (Additionally, devices required to be marked that are
contained in kits or combination products would not need to bear the same UDI as the kit or combination
product label.) Labelers can also choose to mark a UDI on their device that is different from the UDI
marked on the label to distinguish the device level from the labeling level.
2.2.3 E xceptions to the R ule
There are a few exceptions to the coverage of the proposed rule. Certain devices8
• Class I unit-of-use items (eaches) that are packaged together (e.g., in a shelf pack).
would not be
subject to the requirement to bear a UDI: 9
• Custom devices (e.g., those fabricated specifically for an individual patient).
• Other devices that are not in commercial circulation, such as investigational devices, those in research, etc.
• Other exceptions, granted on a case-by-case basis, might be offered by FDA.
8 In order to be covered by the proposed UDI rule, the item must be regulated as a device. If FDA does not
require the item to be listed, it is not a device (e.g., device components, raw materials). 9 The device package containing these items would need to bear a UDI.
2-4
Additionally, kits and combination devices must bear a UDI, but their individual components
might meet exceptions from this requirement under certain conditions. For kits, any device within the kit
that is intended for more than one single use must bear its own UDI (and if intended to be sterilized, it
must be directly marked). However, if it is intended for one single use (e.g., a cotton ball) the item does
not need a UDI. For combination products, if the device constituent is physically, chemically, or
otherwise combined with other constituents of the combination product in such a way that it is not
possible for the device constituent to be used except as part of the use of the combination product, the
individual constituents do not need to bear a UDI. Otherwise, they do.
Device packages that themselves contain device packages (in addition to the label on the device
itself or the label on the immediate outer packaging of the device) also require UDIs distinct from that on
the device packages within them, but shipping containers do not require UDIs. Furthermore, items sold
only at retail that bear a UPC are considered to currently meet the UDI requirements (they are allowed,
however, to also bear a UDI in addition to the UPC if the labeler chooses to do so).
2.2.4 I ssuance of UDI s and G lobal Unique I dentification Database
Either FDA or an accredited agency (“issuing agency”) would be authorized to issue UDIs. The
proposed rule would require issuing agencies to provide FDA with a variety of information, including
how they would ensure the compliance of their system with the requirements of the proposal, in order to
be accredited. Renewal applications would also need to be made. FDA would take over issuing of UDIs if
warranted (for example, if FDA considers fees charged to small businesses by an issuing agency
excessive or to ensure the proper oversight and functioning of the UDI system) and could revoke
authorization to issuing agencies, if warranted.
A key requirement of a UDI is that it must not be used to identify more than one version or model
of a device (e.g., one UDI cannot be associated with two different models of a device)10
10 Additional device packages (packaging configurations with varying numbers of devices within) each are
considered a different version or model of device).
and only one
UDI from an issuing agency must used for each version or model (e.g., two different UDIs from one
issuing agency cannot identify one device version or model). However, two or more UDIs, each assigned
by two or more issuing agencies, can be used on a label. Generally, the definition of “model or version” is
2-5
left to the labeler, who can continue to define these terms based on catalog number or other trade-based
designation, with the following restrictions:
• A change in the specifications, performance, size, or composition of the device to an extent greater than the specified limits requires the device to receive a new UDI.
• A change to the device package (for example, from a package containing 10 devices to
one containing 12) or the addition of a new device package would entail a new UDI.
• A change that could significantly affect the safety or effectiveness of the device would require a change in the UDI.
• A change from sterile to non-sterile (or vice versa) would require a change in UDI.
• A device that is relabeled (with a change to a label that entails more than an addition of
information such as a distributor’s name and contact information) would need to receive a new UDI.
UDIs of discontinued devices could not be used again for any other device, although if the same
device is reintroduced unchanged, the former UDI could be reused.
In addition to providing a UDI or UPC on their device labels, all labelers would be required to
submit information to FDA specific to each device that bears a UDI or UPC (voluntary users of UDI are
not required to submit information but may do so). This information must be provided electronically,
unless an exception is made.
FDA would maintain a database of the submitted information, which would be called the Global
Unique Device Identification Database (GUDID). The database would be made publicly available, with
the exception of device listing number. The information required for submission to the GUDID includes:
• Labeler name and contact information.
• The issuing agency or agencies name(s).
• Information on the model or version of the device.
o The device identifier portion of the UDI (i.e., the static information).
o The device identifier previously associated with a device (if a device is
relabeled, this would be the manufacturer’s original UDI).

2-6
o If the device is permanently marked, an indication that the permanent marking is
the same UDI as on the label, or, if different, the device identifier marked on the device.
o The brand or trade name of the device.
o The model number, version number, or similar reference that appears on the
label of the device.
o Whether the device is sterile or contains natural latex.
o The size of the device (if produced in more than one size; for example, catheters are available in several diameters) and unit of measure.
o Type of production identifier (e.g., batch or serial number).
o Premarket submission number or note of exemption.
o Listing number.
o The Global Medical Device Nomenclature Code (GMDN), which specifies the
type of device.11
o The total number of individual devices contained in the device package.
Additionally, FDA might permit additional information to be provided voluntarily (ancillary
information).
FDA would also require UDIs to be included in device records and reports, such as those required
under various device tracking and recordkeeping and reporting regulations (these are the “conforming
amendments”). Additionally, the proposed rule adds a paragraph to labeling requirements that
standardizes the date format for all labels containing an expiration date, date of manufacture, or any other
date. All such dates would be required to be in the format of Month, Day, Year, e.g., (JAN 1, 2012). The
date format and conforming amendment provisions would need to be met 90 days after promulgation of
the final rule. (The conforming amendment requirements, however, would have no practical effect until
UDIs are required to be on labeling.)
11 Currently the GMDN is managed by an agency that charges a substantial fee for its use. FDA plans to
remove the requirement for the GMDN from the rulemaking prior to promulgation if the GMDN information is not free by that time.
3-1
SE C T I ON T H R E E
PR OF I L E OF T H E AF F E C T E D E NT I T I E S
3.1 I DE NT I F Y I NG T H E AF F E C T E D UNI V E R SE OF M E DI C AL DE V I C E L A B E L E R S
Many different entities handle some aspect of the manufacturing, labeling, and distribution of
medical devices. Based on FDA’s definition of labeler in the proposed rule, the affected entities are
expected to include manufacturers, single-use device reprocessors (which take single use devices, sterilize
them, and return them to the end user), specification developers (who oversee the manufacture of devices
by contract manufacturers), 12 and relabelers/repackagers (R/Rs).13
Table 3-1
The R/R group includes importers who
replace foreign labels with U.S.-approved labels and establishments that package medical devices in kits,
break up large packages of unlabeled devices and repackage and label them, etc. The specification
developers design the medical devices and provide a contract manufacturer with the exact specifications
to manufacture the device. FDA requires all establishments that perform any of these operations on
medical devices to register and to list each type of medical device that they handle. This information is
compiled into FDA’s registration and listing database (FDA, 2010a). The types of entities that must
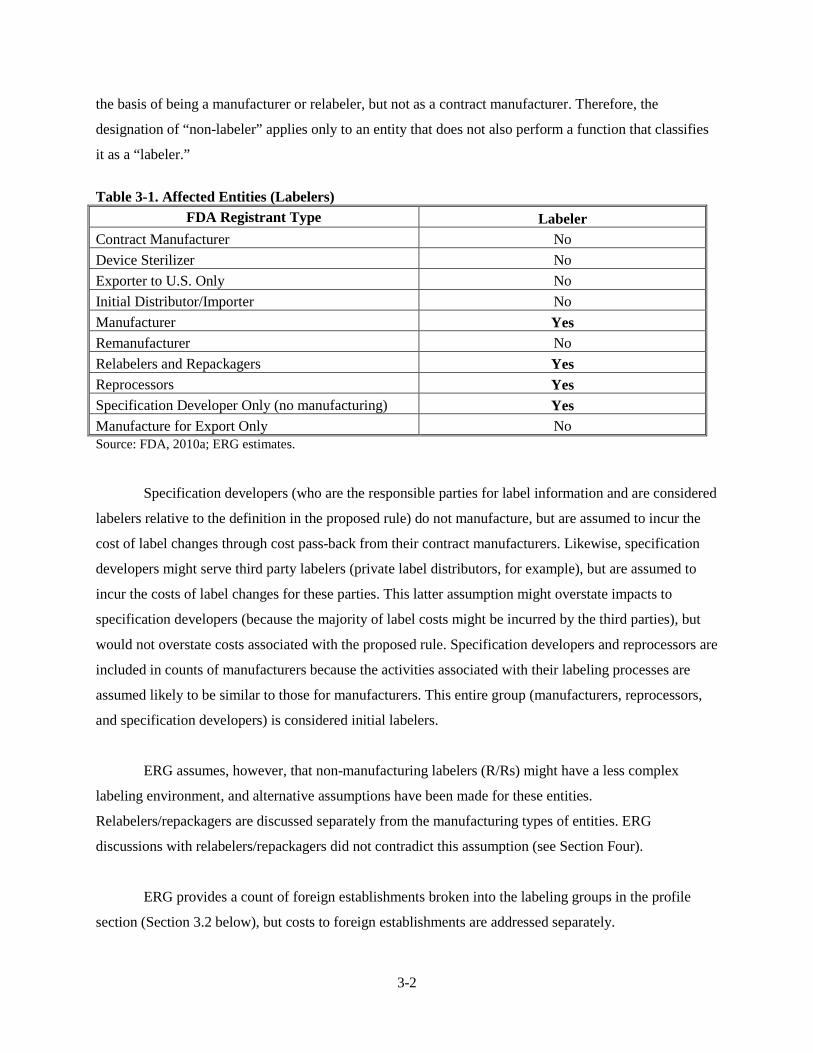
register are shown in . The table indicates which types are considered labelers (and, thus, are
considered affected by the proposed rule) and which are not. The rationale for this selection is outlined in
Appendix A.
Each registered entity must indicate all of the applicable types of devices it handles by the type of
device process in which the entity is involved (e.g., manufacturer, R/R, specification developer). As an
example, one entity might manufacture one type of device, remanufacture that same device, import and
relabel a second device, and act as a specification developer on a third device. Such an entity would have
three unique device listings14
12 The specification developer contracts with the contract manufacturer, who places the label, but the
specification developer is the entity considered the party that causes the label to be placed. Therefore, under the definition of labeler, the specification developer is the labeler and the contract manufacturer is not.
for the three types of devices it handles, and one listing would indicate two
different establishment types (for the one device that the establishment both manufactures and
remanufactures). Note that some of the entities considered non-labelers (e.g., a contract manufacturer)
might also be classified as a manufacturer or relabeler. Such an entity would be considered a labeler on
13 Contract labelers and packagers are not subject to the proposed rule. Some FDA registrants are possibly contract labelers and packagers; no adjustments were made to the count of R/Rs to account for these. Actual impacts would fall on the party contracting for the relabeling.
14 The listing by device type is a broader classification than an individual product; one device listing could relate to dozens of what would be considered different devices under a UDI definition.
3-2
the basis of being a manufacturer or relabeler, but not as a contract manufacturer. Therefore, the
designation of “non-labeler” applies only to an entity that does not also perform a function that classifies
it as a “labeler.”
Table 3-1. Affected Entities (Labelers)
FDA Registrant Type Labeler Contract Manufacturer No Device Sterilizer No Exporter to U.S. Only No Initial Distributor/Importer No Manufacturer Yes Remanufacturer No Relabelers and Repackagers Yes Reprocessors Yes Specification Developer Only (no manufacturing) Yes Manufacture for Export Only No Source: FDA, 2010a; ERG estimates.
Specification developers (who are the responsible parties for label information and are considered
labelers relative to the definition in the proposed rule) do not manufacture, but are assumed to incur the
cost of label changes through cost pass-back from their contract manufacturers. Likewise, specification
developers might serve third party labelers (private label distributors, for example), but are assumed to
incur the costs of label changes for these parties. This latter assumption might overstate impacts to
specification developers (because the majority of label costs might be incurred by the third parties), but
would not overstate costs associated with the proposed rule. Specification developers and reprocessors are
included in counts of manufacturers because the activities associated with their labeling processes are
assumed likely to be similar to those for manufacturers. This entire group (manufacturers, reprocessors,
and specification developers) is considered initial labelers.
ERG assumes, however, that non-manufacturing labelers (R/Rs) might have a less complex
labeling environment, and alternative assumptions have been made for these entities.
Relabelers/repackagers are discussed separately from the manufacturing types of entities. ERG
discussions with relabelers/repackagers did not contradict this assumption (see Section Four).
ERG provides a count of foreign establishments broken into the labeling groups in the profile
section (Section 3.2 below), but costs to foreign establishments are addressed separately.
3-3
3.2 PR OF I L E OF AF F E C T E D E ST AB L I SH M E NT S
3.2.1 M anufactur er s of M edical Devices
The U.S. medical device industry manufacturing industry is extremely diverse. Medical devices
vary dramatically in size, complexity, packaging, and use in medical practices. They include disease
screening technologies, therapies, equipment, and supplies—everything from expensive, complex capital
equipment (x-ray machines) to simple items (bandages, tongue depressors). Some are packaged
individually and others are packaged in boxes of hundreds or thousands. They may be used once and
thrown away, used and reprocessed, or used for their lifetimes. Some devices are implanted; these carry a
particular set of risks to the patient.
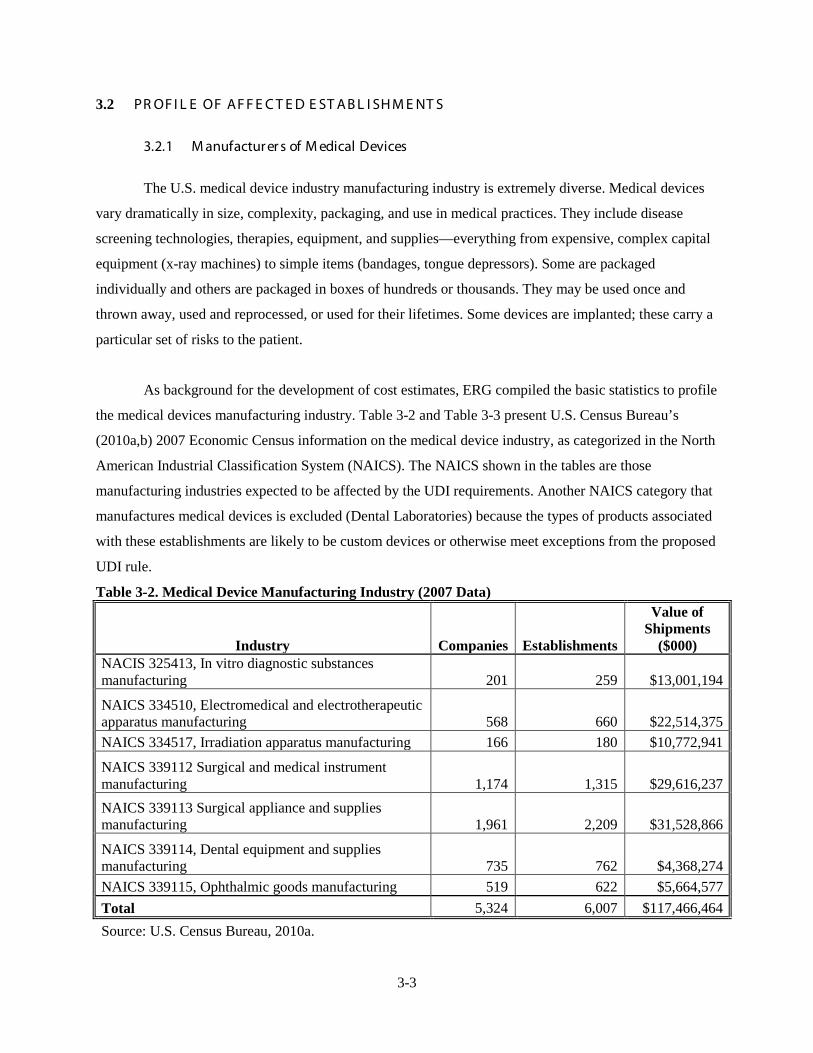
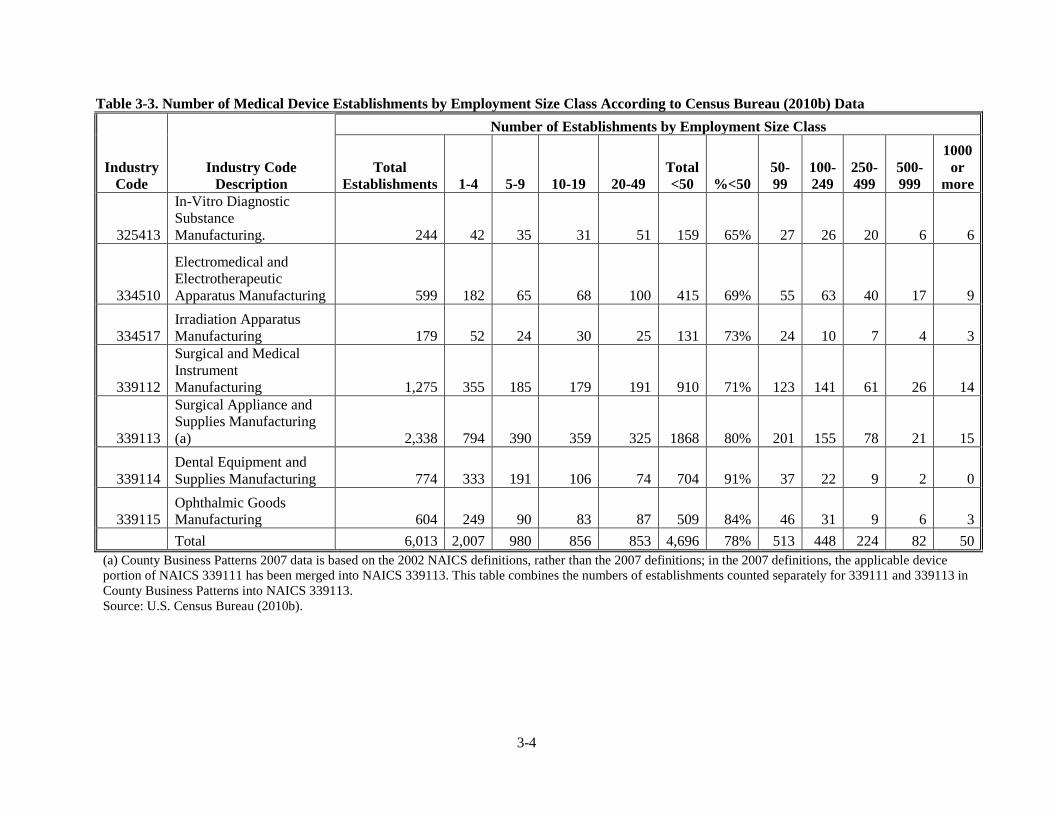
As background for the development of cost estimates, ERG compiled the basic statistics to profile
the medical devices manufacturing industry. Table 3-2 and Table 3-3 present U.S. Census Bureau’s
(2010a,b) 2007 Economic Census information on the medical device industry, as categorized in the North
American Industrial Classification System (NAICS). The NAICS shown in the tables are those
manufacturing industries expected to be affected by the UDI requirements. Another NAICS category that
manufactures medical devices is excluded (Dental Laboratories) because the types of products associated
with these establishments are likely to be custom devices or otherwise meet exceptions from the proposed
UDI rule.
Table 3-2. Medical Device Manufacturing Industry (2007 Data)
Industry Companies Establishments
Value of Shipments
($000) NACIS 325413, In vitro diagnostic substances manufacturing 201 259 $13,001,194
NAICS 334510, Electromedical and electrotherapeutic apparatus manufacturing 568 660 $22,514,375 NAICS 334517, Irradiation apparatus manufacturing 166 180 $10,772,941
NAICS 339112 Surgical and medical instrument manufacturing 1,174 1,315 $29,616,237 NAICS 339113 Surgical appliance and supplies manufacturing 1,961 2,209 $31,528,866
NAICS 339114, Dental equipment and supplies manufacturing 735 762 $4,368,274 NAICS 339115, Ophthalmic goods manufacturing 519 622 $5,664,577 Total 5,324 6,007 $117,466,464 Source: U.S. Census Bureau, 2010a.
3-4
Table 3-3. Number of Medical Device Establishments by Employment Size Class According to Census Bureau (2010b) Data
Industry Code
Industry Code Description
Number of Establishments by Employment Size Class
Total Establishments 1-4 5-9 10-19 20-49
Total <50 %<50
50-99
100-249
250-499
500-999
1000 or
more
325413
In-Vitro Diagnostic Substance Manufacturing. 244 42 35 31 51 159 65% 27 26 20 6 6
334510
Electromedical and Electrotherapeutic Apparatus Manufacturing 599 182 65 68 100 415 69% 55 63 40 17 9
334517 Irradiation Apparatus Manufacturing 179 52 24 30 25 131 73% 24 10 7 4 3
339112
Surgical and Medical Instrument Manufacturing 1,275 355 185 179 191 910 71% 123 141 61 26 14
339113
Surgical Appliance and Supplies Manufacturing (a) 2,338 794 390 359 325 1868 80% 201 155 78 21 15
339114 Dental Equipment and Supplies Manufacturing 774 333 191 106 74 704 91% 37 22 9 2 0
339115 Ophthalmic Goods Manufacturing 604 249 90 83 87 509 84% 46 31 9 6 3
Total 6,013 2,007 980 856 853 4,696 78% 513 448 224 82 50 (a) County Business Patterns 2007 data is based on the 2002 NAICS definitions, rather than the 2007 definitions; in the 2007 definitions, the applicable device portion of NAICS 339111 has been merged into NAICS 339113. This table combines the numbers of establishments counted separately for 339111 and 339113 in County Business Patterns into NAICS 339113. Source: U.S. Census Bureau (2010b).

3-5
As the table indicates, there are over 6,000 manufacturing establishments in industries expected
to be affected by the proposed rule reported in the 2007 Economic Census. Among these, a large majority
(78 percent) are very small establishments, i.e., establishments with fewer than 50 employees (see Table
3-3).
Census data, however, does not correspond exactly with the more precise identification of the
affected establishments found in FDA registration data. FDA requires all medical device owner operators
of establishments that are involved in the manufacture or distribution of medical devices intended for use
in the United States to register, and in most cases, to list the types of devices they handle. ERG
investigated FDA’s registration database to determine a count of establishments likely to be labeling. This
database indicates that 4,901 registrants are U.S. manufacturing establishments (see Appendix A for a
detailed description of how the database was used to identify affected establishments and firms).
Additionally 4,241 domestic owner operators own manufacturing establishments. All further discussion
of affected entities in the remainder of this section focus primarily on domestic firms and establishments.
Neither registrants nor owner operators map precisely to the Census data. Registrants do not map
for several reasons. First, we have not considered contract manufacturers in the count of registrants, while
Census data places contract manufacturers in the manufacturing NAICS groups. Second, some
manufacturers listed in the Census data manufacture only components, not the final device and, thus, do
not register and would not be affected by UDI requirements.
Counts of owner operators also do not map to Census firm counts for similar reasons. Some 200
domestic firms with manufacturing establishments own no domestic manufacturing establishments, but
only foreign manufacturing establishments. It is also possible that some medical device establishments are
not in compliance with FDA registration and listing requirements. Despite this possibility, we judged that
the most accurate count of the affected entities is that drawn from the registration data.
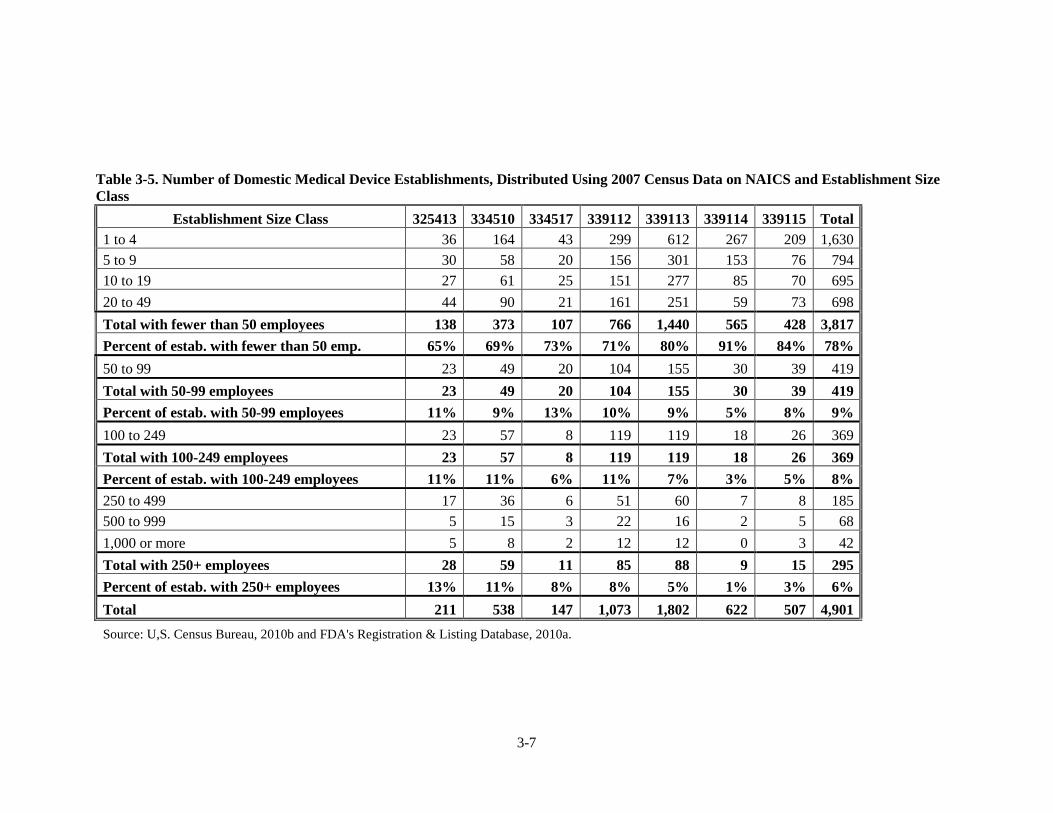
The size and industry classifications cannot be determined easily from the FDA data. Therefore,
to estimate industry classifications and sizes for the registered establishment, ERG distributed the
registrants using the proportions of establishments by industry type and employment size groupings of
establishments found in Census data. Table 3-4 presents the numbers of establishments that are registered
as manufacturers, reprocessors, repackagers/relabelers, and specification developers according to FDA’s
database. These establishments are presumed to be the affected labelers that would be subject to a UDI

3-6
requirement. Table 3-5 presents the total number of domestic registrants (establishments) identified as
manufacturers in FDA’s database distributed by NAICS and employment size categories based on Census
information as presented in Table 3-3.
Table 3-4. Registrant (Establishment) Counts from FDA's Registration and Listing On-Line Database
Type of Registrant Total Establishments
Total Registrants Domestic Foreign Manufacturers 4,901 6,492 11,393 Reprocessors 21 3 24 Specification Developers 1,346 276 1,622 Relabelers/Repackagers 1,310 320 1,630
Total Labelers 7,578 7,091 14,669 Remanufacturers 49 52 101 Sterilizers 16 49 65 Contract Manufacturers 278 576 854
All Others (distributors, importers, U.S. export only, export only to U.S. NA NA 5,453 All Registrants 21,142 Note: Two facilities were added to the count of reprocessors. Although FDA's web-based search indicates a firm with two facilities acting as a 3rd party reprocessor, the online database shows the establishments registered but no listings link to these registrations. Source: FDA Registration & Listing Database, online version, March 4, 2010 (FDA, 2010a). See Appendix A.
Registrants can be traced to owner firms in the FDA database. Table 3-6 presents the numbers of
owner firms that are associated with each of the four main labeling types of establishments. Note that
there is some double counting of firms when the firms by establishment type have been disaggregated.
The total double count is 209 firms.15
Table 3-7
Double counting of firms is adjusted later in this report when costs
on a firm basis are estimated (see Section Four). The 4,241 domestic manufacturing firms are distributed
using Census information and Small Business Administration (SBA) data into NAICS and employment
size categories as shown in .
15 Later in Section Four, this double count is removed from analyses using assumptions about the
percentage of firms affected at each size. The number of double counted firms resulting from using percentages is 210. For simplicity, this number, 210, is used as an approximation of the 209 double counted firms.
3-7
Table 3-5. Number of Domestic Medical Device Establishments, Distributed Using 2007 Census Data on NAICS and Establishment Size Class
Establishment Size Class 325413 334510 334517 339112 339113 339114 339115 Total 1 to 4 36 164 43 299 612 267 209 1,630 5 to 9 30 58 20 156 301 153 76 794 10 to 19 27 61 25 151 277 85 70 695 20 to 49 44 90 21 161 251 59 73 698 Total with fewer than 50 employees 138 373 107 766 1,440 565 428 3,817 Percent of estab. with fewer than 50 emp. 65% 69% 73% 71% 80% 91% 84% 78% 50 to 99 23 49 20 104 155 30 39 419 Total with 50-99 employees 23 49 20 104 155 30 39 419 Percent of estab. with 50-99 employees 11% 9% 13% 10% 9% 5% 8% 9% 100 to 249 23 57 8 119 119 18 26 369 Total with 100-249 employees 23 57 8 119 119 18 26 369 Percent of estab. with 100-249 employees 11% 11% 6% 11% 7% 3% 5% 8% 250 to 499 17 36 6 51 60 7 8 185 500 to 999 5 15 3 22 16 2 5 68 1,000 or more 5 8 2 12 12 0 3 42 Total with 250+ employees 28 59 11 85 88 9 15 295 Percent of estab. with 250+ employees 13% 11% 8% 8% 5% 1% 3% 6% Total 211 538 147 1,073 1,802 622 507 4,901 Source: U,S. Census Bureau, 2010b and FDA's Registration & Listing Database, 2010a.
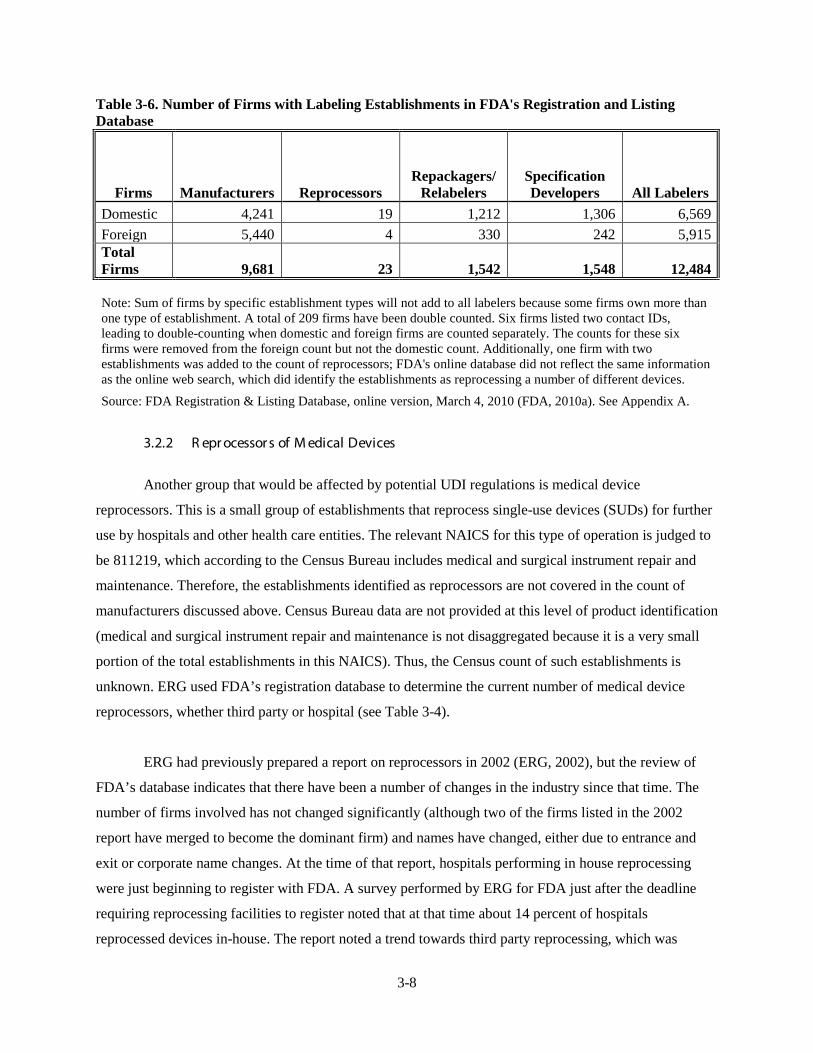
3-8
Table 3-6. Number of Firms with Labeling Establishments in FDA's Registration and Listing Database
Firms Manufacturers Reprocessors Repackagers/
Relabelers Specification Developers All Labelers
Domestic 4,241 19 1,212 1,306 6,569 Foreign 5,440 4 330 242 5,915 Total Firms 9,681 23 1,542 1,548 12,484
Note: Sum of firms by specific establishment types will not add to all labelers because some firms own more than one type of establishment. A total of 209 firms have been double counted. Six firms listed two contact IDs, leading to double-counting when domestic and foreign firms are counted separately. The counts for these six firms were removed from the foreign count but not the domestic count. Additionally, one firm with two establishments was added to the count of reprocessors; FDA's online database did not reflect the same information as the online web search, which did identify the establishments as reprocessing a number of different devices.
Source: FDA Registration & Listing Database, online version, March 4, 2010 (FDA, 2010a). See Appendix A.
3.2.2 R epr ocessor s of M edical Devices
Another group that would be affected by potential UDI regulations is medical device
reprocessors. This is a small group of establishments that reprocess single-use devices (SUDs) for further
use by hospitals and other health care entities. The relevant NAICS for this type of operation is judged to
be 811219, which according to the Census Bureau includes medical and surgical instrument repair and
maintenance. Therefore, the establishments identified as reprocessors are not covered in the count of
manufacturers discussed above. Census Bureau data are not provided at this level of product identification
(medical and surgical instrument repair and maintenance is not disaggregated because it is a very small
portion of the total establishments in this NAICS). Thus, the Census count of such establishments is
unknown. ERG used FDA’s registration database to determine the current number of medical device
reprocessors, whether third party or hospital (see Table 3-4).
ERG had previously prepared a report on reprocessors in 2002 (ERG, 2002), but the review of
FDA’s database indicates that there have been a number of changes in the industry since that time. The
number of firms involved has not changed significantly (although two of the firms listed in the 2002
report have merged to become the dominant firm) and names have changed, either due to entrance and
exit or corporate name changes. At the time of that report, hospitals performing in house reprocessing
were just beginning to register with FDA. A survey performed by ERG for FDA just after the deadline
requiring reprocessing facilities to register noted that at that time about 14 percent of hospitals
reprocessed devices in-house. The report noted a trend towards third party reprocessing, which was
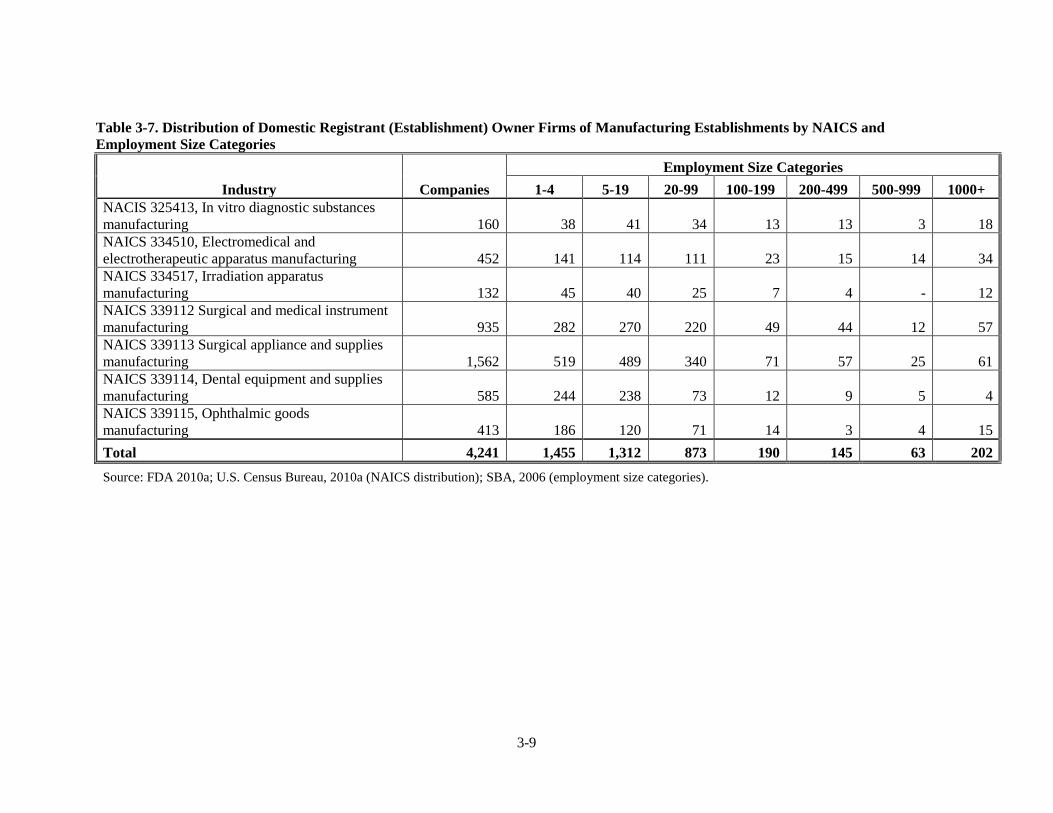
3-9
Table 3-7. Distribution of Domestic Registrant (Establishment) Owner Firms of Manufacturing Establishments by NAICS and Employment Size Categories
Industry Companies Employment Size Categories
1-4 5-19 20-99 100-199 200-499 500-999 1000+ NACIS 325413, In vitro diagnostic substances manufacturing 160 38 41 34 13 13 3 18 NAICS 334510, Electromedical and electrotherapeutic apparatus manufacturing 452 141 114 111 23 15 14 34 NAICS 334517, Irradiation apparatus manufacturing 132 45 40 25 7 4 - 12 NAICS 339112 Surgical and medical instrument manufacturing 935 282 270 220 49 44 12 57 NAICS 339113 Surgical appliance and supplies manufacturing 1,562 519 489 340 71 57 25 61 NAICS 339114, Dental equipment and supplies manufacturing 585 244 238 73 12 9 5 4 NAICS 339115, Ophthalmic goods manufacturing 413 186 120 71 14 3 4 15 Total 4,241 1,455 1,312 873 190 145 63 202 Source: FDA 2010a; U.S. Census Bureau, 2010a (NAICS distribution); SBA, 2006 (employment size categories).

3-10
probably due to requirements for hospitals to meet registration and premarket requirements. Only one
hospital currently appears in the FDA registry; whether this is due to non-compliance or nearly complete
reliance on third party reprocessing is not certain.
According to FDA’s registration and listing database, the large majority of establishments that
register and list as reprocessors are also manufacturers of medical devices. These facilities, which might
be reprocessing their own devices, are assumed to be captured in the count of manufacturers used in this
analysis.
Some of the reprocessors repackage and relabel, but as explained in Appendix A, these are
counted as reprocessors and are excluded from the R/R counts. Only 21 facilities are registered as
domestic reprocessors (and are not manufacturers). There are 19 domestic U.S. firms with reprocessing
establishments.
Of these 21 facilities, one is owned by a large not-for-profit hospital chain (which lists only one
device). Another seven are third party reprocessors (reprocessing is their main line of business). The
remaining facilities appear to reprocess only incidentally. ERG investigated all but the hospital online.
Only two do not have a web site. Table 3-8 presents the distribution of reprocessors into employment size
classes, using the assumptions indicated in the table. ERG analyzes all initial labelers together in Section
Four, applying the estimated per-facility compliance costs for manufacturing establishments to the
reprocessing establishments because these initial labeler operations (reprocessing) are considered similar
to those for manufacturing establishments.
These 21 domestic facilities are owned by 19 domestic firms. These firms have also been
distributed by size class. All but two firms are single facility firms, so their size generally depends on the
size of the facility. One firm with two facilities is placed in the 500-999 employment size group. The
other firm is assumed to own two establishments in the 20-49 size, creating one fewer firm than the
number of establishments in the 20-99 employees firm size (see Table 3-9).
3.2.3 Specification Developer s
Specification developers are defined as those that design specifications for medical devices but do
not themselves manufacture the devices. Contract manufacturers handle the manufacturing of the devices
to those specifications. The ultimate responsibility for the devices, however, rests with the specification
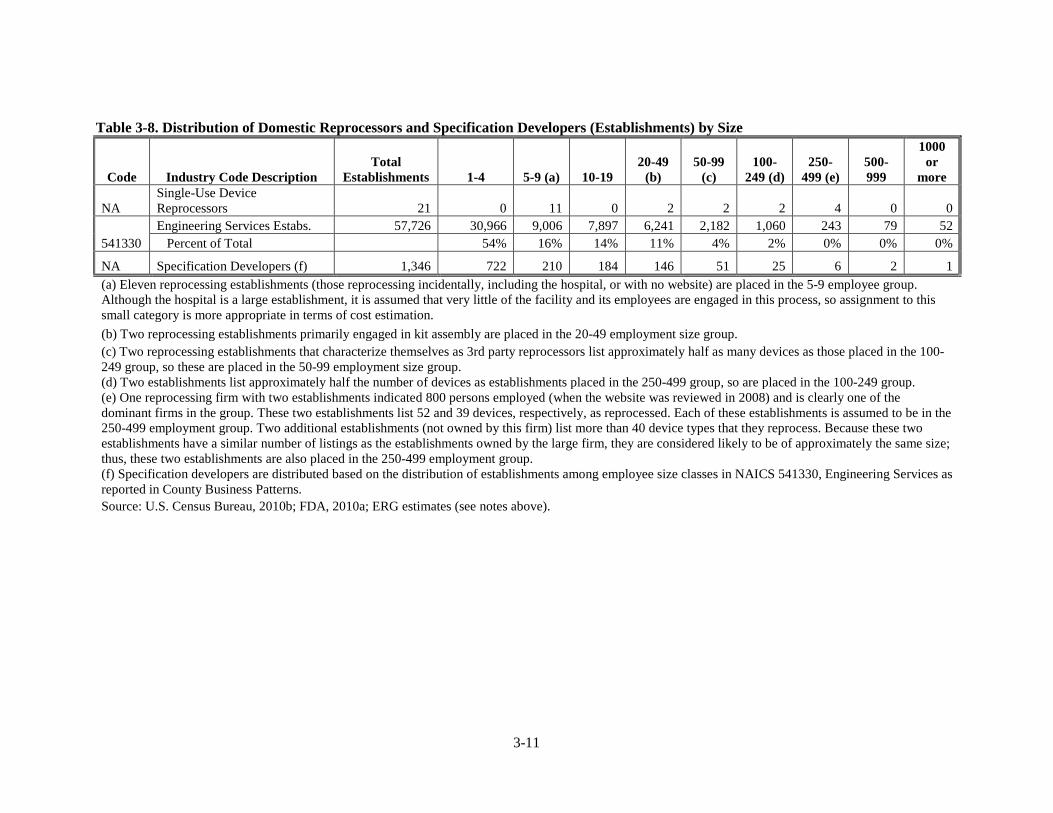
3-11
Table 3-8. Distribution of Domestic Reprocessors and Specification Developers (Establishments) by Size
Code Industry Code Description Total
Establishments 1-4 5-9 (a) 10-19 20-49
(b) 50-99
(c) 100-
249 (d) 250-
499 (e) 500-999
1000 or
more
NA Single-Use Device Reprocessors 21 0 11 0 2 2 2 4 0 0
541330 Engineering Services Estabs. 57,726 30,966 9,006 7,897 6,241 2,182 1,060 243 79 52 Percent of Total 54% 16% 14% 11% 4% 2% 0% 0% 0%
NA Specification Developers (f) 1,346 722 210 184 146 51 25 6 2 1 (a) Eleven reprocessing establishments (those reprocessing incidentally, including the hospital, or with no website) are placed in the 5-9 employee group. Although the hospital is a large establishment, it is assumed that very little of the facility and its employees are engaged in this process, so assignment to this small category is more appropriate in terms of cost estimation. (b) Two reprocessing establishments primarily engaged in kit assembly are placed in the 20-49 employment size group. (c) Two reprocessing establishments that characterize themselves as 3rd party reprocessors list approximately half as many devices as those placed in the 100-249 group, so these are placed in the 50-99 employment size group. (d) Two establishments list approximately half the number of devices as establishments placed in the 250-499 group, so are placed in the 100-249 group. (e) One reprocessing firm with two establishments indicated 800 persons employed (when the website was reviewed in 2008) and is clearly one of the dominant firms in the group. These two establishments list 52 and 39 devices, respectively, as reprocessed. Each of these establishments is assumed to be in the 250-499 employment group. Two additional establishments (not owned by this firm) list more than 40 device types that they reprocess. Because these two establishments have a similar number of listings as the establishments owned by the large firm, they are considered likely to be of approximately the same size; thus, these two establishments are also placed in the 250-499 employment group. (f) Specification developers are distributed based on the distribution of establishments among employee size classes in NAICS 541330, Engineering Services as reported in County Business Patterns. Source: U.S. Census Bureau, 2010b; FDA, 2010a; ERG estimates (see notes above).

3-12
Table 3-9. Distribution of Reprocessor and Specification Developer Firms with Total Firms Analyzed as Domestic Initial Labelers
Code Industry Code Description Total Firms 1-4 5-19 20-99 100-199
200-499
500-999 1000+
NA Single-Use Device Reprocessors 19 0 11 3 2 2 1 0
541330 Engineering Services Estabs. 46,761 27,530 12,562 5,109 664 407 160 329 Percent of Total 59% 27% 11% 1% 1% 0% 1%
NA Specification Developers 1,306 769 351 143 19 11 4 9 NA Total Manufacturers 4,241 1,455 1,312 873 190 145 63 202 NA All Initial Labelers 5,566 2,224 1,674 1,019 210 159 68 212
Source: FDA, 2010a; U.S. Census Bureau, 2010b.
3-13
developer. It is these establishments that are required to keep the device records, including labeling
records. Some specification development is done under the specification developer’s brand; other times,
specification developers are contracted by private label distributors to provide the specifications and
coordinate the manufacturing of the device to those specifications. Distributors are not allowed to list
devices in FDA’s database, however, and do not keep the device records. In the first case, where the
specification developer and the contract manufacturer are the only parties involved, we assume that the
costs of labeling are ultimately borne by the specification developer. In the second case, where a third
party private labeler is involved, it is still assumed that the specification developer is the UDI labeler of
record and incurs the immediate costs of any UDI requirements. Some of these costs might be passed to
the third-party private labeler or the labeler might handle the actual label application and thereby incur
costs. Nevertheless, we assume that the specification developers bear the costs and impacts because there
is no way to clearly determine the extent of third-party interactions.
FDA’s database indicates that there are 1,346 domestic specification development establishments
and 1,306 U.S. firms with specification development establishments. (These counts do not include
manufacturers or reprocessors, which might also be classified as specification developers).
The specification developers appear to be classified in NAICS 541330, Engineering Services. The
1,346 domestic specification developer establishments are distributed into employment size classes based
on the distributions in this NAICS in County Business Patterns (U.S. Census Bureau, 2010). These
establishments, as initial labelers, will be analyzed with manufacturers because it is assumed specification
developers would have similar complexities of labeling and recordkeeping as manufacturers. The
distribution of these establishments can be seen in Table 3-8. Domestic firms owning specification
developers are also distributed on the basis of employment size, as shown in Table 3-9.
3.2.4 R epackager s and R elabeler s of M edical Devices
A UDI requirement would also apply to R/Rs of medical devices, many of which also
manufacture medical devices. Many relabeling establishments are also involved in initial labeling and are
captured in the count of manufacturers shown in Table 3-5 or in counts of reprocessors or specification
developers. Nevertheless, some R/Rs do no manufacturing, reprocessing, or specification development
and are additional to the count of affected establishments estimated above. As Table 3-4 showed, ERG
identified 1,310 domestic establishments that were not captured as manufacturing, reprocessing, or

3-14
specification development establishments and are included in the estimates of those affected by the
proposed UDI rulemaking.
To develop additional information on these R/R establishments, using a previously generated list
of registrants (from 2008), ERG randomly selected 16 R/Rs and investigated their Internet websites to
determine if they had company websites and/or product catalogs. ERG also contacted several of these
establishments, as discussed below. For the most part, the R/R establishments appeared to be medical
device distributors (wholesalers), although some distributed medical devices as an adjunct to
manufacturing operations. Additionally, a few were contract packager/labelers in addition to repackaging
or relabeling at least one device.
Of the 16 establishments investigated online, 6 indicated they were very small or handled very
few products (fewer than about 20 different devices; in one case one of the establishments appeared to
handle only one product with only a few SKUs). Three establishments apparently had no websites, thus
were likely to be very small establishments as well. Four were establishments associated with large or
very large firms, or handled a large number of different devices. The websites associated with the firm
names indicated that they handled hundreds to thousands of different medical devices. One establishment
contacted by ERG indicated the establishment actually did no repackaging/relabeling. The remaining two
included a turnkey packaging/labeling firm and an establishment with a one-page website that simply
stated that they were a medical device distributor and indicated what types of devices they carried.
On the basis of the information gathered in this search, as well as observations about the
establishments listed in FDA’s database, ERG categorized R/Rs into several major groups:
• Establishments affiliated with manufacturers, where the establishment appears to be a distribution center/warehouse for the manufacturer. For example, four establishments in four locations are listed with the name BD Distribution Center. These establishments, registered as R/Rs only, are assumed to be owned by the manufacturer Becton Dickinson.
• Establishments that import and repackage and/or relabel devices. Johnson & Johnson lists an establishment in Puerto Rico, for example, that is registered in this category.
• Establishments listed as specification developers/importers/relabelers or repackagers, one of which was contacted by ERG. This establishment contracts out to foreign manufacturing establishments and imports the devices. These are delivered labeled, but sometimes require relabeling due to transportation damage (not “true” relabeling) or in order to be packaged as kits. For the analysis in Section Four, however, this establishment would be counted as a specification developer.
3-15
• Wholesale distributors handling a variety of manufacturers’ products who prepare kits compiled from several different devices or who repackage and/or relabel a device under their own brand. For example, ERG contacted one such distributor who creates kits on order using various orthodontic components from several manufacturers to complete an entire set of orthodontic braces for delivery to orthodontists (this distributor would meet an exception as a custom operation, however).
• Wholesale distributors handling a variety of manufacturer’s products who repackage and relabel bulk manufacturing lots into smaller lots for sale to hospitals, pharmacies, or others (possibly with their own label).
• Custom packaging and labeling establishments who handle packaging and labeling services for medical device manufacturers as an outside service, among many other types of customers. ERG contacted one of these establishments, which has in the past packaged and labeled medical devices on custom order, but was not currently doing so (such relabeling is also not considered “true” relabeling).
The registration database could generate an over-count of establishments that repackage and
relabel. As noted above, ERG contacted one distributor of medical supplies (including infection control
supplies and syringes), who indicated that they did not relabel or repackage medical supplies and had no
idea why they were registered. Additionally, some R/Rs (such as the one relabeling due to damage and
contract R/Rs) might not actually be changing the information on the label or are applying a label under
direction from another party, but they think they need to register and list because they physically apply or
reapply a label. Conversely, it is also possible that not all R/Rs register with FDA, even though they are
required to register.
To develop the distribution of R/R establishments by size, ERG assumed that the size distribution
would be similar to those in U.S. Census Bureau (2010b) County Business Patterns with data from 2007,
under NAICS 42345 (Medical, Dental, and Hospital Equipment Supplies Merchant Wholesalers), and
under NAICS 42346 (Ophthalmic Goods Merchant Wholesalers). ERG distributed the 1,310 domestic
R/Rs into employment size categories as shown in Table 3-10. There are also a total of 1,212 domestic
firms owning R/Rs. These firms were distributed on the basis of employment size as shown in Table 3-11.

3-16
Table 3-10. Industry Size Distributions for Domestic R/Rs Based on 2007 Census Data
Type of Industry (a)
Numbers of Establishments
Total 1-4 5-9 10-49 50-99 100-249
250-499 >500
Hospital Equipment & Supplies 8,578 4,856 1,365 1,779 310 177 60 31 Ophthalmic Goods 1,319 708 240 278 46 32 13 2 Total 9,897 5,564 1,605 2,057 356 209 73 33 Percent of Total - 56.2% 16.2% 20.8% 3.6% 2.1% 0.7% 0.3% Distribution 1,310 736 212 272 47 28 10 4 (a) The industries that are used to distribute the R/Rs identified in FDA's registration database are the Medical, Dental and Hospital Supplies Merchant Wholesalers Industry (NAICS 42345) and the Ophthalmic Goods Merchant Wholesalers Industry (NAICS 42346). Source: U.S. Census Bureau, 2010b; FDA, 2010a.
Table 3-11. Distribution of Domestic R/R Firms by Employment Size
Type of Industry (a) Numbers of Firms by Employment Size
Total 1-4 5-19 20-499 >500 Hospital Equipment & Supplies 7,031 4,282 1,811 795 143 Ophthalmic Goods 1,075 579 313 165 18 Total 8,106 4,861 2,124 960 161 Percent of Total - 60.0% 26.2% 11.8% 2.0% Distribution 1,212 727 318 144 24 (a) The industries that are used to distribute the R/R firms identified in FDA's registration database are the Medical, Dental and Hospital Supplies Merchant Wholesalers Industry (NAICS 42345) and the Ophthalmic Goods Merchant Wholesalers Industry (NAICS 42346). Source: U.S. Census Bureau, 2010b; FDA, 2010a, SBA, 2006.
4-1
SE C T I ON F OUR
DI R E C T R E G UL AT OR Y C OST S
4.1 I NT R ODUC T I ON
This section presents the estimated costs to implement UDI under the proposed rule. Section Five
discusses economic impacts, Section Six discusses the costs associated with several regulatory
alternatives that FDA also considered, Section Seven presents costs and impacts to small businesses, and
Section Eight discusses the uncertainty analysis.
4.2 K E Y C OST I NG ASSUM PT I ONS
4.2.1 Assumptions—UDI Str uctur e
The proposed rule endeavors to incorporate current practices into regulatory requirements, where
possible. For example, the proposed rule incorporates current industry practices for assigning production
identifiers, such as lot and batch numbers. Thus, medical device labelers will not need to change how they
identify their devices or groups of devices (e.g., those who use lot numbers would not be required to
switch to serial numbers). However, for those labelers using a date identifier as their production identifier,
format changes to production identifiers resulting from the date format change requirement could have
some impact on the assignment of those production identifiers. The number of establishments that might
be affected and the extent to which this affects operations is unknown; this issue is considered in the
uncertainty analysis in Section Eight.
At this time it is expected that GS1 and the Health Industries Business Communication Council
(HIBCC) are likely to apply to become accredited issuing agencies for the UDI. Other agencies also
might apply, but no other agencies at the present time are known to have the ability to provide such a
service. These two organizations assign establishment identification numbers and have allocation rules for
device product codes, and these are the basis for the static portion of the UDI. Both numbering systems
also allow for the variable production information to be included in the numbering system, and both use
existing barcoding standards (including those for both linear and 2-D barcoding). The two organizations
coordinate data for trading partners for the efficient operation of the entire goods supply chain (from
manufacturer, through distributor, to end user). GS1 covers all types of trade items (and is the issuer of
retail UPCs), while HIBCC covers health-related trade items.
4-2
Given the above, ERG assumes that the assignment of HIBCC Health Industry Bar Code (HIBC)
numbering and GS1 Global Trade Identification Numbers (GTIN) would remain as currently practiced
and all allocation rules currently in use would be the basis for determining the appropriate UDI for a
particular device or device package. The HIBCC numbering system is flexible, so the proposed rule’s
requirements are compatible with that system. Additionally, the proposed rule’s requirements concerning
when a new UDI must be or must not be issued is generally consistent with number allocation rules
currently mandated by GS1. The proposed requirements are also consistent with DOD’s Universal
Product Numbers (UPNs), which are a combination of either the GTIN or the HIBC number (i.e., UPN is
consistent with the static portion of the UDI). The assumptions discussed below build on the assumption
that these two organizations would become accredited issuing agencies.
4.2.2 Assumptions—B aseline C ompliance and E xceptions fr om the Pr oposed R ule
The following assumptions are used in assessing who would be incrementally affected by the
proposed rule:
• The proposed rule accommodates the voluntary placement of UDI on labels and submission of data to the GUDID prior to the proposed implementation dates. To avoid understating costs, however, ERG assumes that no labelers voluntarily apply UDIs to labels and submit data to the GUDID before they are required to (although many labelers might choose to do so).
• FDA has made exceptions for certain types of devices. Therefore, ERG excludes custom device manufacturers and R&D establishments from the analysis of the proposed rule. These establishments are further assumed to be among the smallest establishments (those with 1 to 4 employees or 5 to 9 employees). ERG assumes that 70 percent of establishments with 1 to 4 employees and 30 percent of establishments with 5 to 9 employees would not be required to create UDIs or display barcodes on labels because they manufacture custom devices or are R&D establishments. Additionally, any item not required to be listed by FDA is not considered to be a device and, therefore, is assumed not to be subject to the proposed rule (e.g., raw materials and components of devices that are used only to make those devices and are not separately marketed).
• Some small labelers are assumed to exclusively label devices with UPCs and distribute to
retail outlets only. Therefore, they would be in compliance with the proposed rule requirements already. This number is not known. Thus, only 10 percent of manufacturers in the 1-4 and 5-9 employment size groups (among those not already assumed to meet an exception as custom manufacturers and R&D establishments) are assumed to meet the UDI requirement because all their products have UPCs and are only sold at retail. Larger labelers, even if they label some devices for retail, are assumed to label a mix of retail and wholesale devices. Therefore, none of these larger labelers is estimated to meet UDI requirements by labeling with UPCs on all products.
4-3
• ERG assumes that 99 percent of large manufacturing firms16 (500 or more employees), 95 percent of medium labeling establishments (20 to 499 employees) and 85 percent of small labeling firms (those with less than 20 employees)17
• It would be possible under the proposed regulation for one specific device to have several UDIs from the same issuing agency, due to requirements to distinguish devices only for trade purposes or because of FDA requirements. ERG is assuming that labelers would make the decision of how to define a device model relative to their usual practices for trade purposes. Labelers must often make distinctions among models that are necessary for trade purposes but are inconsequential for medical purposes and for which FDA does not require notification. For example, a minor appearance variation such as color could necessitate a different GTIN or HIBC appearing on the same device for trade purposes. Also, FDA would require and, in nearly all cases, labelers use different identifiers on different packaging configurations of the same device, and FDA allows two or more UDIs from two different issuing agencies (or a UDI and a UPC) to appear on one label. Links to the original device UDI are assumed to be set up using required data within the GUDID, so labelers could continue their current practices if they label with GTINs or HIBCs. Therefore, no costs for overcoming inconsistencies with current practices are assumed.
already have GTIN or HIBC numbers and therefore do not need to apply to GS1 or HIBCC to number their current products . Even though fewer than these are assumed to barcode this information on their labels, the lack of current barcoding is not assumed to indicate a lack of registration with HIBCC and GS1. This estimate is based on conversations with representatives of MediCal, who found, in the course of a trial program involving the identification of medical devices, that virtually all of their suppliers had a UPN (which requires registration), but did not place a barcode on their labels and did not necessarily even know that they had a UPN (Rivera, 2009). ERG also spoke with an AdvaMed representative, who indicated that most manufacturers are generally holding off on any labeling changes such as adding barcodes, awaiting a UDI rule (Secunda, 2010), so they might have registered with GS1 or HIBCC but do not plan to add barcodes until they know more about FDA’s course of action. Furthermore, ERG spoke with a HIBCC representative (Hankin, 2010), who indicated that he thought nearly all large firms and most small firms were registered with either HIBCC or GS1.
4.2.3 Assumptions—Display of UDI on L abel
Medical devices can have multiple levels of labeling and packaging. A label can be directly
applied to a device (for example, a monitor) or identification information can be marked directly onto a
device. A label might appear on packaging surrounding the device (e.g., a package containing a catheter,
which is not itself directly marked). Packaging that contains multiples of the same Class I device (e.g., a
package of 25 examining gloves contained in a shelf pack that are not individually labeled) might be
labeled. Additionally, the package of 25 examining gloves might also be grouped into packages
16 Firms apply for registrations, so all registration assumptions are made on a firm basis. 17 Excluding those who meet exceptions as custom manufacturers or who are assumed to use only UPCs for
retail trade.
4-4
containing 10 packages of 25-glove packages, which would also be labeled. There are also packages
containing different groups of devices or a device and a drug (a kit or a combination product). Labels are
also applied to various levels of shipping containers, crates, and pallets.
FDA has specified three levels of labeling or packaging on which a label containing a UDI might
appear. These are:
• The device itself (permanently affixed label or directly marked). • The device label, which is the label on the package containing the individual device or a
group of Class I devices (a shelf pack with unlabeled devices within).
• The device package, which contains one or more labeled devices (for example a shelf pack of individually packaged and labeled devices). (Note that if the label on the immediate device package contains the UDI, that device package is considered to have a UDI on the label and on the device package.)
FDA would not require shipping containers to be labeled with a UDI. Shipping containers are those
collections of device packages that are not identified as a unit for sale, but are grouped together for
transportation purposes and which could contain variable numbers of devices or even different types of
devices every time a shipment is made.
ERG notes the following key concepts or makes the following assumptions about UDI
placement:
• Except for items requiring direct marking and three other possible exceptions, no new levels of labeling would be required. For example, because FDA would allow shelf packs to contain multiple identical Class I devices that are not labeled with a UDI, ERG assumes that a UDI can be added to existing labeling on the shelf pack and the items within the shelf pack would not require a new label with a UDI. The following exceptions to a no new level of labeling assumption might apply, however. These exceptions are discussed within ERG’s uncertainty analysis (Section Eight):
o There might be some Class II devices that are currently included within shelf
packs without individual labeling. The number of such occurrences is unknown.
o There might be devices within a combination product that are not integral to the combination product. If a device is physically separable from a combination product that is regulated as a device, a UDI would be required on the device label. It is not certain how many such devices exist and whether there are any such separable devices that are not currently labeled separately within a combination product.
o Kits are assumed to contain some items with a UDI and some without. The kit
would require a UDI on the level at which the kit or combination product is

4-5
labeled, but some items (e.g., components labeled for individual use as well) might also have a UDI below the level of the label identifying the kit or combination product. Items intended only for one use (bandage, cottonball, examining gloves, etc.) would not need to be individually labeled, thus when unlabeled shelf pack items are removed from the shelf pack, in most cases, they would require no additional labeling. However, devices packaged in a kit that are intended to be used more than once would be required to be labeled with a UDI. Other than for multiple-use devices packaged within a kit (which must be directly marked with the UDI on the device by the initial labeler, if they are intended for sterilization), the proposed rule would not require additional labeling if a label is not currently present. The extent to which multiple-use devices that are not directly marked or that are not already separately labeled is not known.
• If each individual device within a device package is individually labeled, the
manufacturer would place the UDI on this label, and the device package containing multiples of the individually labeled devices would also require another, different UDI. This device package containing multiple device packages is likely not to have a production identifier associated with it, so a static barcode is assumed to be used at this level of packaging (the label would need only a one-time redesign).
• ERG estimates that 80 percent of implant manufacturers and 75 percent of manufacturers
of multi- use devices intended to be sterilized currently mark their devices in some manner. Of those who do not mark, 15 percent of implant manufacturers and 5 percent of multi-use manufacturers are assumed to be unable to mark the device or to claim health and safety issues. These labelers would need to file an exception and notify FDA. Those simply needing to file an exception in the design history file (e.g., relabelers of devices already directly marked) are assumed to do so at a negligible cost.
• ERG assumes that when FDA specifies that a UDI must be directly marked on certain
devices either in an easily read plain-text or a machine-readable format, if the size of the device makes it technologically infeasible to provide a machine-readable format, any plain-text UDI applied in that same space would not be easily readable. Therefore, the labeler of such a device would not be required to mark such a device with either a machine-readable or a plain-text UDI. This labeler would notify FDA and insert this reason (technologically infeasible due to size of device) in the device history record.
• ERG assumes that FDA would not require packaging already on shelves prior to the implementation date to be relabeled.
4.2.4 Assumptions—B ar coding Used to R epr esent UDI
The overall implication of the assumptions above is that FDA would allow the issuing
agencies and labelers to maintain nearly all of their current practices (with the exception of reusing
UDIs after a device has been discontinued), including barcoding. ERG makes the following
assumptions about barcoding used to represent UDI:
4-6
• ERG assumes that the symbologies used to represent the UDI on labels are those that are currently used for trade purposes (standard linear or 2-D barcodes). These barcode systems also allow for the representation of human readable numbers below or above the barcode itself.
• The barcode standards used would be GS1-128 (formerly EAN-128), Code 39, or another
standard accepted by GS1 or HIBCC, using either GS1 or HIBCC numbering systems (the GTIN or HIBC); proprietary standards would not be permitted. Additionally, manufacturers could freely choose either numbering system (GS1, HIBCC, or both), depending on their choice of UDI issuing agency. Virtually all manufacturers currently barcoding their devices use either the GS1 or HIBCC systems. Thus, these assumptions imply that the vast majority of manufacturers that already have barcodes in place would not need to change their current manufacturer code, product codes, or the manner in which they assign lot numbers or serial numbers. They would also not need to change their method of encoding the barcode.
• ERG assumes that the use of primary and secondary barcodes would be acceptable. FDA
does not specify the placement of the barcode and does not specifically prohibit in the proposed rule the use of primary and secondary barcodes to provide static and variable information separately on the label. Therefore, two barcodes, one representing the static information and one representing the variable information are assumed able to be placed separately on a label. This allows labelers to facilitate preprinted labeling of static information with an additional, changeable label for variable information or to keep existing package configurations where length of a barcode might be problematic.
• A small number of labelers are assumed to currently meet some of the requirements of a
UDI (i.e., they include their establishment and product identifier in a GTIN or HIBC barcode on at least one level of labeling). An AdvaMed representative (Secunda, 2010) indicated that most manufacturers are generally holding off on any labeling changes awaiting a UDI rule. Estimates based on an older AdvaMed survey of barcoding practices (AdvaMed, 2004) were used to determine prevalence of any barcoding of GTIN or HIBC information. This survey indicated that approximately two-thirds of larger establishments currently barcode. However, ERG contacts with industry (see Appendix B) indicated that most of these firms do not barcode their variable information. ERG has assumed that of the two-thirds of larger manufacturers who do some form of barcoding, only 15 percent barcode with variable information and smaller manufacturers do no variable barcoding. These assumptions result in an assumption that only 3 percent of all manufacturers use variable barcoding on their labels, and these are larger manufacturers.
• ERG assumes that radio frequency identification (RFID) would be chosen voluntarily for
reasons other than those imposed by FDA. Therefore, no incremental costs are included to reflect the greater costs of placing RFID data rather than barcodes on labeling.
• ERG assumes the date formats required to appear on labels refer only to dates imprinted
separately from the UDI; date formats for the UDI barcode and numbering system are assumed to be allowed to remain as specified by the issuing agencies.
4-7
4.2.5 Assumptions—I ncr emental C osts Due to the Pr oposed R ule
The following assumptions affect how incremental costs of the proposed rule are estimated:
• Only one number and barcode are assumed to be required for both trade and UDI purposes on each device package or label.
• Although some manufacturers are assumed to fully meet the UDI requirements (that is, they also include production identifiers such as lot or serial number on their labeling using the GS1 or HIBCC barcoding conventions or label with UPCs for retail only), the new requirements for standardizing human readable dates on labeling means that all current device labels would need revision for one reason or another relating to the proposed rule.
• Because the date format requirement would need to be met within 90 days, all label
redesign changes and any material costs associated with increase label sizes or packaging changes, are assumed, for simplicity, to be done during this time. That is, in addition to redoing the dates on the label or package, the space required for the UDI presentation would also be designed, although the UDI itself would not be printed. The assumption that all establishments would need to change their labels due to the date format change is very conservative and is discussed in the uncertainty analysis (Section Eight).
• Other provisions requiring certain records and reports to contain the UDI, even though
they are required to be implemented in 90 days, would not have any practical application until UDIs are available. Thus, this provision is assumed not to force assignment of UDIs before labeling requirements must be met. ERG also assumes that placeholders for UDI do not have to be contained in these records and reports until UDIs must appear on labels. That is, the records and reports do not need to be redesigned until the UDI is available.
• Because GS1 and HIBCC currently allow for reuse of product codes after a period of
time, but FDA would not, labelers would need to apply for more product codes (incurring a greater cost under the GS1 system) than is currently the case over the 10-year period used in this costing analysis. ERG assumes that there could be incremental costs associated with product codes that cannot be reused. GS1 allows product codes to be reused for a different product after a certain number of years and GS1 registers the majority of health care labelers currently using barcodes. The number of such incremental UDIs required cannot be estimated. Furthermore, HIBCC does not charge a fee for additional product numbers, so in some instances there will be no incremental costs. ERG assumes such incremental costs are small and does not estimate a cost for product codes that cannot be reused.
• ERG assumes that labelers would not have to file a supplement when adding a UDI to their labels or changing the date format of their labels, assuming no other label changes are made, because a supplement is only needed when the label change has some effect on the health or safety of the device (e.g., a change to indications for use).

4-8
4.3 C OST S T O AF F E C T E D E NT I T I E S
This section presents costs to the four major groups of labelers: manufacturers, reprocessors,
specification developers, and relabelers/repackagers, as well as to UDI issuing agencies. The costs in the
following subsections are estimated under an assumption that UDI requirements must be implemented
immediately. Costs to initial labelers (manufacturers, reprocessors, and specification developers) are
discussed first (Section 4.3.1). Costs to R/Rs, because they are assumed to have somewhat less complex
processes than initial labelers, are presented separately in Section 4.3.2. Total costs to all domestic
labelers are presented in Section 4.3.3, and Section 4.3.4 discusses the costs to UDI issuing agencies.
Section 4.3.5 presents the total costs to all domestic entities under the immediate implementation
scenario, and Section 4.3.6 adds in costs to foreign firms and establishments.
4.3.1 C ost E stimate for M anufactur er s, R epr ocessor s, and Specification Developer s
The exceptions to and current compliance with the proposed rulemaking affect cost assumptions
throughout the rest of this section. As a first step in estimating costs for manufacturers, reprocessors, and
specification developers, ERG needed to remove an estimated number of establishments believed to be
handling custom devices (which meet an exception from the proposed rule). As noted earlier, ERG
assumes that 70 percent of establishments with 1 to 4 employees and 30 percent of establishments with 5
to 9 employees would not be required to create UDIs or display barcodes on labels because they
manufacture devices subject to the general exceptions to the proposed rule, such as for custom devices.
Reprocessors and specification developers, however, are assumed not to be handling only custom (i.e.,
excepted) devices.18
Based on the above assumptions, ERG calculates that 1,379 of these very small
establishments with fewer than 10 employees are involved in manufacturing custom devices and therefore
would not be subject to the proposed rule. As noted earlier, ERG also assumes that 10 percent of the
remaining 1,045 very small establishments are supplying medical devices only to retail establishments,
are exclusively using UPCs on their labels, and, thus, are meeting UDI labeling requirements already (105
establishments).
Additionally, ERG judges that there is some baseline compliance with the proposed rule. Based
on assumptions discussed earlier and information discussed below, baseline compliance with the
proposed rulemaking is judged to be relatively small. About 3 percent of all manufacturers are currently
18 Custom devices are expected to be the major group of excepted devices. When custom device exceptions
are noted, ERG intends that the discussion refers to all excepted devices.

4-9
estimated to have installed appropriate equipment to fully implement the UDI concept as defined by the
proposed rulemaking (discussed more fully in Section 4.3.1.1). These manufacturers might need to make
minor modifications to their administrative systems but are assumed to essentially have absorbed the
costs for complying with the regulation. Reprocessors and specification developers are assumed not to
have implemented any portion of UDI requirements.
To determine the appropriate assumptions to define the current baseline, ERG’s first step was to
determine the extent to which medical device manufacturers have already implemented a system that
incorporates both static and variable device identifiers. ERG contacted a number of medical device
facilities and participated in industry meetings regarding unique device identification systems. ERG also
reviewed the most common industry practices with a variety of industry consultants and with vendors of
label printing equipment.
ERG also obtained input by considering the experiences of manufacturers who are subject to the
DOD purchasing requirements for uniquely identified equipment. However, most of these manufacturers
are not making medical devices, and the DOD requirement is limited to equipment with a unit acquisition
cost of $5,000 or more. Thus, while the DOD experiences are of interest, they must be considered in the
more limited context of their use.
Most information gained from the manufacturer interviews relates to the capital investments
required to comply with a UDI requirement. See Appendix B for details of these manufacturer interviews.
ERG concluded that most medical device manufacturers have little experience with the UDI concept as
envisioned under the proposed rule (dynamic barcodes linked to manufacturer, product, and variable
production data) and have not studied or invested in the internal infrastructure needed to implement such
systems. Some of the larger device manufacturers, however, have considered, and some have even
implemented the UDI concept as currently proposed. The breakdown of the percentages by size of
establishment is discussed in more detail in Section 4.3.1.1.
The unit costs of developing and installing a UDI capability cover the costs for manufacturers to
go from the lowest level of compliance (no static or dynamic barcoding) to meeting the requirements of
the proposed rule. Based on the conversations with medical device manufacturers, ERG expects that in
order to develop UDI capability, manufacturers that do not currently barcode either static or dynamic
information must undertake the following steps:
4-10
• UDI Plan Development—Develop a facility plan for implementing UDI and prepare new or modified Standard Operating Procedures (SOPs) to meet FDA’s Quality System regulation defining the medical device good manufacturing practices (GMPs);
• Register Barcode—Apply for registration with GS1 or HIBCC.
• Purchase Equipment—Select and purchase equipment to print or place the UDI on product labels and packages and verify the quality of the UDI marking.
• Direct Mark—Select and purchase equipment to etch or otherwise permanently mark
selected devices or apply for an exception, if applicable.
• Relabel—Redesign and print labels (or add a supplementary label) to replace or add to labels that do not contain
o Any barcodes, o Variable barcodes, or o Correct date formats.
• Data Integration—Integrate the UDI data into information systems, including all device records required by FDA to be kept.
• Recordkeeping and Reporting—Provide initial information and ongoing updates to the
GUDID.
The costs associated with these elements are described in the sections below. Note that in all
tables that present numbers of firms or establishments, these numbers have been calculated based on
percentage distributions by industry and size. These numbers of entities have not been rounded even
though they are shown as whole numbers. For this reason, total costs that are calculated manually might
not exactly match the totals shown in the tables. Additionally, all costs presented up to Section 4.3.6 are
for domestic establishments only.
4.3.1.1 UDI Planning C osts
ERG modeled the administrative and planning costs that might be incurred in developing the
basic UDI capability. Although the estimates provided during manufacturer interviews are useful, the
estimates of administrative costs provided were generally mixed with various other company initiatives;
therefore, potential regulatory costs were difficult to isolate using manufacturers’ estimates of such costs.
ERG’s goal for the modeling effort is to express the possible magnitude of costs incurred for any
mandatory regulatory action requiring UDI for medical devices. There appear to be a variety of possible
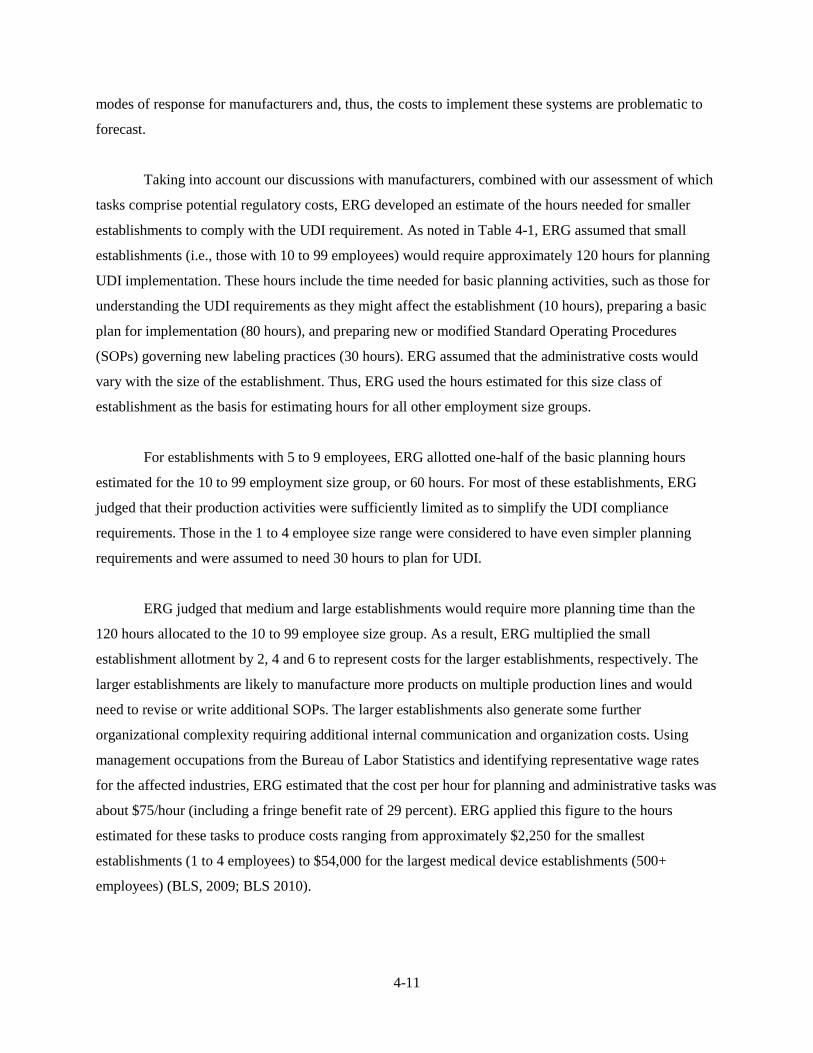
4-11
modes of response for manufacturers and, thus, the costs to implement these systems are problematic to
forecast.
Taking into account our discussions with manufacturers, combined with our assessment of which
tasks comprise potential regulatory costs, ERG developed an estimate of the hours needed for smaller
establishments to comply with the UDI requirement. As noted in Table 4-1, ERG assumed that small
establishments (i.e., those with 10 to 99 employees) would require approximately 120 hours for planning
UDI implementation. These hours include the time needed for basic planning activities, such as those for
understanding the UDI requirements as they might affect the establishment (10 hours), preparing a basic
plan for implementation (80 hours), and preparing new or modified Standard Operating Procedures
(SOPs) governing new labeling practices (30 hours). ERG assumed that the administrative costs would
vary with the size of the establishment. Thus, ERG used the hours estimated for this size class of
establishment as the basis for estimating hours for all other employment size groups.
For establishments with 5 to 9 employees, ERG allotted one-half of the basic planning hours
estimated for the 10 to 99 employment size group, or 60 hours. For most of these establishments, ERG
judged that their production activities were sufficiently limited as to simplify the UDI compliance
requirements. Those in the 1 to 4 employee size range were considered to have even simpler planning
requirements and were assumed to need 30 hours to plan for UDI.
ERG judged that medium and large establishments would require more planning time than the
120 hours allocated to the 10 to 99 employee size group. As a result, ERG multiplied the small
establishment allotment by 2, 4 and 6 to represent costs for the larger establishments, respectively. The
larger establishments are likely to manufacture more products on multiple production lines and would
need to revise or write additional SOPs. The larger establishments also generate some further
organizational complexity requiring additional internal communication and organization costs. Using
management occupations from the Bureau of Labor Statistics and identifying representative wage rates
for the affected industries, ERG estimated that the cost per hour for planning and administrative tasks was
about $75/hour (including a fringe benefit rate of 29 percent). ERG applied this figure to the hours
estimated for these tasks to produce costs ranging from approximately $2,250 for the smallest
establishments (1 to 4 employees) to $54,000 for the largest medical device establishments (500+
employees) (BLS, 2009; BLS 2010).

4-12
Table 4-1. First Year Administrative and Planning Costs per Establishment by Employee Size Class
Hours for Small
Estab. (a)
Hourly Wage Rate with Benefits
Establishment First Year Cost by Size Class 1-4 (c) 5-9 (c) 10-49 50-99 100-249 250-499 500+
(0.25 Times) (0.50 Times) (1 Times) (1 Times) (2 Times) (4 Times) (6 Times) 120 $75 $2,250 $4,500 $9,000 $9,000 $18,000 $36,000 $54,000
(a) Hours applicable to smallest size medical device establishment (10-99 employees). (b) Based on the median hourly wage rate for management occupations in NAICS 3391 (BLS, 2009). Benefits are calculated at 29% of wages (BLS, 2010). Hourly wage rates do not vary substantially among the relevant NAICS; the wage rate for NAICS 3391 has been used for simplicity. (c) The smallest establishments are judged to require one-half of the planning hours for compliance in the 5-9 employees group and one-quarter of the compliance time at the 1-4 employees group. Compliance would be largely manual for such firms and compliance actions would involve fewer technological and equipment decisions. Source: BLS, 2010, Employer Costs for Employee Compensation; BLS, 2009; ERG estimates.
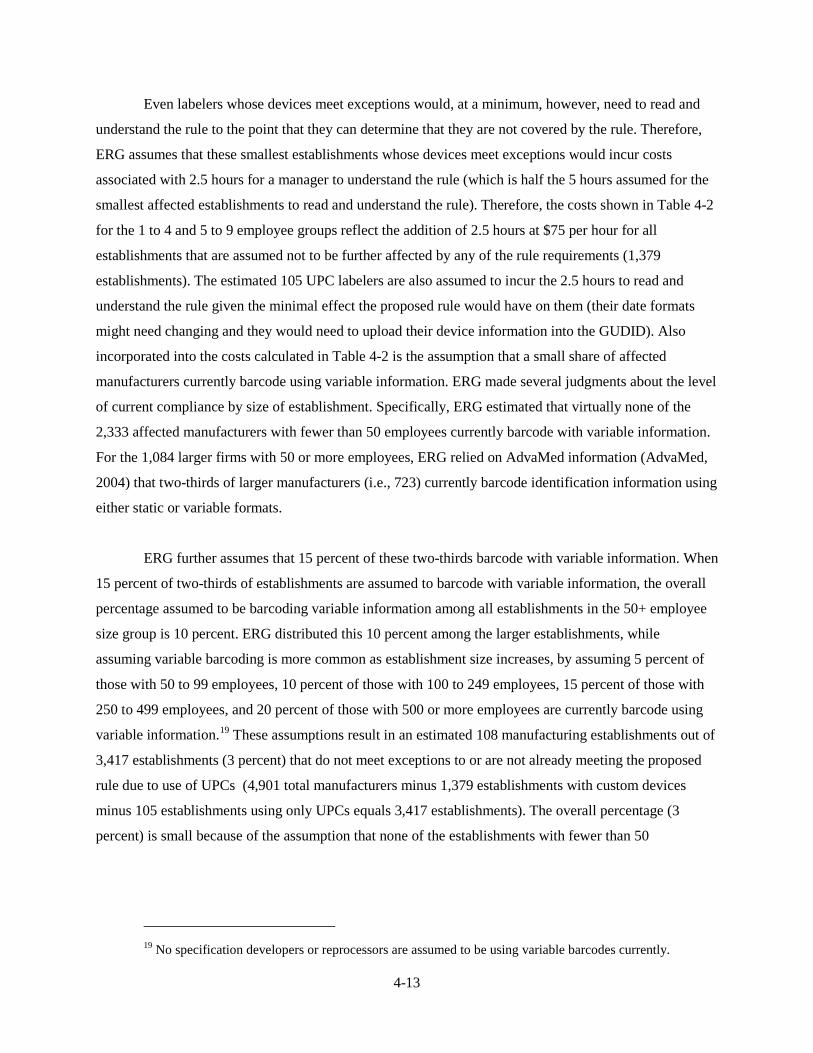
4-13
Even labelers whose devices meet exceptions would, at a minimum, however, need to read and
understand the rule to the point that they can determine that they are not covered by the rule. Therefore,
ERG assumes that these smallest establishments whose devices meet exceptions would incur costs
associated with 2.5 hours for a manager to understand the rule (which is half the 5 hours assumed for the
smallest affected establishments to read and understand the rule). Therefore, the costs shown in Table 4-2
for the 1 to 4 and 5 to 9 employee groups reflect the addition of 2.5 hours at $75 per hour for all
establishments that are assumed not to be further affected by any of the rule requirements (1,379
establishments). The estimated 105 UPC labelers are also assumed to incur the 2.5 hours to read and
understand the rule given the minimal effect the proposed rule would have on them (their date formats
might need changing and they would need to upload their device information into the GUDID). Also
incorporated into the costs calculated in Table 4-2 is the assumption that a small share of affected
manufacturers currently barcode using variable information. ERG made several judgments about the level
of current compliance by size of establishment. Specifically, ERG estimated that virtually none of the
2,333 affected manufacturers with fewer than 50 employees currently barcode with variable information.
For the 1,084 larger firms with 50 or more employees, ERG relied on AdvaMed information (AdvaMed,
2004) that two-thirds of larger manufacturers (i.e., 723) currently barcode identification information using
either static or variable formats.
ERG further assumes that 15 percent of these two-thirds barcode with variable information. When
15 percent of two-thirds of establishments are assumed to barcode with variable information, the overall
percentage assumed to be barcoding variable information among all establishments in the 50+ employee
size group is 10 percent. ERG distributed this 10 percent among the larger establishments, while
assuming variable barcoding is more common as establishment size increases, by assuming 5 percent of
those with 50 to 99 employees, 10 percent of those with 100 to 249 employees, 15 percent of those with
250 to 499 employees, and 20 percent of those with 500 or more employees are currently barcode using
variable information.19
19 No specification developers or reprocessors are assumed to be using variable barcodes currently.
These assumptions result in an estimated 108 manufacturing establishments out of
3,417 establishments (3 percent) that do not meet exceptions to or are not already meeting the proposed
rule due to use of UPCs (4,901 total manufacturers minus 1,379 establishments with custom devices
minus 105 establishments using only UPCs equals 3,417 establishments). The overall percentage (3
percent) is small because of the assumption that none of the establishments with fewer than 50
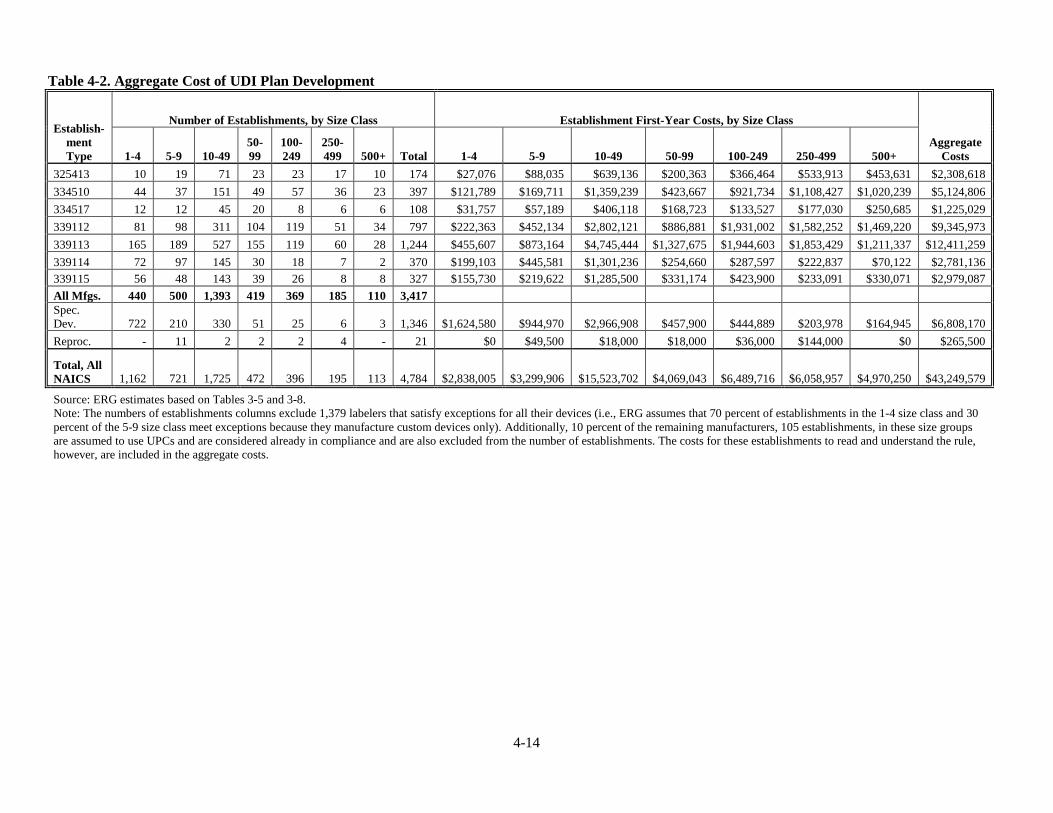
4-14
Table 4-2. Aggregate Cost of UDI Plan Development
Establish-ment Type
Number of Establishments, by Size Class Establishment First-Year Costs, by Size Class
Aggregate Costs 1-4 5-9 10-49
50-99
100-249
250-499 500+ Total 1-4 5-9 10-49 50-99 100-249 250-499 500+
325413 10 19 71 23 23 17 10 174 $27,076 $88,035 $639,136 $200,363 $366,464 $533,913 $453,631 $2,308,618 334510 44 37 151 49 57 36 23 397 $121,789 $169,711 $1,359,239 $423,667 $921,734 $1,108,427 $1,020,239 $5,124,806 334517 12 12 45 20 8 6 6 108 $31,757 $57,189 $406,118 $168,723 $133,527 $177,030 $250,685 $1,225,029 339112 81 98 311 104 119 51 34 797 $222,363 $452,134 $2,802,121 $886,881 $1,931,002 $1,582,252 $1,469,220 $9,345,973 339113 165 189 527 155 119 60 28 1,244 $455,607 $873,164 $4,745,444 $1,327,675 $1,944,603 $1,853,429 $1,211,337 $12,411,259 339114 72 97 145 30 18 7 2 370 $199,103 $445,581 $1,301,236 $254,660 $287,597 $222,837 $70,122 $2,781,136 339115 56 48 143 39 26 8 8 327 $155,730 $219,622 $1,285,500 $331,174 $423,900 $233,091 $330,071 $2,979,087 All Mfgs. 440 500 1,393 419 369 185 110 3,417 Spec. Dev. 722 210 330 51 25 6 3 1,346 $1,624,580 $944,970 $2,966,908 $457,900 $444,889 $203,978 $164,945 $6,808,170 Reproc. - 11 2 2 2 4 - 21 $0 $49,500 $18,000 $18,000 $36,000 $144,000 $0 $265,500
Total, All NAICS 1,162 721 1,725 472 396 195 113 4,784 $2,838,005 $3,299,906 $15,523,702 $4,069,043 $6,489,716 $6,058,957 $4,970,250 $43,249,579
Source: ERG estimates based on Tables 3-5 and 3-8. Note: The numbers of establishments columns exclude 1,379 labelers that satisfy exceptions for all their devices (i.e., ERG assumes that 70 percent of establishments in the 1-4 size class and 30 percent of the 5-9 size class meet exceptions because they manufacture custom devices only). Additionally, 10 percent of the remaining manufacturers, 105 establishments, in these size groups are assumed to use UPCs and are considered already in compliance and are also excluded from the number of establishments. The costs for these establishments to read and understand the rule, however, are included in the aggregate costs.
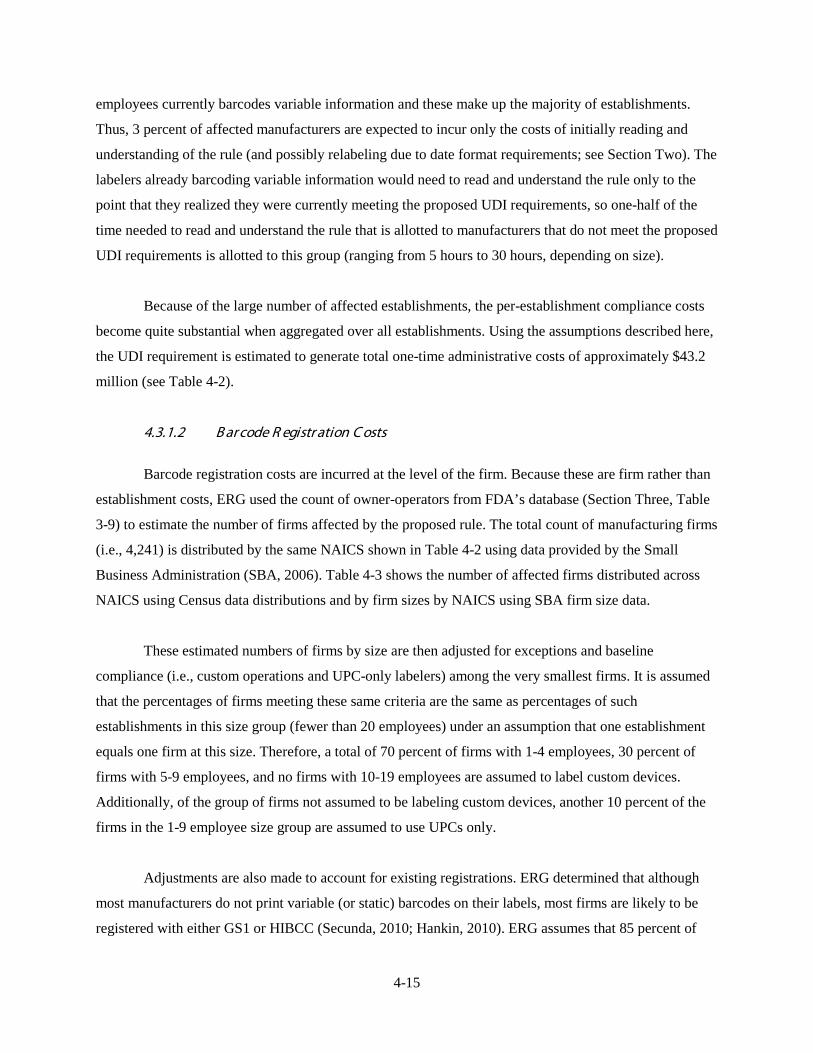
4-15
employees currently barcodes variable information and these make up the majority of establishments.
Thus, 3 percent of affected manufacturers are expected to incur only the costs of initially reading and
understanding of the rule (and possibly relabeling due to date format requirements; see Section Two). The
labelers already barcoding variable information would need to read and understand the rule only to the
point that they realized they were currently meeting the proposed UDI requirements, so one-half of the
time needed to read and understand the rule that is allotted to manufacturers that do not meet the proposed
UDI requirements is allotted to this group (ranging from 5 hours to 30 hours, depending on size).
Because of the large number of affected establishments, the per-establishment compliance costs
become quite substantial when aggregated over all establishments. Using the assumptions described here,
the UDI requirement is estimated to generate total one-time administrative costs of approximately $43.2
million (see Table 4-2).
4.3.1.2 B ar code R egistr ation C osts
Barcode registration costs are incurred at the level of the firm. Because these are firm rather than
establishment costs, ERG used the count of owner-operators from FDA’s database (Section Three, Table
3-9) to estimate the number of firms affected by the proposed rule. The total count of manufacturing firms
(i.e., 4,241) is distributed by the same NAICS shown in Table 4-2 using data provided by the Small
Business Administration (SBA, 2006). Table 4-3 shows the number of affected firms distributed across
NAICS using Census data distributions and by firm sizes by NAICS using SBA firm size data.
These estimated numbers of firms by size are then adjusted for exceptions and baseline
compliance (i.e., custom operations and UPC-only labelers) among the very smallest firms. It is assumed
that the percentages of firms meeting these same criteria are the same as percentages of such
establishments in this size group (fewer than 20 employees) under an assumption that one establishment
equals one firm at this size. Therefore, a total of 70 percent of firms with 1-4 employees, 30 percent of
firms with 5-9 employees, and no firms with 10-19 employees are assumed to label custom devices.
Additionally, of the group of firms not assumed to be labeling custom devices, another 10 percent of the
firms in the 1-9 employee size group are assumed to use UPCs only.
Adjustments are also made to account for existing registrations. ERG determined that although
most manufacturers do not print variable (or static) barcodes on their labels, most firms are likely to be
registered with either GS1 or HIBCC (Secunda, 2010; Hankin, 2010). ERG assumes that 85 percent of
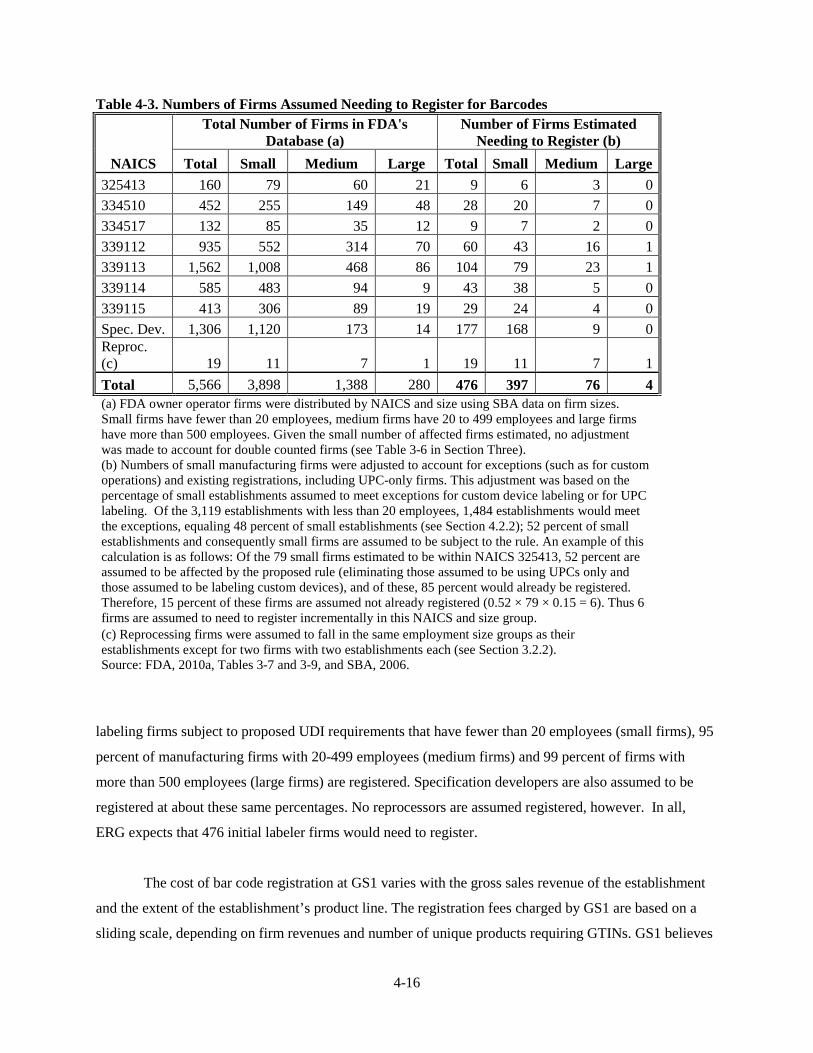
4-16
Table 4-3. Numbers of Firms Assumed Needing to Register for Barcodes
NAICS
Total Number of Firms in FDA's Database (a)
Number of Firms Estimated Needing to Register (b)
Total Small Medium Large Total Small Medium Large 325413 160 79 60 21 9 6 3 0 334510 452 255 149 48 28 20 7 0 334517 132 85 35 12 9 7 2 0 339112 935 552 314 70 60 43 16 1 339113 1,562 1,008 468 86 104 79 23 1 339114 585 483 94 9 43 38 5 0 339115 413 306 89 19 29 24 4 0 Spec. Dev. 1,306 1,120 173 14 177 168 9 0 Reproc. (c) 19 11 7 1 19 11 7 1 Total 5,566 3,898 1,388 280 476 397 76 4 (a) FDA owner operator firms were distributed by NAICS and size using SBA data on firm sizes. Small firms have fewer than 20 employees, medium firms have 20 to 499 employees and large firms have more than 500 employees. Given the small number of affected firms estimated, no adjustment was made to account for double counted firms (see Table 3-6 in Section Three). (b) Numbers of small manufacturing firms were adjusted to account for exceptions (such as for custom operations) and existing registrations, including UPC-only firms. This adjustment was based on the percentage of small establishments assumed to meet exceptions for custom device labeling or for UPC labeling. Of the 3,119 establishments with less than 20 employees, 1,484 establishments would meet the exceptions, equaling 48 percent of small establishments (see Section 4.2.2); 52 percent of small establishments and consequently small firms are assumed to be subject to the rule. An example of this calculation is as follows: Of the 79 small firms estimated to be within NAICS 325413, 52 percent are assumed to be affected by the proposed rule (eliminating those assumed to be using UPCs only and those assumed to be labeling custom devices), and of these, 85 percent would already be registered. Therefore, 15 percent of these firms are assumed not already registered (0.52 × 79 × 0.15 = 6). Thus 6 firms are assumed to need to register incrementally in this NAICS and size group. (c) Reprocessing firms were assumed to fall in the same employment size groups as their establishments except for two firms with two establishments each (see Section 3.2.2). Source: FDA, 2010a, Tables 3-7 and 3-9, and SBA, 2006.
labeling firms subject to proposed UDI requirements that have fewer than 20 employees (small firms), 95
percent of manufacturing firms with 20-499 employees (medium firms) and 99 percent of firms with
more than 500 employees (large firms) are registered. Specification developers are also assumed to be
registered at about these same percentages. No reprocessors are assumed registered, however. In all,
ERG expects that 476 initial labeler firms would need to register.
The cost of bar code registration at GS1 varies with the gross sales revenue of the establishment
and the extent of the establishment’s product line. The registration fees charged by GS1 are based on a
sliding scale, depending on firm revenues and number of unique products requiring GTINs. GS1 believes

4-17
that under a UDI plan, registration fees might change (the fees, both initial and annual, that are charged
depend on the number of subscribers and the costs incurred to maintain the system at this not-for-profit
entity). We contacted GS1, but they were hesitant to discuss fees due to the complexity of their fee
structure. Because we could not get an estimate from GS1 (GS1, 2008), we used information from
HIBCC, which we have assumed would become an issuing agency.
The HIBCC licensing fee also varies with gross sales revenues. Based on the firm sizes set up for
analysis (<20 employees, 20-499, and 500+ employees), and average revenues for those sizes based on
2002 data for U.S. manufacturers, we assume that the applicable sales ranges for small, medium and
larger firms would be under $2 million for small, under $30 million for medium and over $500 million for
large. These sales ranges equate to fees in the HIBCC schedule of $500, $4,000, and $20,000,
respectively (HIBCC, 2010). HIBCC charges $100 for each additional license if more than one license is
needed for an individual establishment, but HIBCC indicates that this rarely occurs. Thus, it is assumed
that only one license per firm is needed (see Table 4-4). HIBCC does not charge additional fees by
numbers of unique products requiring barcodes, nor do they charge an annual fee. Since labelers are free
to choose an issuing agency, ERG assumes that if HIBCC fees are less expensive than GS1 fees, the
labeler would be choosing GS1 for reasons other than those relating to meeting basic UDI requirements.
Furthermore, should FDA become the issuing agency, ERG assumes that the current HIBCC fees would
be representative of fees that FDA might impose, if allowed by law. The total cost for firms to register a
barcode is estimated to be $0.6 million (see Table 4-4).
Because HIBC does not charge an annual fee, because the large majority of registrants in future
years (start-up firms) are assumed to have registered even if the proposed rule were not promulgated, and
because of the very modest cost that would apply to very small start-up firms, ERG assumes recurring
registration costs are negligible and only includes this cost component as a first-year cost.
Table 4-4. Costs for Barcode Registration
Firm Size Adjusted Number of
Firms Cost per Firm To
Register Aggregate Costs to
Register Small 397 $500 $198,300 Medium 76 $4,000 $304,153 Large 4 $20,000 $75,794 Total 476 $578,246 Source: Hankin, 2010; HIBCC, 2010; Table 4-3; and ERG estimates.
4-18
4.3.1.3 E quipment C osts
4.3.1.3.1 Regulatory Baseline and Compliance Strategies
To estimate equipment costs for the proposed rule, ERG forecast manufacturers’ incremental
investment and operating costs to modify and/or supplement their existing product labels given their
existing labeling systems and their likely compliance strategies. The estimates were prepared in stages to
reflect the variety of possible compliance approaches. It should be noted, however, that the exact
compliance strategy would vary substantially among firms, reflecting, among other things, wide
variations in production and/or packaging line speed, labeling requirements, and the existing labeling
systems in place. These estimates only approximate these complexities and cannot address the much
wider variety of specific changes and equipment installations likely to be made. The assumptions are
applied to all establishments that are not already assumed to use variable barcodes on their labels.
The relatively simple approach to cost estimation described here is justified partly because of the
need to consider only the potential regulation-induced cost of the FDA action under consideration. FDA
would not require extensive label changes, only the addition of the UDI. The effect of this change on
some relatively complex labeling systems, some of which carry considerable marketing content,
encompasses both compliance and marketing-driven considerations. Thus a measure of the response to a
UDI requirement would involve extra measures that are not strictly part of the regulatory impact.
In preparing the estimates, ERG worked with project consultants and discussed label printing
costs with manufacturers, consultants, and a subcontractor specializing in industrial installations of UDI
and other process enhancements. The subcontractor, Mass Group, Inc., of Chatsworth, CA (2007), helped
to estimate the expected hardware and software costs for manufacturers to add the required barcoded UDI
number containing variable information to their labeling. In addition to Mass Group, ERG contacted
consultants in the label printing area to help consider the range of possible responses. In the estimates
below, the Mass Group hardware and software costs are not shown separately. The final estimates reflect
a combination of inputs and should be considered to represent ERG’s best judgment.
Manufacturer costs to implement the proposed rule would vary widely depending on their current
labeling capabilities and the potential labeling capabilities of their equipment. ERG compiled
manufacturer data (presented in Appendix B), but, while helpful, these data do not provide a clear
consensus on the equipment costs for meeting the proposed rule requirements. To develop a basic model
of equipment costs, ERG considered the collected manufacturer data, but also reviewed additional

4-19
references from the trade literature and made contacts with equipment vendors to derive some
representative costs.
ERG’s review of current labeling practices indicated that there are a variety of current labeling
systems employed in medical device manufacturing reflecting the needs of manual and automated
systems; low- and high-speed production lines; simple or complex label designs; institutional and
consumer-friendly packaging; in-house and contractor supplied labels; and low- and high-consumption
rates for ink, toner, and label stock. To consider the incremental costs that UDI would create for these
systems, we have focused on the most common baseline scenarios combined with the likely manufacturer
responses to the proposed requirements. Current baseline and manufacturer response to the proposed rule
are differentiated primarily by the size and complexity of the operation. Large establishments with
automated production lines have different baseline conditions and responses to the proposed rule than
very small establishments with manual production lines. The primary basis for the difference in
manufacturer response is the difference in prevalence of baseline digital printing technology.
A UDI requirement under the proposed rule creates a challenge for label requirements because a
portion of the label information referred to as the variable component, changes frequently. Thus, lot
numbers or serial numbers for devices change with each lot or each device while the rest of the label is
unchanged. Many printing technologies, such as printing press technology, are not geared to presenting
variable information, but rather are designed to produce large numbers of static labels or other printed
materials very cheaply.
ERG reviewed methods that manufacturers have used to comply with similar initiatives requiring
printing of variable information. As noted earlier, DOD operates a program (the Unique Identification
[UID] program) in which manufacturers are required to place unique identifiers on high-value (over
$5,000) assets. While more restrictive in its requirements than FDA proposes, the DOD requirement is of
some interest as an indicator of how industry might comply with this type of regulation, since
manufacturers would be able to choose from several possible techniques for placing UDI barcodes on
their devices or packaging.
A White Paper prepared by Zebra Technologies Corporation (2005) stated that the majority of
defense contractors can comply with the DOD UID requirements by using fairly inexpensive thermal
transfer label printing machines. (Zebra Technologies Corporation manufactures these and other types of
printers.) A relatively small share of manufacturers uses data plate systems or DM techniques that imprint
4-20
the identifier directly onto the item.20
Thermal transfer printers generate highly readable output and can
accommodate digital technologies. These printers are also relatively durable for production line
applications. For these reasons, ERG bases the cost of meeting the basic barcode printing requirements on
the use of thermal transfer printers, rather than on more costly technologies that are less commonly used
to meet the DOD UID requirements.
Digital printing is likely to be the method of choice for any manufacturer needing to serialize
medical device UDI labeling because of the relative ease of connecting digital printing and information
technology (IT) systems. Digital printing is also extremely versatile, and can accommodate changes
quickly (Medical Device Manufacturer A, 2006; Medical Device Manufacturer D, 2006; Batesko, 2006).
Thus, the proposed UDI requirement can significantly modify the economics of labeling depending on the
relative prevalence of digital printing technology among manufacturers.
The prevalence of digital printing varies depending on size and complexity of production lines,
particularly whether the production line or lines are manual or automated (which tends to correspond to
size of establishment). Therefore, ERG first discusses the larger manufacturers, which are assumed to use
automated lines predominantly, then the very small manufacturers (fewer than 10 employees), who are
assumed to use manual production lines predominantly.
Large Manufacturers: Baseline Labeling and Likely Responses to the Proposed Rule
Large manufacturers, which are assumed to operate automated lines, indicated that the two most
commonly used labeling methods are (1) use of preprinted labels (including labels produced by outside
contractors) and (2) use of online printing systems, such as flexographic printers (i.e., printing plates)
(Pitts, 2006; Morin, 2006; Zitella, 2006). Digital printing systems have been coming into use but are still
only used at a modest share of facilities (i.e., probably no more than 15 percent) based on estimates
collected from a number of printing machine vendors.
To model how larger manufacturers would respond to the proposed rule requirements,
manufacturers were placed into three principal groups: (1) those using outside printing contractors to
prepare their labeling, (2) those printing labels in-house using systems poorly suited to print variable
information (e.g., flexographic printers), and (3) those printing in-house using thermal transfer or other
printing systems that can readily accommodate variable information. Table 4-5 below summarizes the
principal choices forecast for the larger medical device manufacturers who use automated lines and 20 Data plate systems produce a plastic or metal plate that is then affixed to the item.

4-21
indicates the percentage in each group that are expected to choose a particular compliance strategy. (The
table also applies to choices smaller manufacturers might make with minor modifications to account for
manual lines; smaller manufacturers are discussed later in this section.) The table reflects a simplified
view of the diverse labeling environment. Nevertheless, it captures the essential requirements of the
potential FDA proposal. The discussions below detail the assumptions used to model the compliance
strategies for each of the three principal groups: those using outside printers, those using thermographic
printers in-house, and those using digital printing systems in-house.
Table 4-5. Characteristics of Manufacturer Baselines and of Expected Compliance Responses (b)
Beginning Manufacturer Characteristics
Current Use of Barcodes/Standard
Numbering
Estimated Share of
Establish-ments (a)
Response to Proposed UDI Labeling Requirement
Probable Impacts Investments
Using outside label printer
None
10% of those using outside printers
With existing or new outside printer, implement number & barcode
Modest increment in per label cost None
Presenting basic product identifying number & barcode (no lot numbers or serial numbers)
88% of those using outside printers
With existing or new outside printer, implement number & barcode
Modest increment in per label cost None
Either using or not using barcodes or other product identifiers at this time
2% of those using outside printers
Regardless of current labeling, change to in-house printing operation; install thermal transfer printers
Significant increase for in-house printing costs
Depends on number of production lines
Using in-house flexographic printing (printing plates)
None or presenting basic product SKU & barcode only (no lot or serial numbers presented in HIBCC or GS1 format)
60% of those with flexographic printing
Modify labeling system to accommodate variable information
Substantial cost to retool in-house printing
Depends on number of production lines
Same
40% of those with flexographic printing
Modify labels so main part is printed by flexographic printers and variable component by thermal transfer
Significant increase for thermal transfer but do not completely retool
Depends on number of production lines
Using in-house thermal transfer printers
Present basic product identifying number and barcode (HIBCC or GS1), static only, at most
100% of those with adequate in-house printing capabilities
Modify labels and add software to increment lot numbers
Modest incremental costs (none equipment- related) None
(a) Estimated by ERG based on discussions with project consultants. (b) For establishments with manual lines, the same percentage is assumed to use outside printers now (40%) as those with automated lines, but the remainder are assumed to have adequate printing in place (60%). Additionally, establishments with manual lines that switch outside printers are assumed to be the same percentage (10%), but we assume all manual lines that do not switch printers add a supplemental label printed in house (90%).
4-22
Compliance Strategies for Larger Manufacturers Using Outside Printers
Although two-thirds of larger medical device establishments are estimated to be using barcodes
on their packaging (AdvaMed, 2004),21
not all of these establishments have the printing equipment in-
house to print variable information in-line. Larger manufacturers that use outside label printers can (1) ask
their outside labeling printers to provide revised labels that incorporate the lot numbers (i.e., to have the
variable information printed by an outside contractor), (2) keep their existing labeling arrangements but
also produce a separate (presumably small) label in-house with the barcoded information (supplemental
labels), or (3) move the entire labeling function in-house. Among these strategies, we judge that the first
two would be much more commonly chosen. The last option would require a much larger investment in
new printing and labeling equipment and this would generally not become cost-effective for a company
that heretofore has not been printing labels in-house. The first strategy requires that manufacturers request
that their outside printing contractor print the variable information needed on the labels. This strategy
requires essentially no initial investment by device manufacturers. However, the manufacturer might need
to adapt a portion of their information technology (IT) system around lot numbers produced by an outside
contractor.
Although most label printing contractors do not now print variable information on device labels,
some barcodes on medical devices are pre-printed by contract printers (Hohberger, 2006). There are no
technical limitations preventing contractors from providing the revised labels, but many would need to
purchase new equipment. These purchases are considered a voluntary response to the potential regulation
by a group that is not directly regulated and are not included as part of the regulatory impact. However,
label printing prices offered by outside contractors are likely to rise because they will need to use
different, higher-cost technologies and they are offering an enhanced service, so much of this additional
cost to printers is assumed passed through to device manufacturers (the size of this increase is considered
further below). Manufacturers who choose to continue to use outside printers will have to adjust to a new
framework in which lot numbers are either (1) assigned outside the facility or (2) assigned by the
manufacturer but then communicated frequently to an outside printer. We make no judgment as to where
lot numbers would originate. Virtually any configuration of printing arrangements appears possible.
21 Secunda (2010) believes that this number has not changed dramatically, because manufacturers are
waiting to see what FDA does in terms of requiring UDI before making changes.
4-23
Certain identifiers, such as those assigned as a date of manufacture (which often occurs with
capital equipment) or lot/batch numbers that are associated with one day’s production, would require little
coordination between manufacturer and printer. The manufacturer can most likely estimate with some
confidence how many labels would be required for each day’s production, and the printer can be
instructed to prepare that number of labels each day with the date or other number assigned for each day’s
lot. For other manufacturers, assignment of lot numbers by the printing contractor might prove awkward
unless lot numbers or other variable identification information are not meaningful or important to tracking
operations or unless the manufacturer can determine ahead of time how many devices are likely to be
manufactured within a given lot (such as in the example provided above). ERG judged, therefore, that
some manufacturers will continue to use their current outside printers, but others might contract with a
new printing establishment able to print variable information, or bring all (or part of) their printing
operations in house.
The second strategy requires the purchase of one or more thermal transfer or other printers that
can print barcode information, both static and variable. Many manufacturers would be able to use a single
printer to prepare supplemental labels for displaying the barcode, leaving the original label and/or
package printing unchanged or with very minor modifications to allow placement of the barcode. For
example, a printer industry executive indicated that electrical medical devices (a category which includes
many capital assets, such as laboratory equipment and many monitors and measurement devices)
currently must carry an Underwriters’ Laboratory (UL) label throughout their useful life (Hohberger,
2006). A UDI number could be added to this label at a relatively minimal cost. This change would not
require any investment in new equipment for manufacturers now placing UL labels. For this possibility,
FDA would need to accept placement of the UDI on a stick-on label as opposed to the basic packaging.
As noted earlier, ERG assumes FDA would allow placement of supplementary labels displaying the
barcoded UDI.
The third strategy requires moving the entire label production operation in-house. Only a small
percentage of manufacturers are expected to do this because it entails significant costs and may not be
cost-effective for many manufacturers. This choice would be made by firms that cannot accommodate lot
numbers produced by outside vendors, for example if meaningful lot numbers cannot be specified in
advance, or if numbers of devices within a lot cannot be specified with enough certainty. These firms
would presumably also not be able to accommodate a supplemental label for the barcode. Some firms,
however, might opt for this approach for business reasons unrelated to such issues. For example, the
4-24
literature notes that medical device manufacturers have shown an increasing interest in in-line printing of
labeling (Vaczek, 2006; Allen, 2004; Hackett, 2002).
Compliance Strategies for Larger Manufacturers Using In-House Non-Digital Printing Technologies
Many larger manufacturers printing in-house are using flexographic (printing plate) technology,
which is poorly suited to incorporating barcodes containing variable information. (This generalization
might not hold where lot sizes are so large that preparation of a printing plate with variable information is
economic, but few production lines meet that criterion.) These manufacturers have the option of revising
their entire label printing methods by switching out their flexographic printers for thermal transfer or
other digital equipment, or by preparing supplemental labels to affix to their existing labels. The
complexity of their compliance methods would vary with the demands of their labeling. A number of
medical device manufacturers are known to be using thermal transfer in-line printing to print variable
information (e.g., lot and expiration dates) on demand (Summit Publishing Company, 2000, Hackett,
2002; Medical Device Manufacturer A, 2006).
Compliance Strategies for Larger Manufacturers Using In-House Digital Printing Technologies
A small share of large manufacturers has equipment that can accommodate the proposed UDI
requirements for some or all of their production lines. Among those companies that are not now
presenting lot number information in a form that satisfies the proposed FDA requirement, all should be
able to accommodate the requirement without major equipment changes on lines where their digital
equipment is in place.
Very Small Manufacturers: Baseline Labeling and Likely Responses to the Proposed Rule
In contrast to larger manufacturers, very small manufacturers (i.e., those with approximately 1 to
9 employees) are expected to commonly use digital printing, using a laser printer to print manually
applied labels. Their labeling operations are probably similar to those of the small R/Rs contacted (see
Section 4.3.2). Consequently, very small manufacturers would likely have fewer responses to the
proposed rule than larger manufacturers.
ERG contacted one very small manufacturer who printed labels in-house using a laser printer.
This manufacturer did place barcoding on the label of at least one product line (Small Manufacturer A,

4-25
2008). ERG also contacted an additional very small manufacturer with special printing needs (washable
labels; labels that can withstand interiors of battery boxes). This manufacturer uses an outside printer. The
manufacturer indicated that the outside printer would not have a problem dealing with either variable or
static barcoding (although labels were not currently barcoded); their contract printer already prints serial
numbers on their device labels (Small Manufacturer B, 2008). This latter manufacturer also noted that
they would continue to use their outside printer if they were required to barcode, but with enough lead
time, might bring the printing process in-house. Neither of these very small manufacturers would have to
make major changes to their equipment or their current practices, although both noted that per-label costs
would increase sharply with a variable barcode among their low-volume products.22
ERG assumes that 60 percent of very small manufacturers currently use digital printing
equipment and 40 percent currently use outside printers (the same breakout that was assumed for larger
manufacturers). Of those assumed to be using outside printers, 75 percent (or 30 percent of all very small
manufacturers) are assumed to bring labeling in-house (using an existing laser printer) and 20 percent (or
8 percent of all very small manufacturers) are assumed to continue to use an outside printer (their current
printer or a new printer, if necessary). ERG assumes that many very small operations with straightforward
printing needs will opt to bring printing in-house, given that the incremental cost of using laser printers on
manual lines is very small. In-house printing also offers simpler implementation of variable information
in the printing process. Only 10 percent of very small establishments (or 2 percent of all very small
manufacturers) currently using outside printers are assumed to use a supplemental labeling approach
(produce a separate label in-house with the barcoded information), due to the expense of manually
applying a second label. Only a few establishments with more elaborate labels who do not wish to
coordinate variable information with an outside printer are assumed to use this approach.
4.3.1.3.2 Equipment Costs for Compliance Strategies
ERG determined that there are several categories of equipment that might be needed by
manufacturers that currently do not barcode variable information on medical device labels, should they
opt to print labels in house (software needs are discussed later in Section 4.3.1.6). These categories
include:
• Label printing and scanning equipment
22 The increase would be generated by either the time to apply a supplementary label or by an increase in
price charged by the printer

4-26
• Barcode verifiers • New label applicator equipment • Engineering/installation costs
Not all equipment would be needed by all manufacturers and these equipment needs would vary
depending on whether the establishment operates manual, low-speed automated, or high-speed automated
packaging and labeling lines.
Label Printing and Scanning Equipment
ERG obtained several estimates of the costs to install a new label printing and scanning capability
in manufacturing facilities. For example, a large medical device manufacturer estimated that the
investments per printer would average $5,000 to $10,000 (Medical Device Manufacturer A, 2006). ERG’s
subcontractor estimated printing and scanning costs at approximately $5,000 per application.23
Because
these estimates were prepared several years ago, ERG allowed for some increase in costs over time and
judged that an average cost of $6,000 per label printer per production line would suffice. ERG judged that
each production line would need its own label printer in all but the smallest manufacturing
establishments. The establishments with fewer than 20 employees were assumed to rely on their existing
label printing capabilities and to make no purchases. This estimate was based on the judgment that these
facilities are producing labels at low to moderate production rates that can be satisfied by their existing
printing capacity.
It will be possible for medical device manufacturers to comply by printing supplemental labels
for their devices. Thus, the establishment would simply print a new label with the barcode data. One
printer vendor (Hohberger, 2006), a printer manufacturer executive, estimated that a basic equipment set
would cost roughly $3,000, with higher speed or higher quality equipment costing approximately $6,000.
We have included the possibility of supplemental labeling because it represents a legally adequate means
of complying with the regulation. This option might allow some firms to continue to use outside label
printing contractors for their main label (which would not carry UDI barcodes), while adding an in-house
on-line printing capability for their UDI label. We have forecast that relatively few establishments would
make this selection, primarily when there is some chance of confusion in their labeling or to avoid two
labeling functions. Nevertheless, this choice might make economic sense for firms that have some
23 Scanners are assumed necessary to meet presumed basic barcode readability requirements (that is, it is
not enough that a barcode appear on a label—it must be readable; use of scanners ensures that printed barcodes can be read by a scanner).
4-27
restrictions in their other labeling choices. Firms might not want to perform the main labeling task while
also not wanting to share variable production information with an outside contractor.
Label Applicator Equipment
A minority of establishments would also need label applicators. Applicators might be needed in
higher speed production operations. ERG calculated a weighted average cost for an applicator based on a
unit cost of $2,500 (Mass Group, 2007), assuming 25 percent of larger establishments installing either a
new label system or a supplemental label system would require an applicator, resulting in a weighted
average cost of $625 per facility.
Barcode Verifiers
The proposed UDI regulation does not specify a standard of readability for the barcoded
information, but there is a presumption of readability. Therefore, we assume that labelers would need to
verify the quality of their printed barcodes (a scanner simply indicates that a barcode can be read, not the
quality of the barcode). This verification step is part of the quality system and would help to ensure that
manufacturers have affixed the correct UDI.
Verifiers are generally too slow for production line use (requiring 15 seconds or more to ascertain
the quality of the barcode), but it is not generally necessary to verify 100 percent of the production. Thus,
we do not forecast that verifiers would be placed on the production line, but would be used instead as part
of the quality program, with barcoded labels sampled from the production lots. Verifiers are small units
and can be brought to the production line, as needed. Our estimates assume that manufacturers with
multiple production lines would purchase more than one verifier.
Barcode verification equipment is sold by a number of vendors. We have identified prices
ranging from approximately $2,000 to $15,000 from various contacts. We have used estimates of $5,000
and $12,000 to represent the lower and upper end averages for this equipment. For manual production
lines, we judged that handheld scanners would suffice to determine whether barcodes are readable. Lower
speed printing needed on manual lines is expected to contribute to fewer potential quality issues.
Additionally, verifiers require labor time to operate. It is assumed that the labor requirement to
operate verifiers as a part of the quality system would add 0.15 FTEs at establishments with one
automated line to 1.0 FTEs at establishments with 6+ lines.

4-28
Engineering/Installation Costs
ERG next judged that establishments would incur engineering costs to select, install, and test the
equipment to be added to their production lines. Based on input from a medical device manufacturer,
ERG allotted engineering costs that were roughly equal to 75 percent of the costs of the production line
investments themselves where a new label printing system is being installed (Medical Device
Manufacturer A, 2006).
ERG has included additional costs to integrate the UDI investments into the production line. Most
manufacturers would have some flexibility about the location of the printers and applicator equipment.
The printed labels can be brought to the production line, although some integration of new labeling
operations would be needed. New label applicators, where used, would need to be integrated into the
production or packaging line in some fashion. The cost of integrating the new applicator equipment would
vary widely with the production circumstances.
To capture potential integration costs, ERG added 50 percent to the engineering overhead costs to
bring the total engineering overhead expenses to 125 percent of equipment costs.
Equipment Costs for Smaller Manufacturers with Manual Lines
Manual lines at the smallest manufacturing firms are expected to be associated with significantly
less equipment and lower costs. Discussions with very small manufacturers indicated that they routinely
have access to digital printers, such as laser printers, and currently print labels using this equipment or
their outside contract printers have access to the necessary equipment. Additionally, manual lines do not
need label applicator equipment, nor, given their smaller, slower label throughput, would verifiers be
necessary. Although some very small manufacturers might obtain scanners for their own use, they are
assumed unnecessary in such an environment with only a very few product types with low-speed printing
(barcode readability issues are reduced and any printing problems could be caught by eye during a manual
label application process). ERG assumes that no additional equipment is needed for very small
establishments with manual production lines that do not outsource their label printing.
Equipment Costs for All Affected Establishments
Table 4-6 presents the estimated range of costs for both small establishments with manual lines
and the larger manufacturing establishments with automated lines. The table describes investment costs
for modifying all label printing or for supplementing the existing label with a new label printer
specifically for the UDI information for automated lines and for making minor modifications at manual

4-29
Table 4-6. First-Year Investments per Production Line and Establishment for Barcode, Printer, Verifier, and Overhead Costs
Investment New Label
Printing System
Supplemental Label
Printing
Manual Production
Lines Sources/Assumptions
Printer/scanner set or hand scanner $6,750 $3,750 $200
For full label: Weighted average based on 75 percent of establishments using the minimum printer/scanner pairing costing $5,000 (Mass Group, 2007) and 25 percent of establishments using the high end printer/scanner combination costing roughly $10,000 (Medical Device Manufacturer Contact A, 2006); for supplemental label, costs are $3,000 and $6,000 (Hohberger, 2006 and Sherman, 2006). Manual lines, with small throughput, are assumed to use existing general purpose, office digital printers based on discussions with very small manufacturers (see text); hand-held scanners are assumed sufficient for verification on manual lines. Such scanners, with USB port connection capabilities, can be purchased for less than $200 (barcodesinc.com, 2008).
Applicator $625 $625 $0
New applicator not needed in all cases. Unit cost of $2,500 (MassGroup, 2007) per applicator was assumed to apply to 25 percent of those adding supplemental labeling system. Manual lines are assumed not to require an applicator.
Verifier $12,000 $5,000 $0
Various industrial consultants (including Villotti, 2010, and Mara, 2010) estimate verifier costs as ranging from $4,000 to $15,000. Unit costs of $12,000 and $5,000 were used to represent the high-end and lower end averages. Manual lines are assumed to use scanners in lieu of verifier (see text).
Engineering overhead for equipment $24,219 $11,719 $250
Estimated at 75 percent of equipment costs (Medical Device Manufacturer A, 2006). An additional 50 percent overhead allotted to allow for integration of equipment into production line.
Totals
1 production line $43,594 $21,094 $450 Includes printer/scanner, applicator (as necessary), verifier and overhead for automated systems; manual systems assumed to need only a verifier.
2-3 production lines $46,813 $21,094 NA
New system includes 1 verifier and 2 printer/scanners and applicators (as necessary), with overhead; supplemental assumed to need only one of each.
4-5 production lines $93,625 $24,063 NA
New system includes 2 verifiers and 4 printer/scanners and applicators (as necessary), with overhead; supplemental increases by one printer/scanner.
6+ production lines $119,438 $31,719 NA
New system includes 2 verifiers and 6 printer/scanners and applicators (as necessary), with overhead; supplemental increases by one more printer/scanner.
Source: As presented.

4-30
lines. Automated lines have different costs associated with each approach; manual lines have the same cost
regardless of whether they supplement or replace their entire label. Among automated lines, as will be noted,
some of the possible investments would not be needed in all establishments. The unit cost of these items is,
therefore, a weighted average of establishments that require or do not require the equipment. Although data are
limited, ERG projects that the majority of automated establishments do not operate high-speed production lines,
which are associated with higher cost equipment.
The equipment costs that were estimated in Table 4-6 are applied to the estimated distribution of baseline
characteristics of medical device manufacturers described Table 4-5. These distributions are spelled out in detail
in Table 4-7, which shows the distribution in percentage terms of manual vs. automated lines, baseline printing
capabilities, and likely compliance strategies. Table 4-7 further presents the aggregate costs calculated using the
per-establishment costs by number of production lines and the assumed percentage of establishments in each
category of baseline and compliance strategy characteristics. The numbers of establishments reflect the removal
of those establishments assumed already to be printing variable barcodes.
In distributing the establishment costs across the industry, ERG made two other important assumptions.
First, ERG estimated the number of production lines in relationship to the distribution of employment in the
industry. Thus, establishments with 1-9 employees (1,183) were assumed to have one manual production line,
establishments with 10-99 employees (2,176 establishments) were assumed to have one automated production
line, and establishments with 100-249 employees (359 establishments) were assumed to have two automated
production lines. Second, ERG judged that ¾ of establishments with over 250 employees (194 establishments)
were assumed to have 4-5 production lines and ¼ were assumed to have 6 or more production lines (65
establishments).
With this format, ERG calculated the costs for manufacturers to modify their label printing systems. The
aggregate costs indicate investments totaling $71.5 million. Operating costs are estimated at 10 percent of
investment costs and total $7.2 million per year. With labor to operate verifiers added in, annual costs are $36.5
million per year.
4.3.1.4 Dir ect M ar king C osts
FDA would require manufacturers of permanently implanted devices and devices intended for multiple
uses that require sterilization between uses (e.g., surgical instruments; called multi-use devices for this discussion)
to be permanently marked. Software developers would need to add a UDI to a new or already-developed

4-31
Table 4-7. Equipment Investments for UDI Requirements
Establishments, by Baseline Label Printing System
Manual Lines (% Establish-
ments)
Automated Lines (% Establish-ments) (b)
Equipment Costs, by Number of Production Lines (a)
Total
Manual Automated
1 line 1 line 2-3 lines 4-5 lines 6+ lines Number of establishments, by assumed number of prod. Lines 1,883 2,176 359 148 110 4,677 Per establishment costs to install full on-line label printing system NA $43,594 $46,813 $93,625 $119,438
Per establishment cost to install supplemental label system NA $21,094 $21,094 $24,063 $31,719 Per establishment FTEs to operate verifiers $0 0.15 0.30 0.60 1.00
Per establishment cost to operate verifiers (c) $0 $6,947 $13,894 $27,787 $46,312 Per establishment costs to print labels--manual lines $450 NA NA NA NA
Establishments using outside label printers 40% 40% Switch to new outside label printer, add lot #s (10% of 40%) (d) NA 4% NA NA NA NA NA NA Move entire label operation in-house (2% of 40%) NA 1% NA $758,914 $134,446 $110,958 $105,229 $1,109,547 Add small supplemental label, applied in-house (88% of 40%) NA 35% NA $16,157,528 $2,665,586 $1,254,753 $1,229,599 $21,307,466 Man. line: switch to new outside label printer, add lot#s (20% of 40%) 8% NA NA(d) NA NA NA NA NA Man. line: move entire label operation in-house (75% of 40%) 30% NA $254,238 NA NA NA NA $254,238 Man. line: add small supplemental label, applied in-house (5% of 40%) 2% NA $16,949 NA NA NA NA $16,949 Establishments printing labels in-house with printing systems that do not accommodate variable information 0% 45% Modify entire label printing operation (60% of 45%) 0% 27% $0 $25,613,354 $4,537,554 $3,744,816 $3,551,480 $37,447,204 Add small supplemental label, applied in-house (40% of 45%) 0% 18% $0 $8,262,372 $1,363,084 $641,635 $628,772 $10,895,863 Establishments w/label printing systems accommodating var. data 60% 15%
Modify label with existing printing equipment (100% of 15%) NA 15% $0 NA NA NA NA NA Man. line: modify label w/existing equipment (100% of 60%) 60% NA $508,476 NA NA NA NA $508,476 Total Investment $71,539,744 Total labor for operating verifiers $0 $15,116,928 $4,987,826 $4,116,423 $5,100,335 $29,321,512 Total O&M (10 percent of equipment cost) plus Labor $36,475,487 (a) From Table 4-6. Numbers of establishments are from Table 4-2, adjusted for the 3 percent of manufacturers who are assumed to be printing variable barcodes at the present time. These counts exclude small manufacturers assumed to be manufacturing custom devices or who are assumed to be using UPCs exclusively (b) From Table 4-5 and ERG assumptions (see text). (c) Assumes a wage rate plus 29 percent fringe of $22.27 per hour (BLS, 2009) for inspectors in NAICS 339 for the number of FTEs noted in the line above. (d) Incremental costs for outside printer labels assumed primarily costs of coordination, which is passed through to labelers. This cost is captured in Table 4-12.
4-32
startup screen or “about” screen for standalone software. Section 4.3.1.4.1 discusses the requirements and
costs for direct marking for implants and multi-use devices. Section 4.3.1.4.2 discusses requirements and
costs for standalone software.
4.3.1.4.1 Requirements and Costs for Implants and Multi-Use Devices
Implants and multi-use devices would need to be marked directly using either a barcode or easily
read plain text. However, FDA has allowed for exceptions. Firms can obtain exceptions when their device
materials are not suitable for marking, or when marking poses safety and health issues, when the device is
too small to mark, or where the curvature of the device surface makes mark impractical (it is difficult to
read marks on curved surfaces). The majority of exceptions to multi-use devices are expected to be based
on size and curvature issues.
The types of devices covered by the DM requirements would generally be manufactured by
establishments in NAICS 339112 and 339113. According to the NAICS descriptions, implants are
primarily captured in 339113, but that product type is only one of very many product types captured in
that NAICS. Multi-use devices are likely to include most surgical instruments plus additional components
of equipment that are used during surgery, such as bronchoscopes or endoscopes that are assumed already
marked because the label is affixed directly to the device (where a label can be permanently affixed to the
device, no additional marking is required). Surgical instruments and other multi-use equipment comprise
a major portion of the products listed in NAICS 339112.
ERG received lists of product codes from FDA that were judged likely to meet the definition of
implant or multi-use equipment. Using FDA’s registration and listing database (FDA, 2010a), ERG
identified the manufacturers and specification developers that list a device with a product code indicating
either an implant or a multi-use device.24 Table 4-8 presents the counts of establishments with listed
devices meeting implant or multi-use device definitions (according to FDA). These counts have been
distributed using Census data on the distribution of establishments by employment size class for NAICS
391112 (multi-use devices), 391113 (implants), and 541330 (specification developers) (U.S. Census
Bureau, 2010b). As the table shows, 1,222 establishments (517 with multi-use items and 705 with
implants) might need to do direct marking on at least one implantable or multi-use product out of the
4,784 labelers estimated to be affected by the proposed rule (26 percent). 24 There are no establishments that are counted twice, having both a device coded as an implant and one
coded as a multi-use device; the count of establishments, therefore, can be compared to the total number of device labeling establishments.
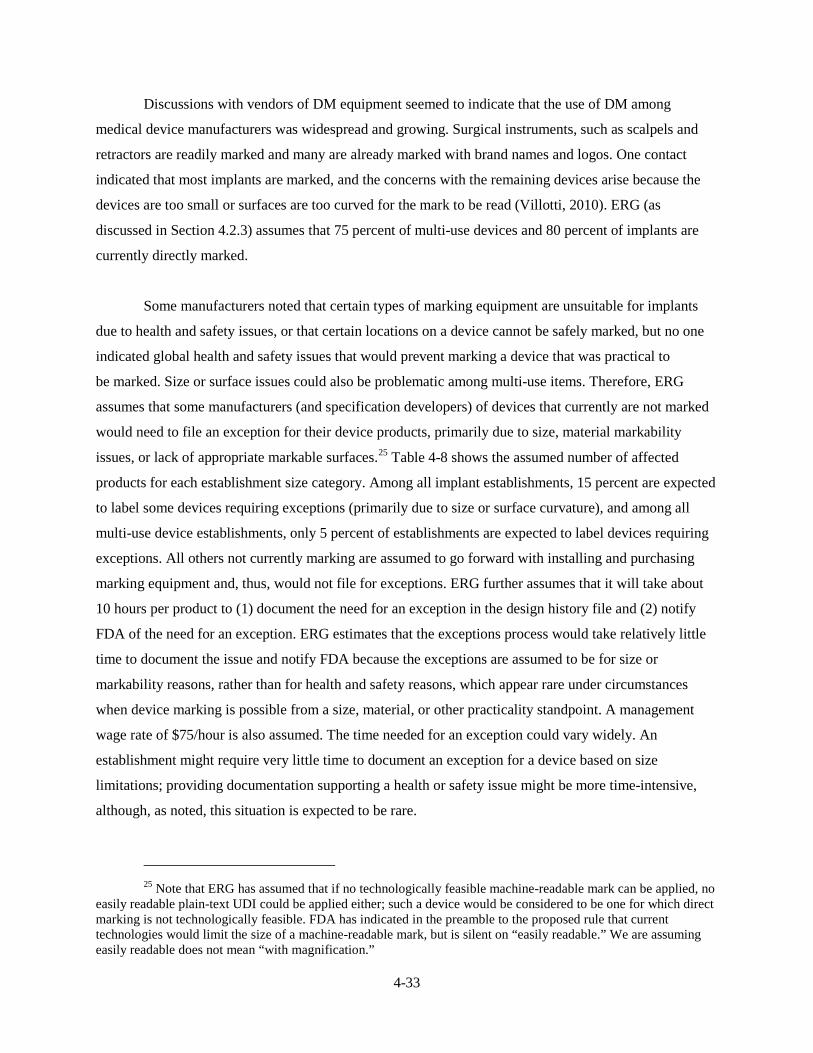
4-33
Discussions with vendors of DM equipment seemed to indicate that the use of DM among
medical device manufacturers was widespread and growing. Surgical instruments, such as scalpels and
retractors are readily marked and many are already marked with brand names and logos. One contact
indicated that most implants are marked, and the concerns with the remaining devices arise because the
devices are too small or surfaces are too curved for the mark to be read (Villotti, 2010). ERG (as
discussed in Section 4.2.3) assumes that 75 percent of multi-use devices and 80 percent of implants are
currently directly marked.
Some manufacturers noted that certain types of marking equipment are unsuitable for implants
due to health and safety issues, or that certain locations on a device cannot be safely marked, but no one
indicated global health and safety issues that would prevent marking a device that was practical to
be marked. Size or surface issues could also be problematic among multi-use items. Therefore, ERG
assumes that some manufacturers (and specification developers) of devices that currently are not marked
would need to file an exception for their device products, primarily due to size, material markability
issues, or lack of appropriate markable surfaces.25 Table 4-8 shows the assumed number of affected
products for each establishment size category. Among all implant establishments, 15 percent are expected
to label some devices requiring exceptions (primarily due to size or surface curvature), and among all
multi-use device establishments, only 5 percent of establishments are expected to label devices requiring
exceptions. All others not currently marking are assumed to go forward with installing and purchasing
marking equipment and, thus, would not file for exceptions. ERG further assumes that it will take about
10 hours per product to (1) document the need for an exception in the design history file and (2) notify
FDA of the need for an exception. ERG estimates that the exceptions process would take relatively little
time to document the issue and notify FDA because the exceptions are assumed to be for size or
markability reasons, rather than for health and safety reasons, which appear rare under circumstances
when device marking is possible from a size, material, or other practicality standpoint. A management
wage rate of $75/hour is also assumed. The time needed for an exception could vary widely. An
establishment might require very little time to document an exception for a device based on size
limitations; providing documentation supporting a health or safety issue might be more time-intensive,
although, as noted, this situation is expected to be rare.
25 Note that ERG has assumed that if no technologically feasible machine-readable mark can be applied, no
easily readable plain-text UDI could be applied either; such a device would be considered to be one for which direct marking is not technologically feasible. FDA has indicated in the preamble to the proposed rule that current technologies would limit the size of a machine-readable mark, but is silent on “easily readable.” We are assuming easily readable does not mean “with magnification.”
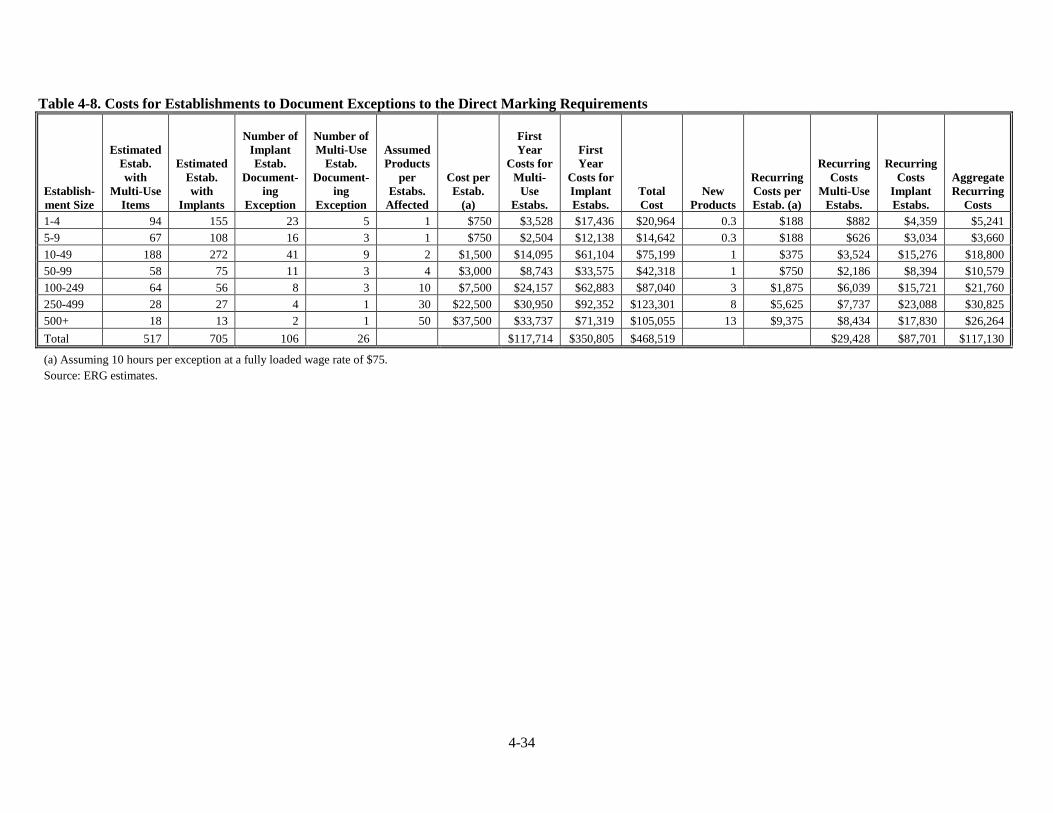
4-34
Table 4-8. Costs for Establishments to Document Exceptions to the Direct Marking Requirements
Establish-ment Size
Estimated Estab. with
Multi-Use Items
Estimated Estab. with
Implants
Number of Implant Estab.
Document-ing
Exception
Number of Multi-Use
Estab. Document-
ing Exception
Assumed Products
per Estabs.
Affected
Cost per Estab.
(a)
First Year
Costs for Multi-
Use Estabs.
First Year
Costs for Implant Estabs.
Total Cost
New Products
Recurring Costs per Estab. (a)
Recurring Costs
Multi-Use Estabs.
Recurring Costs
Implant Estabs.
Aggregate Recurring
Costs 1-4 94 155 23 5 1 $750 $3,528 $17,436 $20,964 0.3 $188 $882 $4,359 $5,241 5-9 67 108 16 3 1 $750 $2,504 $12,138 $14,642 0.3 $188 $626 $3,034 $3,660 10-49 188 272 41 9 2 $1,500 $14,095 $61,104 $75,199 1 $375 $3,524 $15,276 $18,800 50-99 58 75 11 3 4 $3,000 $8,743 $33,575 $42,318 1 $750 $2,186 $8,394 $10,579 100-249 64 56 8 3 10 $7,500 $24,157 $62,883 $87,040 3 $1,875 $6,039 $15,721 $21,760 250-499 28 27 4 1 30 $22,500 $30,950 $92,352 $123,301 8 $5,625 $7,737 $23,088 $30,825 500+ 18 13 2 1 50 $37,500 $33,737 $71,319 $105,055 13 $9,375 $8,434 $17,830 $26,264 Total 517 705 106 26 $117,714 $350,805 $468,519 $29,428 $87,701 $117,130
(a) Assuming 10 hours per exception at a fully loaded wage rate of $75. Source: ERG estimates.

4-35
Additionally, ERG assumes that new products might require exceptions in ongoing years. We
assume that the count of such products would be one-quarter of the original number of products needing
exceptions in each year.
Table 4-8 shows that, under these assumptions, applying for an exception from direct marking for
every establishment involved in DM for at least a few of their devices could cost about $0.5 million
initially and about $0.1 million each following year.
Based on discussions with vendors and manufacturers, ERG assumes that many affected
establishments already do some form of part marking, even if barcodes are not yet widely used. One
vendor noted about 20 percent of their customers who do direct marking use barcodes (Vendor B, 2010).
ERG assumes, therefore, that 80 percent of establishments currently marking do not barcode in their
direct marking. Although FDA would allow the affected devices to be marked with either a barcode or
plain text, device size and configuration in some instances might require the use of a reduced size 2D
barcode, where plain text might not fit. However, it is not difficult to add a software module to existing
software to handle barcodes. A software module designed to create barcodes for direct marking is
sometimes provided at no cost, although perhaps ranges from about $600 to as high as $2,000 (Villotti,
2010; Vendor A, 2010). ERG uses the lower end of the add-on cost range of $600 to represent an average
upgrade cost for the software to print a variable 2D barcode on devices. Because of the relatively modest
cost of adding a barcoding capability, ERG did not attempt to determine the frequency with which
labelers might need to use 2D barcodes in lieu of plain text and assumed that all labelers currently
marking might need to add barcoding software for their marking systems as a worst-case assumption.
Additionally, among those establishments with devices that must be directly marked and that are
currently using some form of direct marking technology (75 percent of multi-use device manufacturers
and 80 percent of implant manufacturers), ERG assumes that the markings must be redesigned among the
80 percent of these establishments because they are not currently barcoding (the redesign is needed to
accommodate a 2D barcode within the logo design or other information currently marked). The cost of
this redesign is assumed the same as that to redesign the main packaging label, which will be discussed
below in Section 4.3.1.5.1 in detail. Table 4-9 presents the assumptions concerning current ownership of
direct marking equipment among multi-use and implantable devices and the assumptions regarding costs
incurred among all those with equipment that do not barcode at this time. As the table shows,
establishments that currently do some DM (without barcoding) will incur software upgrade costs of about
$0.5 million and redesign costs of about $7.3 million, for a total of $7.8 million.
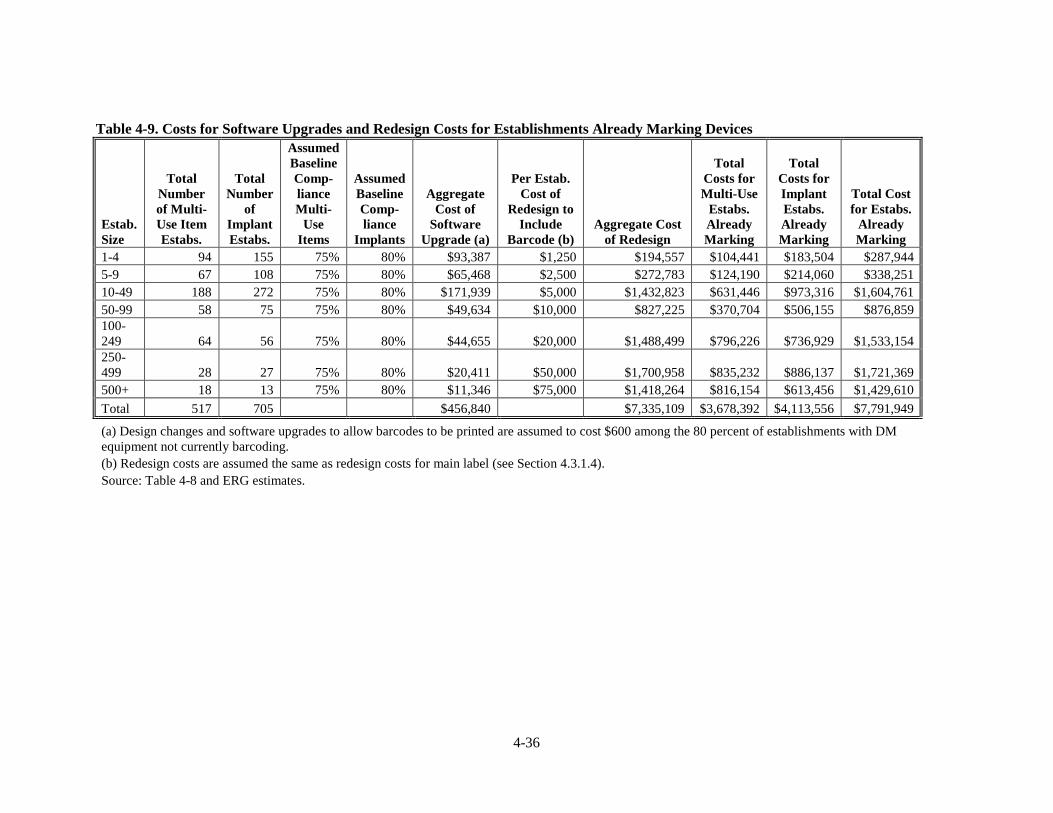
4-36
Table 4-9. Costs for Software Upgrades and Redesign Costs for Establishments Already Marking Devices
Estab. Size
Total Number of Multi-Use Item Estabs.
Total Number
of Implant Estabs.
Assumed Baseline Comp-liance Multi-
Use Items
Assumed Baseline Comp-liance
Implants
Aggregate Cost of
Software Upgrade (a)
Per Estab. Cost of
Redesign to Include
Barcode (b) Aggregate Cost
of Redesign
Total Costs for Multi-Use
Estabs. Already Marking
Total Costs for Implant Estabs. Already Marking
Total Cost for Estabs.
Already Marking
1-4 94 155 75% 80% $93,387 $1,250 $194,557 $104,441 $183,504 $287,944 5-9 67 108 75% 80% $65,468 $2,500 $272,783 $124,190 $214,060 $338,251 10-49 188 272 75% 80% $171,939 $5,000 $1,432,823 $631,446 $973,316 $1,604,761 50-99 58 75 75% 80% $49,634 $10,000 $827,225 $370,704 $506,155 $876,859 100-249 64 56 75% 80% $44,655 $20,000 $1,488,499 $796,226 $736,929 $1,533,154 250-499 28 27 75% 80% $20,411 $50,000 $1,700,958 $835,232 $886,137 $1,721,369 500+ 18 13 75% 80% $11,346 $75,000 $1,418,264 $816,154 $613,456 $1,429,610 Total 517 705 $456,840 $7,335,109 $3,678,392 $4,113,556 $7,791,949
(a) Design changes and software upgrades to allow barcodes to be printed are assumed to cost $600 among the 80 percent of establishments with DM equipment not currently barcoding. (b) Redesign costs are assumed the same as redesign costs for main label (see Section 4.3.1.4). Source: Table 4-8 and ERG estimates.

4-37
Costs for equipment among establishments assumed not to have DM equipment are estimated as
follows and are based on various information from vendors (Villotti, 2010; Vendor A, 2010; Vendor B,
2010; Vendor C, 2010).
Before per-establishment costs are discussed, ERG calculates the number of establishments that
would need to install equipment. Those establishments that do not mark are identified (25 percent of
multi-use device establishments and 20 percent of implant establishments). These counts do not include
the numbers of establishments expected to file exceptions (see Table 4-8). The total numbers of
establishments estimated to purchase equipment are shown in Table 4-10.
Next, ERG reviewed the type of equipment that might be needed. The two likeliest DM marking
systems for use with medical devices are CO2 lasers and yttrium aluminum garnet (YAG) lasers. CO2
lasers are relatively inexpensive, but require inks when used to engrave metal (although not when
engraving plastics). YAG lasers are more expensive but have very low maintenance costs and do not
require consumables. ERG assumes, based on information provided by vendors, that a CO2 laser would
cost about $12,000 to purchase, while a YAG laser would cost about $55,000 to purchase. An engineering
cost of 75 percent for installation of DM equipment into the production lines is also assumed. Because of
the need to add inks to be able to read engraving when using a CO2 laser (Vendor C, 2010) and questions
about whether the inks would be compatible with implanted devices, ERG assumes the more expensive
YAG lasers would be used for all implantables. At high product volumes, the consumables cost of a CO2
laser tends to make the YAG laser more cost-effective, so YAG lasers are assumed for larger
establishments. O&M costs are calculated at 10 percent of all one-time costs. Furthermore at the very
largest establishments, highly automated, high-speed integrated laser systems are assumed to be used on
at least some of the product lines. These laser systems can cost from $150,000 to over $1 million,
although usually these types of lasers are found only in special applications, such as semiconductor
manufacturing (Vendor B, 2010). ERG assumes that the highest speed lines at some of the large
establishments would be fitted with such a laser system at $150,000 per laser (one laser out of four at
establishments with 4-5 lines and two lasers out of six at establishments with six or more lines).
Validation that the health and safety aspects of the devices would not be compromised by the
direct marking is assumed to involve a minimum effort in most cases because ERG did not find any
issues with marking devices that would entail a health and safety issue. Most operations are assumed able
to show that no health and safety issues would arise without performing extensive product testing. A total
of 40 hours at a wage rate of $75 (for managerial wage and fringe) is assumed, generating a cost of
4-38
Table 4-10. Costs to Install and Operate Direct Marking Equipment among Establishments Not Currently Marking
Estab. Size
Total Number of Multi-Use Item Estabs.
Total Number
of Implant Estabs.
Multi-Use Item
Estab. Needing Equip-
ment (a)
Implant Estab.
Needing Equip-
ment (a)
Assumed No. of
Lines (b)
Capital Cost plus
Installation for
YAGs/High Speed Lasers per Estab. by
Size (c)
Process Redesign Costs for Implant Manuf.
(d)
Capital Cost plus
Installation Assuming
CO2 Lasers
One Time Costs for Multi-Use Items (e)
One-Time Costs for Implants
(e) Total-One Time Costs
Total O&M
Costs (f) 1-4 94 155 19 8 1 $96,250 $25,000 $21,000 $451,635 $962,852 $1,414,487 $141,449 5-9 67 108 13 5 1 $96,250 $25,000 $21,000 $320,491 $670,287 $990,778 $99,078 10-49 188 272 38 14 1 $96,250 $75,000 $21,000 $902,065 $2,366,075 $3,268,140 $326,814 50-99 58 75 12 4 1 $96,250 $100,000 $21,000 $279,776 $743,303 $1,023,080 $102,308 100-249 64 56 13 3 2 $192,500 $150,000 NA $2,557,456 $973,982 $3,531,438 $353,144 250-499 28 27 6 1 4-6+ $640,938 $200,000 NA $3,600,837 $1,169,017 $4,769,855 $476,985 500+ 18 13 4 1 4-6+ $820,313 $250,000 NA $3,011,323 $688,979 $3,700,303 $370,030 Total 517 705 103 35 $11,123,585 $7,574,495 $18,698,080 $1,869,808
(a) Subtracts those applying for exceptions as calculated in Table 4-8 and assuming a 75 percent baseline compliance rate among multi-use device establishments and 80 percent among implant establishments. (b) Assumptions about numbers of lines are the same as those used in Table 4-7.
(c) Includes engineering costs assumed at 75% of capital expenditures. Also assumes that two largest sizes install 1-2 fully automated lasers at $150,000 per laser. Only smaller operations producing multi-use items are assumed to use CO2 lasers due to high cost of materials. Only YAGs or high speed lasers are assumed for implants. (d) Process redesign costs would vary widely. ERG judged that costs would increase with establishment size, from $25,000 to $250,000 per establishment. (e) One time costs include 40 hours per line at $75/hour to validate operations showing no health and safety issues based on similar devices with markings currently in use. (f) O&M assumed at 10 percent of one-time costs. Source: ERG estimates and discussions with vendors (see text).
4-39
$3,000 per production line. If extensive product testing is required for some products, validation costs
could be substantially greater. Such a possibility is discussed in the uncertainty analysis in Section Eight.
Costs to establishments that manufacture or specify implants and multi-use devices are estimated
to be about $18.7 million, with recurring costs of about $1.9 million per year (see Table 4-10).
4.3.1.4.2 Standalone Software
Standalone software would be required to have the UDI present on the startup page or in a menu,
such as in the help menu under an “About…” selection. Because FDA has provided, at a minimum, 3
years between promulgation and implementation, and because software revisions are made frequently,
ERG assumes that the work to add the UDI in these locations within the software would be integrated into
regular revision and update cycles. Most of the time needed to meet this requirement is for planning the
implementation of UDI in general, and this has been accounted for in Section 4.3.1.1. Time needed to add
the UDI within the software itself (while the startup page is being edited to contain a new version
identifier and/or revision date) is considered to be a negligible increment to the 30 to 720 hours allotted to
the various size establishments to plan for UDI implementation. Additionally, future software revisions
would require new UDIs, but again these changes would be incorporated while other revisions were being
made to the software. Furthermore, some software is not packaged nor labeled in the traditional sense
(e.g., it might be sold via the Internet as a downloadable electronic file). Thus, it is likely that general
labeling costs (e.g., for printing and materials) assigned to such software establishments and firms are
overstated. Therefore, it is assumed that the cost of including a UDI in standalone software is negligible.
4.3.1.5 C osts R elated to C hanges to Device L abels
ERG identified several additional label-related cost elements that will also affect the costs of
implementing UDI labeling systems at medical device companies. The cost elements include:
• Cost to modify label content • Inventory loss; and • Cost of new or incremental label materials. The first two cost items are one-time costs, while the last cost item is a recurring incremental cost
of meeting the UDI requirements. The following sections present the one-time costs, then the recurring
costs of relabeling.
4-40
4.3.1.5.1 Label Redesign Costs
ERG determined that incremental relabeling costs associated with the potential need to modify
product labels and/or stickers would be incurred by manufacturers in meeting proposed rule requirements.
ERG previously developed a model to estimate medical device relabeling costs (ERG, 2002). The model
was based on a shelf-keeping-unit (SKU)-based paradigm for revising labeling. Thus, ERG judged that
manufacturers consider most labeling changes on a SKU-by-SKU basis. With a much-expanded use of
online printing, however, the potentially universal applicability of UDI requirements, and the possibility
that some establishments would add supplemental labels to all devices, the SKU-by-SKU model was
judged to be much less relevant. Several elements of the changing relabeling circumstances are:
• With digital on-line printing technologies (as opposed to traditional SKU-based relabeling needs), several traditional elements of relabeling costs are of reduced or negligible significance. For example, with on-line labeling, labels can be generated on an as-needed basis and small or no labeling inventories are discarded for each label change. In ERG’s previous model, loss of label inventories was a significant cost factor.
• Because UDI does not require changes to label text other than to include the UDI barcode,
there is little need for a SKU-by-SKU labeling review, such as that which might involve marketing, legal, medical and other departments. Further, if UDI is to be applied comprehensively, manufacturers are likely to identify methods to accomplish the relabeling using techniques applicable to all device models, rather than by revising all labels in a SKU-specific fashion.
• With UDI, a key cost element is integration/coordination of a UDI program into the company information technology (IT) infrastructure. This cost element is generally not SKU-based, and would vary with the extent of IT development among manufacturers.
ERG received one set of estimates from an IT manager of a large medical device company that
recently moved from linear barcoding to a two-dimensional barcode system that supports UDI as defined
in the proposed rule (static and variable information displayed in a barcode). This executive estimated that
his company spent approximately $50,000 converting their current barcode numbers for 27,000 products
(Manufacturer A, 2006). He also noted that there are considerable economies of scale to such an
undertaking, as the cost would have been the same whether they had done 5 products or 27,000. This
estimate also includes the costs of integrating the UDI into operations and notifying customers of the
change in numbering. This company already had thermal transfer printers on their production lines and
was previously barcoding products (using traditional, static, product identification bar codes). Overall,
ERG considered this estimate to be extremely low for average labeling experiences, although it
potentially reflects relabeling costs at companies with high levels of technical integration.
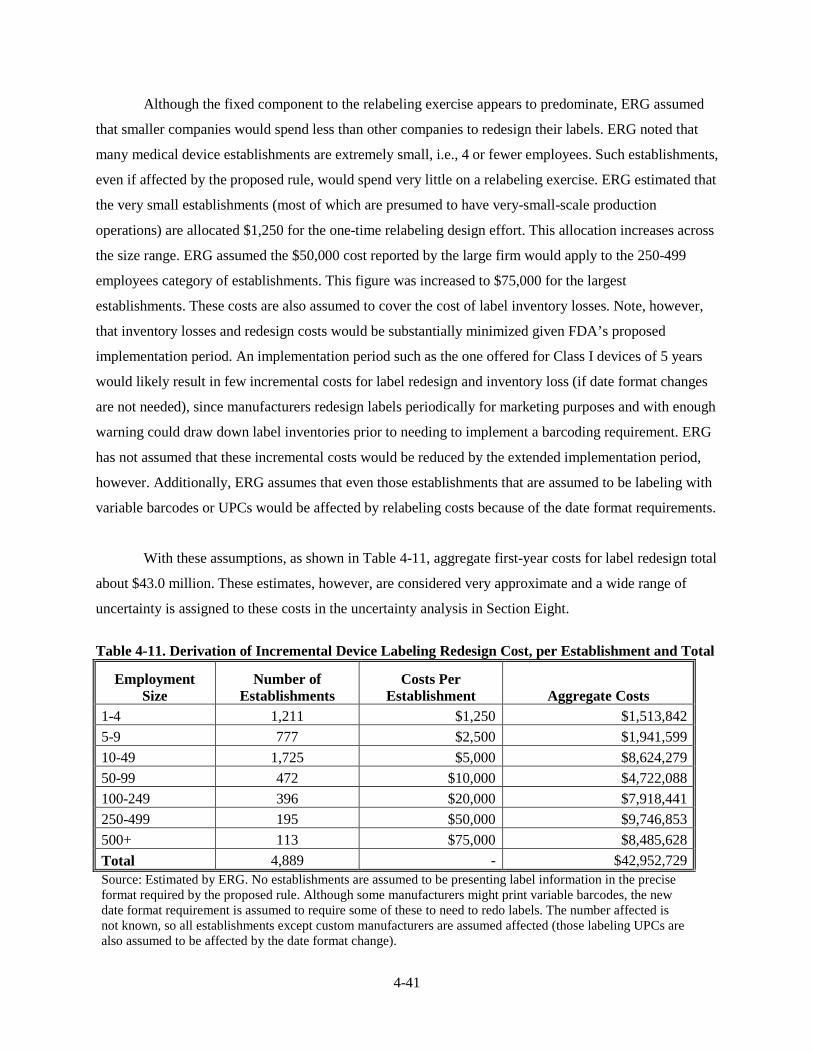
4-41
Although the fixed component to the relabeling exercise appears to predominate, ERG assumed
that smaller companies would spend less than other companies to redesign their labels. ERG noted that
many medical device establishments are extremely small, i.e., 4 or fewer employees. Such establishments,
even if affected by the proposed rule, would spend very little on a relabeling exercise. ERG estimated that
the very small establishments (most of which are presumed to have very-small-scale production
operations) are allocated $1,250 for the one-time relabeling design effort. This allocation increases across
the size range. ERG assumed the $50,000 cost reported by the large firm would apply to the 250-499
employees category of establishments. This figure was increased to $75,000 for the largest
establishments. These costs are also assumed to cover the cost of label inventory losses. Note, however,
that inventory losses and redesign costs would be substantially minimized given FDA’s proposed
implementation period. An implementation period such as the one offered for Class I devices of 5 years
would likely result in few incremental costs for label redesign and inventory loss (if date format changes
are not needed), since manufacturers redesign labels periodically for marketing purposes and with enough
warning could draw down label inventories prior to needing to implement a barcoding requirement. ERG
has not assumed that these incremental costs would be reduced by the extended implementation period,
however. Additionally, ERG assumes that even those establishments that are assumed to be labeling with
variable barcodes or UPCs would be affected by relabeling costs because of the date format requirements.
With these assumptions, as shown in Table 4-11, aggregate first-year costs for label redesign total
about $43.0 million. These estimates, however, are considered very approximate and a wide range of
uncertainty is assigned to these costs in the uncertainty analysis in Section Eight.
Table 4-11. Derivation of Incremental Device Labeling Redesign Cost, per Establishment and Total
Employment Size
Number of Establishments
Costs Per Establishment Aggregate Costs
1-4 1,211 $1,250 $1,513,842 5-9 777 $2,500 $1,941,599 10-49 1,725 $5,000 $8,624,279 50-99 472 $10,000 $4,722,088 100-249 396 $20,000 $7,918,441 250-499 195 $50,000 $9,746,853 500+ 113 $75,000 $8,485,628 Total 4,889 - $42,952,729 Source: Estimated by ERG. No establishments are assumed to be presenting label information in the precise format required by the proposed rule. Although some manufacturers might print variable barcodes, the new date format requirement is assumed to require some of these to need to redo labels. The number affected is not known, so all establishments except custom manufacturers are assumed affected (those labeling UPCs are also assumed to be affected by the date format change).

4-42
4.3.1.5.2 Additional Time and Materials Costs
ERG also considered the increase in labeling costs due to use of slightly larger labels, new
labeling technologies (with a higher rate of use for consumables), or additional supplemental labels.
These costs would be incremental costs incurred in every year going forward.26
There are numerous
influences on the share of total manufacturing costs represented by the immediate product label. We lack
data that isolate the average contribution of incremental label costs as a share of manufacturing costs.
Based on discussions with consultants, however, ERG judged that the incremental label costs
would represent a very small share of manufacturing costs and used an estimate of 0.2 percent of all
material costs in medical device manufacturing, or $2 in $1,000 of materials costs, to represent this cost
element. Table 4-12 summarizes the assumptions and calculations used. Using the distribution of the total
costs of materials for NAICS 339112, Surgical and Medical Instrument Manufacturing, ERG developed
an estimate of the distribution of total material costs by size of establishment. This distribution was then
applied to the total cost of materials for all medical device NAICS. Using this method, we calculated that,
as a baseline figure, labeling costs represent $58.1 million out of $29.1 billion in materials, parts,
containers, and packaging costs.
ERG next assumed that labeling material costs would increase by 10 percent under the proposed
regulation and that all establishments would need to do at least some relabeling (although some
establishments might already be printing variable barcodes, the new date format requirement is expected
to trigger additional relabeling needs). As noted, the increase is the result of several factors, including an
increase in label size, an increase in the rate at which consumable materials, such as ink or toner, are used,
or the addition of a supplemental label with the UDI information. This estimate is also speculative but is
intended to be conservatively large.
Additionally, ERG accounts for very small manufacturers who are assumed to print labels in-
house for a manual production line (60 percent of the 1-9 employment group; see Table 4-7). ERG does
not assume the use of sophisticated software to integrate UDI information and automate labeling changes
to accommodate variable information in the very smallest establishments (see Section 4.3.1.6 below).
26 The potential for additional packaging or labeling needs among a few types of device packages, such as
shelf packs containing unlabeled Class II devices, is discussed in Section Eight (Uncertainty Analysis).
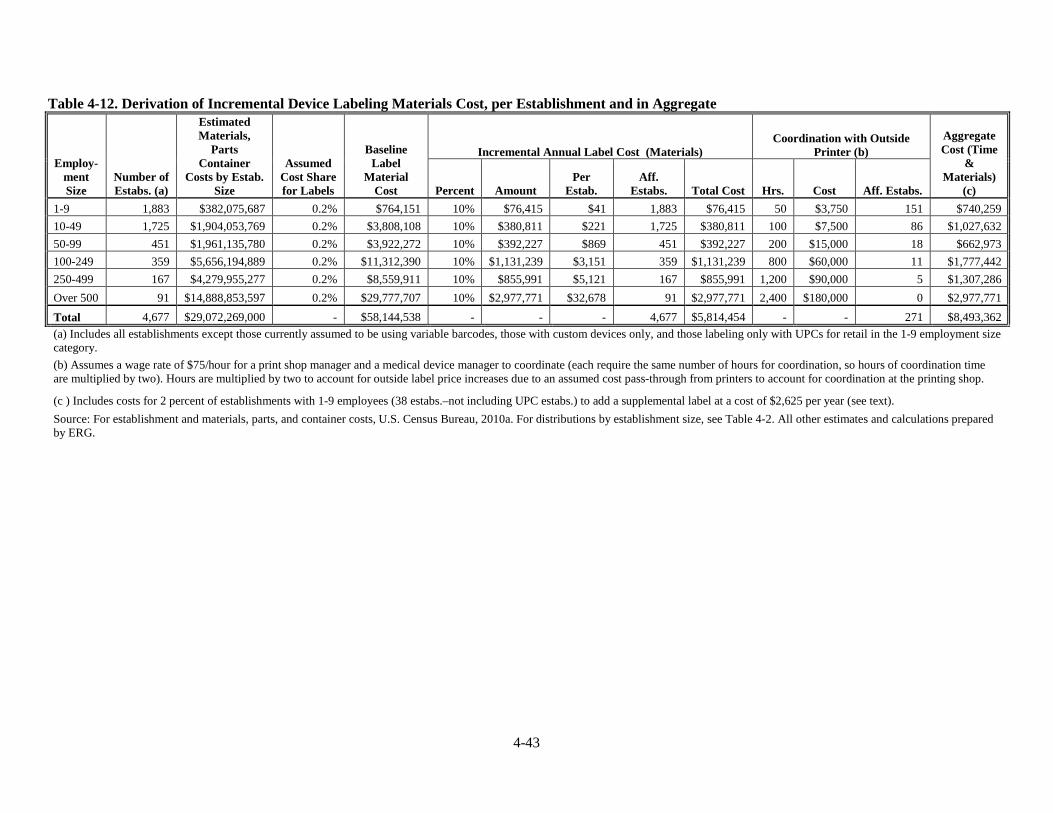
4-43
Table 4-12. Derivation of Incremental Device Labeling Materials Cost, per Establishment and in Aggregate
Employ-ment Size
Number of Estabs. (a)
Estimated Materials,
Parts Container
Costs by Estab. Size
Assumed Cost Share for Labels
Baseline Label
Material Cost
Incremental Annual Label Cost (Materials) Coordination with Outside
Printer (b) Aggregate Cost (Time
& Materials)
(c) Percent Amount Per
Estab. Aff.
Estabs. Total Cost Hrs. Cost Aff. Estabs. 1-9 1,883 $382,075,687 0.2% $764,151 10% $76,415 $41 1,883 $76,415 50 $3,750 151 $740,259 10-49 1,725 $1,904,053,769 0.2% $3,808,108 10% $380,811 $221 1,725 $380,811 100 $7,500 86 $1,027,632 50-99 451 $1,961,135,780 0.2% $3,922,272 10% $392,227 $869 451 $392,227 200 $15,000 18 $662,973 100-249 359 $5,656,194,889 0.2% $11,312,390 10% $1,131,239 $3,151 359 $1,131,239 800 $60,000 11 $1,777,442 250-499 167 $4,279,955,277 0.2% $8,559,911 10% $855,991 $5,121 167 $855,991 1,200 $90,000 5 $1,307,286 Over 500 91 $14,888,853,597 0.2% $29,777,707 10% $2,977,771 $32,678 91 $2,977,771 2,400 $180,000 0 $2,977,771 Total 4,677 $29,072,269,000 - $58,144,538 - - - 4,677 $5,814,454 - - 271 $8,493,362 (a) Includes all establishments except those currently assumed to be using variable barcodes, those with custom devices only, and those labeling only with UPCs for retail in the 1-9 employment size category. (b) Assumes a wage rate of $75/hour for a print shop manager and a medical device manager to coordinate (each require the same number of hours for coordination, so hours of coordination time are multiplied by two). Hours are multiplied by two to account for outside label price increases due to an assumed cost pass-through from printers to account for coordination at the printing shop.
(c ) Includes costs for 2 percent of establishments with 1-9 employees (38 estabs.–not including UPC estabs.) to add a supplemental label at a cost of $2,625 per year (see text). Source: For establishment and materials, parts, and container costs, U.S. Census Bureau, 2010a. For distributions by establishment size, see Table 4-2. All other estimates and calculations prepared by ERG.
4-44
Using these assumptions, the incremental labeling costs for materials are estimated at $5.8
million per year. Although this result is quite sensitive to the assumptions used, it suggests that it is
unlikely that the increased annual costs for incremental consumption of labeling materials are a major
regulatory impact.
Certain establishments would also incur some additional costs associated with time to add
supplemental labels manually (only the smallest establishments are assumed to incur these costs), or to
coordinate with outside printers to ensure proper lot, batch, or serial numbers are printed and to ensure
that numbers of labels with a lot or batch number are printed for the lot/batch group to be produced.
For the very smallest manufacturers, ERG assumes all label applications are manual, thus use of a
supplemental label would require additional time, effectively doubling the labeling process time. Based
on the assumptions shown previously in Table 4-7, ERG has estimated that 2 percent of establishments in
the 1-9 employment group (38 establishments) would decide to use supplemental labels for reasons
related to difficulties coordinating variable numbers with outside printers. The average employment at
establishments with 1-9 employees is estimated to be approximately 4 employees, of which 3 employees
are expected to be involved in production, including labeling. Labeling is estimated to entail about 2
percent of these 3 employees’ time, with the vast majority of time directed towards the device production
itself. Doubling this time means that 3 employees (assuming a 2,080 hour work year) are estimated to
spend an additional 125 hours per year applying a supplemental label. BLS (2009) indicates that in
NAICS 339100 (Medical Equipment and Supplies Manufacturing), the average production operator earns
$16.04/hr., including a 29 percent fringe (BLS, 2010), this is $21/hr., or $2,625 per year per
establishment. In Table 4-12, this cost to the 38 establishments assumed to use supplemental labels is not
shown as a separate activity, but is incorporated into the total costs for time and materials among the
establishments in the 1-9 employment group.
Another group of establishments is also assumed to need additional time for labeling purposes.
All establishments that continue to use an outside printer are assumed to require some coordination time
with their printing contractors to implement variable labels. ERG assumes that for the 8 percent of
smallest establishments estimated to retain an outside printer (see Table 4-7), this coordination would
entail about 25 hours per year (approximately ½ hour per week per line). At larger establishments, ERG
assumed that the hours per week would increase as a function of numbers of product lines. It is further
assumed that as the size of the establishment increases, the complexity of coordination increases as well,

4-45
so that numbers of hours per week per line also increases somewhat as the size of the establishment
increases.
Additionally, some increase in prices charged by outside printers to cover the costs of their time
to coordinate with the device establishments is also assumed. This price increase, assumed to fall on
labelers, is estimated to be approximately the same as the cost to the labelers to coordinate with the
printer (e.g., the outside printer for the smallest establishment would also incur 25 hours per year
coordination time) for a total of 50 hours. Therefore, hours per establishment for coordination are doubled
at each size of establishment. Thus, coordination takes 1 hour per week per line at establishments with 10-
49 employees (with 1 automated line) for two persons (device manufacturer and printer) for a total of 50
× 2 or 100 hours; 2 hours per week per line at establishments with 50-99 employees and 1 automated line
(100 × 2 or 200 hours); and so on.
These estimates are applied to a diminishing percentage of establishments expected to be using
outside printers in the baseline. A total of 4 percent of all larger manufacturers are assumed to be using
outside printers, but the percentage is judged to decline with establishment size. That is, 5 percent of the
10-49 employees group, 4 percent of the 50-99 group, 3 percent of the 100-499 employees group, and 0
percent of the 500+ employees group are assumed to be using outside printers. These percentages produce
an overall 4 percent of total larger manufacturers switching to outside printers, consistent with the
percentage shown in Table 4-7 for manufacturers using automated lines that are assumed to switch to
outside printers. Total costs for materials and the time for coordination and applying supplemental labels
are shown in Table 4-12. The total is $8.5 million, which is incurred annually.
4.3.1.6 Softwar e and I nfor mation T echnology I ntegr ation C osts
The next cost area covers the purchase or development of software to manage the UDI
compliance and to incorporate the UDI information into the firms’ information technology (IT) system.
These costs are assumed to apply at the firm level, since firms would need to coordinate their software
changes across their establishments. The first-year cost items include the software packages needed to
print barcodes; costs to install, test and integrate the software into existing IT systems (where necessary);
costs to validate the software to meet FDA software validation requirements; and costs to train employees
in the use of the software.
4-46
The extent of the validation activity is substantial. First, there is a test of the software to ensure
that it is configured correctly for the purposes it is used for and that it works properly. FDA validation
requirements also require a full paper trail of the validation process at each step in that process, including
the establishment of procedures to use the software, the actual testing of the software both in the test
environment and then in the production environment, records of output from the software tests, records of
any fixes needed and made, etc. Based on FDA guidelines (FDA, 2002), ERG estimates that the costs of
validating barcoding software would range from modest (at the smallest firms) to substantial at firms with
complex enterprise resource planning (ERP) systems (e.g., SAP or Oracle systems) and many facilities.
At firms running ERP systems where barcoding software must be integrated into the system, FDA
validation procedures become extensive.
ERG assumes two levels of baseline IT sophistication through the range of medical device
manufacturing operations. At the lower end, ERG assumes that relatively simple management software is
in place and that relatively little integration of barcoding software would be needed, which means that
validation efforts are relatively simple as well. At the higher end, at larger operations with many
establishments, ERG assumes that sophisticated IT environments exist, such as those using complex ERP
software. In these environments, ERG assumes that some significant integration tasks must be performed
in order to maintain the traceability of medical device processing.
The inclusion of a system-wide software integration and validation effort in such ERP systems
adds substantially to the compliance costs. It would be possible for medical device firms to add the UDI
software and a traceability capability without integrating into their entire software system or generating a
need for a full validation (and re-validation) effort throughout all systems (beyond the labeling system).
For certain firms, however, this limited software introduction might conflict with normal modes of
software introduction or cause other, unforeseen difficulties. Thus, ERG included sufficient costs to
represent large software integration and complex validation efforts for the largest strata of firms,
reflecting the potential costs for complex software system enhancements and integrations of changes.
No firms with fewer than 200 employees are assumed to require the more-elaborate software
integration and validation tasks. All firms with 200 or more employees, are, however, assumed to require
significant integration/validation efforts. Firms with fewer than 100 employees are assumed to be
managing the efforts at only one facility. Firms in the 100 to 199 employee size range are assumed to
have one to two establishments, requiring slightly more complex validation, but generally to lack the
highly complex ERP-type systems. Those with more than 200 employees are assumed to face

4-47
increasingly complex validation tasks among multiple establishments. Firms in the 200-499 employees
group are split. In this group, 75 percent of firms are assumed to have simpler integration efforts and 25
percent are assumed to have more intensive integration/validation efforts). The following sections discuss
the costs at larger firms with complex ERP systems, followed by a discussion of costs at smaller firms
with simpler systems.
4.3.1.6.1 IT Costs at Larger Firms with ERP Systems
ERG made calls to a number of large manufacturers. These firms stated that they will spend
substantially on software solutions and IT integration tasks. Medical Device Manufacturer C indicated
that they had spent $130,000 for software allowing them to print variable barcoded information on their
secondary packaging (they had not yet applied barcoding to their primary packaging). ERG used this
figure for barcoding software with sufficient quality assurance and validation tools for the largest
manufacturers, scaling this cost downward for large and very large manufacturers. For the 25 percent of
larger manufacturers (those with 200-499 employees) assumed to be operating complex ERP systems, and
at very large firms (with 500 or more employees), ERG estimates that software at these firms might cost
$75,000. With the weighting assumptions for larger manufacturers and using the costs estimated for this
size group for those without ERP systems (see Section 4.3.1.6.2), the overall cost per firm in this size
group is estimated at about $52,500 (see Table 4-13).
ERG assumes a systems integration task must be added to the installation, verification, and
testing tasks at the larger firms. For example, Medical Device Manufacturer C indicated that system
integration would cost $200,000 to $250,000. This cost also includes hardware integration, which is an
issue for the high speed production lines found at larger facilities and has not been fully captured
elsewhere. ERG estimated that the largest firms would incur costs of $250,000 for installation,
verification, testing, and integration. This cost has been adjusted downward to $150,000 for firms with
500-999 employees and to $100,000 for the 25 percent of larger firms (200-499 employees) assumed to
have ERP systems. This produces a weighted average of about $45,000 for all firms in the 200-499
employment size group when the lower costs for the remaining firms in this size group that are assumed
not to have ERP systems are included.
ERG assumes that the larger facilities with ERP systems would encounter complex and time
consuming validation procedures. Medical Device Manufacturer C estimated that they would undertake
software validation, employing approximately five people over the period of a year (i.e., up to 5 FTEs),

4-48
Table 4-13. Software and Associated Costs for UDI Compliance
Cost Element
Employment Size by Firm
Total Smallest (1-
4) (a) Small (5-
19) Medium (20-
99) (b) Large (100-
199) (c) Larger (200-
499) (d)
V. Large (500-999)
(e) Largest
(1000+) (e)
Initial Investment Costs
Software $200 $7,500 $15,000 $30,000 $52,500 $75,000 $130,000
Installation, Integration, Verif. & Testing $600 $1,000 $5,000 $25,000 $45,000 $150,000 $250,000
Validation $0 $1,000 $2,000 $3,500 $55,000 $250,000 $400,000
Total software investment $800 $9,500 $22,000 $58,500 $152,500 $475,000 $780,000 No. of employees assumed needing training 1 10 50 175 375 750 1,250 Training-first year (@$100/employee) $100 $1,000 $5,000 $17,500 $37,500 $75,000 $125,000
Number of firms 1,162 1,403 1,019 210 159 68 212 4,232
Reduction for double-counted firms (f) 0% 0% 3% 10% 30% 35% 41% 210
Exclusion for firms with UDI software (f) 0% 0% 1% 9% 14% 18% 29% 85
Aggregate First-Year Investment $1,045,585 $14,727,378 $26,457,592 $13,080,740 $18,197,537 $19,960,279 $80,539,846 $174,008,958
Recurring Annual Costs
Recurring training costs (25% 1st yr.) $25 $250 $1,250 $4,375 $9,375 $18,750 $31,250 Recurring validation costs (10% 1st yr.) $0 $100 $200 $350 $5,500 $25,000 $40,000
Annual maintenance contract (18%) $36 $1,350 $2,700 $5,400 $9,450 $13,500 $23,400 Total recurring annual costs $61 $1,700 $4,150 $10,125 $24,325 $57,250 $94,650
Aggregate Recurring Costs $70,867 $2,384,433 $4,066,630 $1,742,664 $2,329,764 $2,077,684 $8,423,311 $21,095,353
(a) The smallest firms (1-4 employees) are assumed to perform limited production and to purchase simpler software, with simple testing and no validation. (b) Assumes compliance can be achieved with use of single UDI server (only one establishment and line assumed). (c) Same software costs as for medium firm although greater testing costs are assumed to be required and two software licenses are needed. (d) Assumes 75 percent of firms use two software licenses and 25 percent of firms have complex ERP systems that require more expensive software and more time-consuming integration. (e) Assumes much more complex installation requirements associated with ERP systems, with more establishments to consider for the very largest firms. (f) All firm counts are adjusted to account for 3 percent of manufacturers who are assumed to be printing variable barcodes at this time (adjustments for exceptions for custom operations among the smaller firms and for use of UPCs only were made as shown in Table 4-3). Specification developers and reprocessors are assumed not to use variable barcodes currently. Additionally, firms are double counted when broken out by establishment types owned (see Section Three), primarily large firms. A percentage reduction is calculated assuming most of such firms are the largest firms. This percentage reduction results in the removal of 210 firms. The actual number of double counted firms is 209 (see Table 3-6). Source: Estimated by ERG based on discussions with software providers and as discussed in the text. Firm counts use total registered firms in Table 4-3 distributed with data on firms in the affected NAICS by employment size in SBA, 2006, and adjusted as discussed in footnote (f).

4-49
which suggests costs exceeding $500,000. Another manufacturer reported even higher costs.
Nevertheless, other sources suggested that validation costs would not be nearly as high as these forecasts.
Vendors of device identification and traceability software reported that validation costs would be unlikely
to exceed $100,000. These contacts also noted that spending on enhancements for some enterprise
software could be virtually unbounded, depending upon the extent of integration with existing software
being sought. Still other contacts, including large manufacturers, were unable to even estimate their costs,
although they expressed concern that the validation costs could be quite high.
ERG judged that the validation cost estimates of the software vendors might underestimate the
full complexity of integrating costs in the FDA-regulated medical device setting. We also were concerned
that the manufacturer estimates of validation costs might overstate the actions strictly mandated by the
UDI regulation, and might incorporate costs to integrate device identification-type systems of various
company components that are incompletely integrated at the present time. Thus, while we accepted that
large firms would spend extensively to bring UDI into their enterprise software, we did not accept the full
share of costs for the largest of firms as entirely due to regulatory costs. Nevertheless, the largest two size
classes of firms were estimated to spend $250,000 and $400,000 on UDI software validation. For the 25
percent of larger firms (200-499 employees), we assumed that they might spend as much as $200,000 per
firm. With weighting, the overall average per firm in this group was estimated at about $55,000 when the
lower costs per firm at those without ERP systems are included.
Training costs are calculated in the same way as those for the smaller firms (at $100 per
employee) using the midpoint of the employment range as the number of employees requiring training.
For the largest size category, however, where the number of employees is unbounded, we estimated
training for 1,250 persons.
For recurring costs, ERG makes the same assumptions as those used for calculating recurring
costs to smaller firms: 18 percent of initial software costs for ongoing maintenance, 25 percent of
validation costs for addressing patches and upgrades, and 25 percent of first year training costs for
recurring training costs.
4.3.1.6.2 IT Costs at Smaller Firms without ERP Systems
For smaller firms, ERG obtained an estimate of software costs at the lower level of software
integration needs from a subcontractor, Mass Group, Inc. (Chatsworth, CA), and from other software
4-50
vendors. Because ERG combined the various estimates and generated some supplemental information,
only a combined set of estimates is provided and these estimates are the responsibility of ERG. Table
4-13 summarizes the components of the IT costs. Mass Group provided forecasts of the representative
software purchases needed to generate and record lot or serial number information for a medium and a
large manufacturer without complex software integration issues. This company sells a moderately priced
software package for traceability (called “Traceability Made Easy”) and used that package as a
benchmark for the costs for a basic software package. This software provides lot or serial number
generation, scanner input-output, traceability data organization, and compilation of verification data. This
software is priced at $15,000 per site license. This package of software is forecast to address the
requirements for most small to medium firms in the industry. It addresses the needs for firms that might
lack such software at the present time. All firms with fewer than 100 employees are assumed to operate
one production line with one establishment.
ERG made two adjustments to the figures provided by Mass Group, Inc. Based on discussions
with other vendors and device manufacturers, ERG judged that somewhat larger firms might use two or
more software site licenses to drive different servers where more than one production line is operated or
where they operate more than one establishment. ERG thus multiplied the software costs by two at large
firms (with 100 to 199 employees), which are assumed to operate two production lines. For the 200-499
group, as noted, a portion of this size group (25 percent) is assumed to be using complex ERP systems;
their costs were discussed previously. Thus, only 75 percent of the large size group is assigned $45,000,
representing three software licenses for firms in this group, which are assumed to average two
establishments per firm, with some lines sharing servers, others not. The other 25 percent are assumed to
incur a cost of $75,000 for an ERP module. As discussed previously, costs shown in Table 4-13 for this
employment size group reflects an approximate weighted average of costs estimated for the two levels of
IT complexity assumed present in this group of firms.
For small manufacturers (5 to 19 employees), software needs are expected to be more modest,
since traceability can be more easily handled manually and the only necessary item is software to create
and print barcodes. Each printer will need barcoding software capable of creating, for example, GS1-128
barcodes (formerly EAN-128). Because of FDA software validation requirements, however, a simple
barcoding software package could be insufficient for medical device manufacturing uses, and all but the
very smallest operations might obtain software that provides FDA validation tools. ERG estimates that a
package half as expensive as for medium size operations estimated above ($7,500) would provide
sufficient validation software for use in the FDA-required validation procedures. This software provides

4-51
the tools necessary for creating the necessary paper trail showing the software is operating properly for its
intended use. The very smallest operations (1 to 4 employees), however, are assumed to have so little
complexity that a basic barcoding software package, with limited installation and testing requirements, is
considered sufficient.
Following software acquisition, the software must be installed, verified, and tested. Installation,
verification, and testing tasks at firms that are not expected to fully integrate their software with existing
IT systems are estimated to cost from $600 at the smallest firms, up to $25,000 at 75 percent of large
firms (200-499) that are assumed not to use complex ERP systems. Mass Group provided a cost of $5,000
for a medium size firm and about $25,000 at a large firm (100-250 employees). Once the basic testing is
complete, FDA validation procedures are assumed to be undertaken at all but the very smallest firms,
which use manual lines to produce relatively little throughput. Software validation costs at smaller firms
are expected to range from $1,000 to $2,000 per label printing operation. ERG has assumed the small
firms (5 to 19 employees) incur $1,000 to validate their software, rising gradually to $2,000 at facilities
with 20-99 employees. At large firms, where ERG assumes two production lines operate, validation costs
do not quite double, since the procedures established for validating one system can be applied to the other
system, but the labor time to actually test each system remains. ERG assumes validation at firms in the
100-199 employee size group will incur $3,500 to validate barcode software on two production lines,
while the 75 percent of those in the 200-499 employee size group will incur $6,000 to validate four lines
each.
Training costs are assumed to be required to make employees aware of the UDI numbering
process and how to use the software, as might be necessary for job functions. First-year training costs
were estimated for all sizes of firms on the basis of $100 per employee over, roughly, the midpoint of
employment for the range in that employment classification (e.g., 30 employees would need training at
the typical 20-49 employee firm). Firms with 1 to 4 employees are assumed to require training for only
one employee.
Ongoing costs are also incurred. Software maintenance costs are estimated at 18 percent of the
software package, based on discussions with the software vendor. Validation is also an ongoing effort.
Since new software releases and patches must also be validated, ERG assumes that 25 percent of the first-
year validation costs are incurred in subsequent years to deal with software upgrades and patches.
Recurring training costs are estimated at 25 percent of the first-year costs.
4-52
4.3.1.6.3 IT Costs for All Firms
Table 4-13 presents the software purchase, integration and related training costs described above
for all firms considered affected by such requirements. The table accounts for the firms that are double-
counted when firms are counted by the establishment types they own (see Table 3-6 in Section Three).
Only the largest firms are considered likely to be double-counted with any frequency because these are
the likeliest firms to own both a manufacturing establishment and a specification developer or R/R. The
percentages used to reduce the firm count in this table approximate the 209 firms (shown as 210 firms in
the table), and all double-counted firms are assumed to own at least one manufacturing establishment, so
the double-counts are corrected in this table only. Furthermore, counts of firms are reduced to account for
custom operations, small firms using UPCs only, and larger firms that are assumed to be using variable
barcodes at this time.
Accepting the idea of some fairly significant integration requirements for the largest strata of
firm, costs for the software component of UDI are substantial. Under ERG’s assumptions, first-year costs
are estimated at $174.0 million, and recurring costs at $21.1 million. All costs presented in Table 4-13 are
highly speculative, however. Costs could be substantially larger or smaller, given variations in data
integration needs and the complexity of the underlying IT systems in place (see Section Eight).
4.3.1.7 C osts of R ecor dkeeping and R ecor ding including C osts for the G UDI D
To meet the various revisions to recordkeeping and reporting requirements (the conforming
amendments) firms would need to make changes throughout their records to include the UDI of the
device in records and reports firms must keep or submit to FDA.. For larger firms, integrating UDI into
all software systems as noted in Section 4.3.1.6 would automate virtually all recordkeeping and reporting
requirements associated with the conforming amendments, resulting in no measurable additional costs for
meeting these requirements. Additionally, costs for the smaller firms, who would handle UDI in a more
manual fashion are also considered minimal. Incrementally these costs would be minimal because the
incremental effort to provide a UDI during a process when many other pieces of information are being
gathered and recorded would be small, and in many cases, the UDI replaces other, multiple pieces of data
necessary for identifying the device, resulting in a potential time savings.
ERG also considered the cost for recordkeeping changes and the costs to submit UDI and UPC
data to FDA’s GUDID. All device labelers required to have UDIs (including those labeling with UPCs
only) would need to submit these data to FDA.

4-53
It is assumed that FDA would create a website that would be designed to accept either web-
entered data or would have an upload button for ensuring ease of database uploads, similar to the FURLS
system currently in place for registering establishments and listing devices.
The costs to submit UDI data to FDA is separate from these other recordkeeping and reporting
costs. As noted previously in Section Two, the following data will be required for submission to the
GUDID. For most devices, the following information will be needed:
• Labeler name and contact information.
• The issuing agency name.
• The device identifier portion of the UDI (i.e., the static information).
• The device identifier previously associated with a device (if any) (manufacturer’s original UDI).
• If the device is permanently marked, the device identifier used on the device (if different
from that on the label).
• The brand or trade name of the device.
• The model number, version number, or similar reference that appears on the label of the device.
• Whether the device is sterile or contains natural latex.
• The size of the device (if produced in more than one size; for example, catheters are
available in several diameters) and unit of measure.
• Type of production identifiers (e.g., batch or serial number).
• Premarket submission number or note of exemption.
• Listing number.
• The Global Medical Device Nomenclature Code (GMDN), which specifies the type of device.27
• The number of devices contained within the device package.
27 Access to the GMDN is assumed free of charge because FDA does not intend to ask for this information
if it is not freely available at the time UDI data must be submitted (see Section Two).

4-54
Although not specified in the list of GUDID requirements, ERG assumes that the UDI of the
package selected by the labeler as the initial UDI to be entered into the system would also be required.
This assumption is made because FDA intends for the detailed information on a device to be input only
once, with the information other device packages containing the same device to comprise just the
additional UDIs for other device packages and the number of devices they contain. ERG also assumes
that the labeler would enter one or more additional HIBC, GTIN or UPC, if more than one identifier is
presented on the label for similar reasons. Inputting additional and alternative UDIs for what is
technically the same device also allows such UDIs to be linked. UDI linking would allow FDA (and other
users) to know all UDIs that apply to a specific device. This additional information that is assumed to be
included in the GUDID has been considered in this cost analysis.
ERG assumed that smaller establishments with only one or a few products would have the option
of entering the information by hand on a web page provided by FDA. Labelers may also choose to
upload an SPL file with the UDI data, which would likely be the option chosen by the medium and large
establishments that label many products. Costs incurred for submission of the UDI data include:
• Gathering, preparing, and organizing files,
• Validation of the data submission process
• Conversion to SPL
• Accessing and uploading to GUDID
• Changes to data
These are described in greater detail below.
A regulatory affairs manager would need to spend time gathering, preparing and organizing the
files that are needed for the web page entry of the data or for creating an SPL file. ERG assumes that
medium and large establishments would have already done this during their IT reconfiguration task and
no additional costs are incurred. For smaller facilities, this should be a relatively simple effort to collect
the data on a few products. ERG estimates that small establishments will spend 1 to 2 hours to organize
the UDI data for entry or upload.
The UDI submission process would also need to be validated to ensure that the correct data has
been provided to FDA. ERG estimated the time spent validating procedures might require 2 to 3 hours
for a small establishment and approximately 4 hours for larger establishments with more products.
4-55
Data entry would also be a very straightforward task given the number of items that are required.
ERG estimates that small establishments would spend approximately one hour to enter the required data.
The amount of time needed to upload an SPL data set is also expected to be small; ERG estimates that it
would require roughly 1 hour to upload an SPL file to the GUDID.
Based on conversations with an SPL conversion provider, many manufacturers are currently
using free software from FDA (Xforms) to create SPL files (SPL Conversion Service Provider A, 2010).
Many manufacturers are expected to use this software or a conversion service provider to create their
SPL documents containing the UDI data. The SPL conversion service provider that ERG consulted
currently charges $100 for converting registration and listing data to SPL. The customer provides the
conversion service provider with spreadsheet that contains the data to be converted in fields. The service
provider converts the spreadsheet into SPL for $100. The $100 is a flat fee so customers pay the same
amount, regardless of whether they manufacture 1 product or 10,000. If a facility can convert data into
SPL using Xforms at a lower cost, they might do so. Thus ERG assumes that $100 per establishment is a
conservative estimate of the cost to convert UDI data into SPL format.
Assuming hourly wages based on the median hourly wage rate for management occupations in
NAICS 3391 (BLS, 2009), with benefits calculated at 29% of wages (BLS, 2010), total costs per
establishment for uploading UDI data to the GUDID range from $450 and $750 for the smallest
establishments to $338 for larger establishment (see Table 4-14). The aggregate first-year investment
across all facilities is $2.7 million.
Furthermore, ERG is assuming that labelers would only need to submit the data once, unless
changes need to be made to the information in the database. It is also assumed that any changes would
not be costly. UDI data submitted on web pages can be easily retrieved and modified. SPL documents,
once created, can be modified while keeping any unchanged information and resubmitted. ERG expects
that each establishment would make one minor change annually that would require 1 hour of a manager’s
time. The total cost for these changes is $75 per establishment and the total recurring cost for all
establishments is $0.4 million per year.

4-56
Table 4-14. Per Establishment and Total Cost to Upload UDI Data to the GUDID
Cost Element Employment Size
Total 1-4 5-9 10-49 50-99 100-249 250-500 500+ Initial Investment Costs per Establishment
Hours to gather, prepare and organize files 3 3 6 NA (a) NA (a) NA (a) NA (a) Hours to validate submission process 2 2 3 4 4 4 4 Hours to access and upload to GUDID 1 1 1 0.5 0.5 0.5 0.5 Hourly wage with benefits $75 $75 $75 $75 $75 $75 $75 Subtotal cost per establishment $450 $450 $750 $338 $338 $338 $338 Conversion to SPL $0 (c) $0 (c) $0 (c) $100 $100 $100 $100 Total costs per establishment $450 $450 $750 $438 $438 $438 $438 Total establishments (mfgs., reprocessors & spec. dev.) (d) 1,211 777 1,725 472 396 195 113 4,889 Aggregate First-Year Investment $544,983 $349,488 $1,293,642 $206,591 $173,216 $85,285 $49,499 $2,702,704
Recurring Costs per Establishment Hours to access and upload to FURLS 1.0 1.0 1.0 1.0 1.0 1.0 1.0 Hourly wage with benefits $75 $75 $75 $75 $75 $75 $75 Total costs per establishment $75 $75 $75 $75 $75 $75 $75 Aggregate Recurring Costs $90,830 $58,248 $129,364 $35,416 $29,694 $14,620 $8,486 $366,658 (a) Costed in MIS software reconfiguration costs. See Table 4-13. (b) Based on the median hourly wage rate for management occupations in NAICS 3391 (BLS, 2009). Benefits are calculated at 29% of wages (BLS, 2010). (c) Web entry. (d) From Table 4-2; adds in establishments assumed to use UPCs only (10 percent of non-exempt establishments in the 1-9 employment size groups).
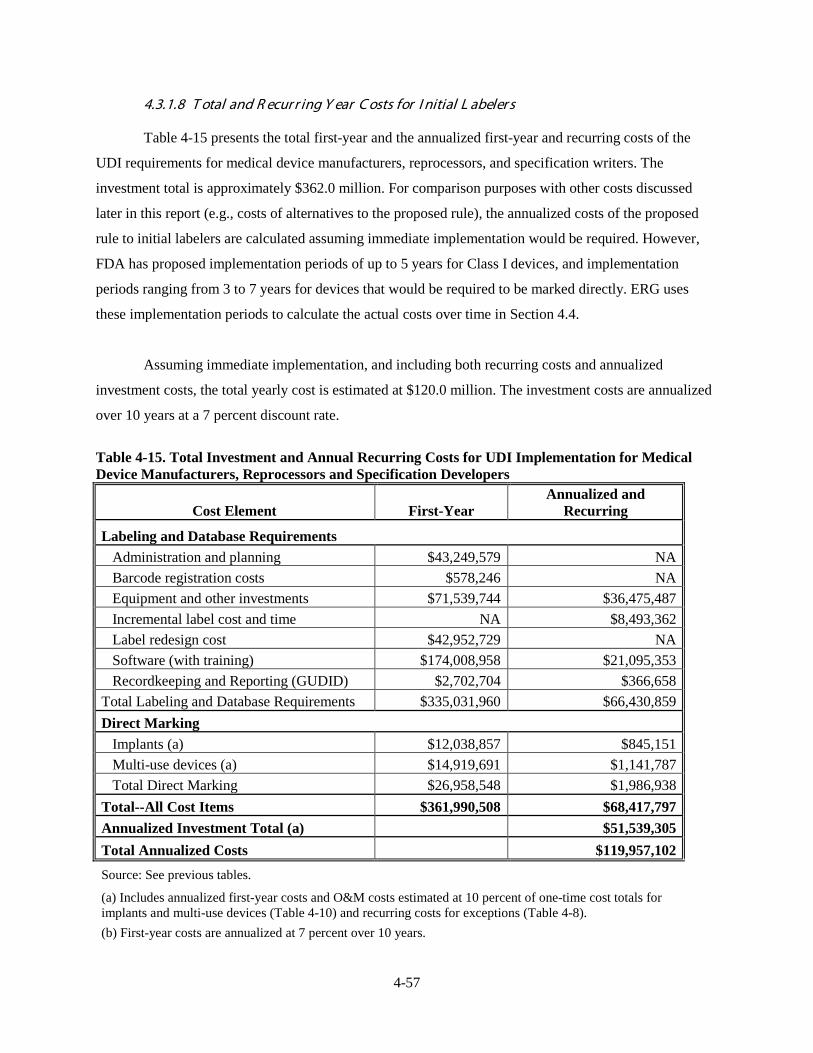
4-57
4.3.1.8 T otal and R ecur r ing Y ear C osts for I nitial L abeler s
Table 4-15 presents the total first-year and the annualized first-year and recurring costs of the
UDI requirements for medical device manufacturers, reprocessors, and specification writers. The
investment total is approximately $362.0 million. For comparison purposes with other costs discussed
later in this report (e.g., costs of alternatives to the proposed rule), the annualized costs of the proposed
rule to initial labelers are calculated assuming immediate implementation would be required. However,
FDA has proposed implementation periods of up to 5 years for Class I devices, and implementation
periods ranging from 3 to 7 years for devices that would be required to be marked directly. ERG uses
these implementation periods to calculate the actual costs over time in Section 4.4.
Assuming immediate implementation, and including both recurring costs and annualized
investment costs, the total yearly cost is estimated at $120.0 million. The investment costs are annualized
over 10 years at a 7 percent discount rate.
Table 4-15. Total Investment and Annual Recurring Costs for UDI Implementation for Medical Device Manufacturers, Reprocessors and Specification Developers
Cost Element First-Year Annualized and
Recurring
Labeling and Database Requirements Administration and planning $43,249,579 NA Barcode registration costs $578,246 NA Equipment and other investments $71,539,744 $36,475,487 Incremental label cost and time NA $8,493,362 Label redesign cost $42,952,729 NA Software (with training) $174,008,958 $21,095,353 Recordkeeping and Reporting (GUDID) $2,702,704 $366,658 Total Labeling and Database Requirements $335,031,960 $66,430,859 Direct Marking Implants (a) $12,038,857 $845,151 Multi-use devices (a) $14,919,691 $1,141,787 Total Direct Marking $26,958,548 $1,986,938 Total--All Cost Items $361,990,508 $68,417,797 Annualized Investment Total (a) $51,539,305 Total Annualized Costs $119,957,102 Source: See previous tables.
(a) Includes annualized first-year costs and O&M costs estimated at 10 percent of one-time cost totals for implants and multi-use devices (Table 4-10) and recurring costs for exceptions (Table 4-8). (b) First-year costs are annualized at 7 percent over 10 years.
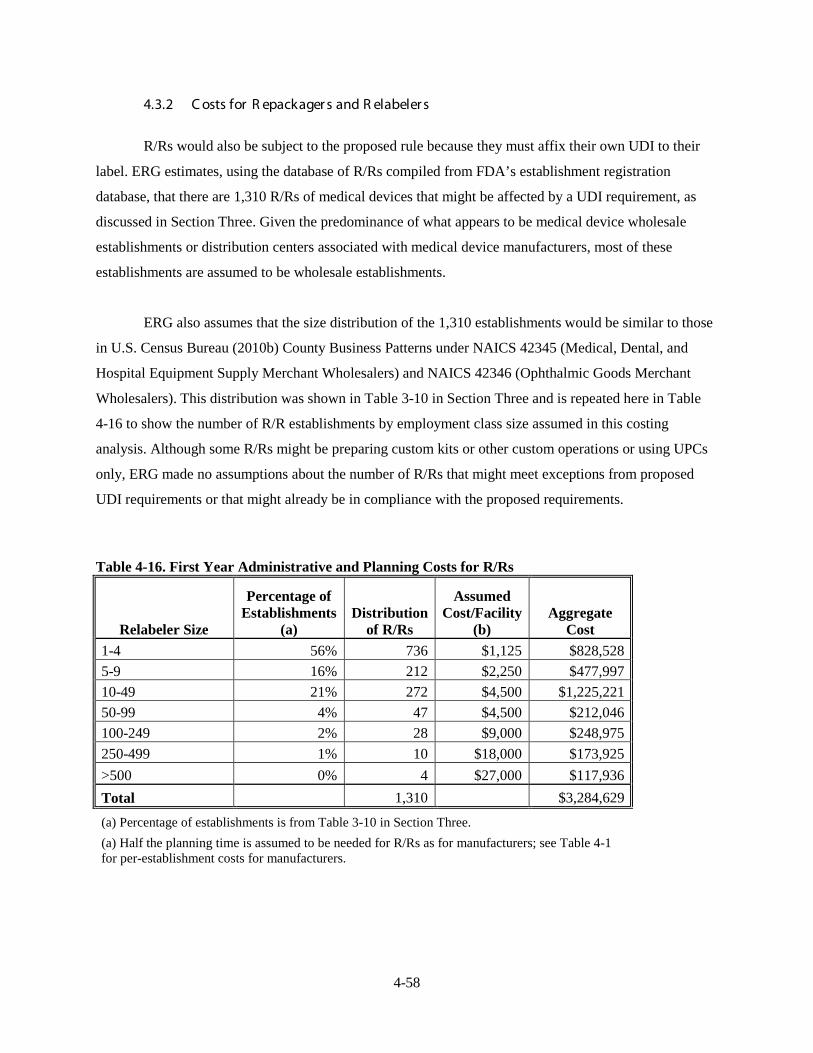
4-58
4.3.2 C osts for R epackager s and R elabeler s
R/Rs would also be subject to the proposed rule because they must affix their own UDI to their
label. ERG estimates, using the database of R/Rs compiled from FDA’s establishment registration
database, that there are 1,310 R/Rs of medical devices that might be affected by a UDI requirement, as
discussed in Section Three. Given the predominance of what appears to be medical device wholesale
establishments or distribution centers associated with medical device manufacturers, most of these
establishments are assumed to be wholesale establishments.
ERG also assumes that the size distribution of the 1,310 establishments would be similar to those
in U.S. Census Bureau (2010b) County Business Patterns under NAICS 42345 (Medical, Dental, and
Hospital Equipment Supply Merchant Wholesalers) and NAICS 42346 (Ophthalmic Goods Merchant
Wholesalers). This distribution was shown in Table 3-10 in Section Three and is repeated here in Table
4-16 to show the number of R/R establishments by employment class size assumed in this costing
analysis. Although some R/Rs might be preparing custom kits or other custom operations or using UPCs
only, ERG made no assumptions about the number of R/Rs that might meet exceptions from proposed
UDI requirements or that might already be in compliance with the proposed requirements.
Table 4-16. First Year Administrative and Planning Costs for R/Rs
Relabeler Size
Percentage of Establishments
(a) Distribution
of R/Rs
Assumed Cost/Facility
(b) Aggregate
Cost 1-4 56% 736 $1,125 $828,528 5-9 16% 212 $2,250 $477,997 10-49 21% 272 $4,500 $1,225,221 50-99 4% 47 $4,500 $212,046 100-249 2% 28 $9,000 $248,975 250-499 1% 10 $18,000 $173,925 >500 0% 4 $27,000 $117,936 Total 1,310 $3,284,629 (a) Percentage of establishments is from Table 3-10 in Section Three. (a) Half the planning time is assumed to be needed for R/Rs as for manufacturers; see Table 4-1 for per-establishment costs for manufacturers.
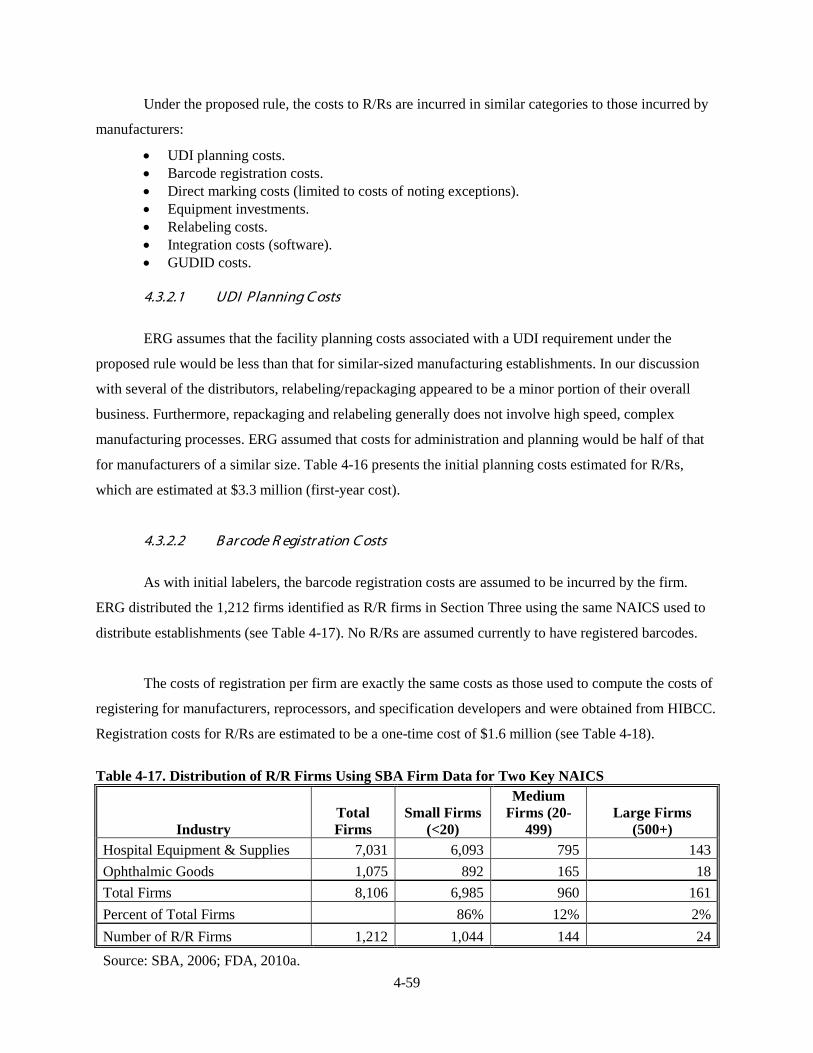
4-59
Under the proposed rule, the costs to R/Rs are incurred in similar categories to those incurred by
manufacturers:
• UDI planning costs. • Barcode registration costs. • Direct marking costs (limited to costs of noting exceptions). • Equipment investments. • Relabeling costs. • Integration costs (software). • GUDID costs. 4.3.2.1 UDI Planning C osts
ERG assumes that the facility planning costs associated with a UDI requirement under the
proposed rule would be less than that for similar-sized manufacturing establishments. In our discussion
with several of the distributors, relabeling/repackaging appeared to be a minor portion of their overall
business. Furthermore, repackaging and relabeling generally does not involve high speed, complex
manufacturing processes. ERG assumed that costs for administration and planning would be half of that
for manufacturers of a similar size. Table 4-16 presents the initial planning costs estimated for R/Rs,
which are estimated at $3.3 million (first-year cost).
4.3.2.2 B ar code R egistr ation C osts
As with initial labelers, the barcode registration costs are assumed to be incurred by the firm.
ERG distributed the 1,212 firms identified as R/R firms in Section Three using the same NAICS used to
distribute establishments (see Table 4-17). No R/Rs are assumed currently to have registered barcodes.
The costs of registration per firm are exactly the same costs as those used to compute the costs of
registering for manufacturers, reprocessors, and specification developers and were obtained from HIBCC.
Registration costs for R/Rs are estimated to be a one-time cost of $1.6 million (see Table 4-18).
Table 4-17. Distribution of R/R Firms Using SBA Firm Data for Two Key NAICS
Industry Total Firms
Small Firms (<20)
Medium Firms (20-
499) Large Firms
(500+) Hospital Equipment & Supplies 7,031 6,093 795 143 Ophthalmic Goods 1,075 892 165 18 Total Firms 8,106 6,985 960 161 Percent of Total Firms 86% 12% 2% Number of R/R Firms 1,212 1,044 144 24 Source: SBA, 2006; FDA, 2010a.
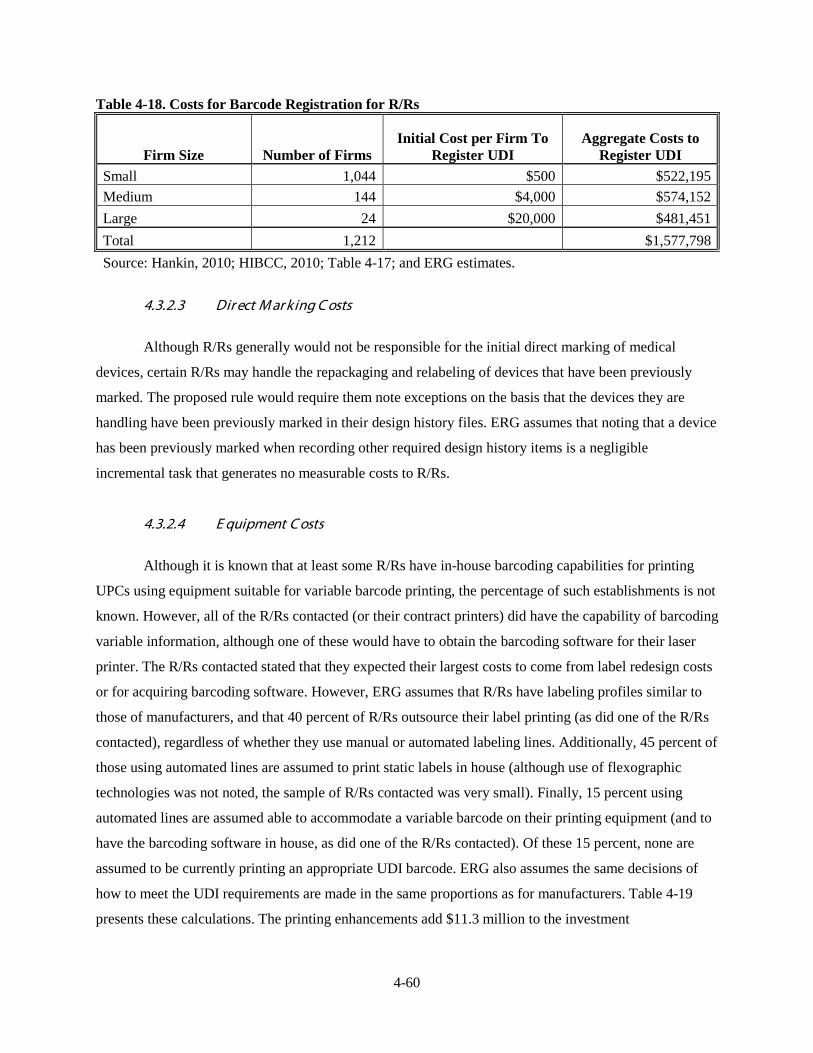
4-60
Table 4-18. Costs for Barcode Registration for R/Rs
Firm Size Number of Firms Initial Cost per Firm To
Register UDI Aggregate Costs to
Register UDI Small 1,044 $500 $522,195 Medium 144 $4,000 $574,152 Large 24 $20,000 $481,451 Total 1,212 $1,577,798 Source: Hankin, 2010; HIBCC, 2010; Table 4-17; and ERG estimates.
4.3.2.3 Dir ect M ar king C osts
Although R/Rs generally would not be responsible for the initial direct marking of medical
devices, certain R/Rs may handle the repackaging and relabeling of devices that have been previously
marked. The proposed rule would require them note exceptions on the basis that the devices they are
handling have been previously marked in their design history files. ERG assumes that noting that a device
has been previously marked when recording other required design history items is a negligible
incremental task that generates no measurable costs to R/Rs.
4.3.2.4 E quipment C osts
Although it is known that at least some R/Rs have in-house barcoding capabilities for printing
UPCs using equipment suitable for variable barcode printing, the percentage of such establishments is not
known. However, all of the R/Rs contacted (or their contract printers) did have the capability of barcoding
variable information, although one of these would have to obtain the barcoding software for their laser
printer. The R/Rs contacted stated that they expected their largest costs to come from label redesign costs
or for acquiring barcoding software. However, ERG assumes that R/Rs have labeling profiles similar to
those of manufacturers, and that 40 percent of R/Rs outsource their label printing (as did one of the R/Rs
contacted), regardless of whether they use manual or automated labeling lines. Additionally, 45 percent of
those using automated lines are assumed to print static labels in house (although use of flexographic
technologies was not noted, the sample of R/Rs contacted was very small). Finally, 15 percent using
automated lines are assumed able to accommodate a variable barcode on their printing equipment (and to
have the barcoding software in house, as did one of the R/Rs contacted). Of these 15 percent, none are
assumed to be currently printing an appropriate UDI barcode. ERG also assumes the same decisions of
how to meet the UDI requirements are made in the same proportions as for manufacturers. Table 4-19
presents these calculations. The printing enhancements add $11.3 million to the investment

4-61
Table 4-19. Equipment Investments for UDI Requirements for R/Rs
Establishments, by Baseline Label Printing System
Manual Lines
(% Estabs.)
Auto-mated Lines
(% Estabs.)
Equipment Costs, by Number of Production Lines (a)
Investment Total
Manual Automated
1 line 1 line 2-3 lines 4-5 lines 6+ lines Number of establishments, by assumed number of prod. lines 949 319 28 8 6 1,310 Per estab. costs to install full on-line label printing system NA $43,594 $46,813 $93,625 $119,438 Per estab. cost to install supplemental label system NA $21,094 $21,094 $24,063 $31,719 Per establishment FTEs to operate verifiers $0 0.15 0.30 0.60 1.00 Per establishment cost to operate verifiers (b) $0 $6,947 $13,894 $27,787 $46,312 Per estab. costs to print labels--manual lines $0 NA NA NA NA Establishments using outside label printers 40% 40% Switch to outside new label printer, add lot #s (10% of 40%) (c) NA 4% NA NA NA NA NA NA Move entire label operation in-house (2% of 40%) NA 1% NA $111,388 $10,360 $6,246 $5,438 $133,433 Add small supplemental label, applied in-house (88% of 40%) NA 35% NA $4,901,082 $205,405 $70,630 $63,547 $5,240,664 Man. line: switch to new outside label printer, add lot#s (20% of 40%) 8% NA NA(c) NA NA NA NA NA Man. line: move entire label operation in-house (75% of 40%) 30% NA $0 NA NA NA NA $0 Man. line: add small supplemental label, applied in-house (5% of 40%) 2% NA $0 NA NA NA NA $0 Establishments printing labels in-house with printing systems that do not accommodate variable information 0% 45% Modify entire label printing operation (60% of 45%) NA 27% $0 $3,759,352 $349,655 $210,797 $183,544 $4,503,348 Add small supplemental label, applied in-house (40% of 45%) NA 18% $0 $1,212,694 $105,037 $36,118 $32,496 $1,386,344 Establishments w/label printing systems accommodating variable data 60% 15% Modify label with existing printing equipment (100% of 15%) NA 12% $0 NA NA NA NA NA Man. line: modify label w/existing equipment (100% of 60%) 60% $0 NA NA NA NA $0 Total Investment $11,263,789 Total labor $0 $2,218,759 $384,352 $231,715 $263,591 $3,098,416 Total O&M (10 percent of equipment cost) plus Labor $4,224,795
(a) See Tables 4-5, 4-6, and 4-7. (b) Assumes a wage rate plus 29 percent fringe of $22.27 per hour (BLS, 2009) for inspectors in NAICS 339. (c) Incremental costs for outside printer labels assumed primarily costs of coordination, which is passed through to labelers. This cost is captured in Table 4-21.
4-62
total and $4.2 million to the labor and operating and maintenance requirements, assuming O&M is 10
percent of first-year costs.
4.3.2.5 L abeling C osts
Table 4-20 and Table 4-21 summarize the application of label costs to R/Rs. Although ERG
collected some evidence that digital printing technologies may be more prevalent, ERG continues to use
the same assumptions as those used for manufacturers, with per-establishment costs for materials and
one-time redesign costs equaling those for manufacturers. The first year costs of redesign are $4.6 million
and the recurring materials costs are $1.0 million under these assumptions.
4.3.2.6 Softwar e C osts
Table 4-22 presents the estimated software costs for R/Rs. The size distribution for these firms
has been aggregated over wider ranges than was done for manufacturers because ERG believes the
simpler production operations in these firms make costs less sensitive to size. R/Rs might not have the
same need for integration as manufacturers, therefore, ERG assumes lower costs by employment range
apply at the larger sizes. Costs rise only to the level of those seen at larger manufacturing firms.
Therefore, only about 25 percent of the largest R/R firms are assumed to incur costs of integrating UDI
into all ERP systems. Other operations with ERP systems might opt to integrate UDI into all of their
systems, but because they are not manufacturing, ERG assumes that not all such costs are required as a
result of the proposed rule. Costs are estimated at $13.1 million in the first year and $1.1 million in
subsequent years.
4.3.2.7 G UDI D C osts
R/Rs will need to submit similar data to the GUDID as that outlined in Section 4.3.1.7 for
manufacturers, reprocessors and specification developers. Although they submit the previously used UDI
of the initial labeler, they would be required to input all detailed device information again (rather than
being linked to the initial labelers’ UDI information). Because R/Rs could look up the detailed
information using the initial labeler’s UDI, this could save some time. However, because the R/R is now
responsible for that information and the information supplied by the initial labeler could be inaccurate or
out of date, the R/Rs are assumed to at least check the information against the initial label information,
which would take some additional time. Therefore, the same costs per establishment are assumed for
R/Rs as for initial labelers. Table 4-23 shows these costs aggregated over the 1,310 R/R establishments
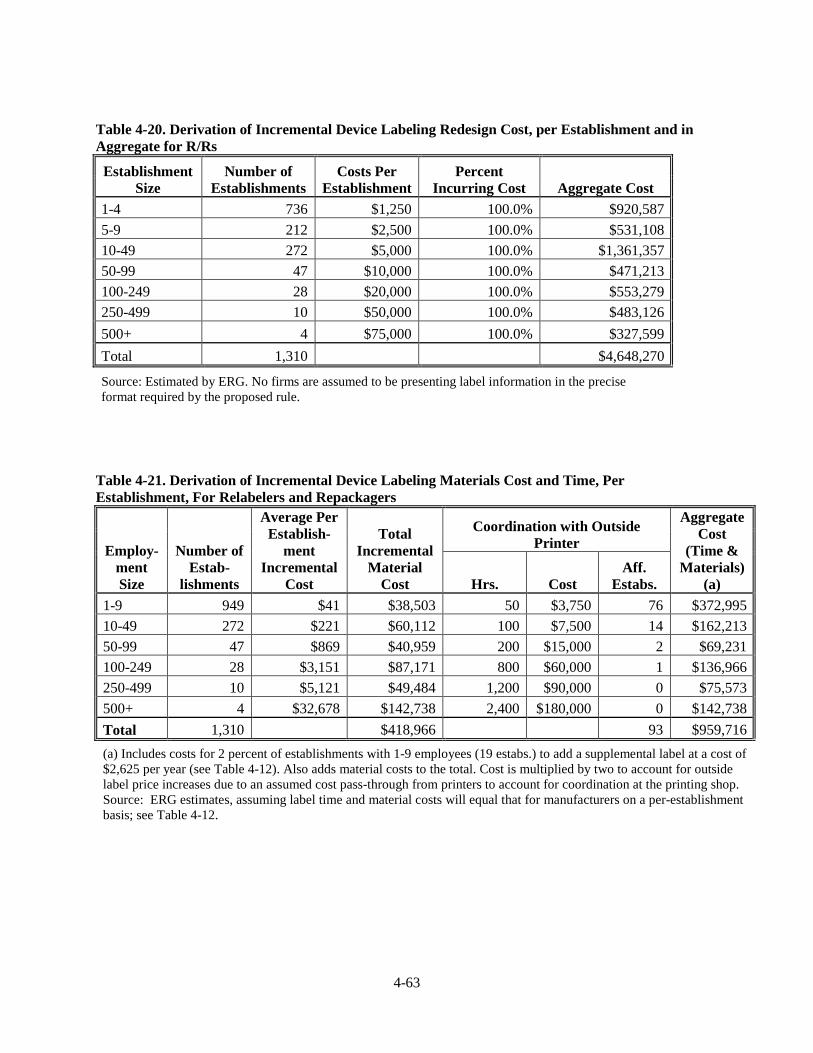
4-63
Table 4-20. Derivation of Incremental Device Labeling Redesign Cost, per Establishment and in Aggregate for R/Rs
Establishment Size
Number of Establishments
Costs Per Establishment
Percent Incurring Cost Aggregate Cost
1-4 736 $1,250 100.0% $920,587 5-9 212 $2,500 100.0% $531,108 10-49 272 $5,000 100.0% $1,361,357 50-99 47 $10,000 100.0% $471,213 100-249 28 $20,000 100.0% $553,279 250-499 10 $50,000 100.0% $483,126 500+ 4 $75,000 100.0% $327,599 Total 1,310 $4,648,270
Source: Estimated by ERG. No firms are assumed to be presenting label information in the precise format required by the proposed rule.
Table 4-21. Derivation of Incremental Device Labeling Materials Cost and Time, Per Establishment, For Relabelers and Repackagers
Employ-ment Size
Number of Estab-
lishments
Average Per Establish-
ment Incremental
Cost
Total Incremental
Material Cost
Coordination with Outside Printer
Aggregate Cost
(Time & Materials)
(a) Hrs. Cost Aff.
Estabs. 1-9 949 $41 $38,503 50 $3,750 76 $372,995 10-49 272 $221 $60,112 100 $7,500 14 $162,213 50-99 47 $869 $40,959 200 $15,000 2 $69,231 100-249 28 $3,151 $87,171 800 $60,000 1 $136,966 250-499 10 $5,121 $49,484 1,200 $90,000 0 $75,573 500+ 4 $32,678 $142,738 2,400 $180,000 0 $142,738 Total 1,310 $418,966 93 $959,716 (a) Includes costs for 2 percent of establishments with 1-9 employees (19 estabs.) to add a supplemental label at a cost of $2,625 per year (see Table 4-12). Also adds material costs to the total. Cost is multiplied by two to account for outside label price increases due to an assumed cost pass-through from printers to account for coordination at the printing shop. Source: ERG estimates, assuming label time and material costs will equal that for manufacturers on a per-establishment basis; see Table 4-12.
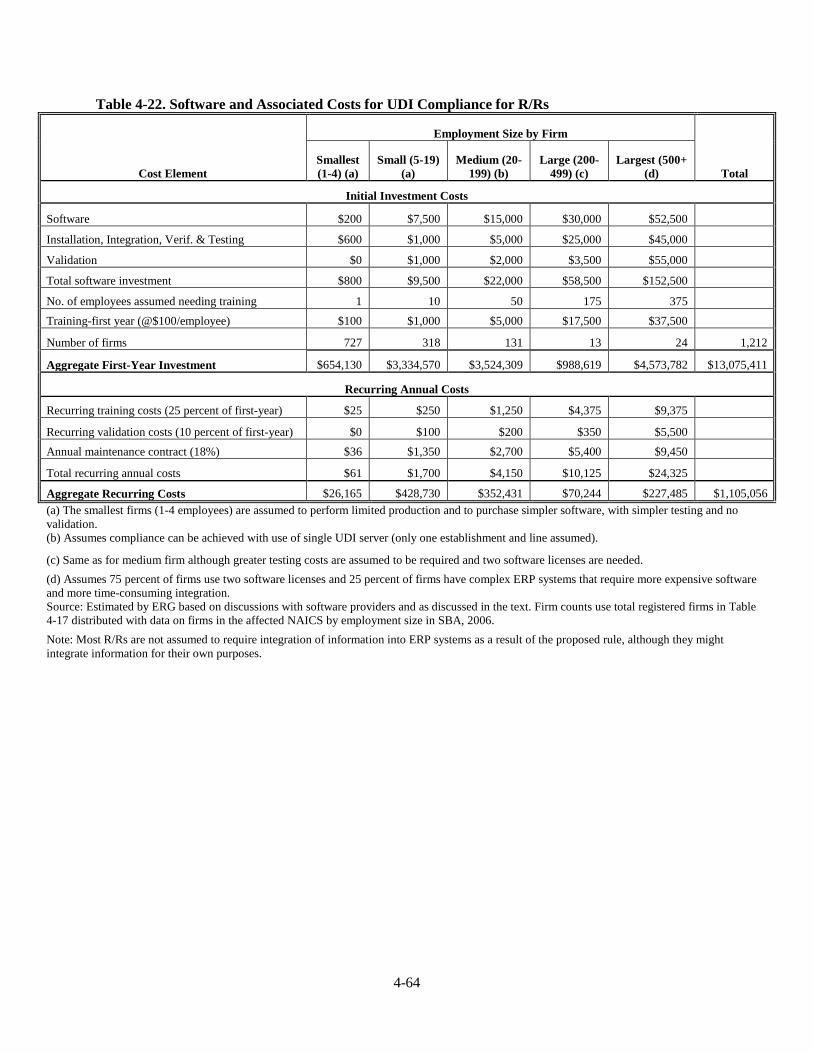
4-64
Table 4-22. Software and Associated Costs for UDI Compliance for R/Rs
Cost Element
Employment Size by Firm
Total Smallest (1-4) (a)
Small (5-19) (a)
Medium (20-199) (b)
Large (200-499) (c)
Largest (500+ (d)
Initial Investment Costs
Software $200 $7,500 $15,000 $30,000 $52,500
Installation, Integration, Verif. & Testing $600 $1,000 $5,000 $25,000 $45,000
Validation $0 $1,000 $2,000 $3,500 $55,000
Total software investment $800 $9,500 $22,000 $58,500 $152,500
No. of employees assumed needing training 1 10 50 175 375 Training-first year (@$100/employee) $100 $1,000 $5,000 $17,500 $37,500
Number of firms 727 318 131 13 24 1,212
Aggregate First-Year Investment $654,130 $3,334,570 $3,524,309 $988,619 $4,573,782 $13,075,411
Recurring Annual Costs
Recurring training costs (25 percent of first-year) $25 $250 $1,250 $4,375 $9,375
Recurring validation costs (10 percent of first-year) $0 $100 $200 $350 $5,500 Annual maintenance contract (18%) $36 $1,350 $2,700 $5,400 $9,450
Total recurring annual costs $61 $1,700 $4,150 $10,125 $24,325
Aggregate Recurring Costs $26,165 $428,730 $352,431 $70,244 $227,485 $1,105,056 (a) The smallest firms (1-4 employees) are assumed to perform limited production and to purchase simpler software, with simpler testing and no validation. (b) Assumes compliance can be achieved with use of single UDI server (only one establishment and line assumed).
(c) Same as for medium firm although greater testing costs are assumed to be required and two software licenses are needed. (d) Assumes 75 percent of firms use two software licenses and 25 percent of firms have complex ERP systems that require more expensive software and more time-consuming integration. Source: Estimated by ERG based on discussions with software providers and as discussed in the text. Firm counts use total registered firms in Table 4-17 distributed with data on firms in the affected NAICS by employment size in SBA, 2006. Note: Most R/Rs are not assumed to require integration of information into ERP systems as a result of the proposed rule, although they might integrate information for their own purposes.
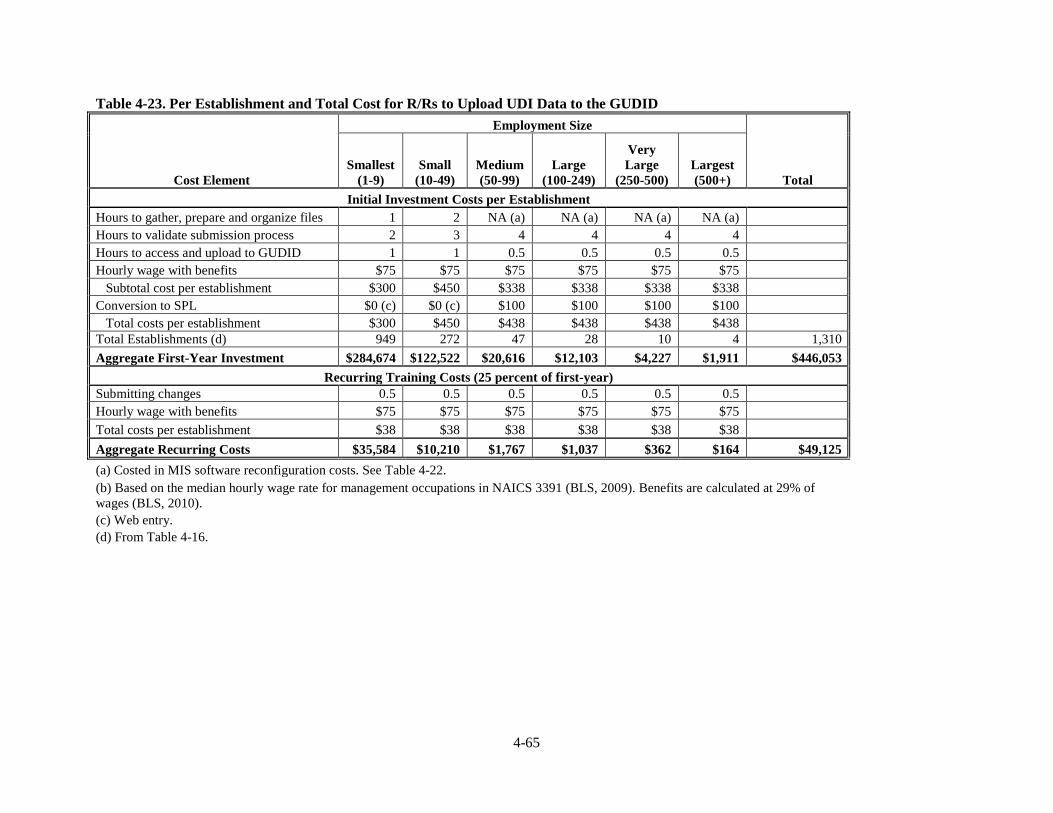
4-65
Table 4-23. Per Establishment and Total Cost for R/Rs to Upload UDI Data to the GUDID
Cost Element
Employment Size
Total Smallest
(1-9) Small
(10-49) Medium (50-99)
Large (100-249)
Very Large
(250-500) Largest (500+)
Initial Investment Costs per Establishment Hours to gather, prepare and organize files 1 2 NA (a) NA (a) NA (a) NA (a) Hours to validate submission process 2 3 4 4 4 4 Hours to access and upload to GUDID 1 1 0.5 0.5 0.5 0.5 Hourly wage with benefits $75 $75 $75 $75 $75 $75 Subtotal cost per establishment $300 $450 $338 $338 $338 $338 Conversion to SPL $0 (c) $0 (c) $100 $100 $100 $100 Total costs per establishment $300 $450 $438 $438 $438 $438 Total Establishments (d) 949 272 47 28 10 4 1,310 Aggregate First-Year Investment $284,674 $122,522 $20,616 $12,103 $4,227 $1,911 $446,053
Recurring Training Costs (25 percent of first-year) Submitting changes 0.5 0.5 0.5 0.5 0.5 0.5 Hourly wage with benefits $75 $75 $75 $75 $75 $75 Total costs per establishment $38 $38 $38 $38 $38 $38 Aggregate Recurring Costs $35,584 $10,210 $1,767 $1,037 $362 $164 $49,125 (a) Costed in MIS software reconfiguration costs. See Table 4-22. (b) Based on the median hourly wage rate for management occupations in NAICS 3391 (BLS, 2009). Benefits are calculated at 29% of wages (BLS, 2010). (c) Web entry. (d) From Table 4-16.

4-66
assumed to be affected by GUDID submission requirements. The costs to R/Rs are expected to be $0.4
million initially, and only about $50,000 per year thereafter for all R/Rs.
4.3.2.8 T otal C osts to R /R s
Table 4-24 presents the cost totals for R/Rs. These establishments add $34.3 million to the
investment total and $10.1 million to the annualized cost total (including annualized investment costs and
recurring year costs) for the proposed rule under an assumption that all costs are incurred immediately
after promulgation. See Section 4.4 for total costs estimated under the proposed implementation schedule.
Table 4-24. Total Investment and Annual Recurring Costs for UDI Implementation for R/Rs Cost Element First-Year Annual Recurring
Administration and planning $3,284,629 NA Registration Costs $1,577,798 NA Equipment and other investments $11,263,789 $3,098,416 Incremental label cost NA $959,716 Label redesign cost $4,648,270 NA Software (with training) $13,075,411 $1,105,056 Recordkeeping & Reporting (GUDID) $446,053 $49,125 Total $34,295,949 $5,212,314 Annualized Investment Total (a) $4,882,972 Total Annualized Costs $10,095,285 (a) First-year costs are annualized at 7 percent over 10 years. Source: See previous tables.
4.3.3 T otal C osts to U.S. I ndustr y
When costs for R/Rs are combined with those for initial labelers, the proposed rule is estimated to
generate total investment costs of $396.3 million (see Table 4-25). When annualized, with recurring costs
considered and under an assumption of immediate implementation, the costs are $130.1 million per year.
See Section 4.4 for cost estimates under the proposed implementation period.
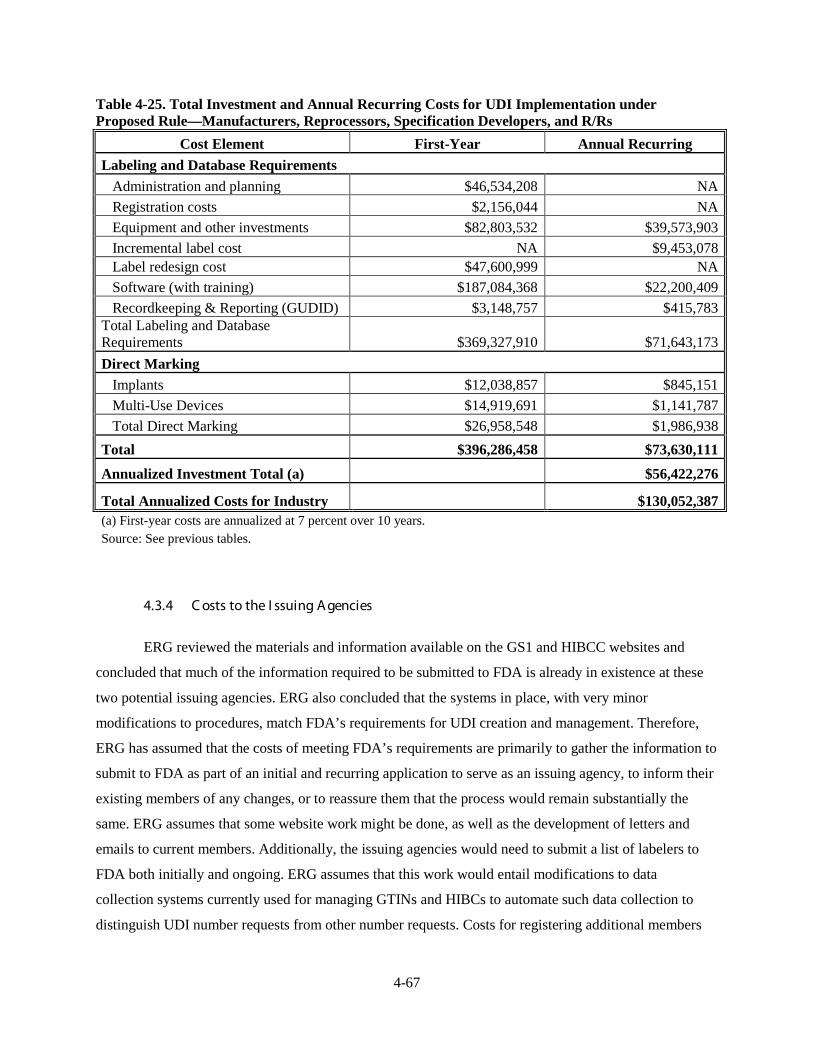
4-67
Table 4-25. Total Investment and Annual Recurring Costs for UDI Implementation under Proposed Rule—Manufacturers, Reprocessors, Specification Developers, and R/Rs
Cost Element First-Year Annual Recurring Labeling and Database Requirements Administration and planning $46,534,208 NA Registration costs $2,156,044 NA Equipment and other investments $82,803,532 $39,573,903 Incremental label cost NA $9,453,078 Label redesign cost $47,600,999 NA Software (with training) $187,084,368 $22,200,409 Recordkeeping & Reporting (GUDID) $3,148,757 $415,783 Total Labeling and Database Requirements $369,327,910 $71,643,173 Direct Marking Implants $12,038,857 $845,151 Multi-Use Devices $14,919,691 $1,141,787 Total Direct Marking $26,958,548 $1,986,938 Total $396,286,458 $73,630,111 Annualized Investment Total (a) $56,422,276
Total Annualized Costs for Industry $130,052,387 (a) First-year costs are annualized at 7 percent over 10 years. Source: See previous tables.
4.3.4 C osts to the I ssuing Agencies
ERG reviewed the materials and information available on the GS1 and HIBCC websites and
concluded that much of the information required to be submitted to FDA is already in existence at these
two potential issuing agencies. ERG also concluded that the systems in place, with very minor
modifications to procedures, match FDA’s requirements for UDI creation and management. Therefore,
ERG has assumed that the costs of meeting FDA’s requirements are primarily to gather the information to
submit to FDA as part of an initial and recurring application to serve as an issuing agency, to inform their
existing members of any changes, or to reassure them that the process would remain substantially the
same. ERG assumes that some website work might be done, as well as the development of letters and
emails to current members. Additionally, the issuing agencies would need to submit a list of labelers to
FDA both initially and ongoing. ERG assumes that this work would entail modifications to data
collection systems currently used for managing GTINs and HIBCs to automate such data collection to
distinguish UDI number requests from other number requests. Costs for registering additional members
4-68
incremental to the numbers that might register absent the proposed rule is not a cost of the rule; providing
these organizations with new members is beneficial to the organizations.
Nevertheless, ERG also judged that the assumption of significant responsibilities in the UDI
program for the issuing agencies would be examined carefully by executives and by legal counsel for
these organizations. The entities would want to ensure that their current membership interests are
protected and that their organization’s goals are not impeded by the new relationship.
ERG allotted $250,000 per entity in the first year to address any organizational and legal issues
involved, a cost which dominates the overall cost for the entities. ERG estimates that the total cost to the
two organizations performing functions similar to issuing agencies would be about $529,000 in the first
year and $54,800 in subsequent years. Annualized over 10 years at 7 percent, the cost to these
organizations is approximately $130,000 per year (see Table 4-26).
Although, at this time, ERG assumes only two agencies would become issuing agencies, ERG
also considered whether such costs would be similar for any other agency that wished to become an
issuing agency and concluded that such costs would be similar to those for GS1 and HIBCC. The
rationale is that any basic startup costs associated with being an issuing agency are not regulatory. FDA is
not requiring anyone to be an issuing agency; it is voluntary. The act of becoming an issuing agency
requires that agency to track their members, provide information to their members, and other similar
tasks. FDA requirements, however, impose specific tasks that might be incremental to these tasks,
requiring a specific way of organizing information and informing members. Because agencies wishing to
become issuing agencies would be able to assess the best way to organize themselves to meet their own
internal requirements as well as FDA requirements at the time of start up, it is possible that the
incremental costs estimated for HIBCC and GS1 could be reduced at new startup agencies. Therefore, the
incremental costs to meet the proposed requirements should be similar to or less than those estimated for
the two likeliest issuing agencies.
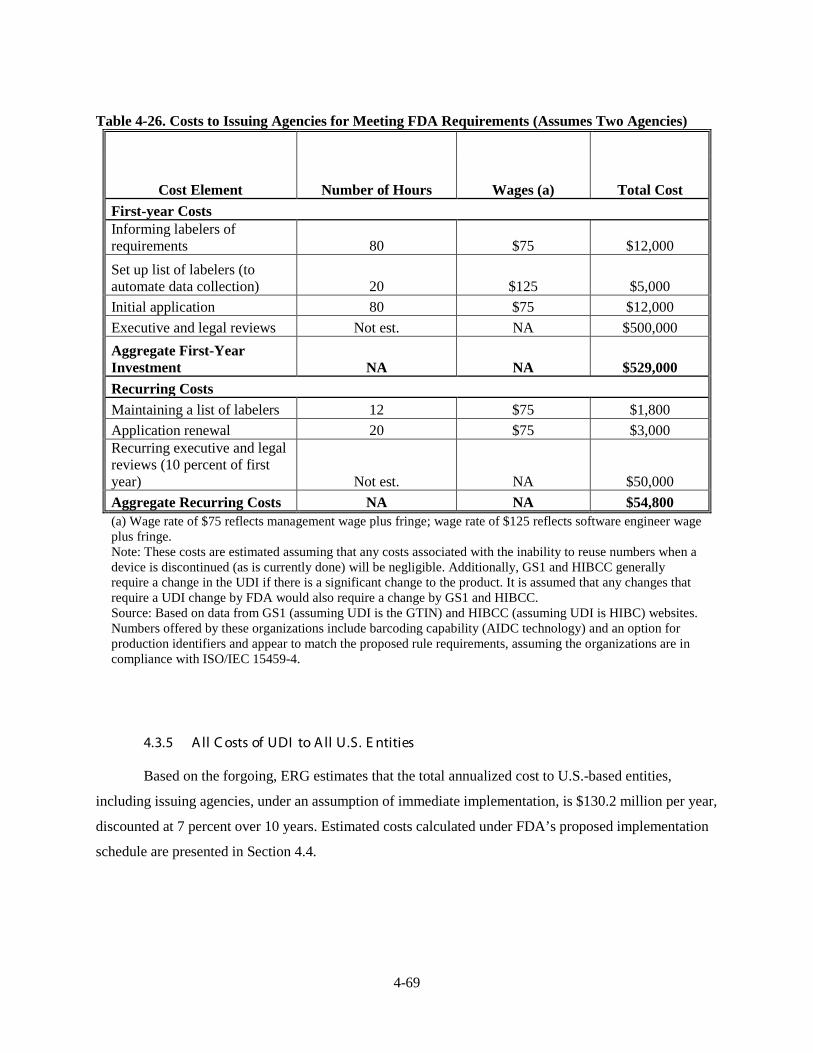
4-69
Table 4-26. Costs to Issuing Agencies for Meeting FDA Requirements (Assumes Two Agencies)
Cost Element Number of Hours Wages (a) Total Cost First-year Costs Informing labelers of requirements 80 $75 $12,000 Set up list of labelers (to automate data collection) 20 $125 $5,000 Initial application 80 $75 $12,000 Executive and legal reviews Not est. NA $500,000 Aggregate First-Year Investment NA NA $529,000 Recurring Costs Maintaining a list of labelers 12 $75 $1,800 Application renewal 20 $75 $3,000 Recurring executive and legal reviews (10 percent of first year) Not est. NA $50,000 Aggregate Recurring Costs NA NA $54,800 (a) Wage rate of $75 reflects management wage plus fringe; wage rate of $125 reflects software engineer wage plus fringe. Note: These costs are estimated assuming that any costs associated with the inability to reuse numbers when a device is discontinued (as is currently done) will be negligible. Additionally, GS1 and HIBCC generally require a change in the UDI if there is a significant change to the product. It is assumed that any changes that require a UDI change by FDA would also require a change by GS1 and HIBCC. Source: Based on data from GS1 (assuming UDI is the GTIN) and HIBCC (assuming UDI is HIBC) websites. Numbers offered by these organizations include barcoding capability (AIDC technology) and an option for production identifiers and appear to match the proposed rule requirements, assuming the organizations are in compliance with ISO/IEC 15459-4.
4.3.5 All C osts of UDI to All U.S. E ntities
Based on the forgoing, ERG estimates that the total annualized cost to U.S.-based entities,
including issuing agencies, under an assumption of immediate implementation, is $130.2 million per year,
discounted at 7 percent over 10 years. Estimated costs calculated under FDA’s proposed implementation
schedule are presented in Section 4.4.

4-70
4.3.6 C osts for F or eign E ntities and All Affected E ntities
The number of foreign labeling entities is nearly equal to the number of domestic labeling
entities. Using the assumptions that those entities are similar to domestic entities, the annualized costs to
foreign entities should approximately equal those for domestic entities, or a total of $130.1 million per
year. This would bring the total of all annualized costs to all entities both foreign and domestic to about
$260.2 million per year (see Table 4-27).
Table 4-27. Costs of the Proposed Rule for All Affected Entities
Entity One-Time Costs Recurring
Costs
Annualized One- Time
Costs
Total Annualized
Costs Domestic Industry $396,286,458 $73,630,111 $56,422,276 $130,052,387 Issuing Agencies $529,000 $54,800 $75,318 $130,118
Foreign Industry (a) $396,286,458 $73,630,111 $56,422,276 $130,052,387 Total Non-Federal Costs $793,101,916 $147,315,022 $112,919,870 $260,234,892 (a) Assumes costs to foreign industry are the same as domestic costs, based on number of registrations with FDA.
Source: See previous tables.
4.4 T I M I NG OF I NV E ST M E NT S
The costs in the previous sections are estimated assuming that all costs are incurred at
promulgation. In reality, FDA has proposed granting additional time for device labelers to come into
compliance with UDI requirements. Class III devices would be given a year from promulgation to be
labeled and if they needed to be marked, these devices would be given an additional 2 years before direct
marking would be required. Class II and Class I (and unclassified) devices would be given three years and
five years, respectively, from promulgation before the labels for those devices would need to display a
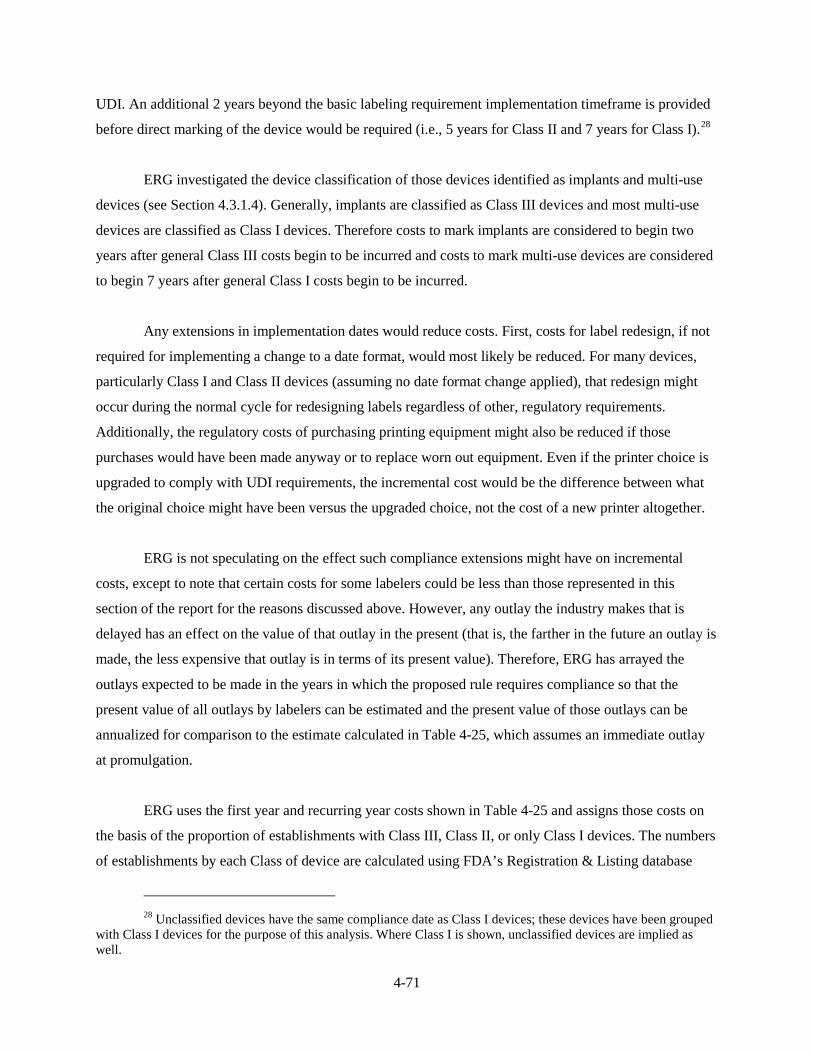
4-71
UDI. An additional 2 years beyond the basic labeling requirement implementation timeframe is provided
before direct marking of the device would be required (i.e., 5 years for Class II and 7 years for Class I).28
ERG investigated the device classification of those devices identified as implants and multi-use
devices (see Section 4.3.1.4). Generally, implants are classified as Class III devices and most multi-use
devices are classified as Class I devices. Therefore costs to mark implants are considered to begin two
years after general Class III costs begin to be incurred and costs to mark multi-use devices are considered
to begin 7 years after general Class I costs begin to be incurred.
Any extensions in implementation dates would reduce costs. First, costs for label redesign, if not
required for implementing a change to a date format, would most likely be reduced. For many devices,
particularly Class I and Class II devices (assuming no date format change applied), that redesign might
occur during the normal cycle for redesigning labels regardless of other, regulatory requirements.
Additionally, the regulatory costs of purchasing printing equipment might also be reduced if those
purchases would have been made anyway or to replace worn out equipment. Even if the printer choice is
upgraded to comply with UDI requirements, the incremental cost would be the difference between what
the original choice might have been versus the upgraded choice, not the cost of a new printer altogether.
ERG is not speculating on the effect such compliance extensions might have on incremental
costs, except to note that certain costs for some labelers could be less than those represented in this
section of the report for the reasons discussed above. However, any outlay the industry makes that is
delayed has an effect on the value of that outlay in the present (that is, the farther in the future an outlay is
made, the less expensive that outlay is in terms of its present value). Therefore, ERG has arrayed the
outlays expected to be made in the years in which the proposed rule requires compliance so that the
present value of all outlays by labelers can be estimated and the present value of those outlays can be
annualized for comparison to the estimate calculated in Table 4-25, which assumes an immediate outlay
at promulgation.
ERG uses the first year and recurring year costs shown in Table 4-25 and assigns those costs on
the basis of the proportion of establishments with Class III, Class II, or only Class I devices. The numbers
of establishments by each Class of device are calculated using FDA’s Registration & Listing database
28 Unclassified devices have the same compliance date as Class I devices; these devices have been grouped
with Class I devices for the purpose of this analysis. Where Class I is shown, unclassified devices are implied as well.

4-72
(FDA, 2010a), which contains the product codes of all devices labeled by each labeler. ERG then linked
FDA’s product code database (FDA, 2010b), which provides the Class of the device for each product
code, with the registration and listing data to create a count of domestic labelers who label (1) any Class
III devices, (2) Class II and Class I devices only, or (3) Class I devices only. These counts can be seen in
Table 4-28. The percentages shown in the table are those used to distribute the costs of compliance by
year incurred. Note that half of recurring costs are assigned, for simplicity, in the first year of
implementation for each device Class because ERG assumes that some operating costs (which are
captured as a portion of recurring year costs) are incurred in the first year of implementation. For
example, as the table shows, 6 percent of all labeling establishments label Class III devices. Therefore,
ERG assumes that 6 percent of first year costs and half of the 6 percent of recurring year costs (excluding
costs for DM) are incurred by the Class III compliance date.
ERG has also made a simplifying assumption that, for example, if a labeler labels any Class III
device, the entire establishment and all of its lines would come into compliance at the time the Class III
device must meet UDI requirements (excluding devices requiring DM). So even if some lines are labeling
Class I devices, the entire establishment’s outlay is assumed to have occurred by the most restrictive
compliance date (in this case, the Class III compliance date). This could overstate costs to some extent,
since certain lines at an establishment might be brought into compliance later than is estimated here. As
noted, DM costs are assumed to be incurred 2 years after the compliance date for the relevant type of
device (implant costs are assumed incurred 2 years after the Class III compliance date and multi-use
devices are assumed incurred 2 years after the Class I compliance date).
ERG also made some simplifying assumptions regarding the effect of the 90-day implementation
period for date format changes. Because we assume all labelers are affected by this requirement, and that
all labelers would meet the date format change and simultaneously redesign their labels to accommodate
UDI, we assume they incur the costs of label redesign and label materials immediately. We have,
therefore, placed the first year costs of label redesign and all recurring costs of label materials and labor
time in the first year. We have not separated the time costs to apply secondary labels and to confer with
outside printers from the costs of materials even though such costs would not be incurred immediately.
These time costs are small, however and placing all label time and materials costs in the first year
simplifies the timing calculations.
The timing assumptions for costs other than those related to labeling redesign and materials are as
follows. ERG assumes that the rule would be promulgated by year end 2011, with Class III device

4-73
compliance required at the end of 2012. (The formula used to calculate present value, however, is one that
calculates a beginning of year outlay because many outlays would be made in the year prior to the
compliance date.) ERG then assigns 50 percent of the recurring costs in the same year in which
implementation outlays begin and all recurring costs are assigned in subsequent years.
Table 4-28. Numbers and Percentages of Labeling Establishments with Class III, Class II, and Class I Devices
Type of Labeler
Class I Only Class I & II Only Any Class III
Total
Number of
Estabs. Percent
Number of
Estabs. Percent
Number of
Estabs. Percent Manufacturer 1,813 24% 2,729 36% 359 5% 4,901 Reprocessor 8 0% 13 0% 0 0% 21 Spec. Developer 646 9% 636 8% 64 1% 1,346 R/R 829 11% 460 6% 21 0% 1,310 All Labelers 3,296 43% 3,838 51% 444 6% 7,578 Source: FDA’s Registration & Listing Database, FDA, 2010a; FDA’s Product Codes Database, FDA, 2010b.
The timing array is presented in Table 4-29. The table computes the present value and annualized
costs under two analytical time frames and two discount rates. The first time frame is a 20-year
timeframe, in which certain outlays are incurred when reinvestments in equipment and software are made
10 years after initial outlays are made. The present value calculated covers the entire 20 years of outlays
and is annualized over 20 years at a 7 percent discount rate and then at a 3 percent discount rate. The
second time frame is a 10-year time frame (which corresponds to the time frame used elsewhere in this
report). In this analysis, the present value is calculated over 10 years and is annualized over 10 years and
at the 7 percent and 3 percent discount rates.
As Table 4-29 shows, the annualized costs to labelers, which were $130.1 million per year in
Table 4-25, drop to $92.6 million per year using the same 7 percent and 10-year time frame as used
previously. This is $37.4 million per year less than that shown in the earlier table. At 3 percent over 10
years, the costs are $92.4 million per year, or $37.6 million less than that shown in the earlier table. Under
the 20-year time frame at the 7 percent discount rate, costs are $96.8 million per year (higher than under
the 10-year analysis due to the need for some reinvestment following the end of the 10-year time frame),
which is $33.2 million less than that shown in the earlier table. At a 3 percent discount rate over 20 years,
the cost is $97.1 million per year ($32.9 million per year less than that calculated under the immediate
implementation assumption).
4-74
Table 4-29. Total Costs of the Proposed Rule to All Labelers with Timing of Outlays Occurring in Years Corresponding to Compliance Dates One Year, Three Years, and Five Years from Promulgation, Depending on Class of Device Labeled
5-1
SE C T I ON F I V E
E C ONOM I C I M PAC T S
The proposed rule, with costs as shown in Section Four, would have an impact on firms and
establishments identified as medical device labelers. This section discusses these impacts in terms of
compliance costs as a percentage of firm and establishment revenues. Both initial labelers (manufacturers,
reprocessors, and specification developers) and R/Rs are discussed, respectively, in Sections 5.1 and 5.2
below. Section 5.3 summarizes the number of firms that are affected by the compliance costs in excess of
1 percent, 3 percent, and 5 percent of revenues. Impacts on firms with and without direct marking are
presented for comparison purposes. Impacts on all establishments are presented in Section 5.4.
5.1 I M PAC T S ON DE V I C E M A NUF AC T UR I NG , R E PR OC E SSI NG , AND SPE C I F I C AT I ON DE V E L OPM E NT F I R M S
To determine impacts on firms, ERG needed to combine costs estimated for establishments and
those estimated for firms. Those costs already calculated per-firm for each size of firm needed little
additional work. However, establishment costs did require some work before they could be applied to
firms. Specifically, ERG defined all of these costs on a per-establishment basis by size, then made
assumptions (based on firm size) about the size and numbers of establishments owned by firms.
ERG first compiled the costs estimated in Section Four that were based on establishments. These
costs included planning and administrative costs, printing equipment and related costs, costs to initially
redesign device labels to accept the barcodes, ongoing label labor and materials costs for supplemental
labels or larger device labels, and costs for uploading information into the GUDID. Section Four did not,
however, present all of these per-establishment costs by establishment size. Therefore, ERG restructured
the aggregate costs for initial labelers (manufacturers, reprocessors, and specification developers) so that
they could be presented on the basis of size. Additionally, a few establishments are expected to incur
sizeable DM costs. Because most establishments would not incur these costs, ERG separately addresses
DM costs and assigns them to a subset of affected establishments.
Table 5-1 presents the results of this distribution of aggregate first year and recurring year
establishment costs by establishment size and by type of cost. (These costs are not yet annualized).
Because ERG is developing “typical costs” to apply to firms, costs for some small establishments (with 1
to 9 employees) to read and understand the rule to the point where they realize they have an exception, are

5-2
Table 5-1. Total Costs by Establishment Employment Size Group for Initial Labelers (Excludes Software and Computer-Related Costs)
Estab. Size
No. of Initial
Labelers
Costs of Planning, Labeling & GUDID (a) Costs of Equipment
Additional Costs of DM, Multi-Use Items (b)
Additional Costs of DM, Implants (b)
First Year Rec. Yr. First Year Rec. Year First Year Rec. Year First Year Rec. Year 1-4 1,162 $4,673,706 $547,652 $481,138 $48,114 $451,635 $45,163 $962,852 $96,285 5-9 721 $5,535,925 $341,685 $298,525 $29,853 $320,491 $32,049 $670,287 $67,029 10-49 1,725 $25,441,623 $1,156,996 $40,259,751 $16,008,212 $902,065 $90,207 $2,366,075 $236,607 50-99 472 $9,178,559 $698,388 $10,532,418 $4,187,934 $279,776 $27,978 $743,303 $74,330 100-249 396 $15,218,253 $1,807,136 $8,700,669 $5,857,893 $2,557,456 $255,746 $973,982 $97,398 250-499 195 $16,849,872 $1,321,907 $6,960,185 $6,114,641 $3,600,837 $360,084 $1,169,017 $116,902 500+ 113 $14,644,780 $2,986,256 $4,307,057 $4,228,841 $3,011,323 $301,132 $688,979 $68,898 Total 4,784 $91,542,717 $8,860,020 $71,539,744 $36,475,487 $11,123,585 $1,112,359 $7,574,495 $757,450 (a) Does not include planning cost for exempt facilities to understand rule. (b) Includes only the cost of DM (does not include costs for exemptions or software upgrades). Source: Previous tables in Section Four.

5-3
not considered (however, costs to establishments using UPCs only are included on a weighted average
basis). These costs are assumed to have a negligible impact on the firms to which they apply and are not
considered sufficiently widespread or large enough to distribute across all firms that do not meet
exceptions.
Additionally, DM costs reflect only the costs for DM; costs for filing exceptions and notifying
FDA, if necessary, and for upgrading software are very small and affect only a small portion of those
establishments required to directly mark devices. Also, DM costs should be the “typical” costs applying
to the few establishments that would need to mark devices rather than “average costs” distributed across
all establishments, which would understate impacts. By omitting some small costs not applicable to the
majority of establishments and by separating the substantial DM costs (which apply only to a few
establishments), from other costs applicable to all establishments, ERG can construct per-establishment
costs that are representative of costs to the large majority of establishments. Costs to establishments and
impacts on firms that would need to meet DM requirements are handled separately from other costs and
impacts throughout this section.
Table 5-2 presents the costs shown in Table 5-1 on an annualized basis (using 7 percent over 10
years), then presents those costs on a per-establishment basis for the various size establishments. Total
per-establishment costs applicable to all establishments are shown, along with additional costs that would
apply to establishments that would need to meet various DM requirements. Note that equipment costs
reflect a weighted average cost to establishments, a few of which are assumed to have variable printing
capabilities already (about 3 percent of establishments overall, mostly larger establishments). The per-
establishment costs calculated with this weighted average do not differ substantially from those calculated
assuming that no establishments have variable printing capabilities. As a result, ERG believes that the
per-establishment costs captured are representative of the equipment costs for a very large majority of
establishments owned by affected firms.
As Table 5-2 indicates, total costs applicable to all establishments on a per-establishment basis
range from a little over $1,000 per year for the smallest establishments up to about $88,000 per year for
the largest establishments. DM costs add substantially to the costs of the few establishments that would
need to meet DM requirements. The DM costs range from a low of about $6,000 per facility per year for
the smallest establishments for marking multi-use equipment up to a high of over $260,000 per
establishment per year for marking implants at the largest facilities. These costs are used later in Section
5.4 to investigate impacts at the establishment level.
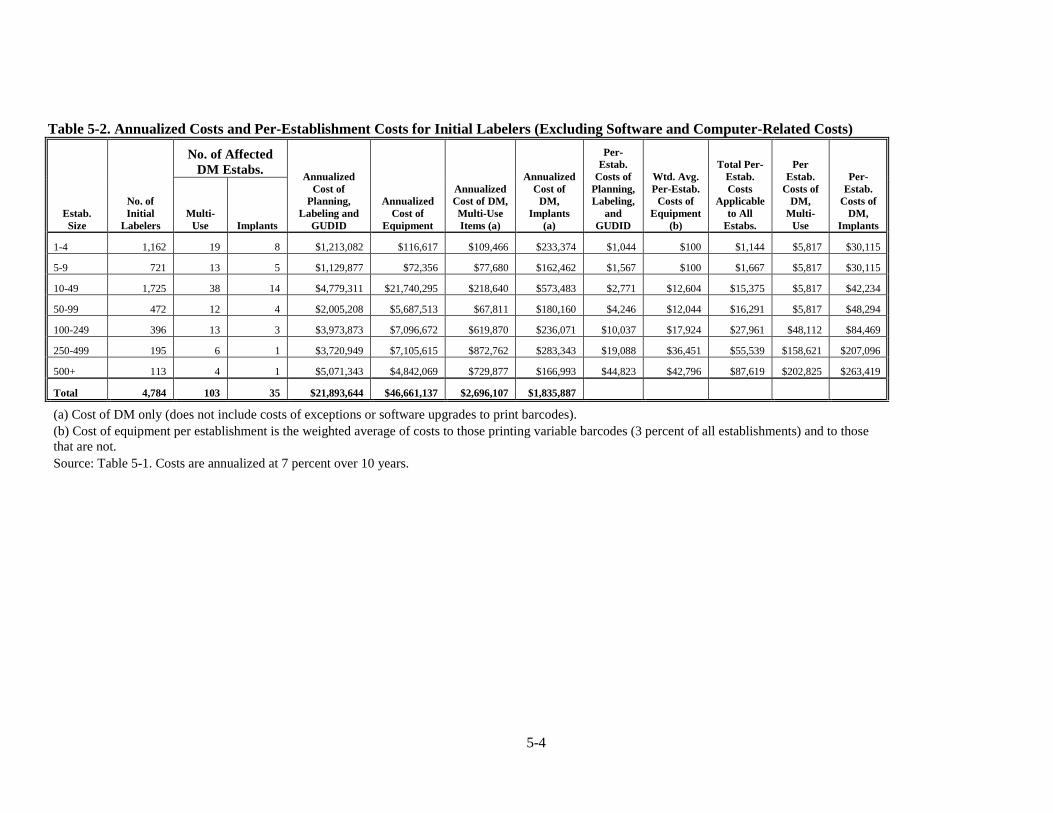
5-4
Table 5-2. Annualized Costs and Per-Establishment Costs for Initial Labelers (Excluding Software and Computer-Related Costs)
Estab. Size
No. of Initial
Labelers
No. of Affected DM Estabs. Annualized
Cost of Planning,
Labeling and GUDID
Annualized Cost of
Equipment
Annualized Cost of DM, Multi-Use Items (a)
Annualized Cost of
DM, Implants
(a)
Per-Estab.
Costs of Planning, Labeling,
and GUDID
Wtd. Avg. Per-Estab.
Costs of Equipment
(b)
Total Per-Estab. Costs
Applicable to All
Estabs.
Per Estab.
Costs of DM,
Multi-Use
Per-Estab.
Costs of DM,
Implants Multi-
Use Implants
1-4 1,162 19 8 $1,213,082 $116,617 $109,466 $233,374 $1,044 $100 $1,144 $5,817 $30,115
5-9 721 13 5 $1,129,877 $72,356 $77,680 $162,462 $1,567 $100 $1,667 $5,817 $30,115
10-49 1,725 38 14 $4,779,311 $21,740,295 $218,640 $573,483 $2,771 $12,604 $15,375 $5,817 $42,234
50-99 472 12 4 $2,005,208 $5,687,513 $67,811 $180,160 $4,246 $12,044 $16,291 $5,817 $48,294
100-249 396 13 3 $3,973,873 $7,096,672 $619,870 $236,071 $10,037 $17,924 $27,961 $48,112 $84,469
250-499 195 6 1 $3,720,949 $7,105,615 $872,762 $283,343 $19,088 $36,451 $55,539 $158,621 $207,096
500+ 113 4 1 $5,071,343 $4,842,069 $729,877 $166,993 $44,823 $42,796 $87,619 $202,825 $263,419
Total 4,784 103 35 $21,893,644 $46,661,137 $2,696,107 $1,835,887
(a) Cost of DM only (does not include costs of exceptions or software upgrades to print barcodes). (b) Cost of equipment per establishment is the weighted average of costs to those printing variable barcodes (3 percent of all establishments) and to those that are not. Source: Table 5-1. Costs are annualized at 7 percent over 10 years.

5-5
In Table 5-3, ERG distributes the per-establishment costs among the medical device labeling
firms, based on several assumptions about the number of establishments per firm. The planning, labeling,
GUDID, and equipment costs for the various sizes of establishment are assigned to firms based on
assumptions shown in the footnotes to Table 5-3. These assumptions are based on the fact that most firms
own only one establishment and most multi-establishment firms are larger firms. These assumptions are
also adjusted to keep the number of establishments by size allocated among the various firm sizes
reasonably consistent with the estimated total number of establishments by size and to keep the overall
aggregate annualized costs to the firms roughly equal to the overall aggregate annualized costs to all the
establishments for those four cost categories.
Once all of the planning, labeling, equipment, and GUDID costs are distributed to firms based on
the assumptions shown in Table 5-3 and the software costs to the firms are added in, the annualized cost
per firm (not including DM) is calculated. This cost ranges from about $1,300 per year at the smallest
firms to about $0.5 million per year at the largest firms. Note that it is assumed that a firm would own
only one DM establishment, so the number of affected DM firms equals the number of affected DM
establishments. ERG does not know the distribution of such establishments by firm. If some firms own
more than one such establishment, impacts on such firms might increase, but the number of affected firms
would be fewer.
To judge the impacts such costs would have on the various industries, ERG obtained a 2007
estimate of aggregate revenues and total firms by firm size and by NAICS from SBA. ERG assumes the
revenues for reprocessors are similar to those for manufacturing firms in NAICS 339112 (Surgical and
Medical Instrument Manufacturing). ERG also assumes that the revenues for specification developers are
similar to the average revenues, by size, across all device manufacturing NAICS. ERG makes these
assumptions because these firms make up a highly specialized and very small fraction of the NAICS
groups to which they belong and the revenues for those NAICS groups are not considered to reflect the
revenues received by firms with ultimate responsibility for the manufacture or reprocessing of medical
devices. ERG then calculated the average revenues for various firm size categories, as shown in Table
5-4. Because these firm size categories are more aggregated than those used by ERG to distribute costs,
Table 5-5 combines the firm sizes between 20 employees and 499 employees to produce a weighted
average cost for this aggregated size group. Table 5-6 then assigns the costs that are applicable to all firms
by size (not including DM) to each NAICS and compares these costs to the revenues by size and NAICS.
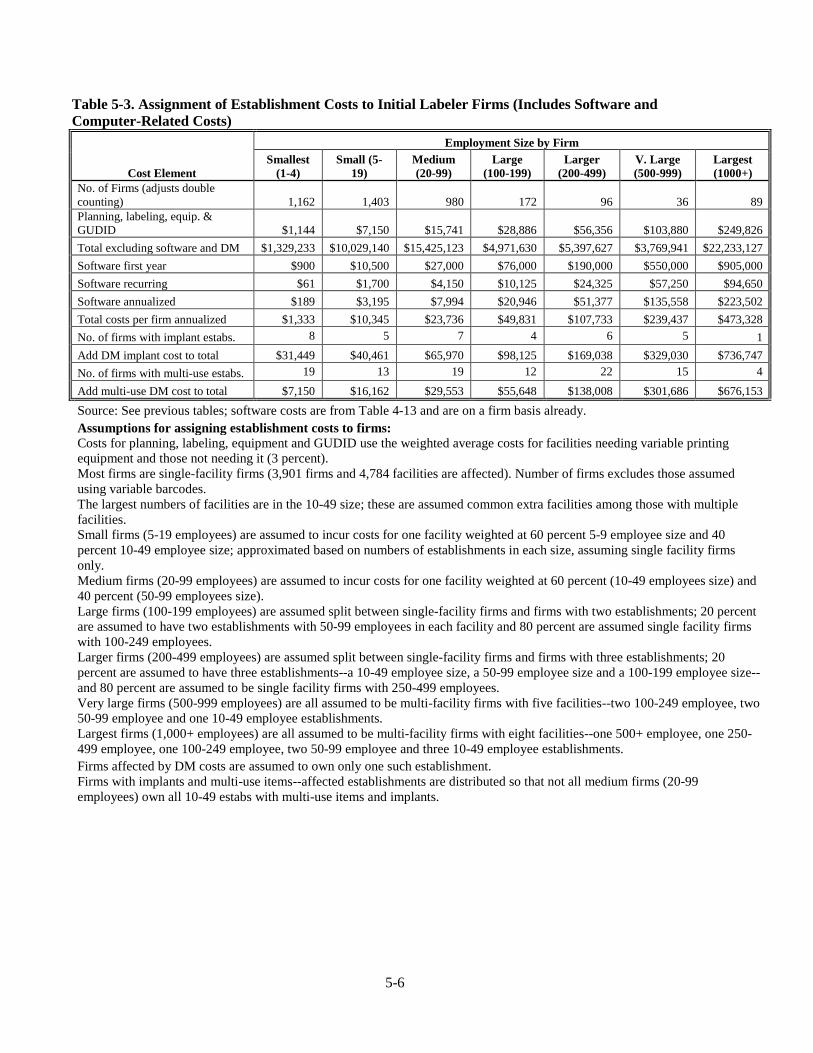
5-6
Table 5-3. Assignment of Establishment Costs to Initial Labeler Firms (Includes Software and Computer-Related Costs)
Cost Element
Employment Size by Firm Smallest
(1-4) Small (5-
19) Medium (20-99)
Large (100-199)
Larger (200-499)
V. Large (500-999)
Largest (1000+)
No. of Firms (adjusts double counting) 1,162 1,403 980 172 96 36 89 Planning, labeling, equip. & GUDID $1,144 $7,150 $15,741 $28,886 $56,356 $103,880 $249,826 Total excluding software and DM $1,329,233 $10,029,140 $15,425,123 $4,971,630 $5,397,627 $3,769,941 $22,233,127 Software first year $900 $10,500 $27,000 $76,000 $190,000 $550,000 $905,000 Software recurring $61 $1,700 $4,150 $10,125 $24,325 $57,250 $94,650 Software annualized $189 $3,195 $7,994 $20,946 $51,377 $135,558 $223,502 Total costs per firm annualized $1,333 $10,345 $23,736 $49,831 $107,733 $239,437 $473,328 No. of firms with implant estabs. 8 5 7 4 6 5 1 Add DM implant cost to total $31,449 $40,461 $65,970 $98,125 $169,038 $329,030 $736,747 No. of firms with multi-use estabs. 19 13 19 12 22 15 4 Add multi-use DM cost to total $7,150 $16,162 $29,553 $55,648 $138,008 $301,686 $676,153
Source: See previous tables; software costs are from Table 4-13 and are on a firm basis already. Assumptions for assigning establishment costs to firms: Costs for planning, labeling, equipment and GUDID use the weighted average costs for facilities needing variable printing equipment and those not needing it (3 percent). Most firms are single-facility firms (3,901 firms and 4,784 facilities are affected). Number of firms excludes those assumed using variable barcodes. The largest numbers of facilities are in the 10-49 size; these are assumed common extra facilities among those with multiple facilities. Small firms (5-19 employees) are assumed to incur costs for one facility weighted at 60 percent 5-9 employee size and 40 percent 10-49 employee size; approximated based on numbers of establishments in each size, assuming single facility firms only. Medium firms (20-99 employees) are assumed to incur costs for one facility weighted at 60 percent (10-49 employees size) and 40 percent (50-99 employees size). Large firms (100-199 employees) are assumed split between single-facility firms and firms with two establishments; 20 percent are assumed to have two establishments with 50-99 employees in each facility and 80 percent are assumed single facility firms with 100-249 employees. Larger firms (200-499 employees) are assumed split between single-facility firms and firms with three establishments; 20 percent are assumed to have three establishments--a 10-49 employee size, a 50-99 employee size and a 100-199 employee size--and 80 percent are assumed to be single facility firms with 250-499 employees. Very large firms (500-999 employees) are all assumed to be multi-facility firms with five facilities--two 100-249 employee, two 50-99 employee and one 10-49 employee establishments. Largest firms (1,000+ employees) are all assumed to be multi-facility firms with eight facilities--one 500+ employee, one 250-499 employee, one 100-249 employee, two 50-99 employee and three 10-49 employee establishments. Firms affected by DM costs are assumed to own only one such establishment. Firms with implants and multi-use items--affected establishments are distributed so that not all medium firms (20-99 employees) own all 10-49 estabs with multi-use items and implants.

5-7
Table 5-4. Estimated Revenues by Firm Size and Industry (2007)
Industry
Firm Revenues by Employment Size
0-4 Employees
5-19 Employees
20-499 Employees
500+ Employees
NACIS 325413, In vitro diagnostic substances manufacturing $890,439 $3,459,254 $28,350,919 $413,375,320 NAICS 334510, Electromedical and electrotherapeutic apparatus mfg. $520,423 $2,093,210 $21,094,808 $328,866,579 NAICS 334517, Irradiation apparatus manufacturing $594,135 $2,287,712 $18,572,244 $799,591,714 NAICS 339112 Surgical and medical instrument manufacturing $443,048 $1,726,137 $15,901,566 $240,247,711 NAICS 339113 Surgical appliance and supplies manufacturing $365,781 $1,619,236 $13,649,692 $233,294,991 NAICS 339114, Dental equipment and supplies manufacturing $330,737 $1,042,052 $16,218,051 $167,667,417 NAICS 339115, Ophthalmic goods manufacturing $1,643,624 $1,556,642 $8,124,152 $215,169,000 Reprocessors (a) $443,048 $1,726,137 $15,901,566 $240,247,711 Specification Developers (b) $568,173 $1,657,778 $15,742,070 $284,274,405
(a) Reprocessors are assumed to have revenues similar to those for surgical and medical instrument manufacturing. (b) Specification developers are assumed to have revenues similar to the average medical device manufacturer. Source: Based on estimated receipts reported for 2007 (SBA, 2007).
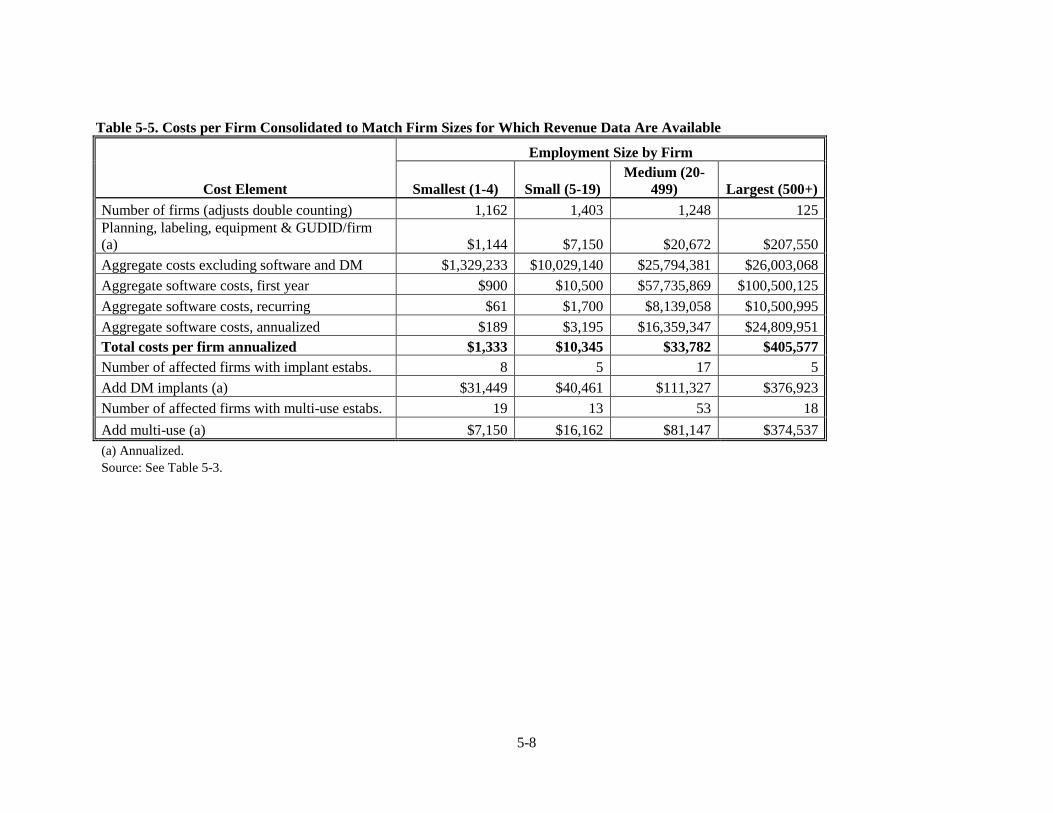
5-8
Table 5-5. Costs per Firm Consolidated to Match Firm Sizes for Which Revenue Data Are Available
Cost Element
Employment Size by Firm
Smallest (1-4) Small (5-19) Medium (20-
499) Largest (500+) Number of firms (adjusts double counting) 1,162 1,403 1,248 125 Planning, labeling, equipment & GUDID/firm (a) $1,144 $7,150 $20,672 $207,550 Aggregate costs excluding software and DM $1,329,233 $10,029,140 $25,794,381 $26,003,068 Aggregate software costs, first year $900 $10,500 $57,735,869 $100,500,125 Aggregate software costs, recurring $61 $1,700 $8,139,058 $10,500,995 Aggregate software costs, annualized $189 $3,195 $16,359,347 $24,809,951 Total costs per firm annualized $1,333 $10,345 $33,782 $405,577 Number of affected firms with implant estabs. 8 5 17 5 Add DM implants (a) $31,449 $40,461 $111,327 $376,923 Number of affected firms with multi-use estabs. 19 13 53 18 Add multi-use (a) $7,150 $16,162 $81,147 $374,537 (a) Annualized. Source: See Table 5-3.
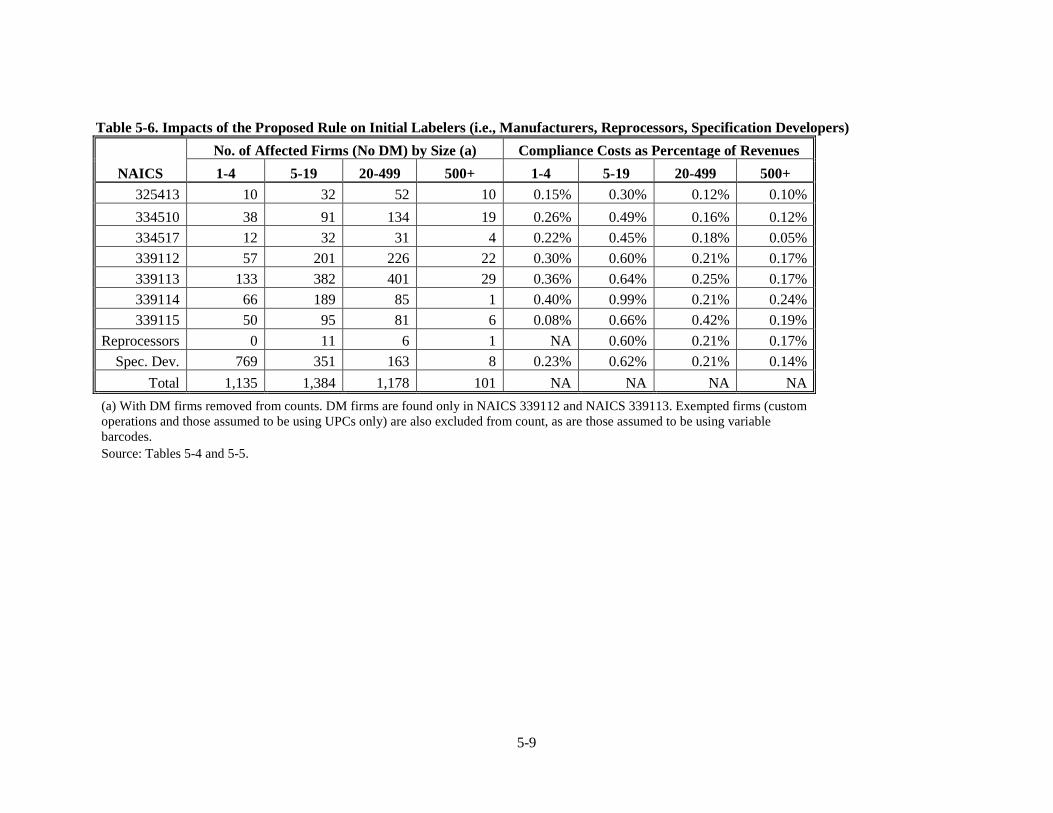
5-9
Table 5-6. Impacts of the Proposed Rule on Initial Labelers (i.e., Manufacturers, Reprocessors, Specification Developers)
NAICS No. of Affected Firms (No DM) by Size (a) Compliance Costs as Percentage of Revenues 1-4 5-19 20-499 500+ 1-4 5-19 20-499 500+
325413 10 32 52 10 0.15% 0.30% 0.12% 0.10% 334510 38 91 134 19 0.26% 0.49% 0.16% 0.12% 334517 12 32 31 4 0.22% 0.45% 0.18% 0.05% 339112 57 201 226 22 0.30% 0.60% 0.21% 0.17% 339113 133 382 401 29 0.36% 0.64% 0.25% 0.17% 339114 66 189 85 1 0.40% 0.99% 0.21% 0.24% 339115 50 95 81 6 0.08% 0.66% 0.42% 0.19%
Reprocessors 0 11 6 1 NA 0.60% 0.21% 0.17% Spec. Dev. 769 351 163 8 0.23% 0.62% 0.21% 0.14%
Total 1,135 1,384 1,178 101 NA NA NA NA (a) With DM firms removed from counts. DM firms are found only in NAICS 339112 and NAICS 339113. Exempted firms (custom operations and those assumed to be using UPCs only) are also excluded from count, as are those assumed to be using variable barcodes. Source: Tables 5-4 and 5-5.

5-10
As Table 5-6 shows, in all cases, the estimated compliance costs are less than 1 percent of
revenues, before DM is considered. The highest percentage shown in the table is 0.99 percent for firms
with 5-19 employees in NAICS 339114. This situation changes when DM costs are considered. Table 5-7
presents the compliance costs as a percentage of revenues for the two NAICS categories in which DM
requirements would be expected to apply. As the table shows, impacts in terms of compliance costs as a
percentage of revenues are higher than 1 percent for all very small firms (1-4 employees) and firms with
5-9 employees marking implants. These higher percentages range from 1.6 percent to nearly 9 percent of
revenues (five firms are expected to incur this highest percentage of costs to revenues).
5.2 I M PAC T S ON R E PAC K AG I NG AND R E L AB E L I NG (R /R F I R M S
As for estimating impacts on initial labeling firms, ERG first organized the aggregate first-year
and recurring-year cost data from Section Four by establishment size. These costs were then annualized
and presented on a per-establishment basis in Table 5-8. As the table shows, these costs range from less
than $1,000 per establishment per year at the smallest establishments to about $100,000 per establishment
per year at the largest establishments. Again, these costs exclude software and computer-related expenses
because these have been estimated on a firm basis and are added in after all other establishment-based
costs are assigned to firms.
Table 5-9 allocates these establishment costs to firms based on the assumptions shown in the
footnote to Table 5-9. The table then adds in software costs.29
29 Unlike initial labelers (who are assumed only rarely to need to register barcodes), the R/Rs are all
expected to register, so these costs are included in the table.
The table also consolidates the costs for
firms in the 20-499 size group so that costs can be compared on the same basis as available revenue
estimates. Total costs per firm range from about $1,000 per firm per year in the smallest size group to
about $144,000 per firm per year in the largest size group. ERG obtained an estimate of aggregate
revenues for the two NAICS assumed to represent the R/Rs (see Section Three). The revenues shown are
the weighted average revenues between the two NAICS. These revenues are then compared to the
compliance costs per year per firm and a percentage is calculated. As the table shows, for all size classes,
compliance costs as a percentage of revenues are less than 1 percent.
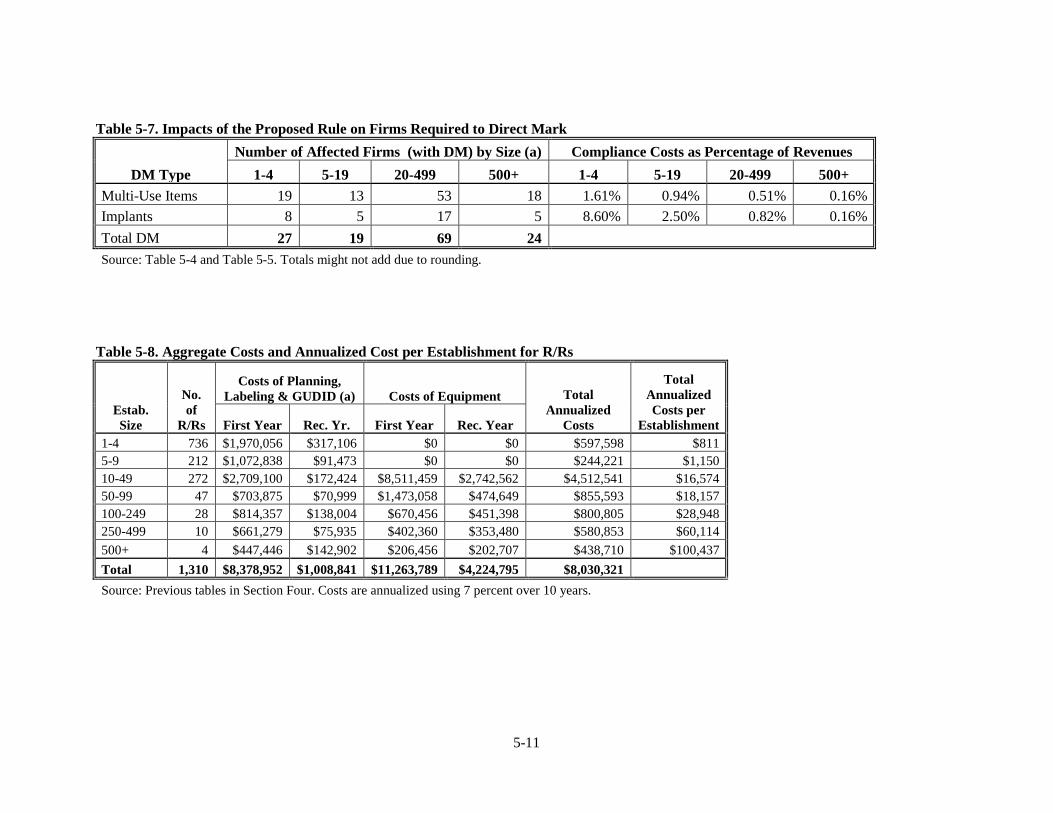
5-11
Table 5-7. Impacts of the Proposed Rule on Firms Required to Direct Mark
DM Type Number of Affected Firms (with DM) by Size (a) Compliance Costs as Percentage of Revenues
1-4 5-19 20-499 500+ 1-4 5-19 20-499 500+ Multi-Use Items 19 13 53 18 1.61% 0.94% 0.51% 0.16% Implants 8 5 17 5 8.60% 2.50% 0.82% 0.16% Total DM 27 19 69 24 Source: Table 5-4 and Table 5-5. Totals might not add due to rounding.
Table 5-8. Aggregate Costs and Annualized Cost per Establishment for R/Rs
Estab. Size
No. of
R/Rs
Costs of Planning, Labeling & GUDID (a) Costs of Equipment Total
Annualized Costs
Total Annualized Costs per
Establishment First Year Rec. Yr. First Year Rec. Year 1-4 736 $1,970,056 $317,106 $0 $0 $597,598 $811 5-9 212 $1,072,838 $91,473 $0 $0 $244,221 $1,150 10-49 272 $2,709,100 $172,424 $8,511,459 $2,742,562 $4,512,541 $16,574 50-99 47 $703,875 $70,999 $1,473,058 $474,649 $855,593 $18,157 100-249 28 $814,357 $138,004 $670,456 $451,398 $800,805 $28,948 250-499 10 $661,279 $75,935 $402,360 $353,480 $580,853 $60,114 500+ 4 $447,446 $142,902 $206,456 $202,707 $438,710 $100,437 Total 1,310 $8,378,952 $1,008,841 $11,263,789 $4,224,795 $8,030,321 Source: Previous tables in Section Four. Costs are annualized using 7 percent over 10 years.

5-12
Table 5-9. Annualized Costs per R/R Firm, Revenues per Firm and Impacts of the Proposed Rule
Cost Element
Employment Size by Firm
Smallest (1-4) Small (5-19) Medium (20-199)
Large (200-499)
Medium/ Large (20-
499) Largest (500+)
Number of Firms 727 318 131 13 144 24 Cost of Planning, Labeling, GUDID & Equipment/Estab. $811 $2,692 $17,272 $44,729 $19,760 $89,909 Aggregate Cost of Planning, Labeling, GUDID & Equip. $589,761 $854,918 $2,254,456 $581,840 $2,836,296 $2,164,335 Per Firm Cost of Software, First Year $900 $10,500 $27,000 $76,000 $31,441 $190,000 Per Firm Cost of Software, Recurring Year $61 $1,700 $4,150 $10,125 $4,691 $24,325 Annualized Per Firm Cost of Software $189 $3,195 $7,994 $20,946 $9,168 $51,377 Per Firm Cost of Registration $500 $500 $4,000 $4,000 $4,000 $20,000 Annualized Per Firm Cost of Registration $71 $71 $570 $570 $570 $2,848 Total Annualized Cost per Firm, including Software and Registration $1,072 $5,958 $25,835 $66,244 $29,497 $144,133 Total Revenues per Firm $807,452 $2,804,152
NA NA $25,144,926 $462,879,102
Impacts (Compliance Costs as a Percentage of Revenues) 0.13% 0.21% 0.12% 0.03%
Source: Table 5-8, Table 4-18, and Table 4-22; SBA, 2007. Assumptions used to assign establishment costs to firms: Small firms (5-19 employees) are assumed to own one facility; 90 percent are assumed to own establishments in the 5-9 employee size class and 10 percent are assumed to own establishments in the 10-49 size class. Medium firms (20-199 employees) are assumed to own one facility; 90 percent are assumed to own an establishment in the 10-49 employee size class, 5 percent are assumed to own an establishment in the 50-99 employee size class and 5 percent are assumed to own an establishment in the 100-249 employee size class. Large firms (200-499 employees) are assumed to own one or two facilities; 20 percent are assumed to own two establishments (a 10-49 employee and a 100 to 249 employee size establishment), 40 percent are assumed to own one 250-499 employee size establishment, and 40 percent are assumed to own one 100-249 employee size establishment. The largest firms (500+ employees) are assumed to own one to four establishments; 50 percent are assumed to own one 500+ establishment; 30 percent are assumed to own two establishments: a 50-99 employee size establishment and a 250-500 employee size establishment; and 20 percent are assumed to own four establishments: three 50-99 employee size establishments and one 100-249 employee size establishment.
5-13
5.3 SUM M AR Y OF I M PAC T S ON M E DI C AL DE V I C E L AB E L I NG F I R M S
Table 5-10 summarizes the count of all firms by size and type where compliance costs as a
percentage of revenues exceed 1 percent, 3 percent and 5 percent. This table presents a count of such
firms with and without DM considered. As the table shows, compliance costs exceed 1 percent of
revenues only among firms that would need to meet DM requirements. With DM considered, 1.4 percent
of the smallest firms (1-4 employees), 0.3 percent of firms with 5-19 employees, and no larger firms are
expected to incur compliance costs exceeding 1 percent of revenues. Therefore, only 0.6 percent of all
firms are estimated to incur costs exceeding 1 percent of revenues.
5.4 I M PAC T S ON M E DI C AL DE V I C E L AB E L I NG E ST AB L I SH M E NT S
The forgoing analyses investigated the potential for impacts on firms. This analysis investigates
the potential for impacts on establishments, also determining whether costs as a percentage of revenues at
establishments exceed 1 percent. ERG used Census data (U.S. Census, 2010a) to estimate the value of
shipments or receipts at initial labeling and R/R establishments, by size of establishment.
For initial labelers, ERG calculated an estimated average value of shipments per employee at
each of the industries determined to be affected by the rule. As in the firm analysis, ERG used the medical
device manufacturing industry value of shipments per employee as a proxy for those revenues per
employee received by reprocessors and specification developers for similar reasons. That is, ERG
believes that the average revenues of establishments in those NAICS reflect primarily the much larger
groups of establishments that are not responsible for the manufacture or reprocessing of highly regulated
items such as medical devices; therefore, these average revenues are not representative of average
revenues associated with specification developers and reprocessors.
Table 5-11 shows the value of shipments per employee calculated in this way by industry. To
simplify the analysis, ERG chose the smallest value of shipments per establishment (about $230,000) for
all initial labeler establishments, regardless of industry. ERG then used the approximate midpoint of
employment in each size group (setting 750 employees as the estimate for employment at establishments
with more than 500 employees). We multiplied the number of employees at each size of establishment by
the estimated value of shipments per employee to estimate the per-establishment value of shipments at

5-14
Table 5-10. Number of Firms with Costs Exceeding 1%, 3%, and 5% of Revenues, With and Without DM Considered
NAICS No. of Firms with Costs >1% of Revenues No. of Firms with Costs >3% of Revenues No. of Firms with Costs >5% of Revenues 1-4 5-19 20-499 500+ Total 1-4 5-19 20-499 500+ Total 1-4 5-19 20-499 500+ Total
325413 0 0 0 0 0 0 0 0 0 0 0 0 0 0 0 334510 0 0 0 0 0 0 0 0 0 0 0 0 0 0 0 334517 0 0 0 0 0 0 0 0 0 0 0 0 0 0 0 339112 (no DM) 0 0 0 0 0 0 0 0 0 0 0 0 0 0 0 339112 19 0 0 0 19 0 0 0 0 0 0 0 0 0 0 339113 (no DM) 0 0 0 0 0 0 0 0 0 0 0 0 0 0 0 339113 8 5 0 0 13 8 0 0 0 8 8 0 0 0 8 339114 0 0 0 0 0 0 0 0 0 0 0 0 0 0 0 339115 0 0 0 0 0 0 0 0 0 0 0 0 0 0 0 Reprocessors 0 0 0 0 0 0 0 0 0 0 0 0 0 0 0 Spec. Dev. 0 0 0 0 0 0 0 0 0 0 0 0 0 0 0 R/Rs 0 0 0 0 0 0 0 0 0 0 0 0 0 0 0 Total with DM 27 5 0 0 32 8 0 0 0 8 8 0 0 0 8 Total without DM 0 0 0 0 0 0 0 0 0 0 0 0 0 0 0 All Firms 1,889 1,720 1,432 193 5,234 1,889 1,720 1,432 193 5,234 1,889 1,720 1,432 193 5,234 % of All Firms with DM 1.4% 0.3% 0.0% 0.0% 0.6% 0.4% 0.0% 0.0% 0.0% 0.1% 0.4% 0.0% 0.0% 0.0% 0.1% % of all Firms without DM 0.0% 0.0% 0.0% 0.0% 0.0% 0.0% 0.0% 0.0% 0.0% 0.0% 0.0% 0.0% 0.0% 0.0% 0.0%
Source: Tables 5-6, 5-7 and 5-9. All firms excludes exempted but includes those assumed using variable barcodes.
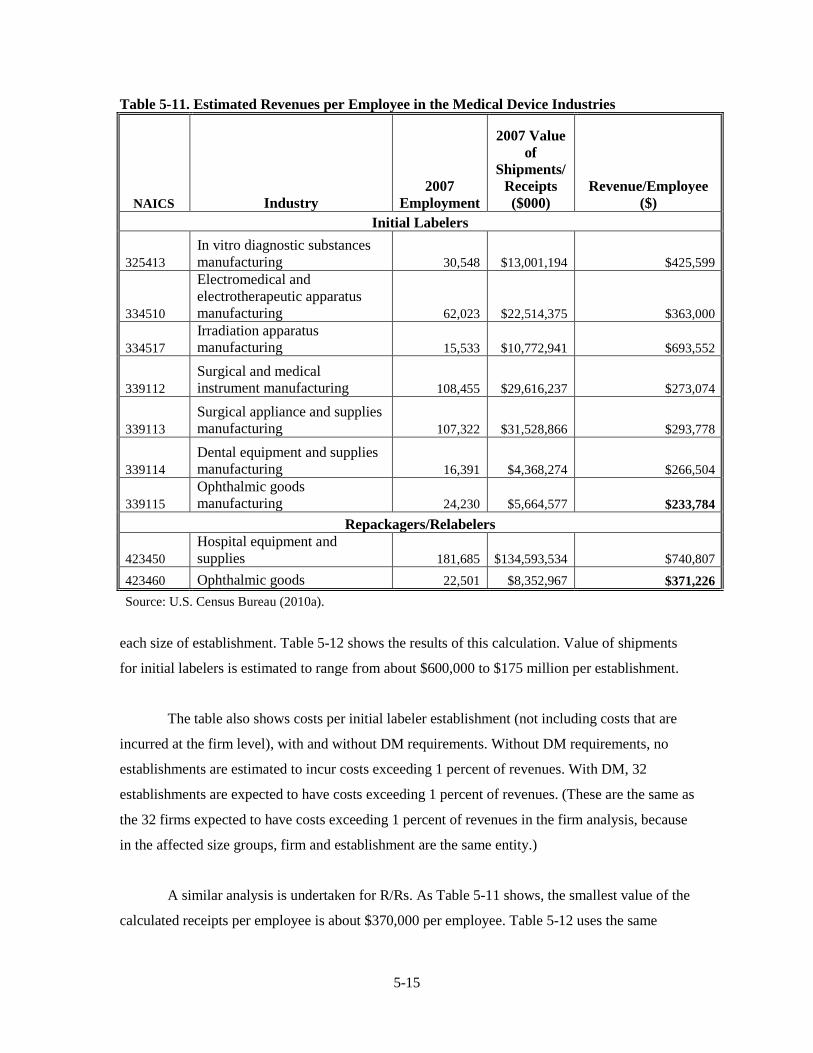
5-15
Table 5-11. Estimated Revenues per Employee in the Medical Device Industries
NAICS Industry 2007
Employment
2007 Value of
Shipments/ Receipts ($000)
Revenue/Employee ($)
Initial Labelers
325413 In vitro diagnostic substances manufacturing 30,548 $13,001,194 $425,599
334510
Electromedical and electrotherapeutic apparatus manufacturing 62,023 $22,514,375 $363,000
334517 Irradiation apparatus manufacturing 15,533 $10,772,941 $693,552
339112 Surgical and medical instrument manufacturing 108,455 $29,616,237 $273,074
339113 Surgical appliance and supplies manufacturing 107,322 $31,528,866 $293,778
339114 Dental equipment and supplies manufacturing 16,391 $4,368,274 $266,504
339115 Ophthalmic goods manufacturing 24,230 $5,664,577 $233,784
Repackagers/Relabelers
423450 Hospital equipment and supplies 181,685 $134,593,534 $740,807
423460 Ophthalmic goods 22,501 $8,352,967 $371,226 Source: U.S. Census Bureau (2010a).
each size of establishment. Table 5-12 shows the results of this calculation. Value of shipments
for initial labelers is estimated to range from about $600,000 to $175 million per establishment.
The table also shows costs per initial labeler establishment (not including costs that are
incurred at the firm level), with and without DM requirements. Without DM requirements, no
establishments are estimated to incur costs exceeding 1 percent of revenues. With DM, 32
establishments are expected to have costs exceeding 1 percent of revenues. (These are the same as
the 32 firms expected to have costs exceeding 1 percent of revenues in the firm analysis, because
in the affected size groups, firm and establishment are the same entity.)
A similar analysis is undertaken for R/Rs. As Table 5-11 shows, the smallest value of the
calculated receipts per employee is about $370,000 per employee. Table 5-12 uses the same

5-16
Table 5-12. Impacts of Proposed Rule on Medical Device Labeling Establishments
Estab. Size
Initial Labelers Costs and Shipments R/R Costs and Receipts
Costs as Percent of Shipments, Initial
Labelers
Cost as a Percent
of Receipts,
R/Rs
Initial Labeler Impacts with DM
Annualized Per Estab.,
without DM
Annualized Cost Per Estab.,
Plus DM Multi-Use
Annualized Cost Per Estab.,
Plus DM Implant
Estimated Shipments per Estab.
Annual Cost per Estab.
Estimated Receipts per
Estab. No DM
With Multi-
Use DM
With Implant
DM
No. of Multi-
Use Estabs.
No. of Implant Estabs.
No. Estabs. With
Costs>1% of
Shipments 1-4 $1,144 $6,961 $31,260 $584,460 $811 $928,066 0.2% 1.2% 5.3% 0.1% 19 8 27 5-9 $1,667 $7,484 $31,783 $1,636,488 $1,150 $2,598,585 0.1% 0.5% 1.9% 0.0% 13 5 5 10-49 $15,375 $21,192 $57,609 $7,013,520 $16,574 $11,136,794 0.2% 0.3% 0.8% 0.1% 38 14 0 50-99 $16,291 $22,742 $65,219 $17,533,800 $18,157 $27,841,986 0.1% 0.1% 0.4% 0.1% 12 4 0 100-249 $27,961 $78,065 $114,422 $40,912,200 $28,948 $64,964,634 0.1% 0.2% 0.3% 0.0% 13 3 0 250-499 $55,539 $220,592 $269,068 $87,669,000 $60,114 $139,209,930 0.1% 0.3% 0.3% 0.0% 6 1 0 500+ $87,619 $301,143 $361,737 $175,338,000 $100,437 $278,419,859 0.0% 0.2% 0.2% 0.0% 4 1 0 Total 103 35 32
Source: Tables 5-1, 5-9, and 5-11.

5-17
approach as described above to calculate a per-R/R establishment revenue by size of establishment. The
calculated per-establishment revenues are then compared to costs. No establishments are expected to have
costs exceeding 1 percent of revenues.
Based on these results, ERG determines that the establishment analysis does not indicate any
additional potential for impact on medical device labelers.

6-1
SE C T I ON SI X
AL T E R NAT I V E S T O T H E PR OPOSE D R UL E
ERG investigated six alternatives to the proposed rule. These alternatives are:
• No action, with an assumed voluntary adoption of UDI over a 15-year period.
• A requirement for labeling only (no direct marking and no GUDID requirements)
• All UDI requirements, but for Class II and Class III devices only
• All UDI requirements, but for Class III devices only
• Static barcoding only (no variable information such as lot, batch, date, or serial numbers needs to be barcoded on label)
• The GUDID entry system and database would be a module within the FDA Unified
Registration and Listing Service (FURLS). FDA estimates the costs for developing the entry system and database outside the FURLS system in the preamble to the proposed rule.
These six alternatives are discussed below in Sections 6.1 through 6.6 in terms of their costs and
impacts on labelers.
6.1 NO AC T I ON—V OL UNT AR Y ADOPT I ON
ERG investigated a no-action alternative in which there is no regulatory mandate but under which
we judge that manufacturers and R/Rs adopt UDI-type systems voluntarily. As a means to characterize
this possibility, ERG compared the costs over a voluntary implementation period of 15 years as opposed
to the regulation-imposed implementation period of up to 5 years (up to 7 years for DM) assumed in the
base case. The voluntary implementation period reflects the premise that manufacturers and R/Rs will
implement UDI eventually. Many are currently moving in that direction. For example, the international
standards-setting organization, GS1, has been working to develop a UDI standard to coordinate medical
device industry efforts. The choice of a 15-year voluntary implementation period reflects the presumption
that while manufacturers are moving in the direction of UDI systems, the many small medical device
companies, including those that do not sell products internationally, would be slow to adopt a UDI
system. Under the proposed rule implementation requirements, labelers of Class I (and unclassified)
devices would be allowed five years to meet the proposed rule, while labelers of Class II and Class III
devices would need to come into compliance in three years and one year post-promulgation, respectively
6-2
(with those needing to directly mark devices allowed an additional two years beyond the time granted for
their other UDI requirements). Based on information presented in Section Four, approximately 6 percent
of establishments are assumed to come into compliance in the first year (these establishments list at least
some devices that are considered Class III devices, although they might also label Class II or Class
I/unclassified devices).30
Table 6-1
Another 51 percent label at least some Class II (or Class I/unclassified devices,
but no Class III devices) and 43 percent label only Class I/unclassified devices. First-year label redesign
and all recurring costs of labeling are placed in the first year (with recurring label costs occurring in
subsequent years) due to the 90-day date format change requirement (see Section Four).
presents the timeline of costs (1) under the schedule imposed by the proposed rule and
(2) assuming an even, linear implementation pattern under a fifteen-year voluntary implementation
schedule. For the latter, ERG assumed that 1/15 (6.67 percent) of the establishments adopts UDI (with
DM, if applicable) each year. These estimates apply only to the establishments that have not already
adopted UDI numbering on their devices. The table displays the first year costs (including one-half of the
recurring year costs in the first year) and all subsequent year costs, and then sums the industry totals.
Finally, ERG calculates the present value of the cost streams over a 20-year period using a 7 percent
discount rate. Note that reinvestment costs for equipment and software are assumed after 10 years for
each group of establishments coming into compliance in any given year. More details on the methodology
can be seen in Section 4.4.
Under the voluntary implementation assumption, costs are incurred much later and the net present
value of the total is smaller than under the regulation-mandated schedule. The net present value under the
proposed regulation is $352.9 million greater, summing costs over a twenty-year time horizon.
Annualized, the difference in NPV is $31.1 million per year. Under a voluntary scenario, there are no
regulatory impacts, and any economic impacts from UDI would be less than those under the mandatory
scenario. This is because firms would be able to implement UDI within a time frame that allows them the
flexibility to keep their costs to a minimum (i.e., upgrade printing equipment when equipment
replacement is necessary anyway, rather than when the proposed rule requires).
30 Does not include the very small number of devices that are licensed under the PHSA (also required to
come into compliance in the first year), but this number should not have a measurable effect on the overall percentage for first-year compliance developed in Section Four.

6-3
Table 6-1. Twenty-year Horizon of Annualized Costs Assuming Either Voluntary (over 15 Years) or Regulatory (Over 5 Years) Adoption of UDI
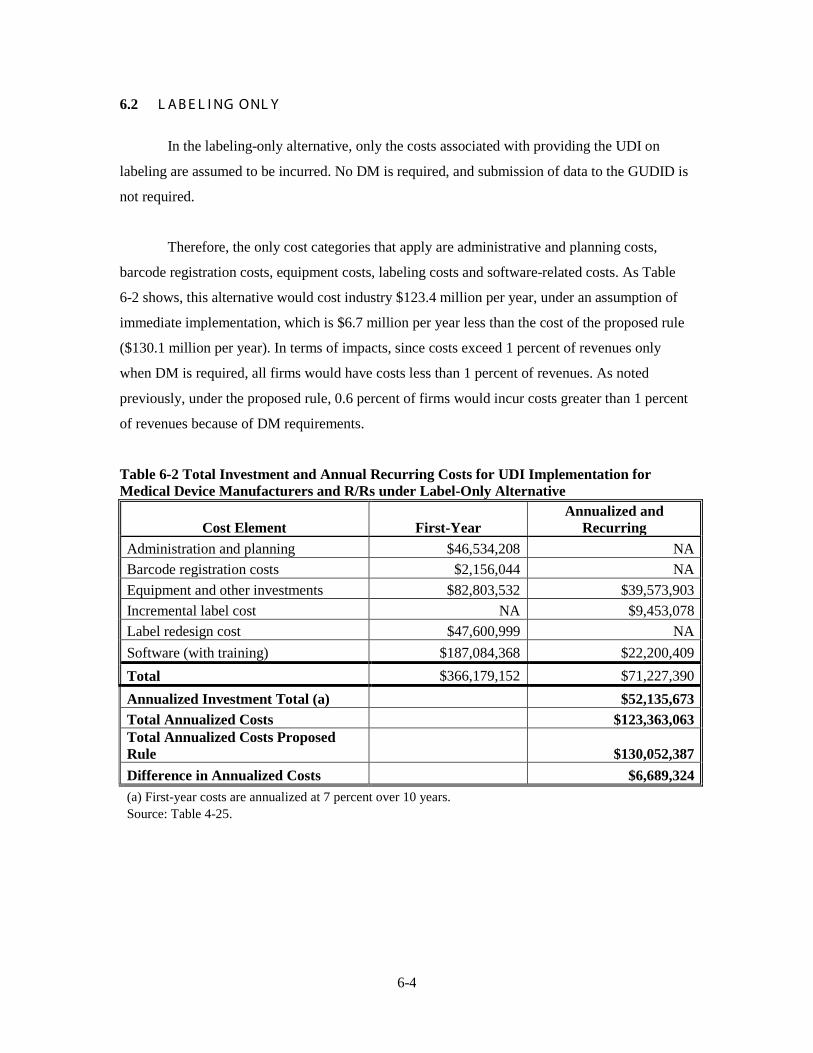
6-4
6.2 L AB E L I NG ONL Y
In the labeling-only alternative, only the costs associated with providing the UDI on
labeling are assumed to be incurred. No DM is required, and submission of data to the GUDID is
not required.
Therefore, the only cost categories that apply are administrative and planning costs,
barcode registration costs, equipment costs, labeling costs and software-related costs. As Table
6-2 shows, this alternative would cost industry $123.4 million per year, under an assumption of
immediate implementation, which is $6.7 million per year less than the cost of the proposed rule
($130.1 million per year). In terms of impacts, since costs exceed 1 percent of revenues only
when DM is required, all firms would have costs less than 1 percent of revenues. As noted
previously, under the proposed rule, 0.6 percent of firms would incur costs greater than 1 percent
of revenues because of DM requirements.
Table 6-2 Total Investment and Annual Recurring Costs for UDI Implementation for Medical Device Manufacturers and R/Rs under Label-Only Alternative
Cost Element First-Year Annualized and
Recurring Administration and planning $46,534,208 NA Barcode registration costs $2,156,044 NA Equipment and other investments $82,803,532 $39,573,903 Incremental label cost NA $9,453,078 Label redesign cost $47,600,999 NA Software (with training) $187,084,368 $22,200,409 Total $366,179,152 $71,227,390 Annualized Investment Total (a) $52,135,673 Total Annualized Costs $123,363,063 Total Annualized Costs Proposed Rule $130,052,387 Difference in Annualized Costs $6,689,324 (a) First-year costs are annualized at 7 percent over 10 years. Source: Table 4-25.

6-5
6.3 ONL Y C L ASS I I AND C L ASS I I I DE V I C E S R E QUI R E UDI
In this alternative, it is assumed that FDA requires UDI only for Class II and Class III
devices, although DM requirements for all classes of affected devices continue to be assumed.31
Establishments that label only Class II and Class III devices must be identified before cost and
impact can be estimated. Section 6.3.1 presents the methodology for identifying these
establishments. Section 6.3.2 presents the costs and impacts associated with this alternative.
6.3.1 M ethodology for I dentifying C lass I I and C lass I I I Device L abeler s
ERG used FDA’s Registration & Listing database, which provides the product codes
associated with each listed device for each establishment, and matched those product codes to
Class identifiers in FDA’s product codes database (FDA, 2010b). Those devices that were
identified as Class II and Class III devices were captured in the analysis, and counts of firms and
establishments by type (manufacturer, reprocessor, specification developer, and R/R) were
recalculated, using the same methodology outlined in Appendix A and summarized in Section
Three. ERG then assumed that the distribution by size and NAICS for both firms and facilities
would continue to be the same distributions used to estimate numbers of affected establishments
and firms for all affected entities (see Section Three for more information).
Table 6-3 presents the count of manufacturing establishments with any Class II or Class
III devices. The total number of manufacturing establishments with Class II and Class III devices
is 3,088 in comparison to the 4,901 total manufacturing establishments in FDA’s Registration &
Listing database. Table 6-4 presents the count of reprocessing and specification development
establishments that label Class II and Class III devices. As this table shows, the count of
reprocessing establishments drops from 21 to 13 and the count of specification developers drops
from 1,346 to 700. Both tables array the counts of establishments by employment size, and Table
6-3 arrays the counts also by NAICS.
Table 6-5 then presents the number of firms whose establishments initially label Class II
and Class III devices (i.e., manufacturers, reprocessors, and specification writers), distributed by
31 This alternative is assumed to require UDI only on Class II and Class III device labels;
unclassified devices are also assumed to be excluded. If unclassified devices were to be required to have a UDI on labeling under this alternative (a small percentage of all devices), the number of affected entities and costs would be a little greater.
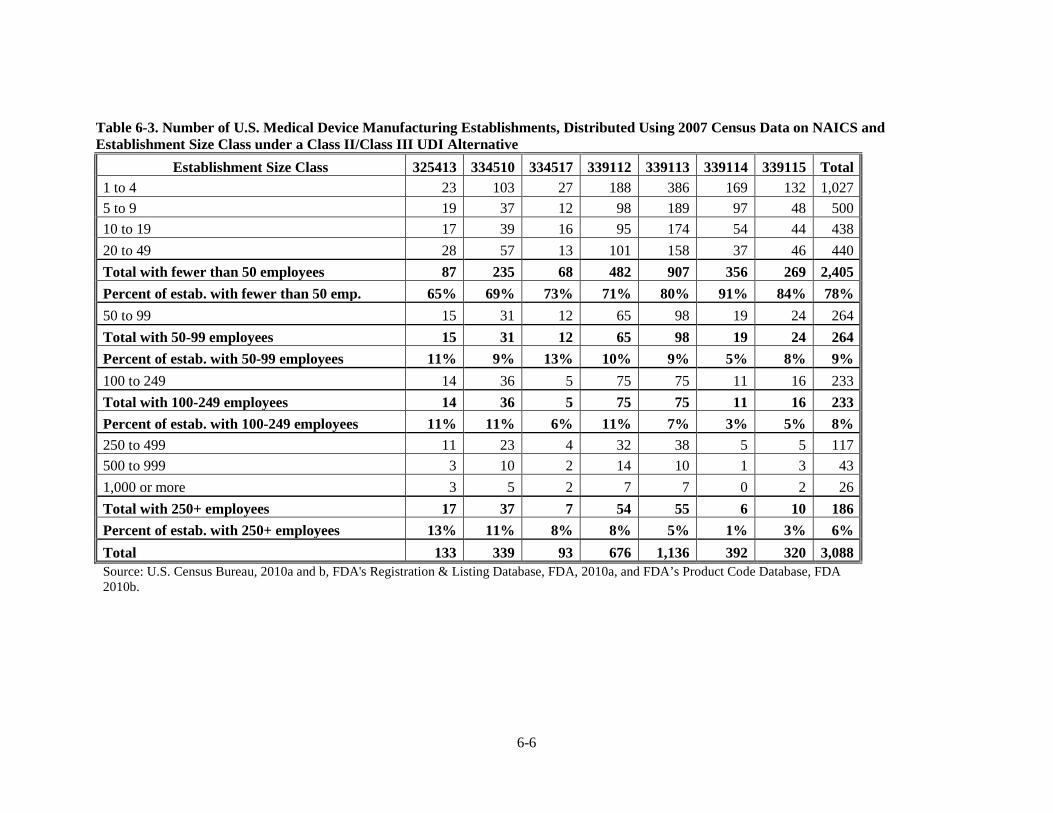
6-6
Table 6-3. Number of U.S. Medical Device Manufacturing Establishments, Distributed Using 2007 Census Data on NAICS and Establishment Size Class under a Class II/Class III UDI Alternative
Establishment Size Class 325413 334510 334517 339112 339113 339114 339115 Total 1 to 4 23 103 27 188 386 169 132 1,027 5 to 9 19 37 12 98 189 97 48 500 10 to 19 17 39 16 95 174 54 44 438 20 to 49 28 57 13 101 158 37 46 440 Total with fewer than 50 employees 87 235 68 482 907 356 269 2,405 Percent of estab. with fewer than 50 emp. 65% 69% 73% 71% 80% 91% 84% 78% 50 to 99 15 31 12 65 98 19 24 264 Total with 50-99 employees 15 31 12 65 98 19 24 264 Percent of estab. with 50-99 employees 11% 9% 13% 10% 9% 5% 8% 9% 100 to 249 14 36 5 75 75 11 16 233 Total with 100-249 employees 14 36 5 75 75 11 16 233 Percent of estab. with 100-249 employees 11% 11% 6% 11% 7% 3% 5% 8% 250 to 499 11 23 4 32 38 5 5 117 500 to 999 3 10 2 14 10 1 3 43 1,000 or more 3 5 2 7 7 0 2 26 Total with 250+ employees 17 37 7 54 55 6 10 186 Percent of estab. with 250+ employees 13% 11% 8% 8% 5% 1% 3% 6% Total 133 339 93 676 1,136 392 320 3,088 Source: U.S. Census Bureau, 2010a and b, FDA's Registration & Listing Database, FDA, 2010a, and FDA’s Product Code Database, FDA 2010b.

6-7
Table 6-4. Distribution of Reprocessors and Specification Developers (Establishments) by Size under a Class II/Class III UDI Alternative
Code Industry Code Description Total Establishments 1-4 5-9 (a) 10-19 20-49 50-99 100-
249 250-499
500-999
1000 or
more
NA Single-Use Device Reprocessors 13 0 3 0 2 2 2 4 0 0
541330 Engineering Services Estabs. 57,726 30,966 9,006 7,897 6,241 2,182 1,060 243 79 52 Percent of Total 54% 16% 14% 11% 4% 2% 0% 0% 0%
NA Specification Developers 700 376 109 96 76 26 13 3 1 1
(a) All counts of reprocessors by size remain the same as those in Table 3-8, except that ERG assumes that the reprocessors in the 5-9 employment size group are the likeliest to be currently reprocessing Class I devices. Therefore all but 3 of these reprocessors are removed from the analysis to match the total number of establishments reprocessing Class II and Class III devices. Source: U.S. Census Bureau, 2010b; FDA, 2010a, b; ERG estimates (see notes above). Distribution percentages are the same as those in Table 3-8.
Table 6-5. Count of Initial Labeling Firms by Employment Size Class under a ClassII/Class III UDI Alternative
Code Industry Code Description Total Firms 1-4 5-19 20-99 100-199
200-499
500-999 1000+
NA Single-Use Device Reprocessors 11 0 3 3 2 2 1 0
541330 Engineering Services Estabs. 46,761 27,530 12,562 5,109 664 407 160 329 Percent of Total 59% 27% 11% 1% 1% 0% 1%
NA Specification Developers 668 393 179 73 9 6 2 5 NA Total Manufacturers 2,556 877 791 526 114 88 38 122 NA All Initial Labelers 3,235 1,270 973 602 126 95 41 127 Source: FDA, 2010a,b; U.S. Census Bureau, 2010b. Eight reprocessing firms in the 5-19 employment group are assumed to label no Class II or III devices.

6-8
size. The number of initial labeling firms is reduced to 3,235 from 5,566 (before exceptions and baseline
compliance are considered). All cost calculations then proceed the same way as was presented in Section
Four, except with the reduced numbers of affected firms and establishments among the initial labelers.
ERG continues to assume that the percentages of establishments currently barcoding with variable
barcodes remain the same under this alternative. However, it is possible that establishments labeling Class
II or Class III devices might be more likely to barcode with variable barcodes than those labeling Class I
devices.
Table 6-6 presents numbers of R/R establishments arrayed by size, and Table 6-7 presents the
counts of R/R firms arrayed by size. As Table 6-6 shows, the number of R/R establishments is reduced
from 1,310 to 481, while the number of R/R firms is reduced from 1,212 to 438 (Table 6-7). These
numbers of firms and establishments are also used in exactly the same way as the counts of
establishments and firms were used to generate aggregate costs in Section Four. ERG continues to assume
that no R/Rs currently print variable barcodes on their device labels.
Table 6-6. Industry Size Distributions for R/R Establishments Based on 2007 Census Data under a Class II/Class III UDI Alternative
Type of Industry (a) Numbers of Establishments
Total 1-4 5-9 10-49 50-99 100-249 250-499 >500 Hospital Equipment & Supplies 8,578 4,856 1,365 1,779 310 177 60 31 Ophthalmic Goods 1,319 708 240 278 46 32 13 2 Total 9,897 5,564 1,605 2,057 356 209 73 33 Percent of Total - 56.2% 16.2% 20.8% 3.6% 2.1% 0.7% 0.3% Distribution 481 270 78 100 17 10 4 2
(a) The industries that are used to distribute the R/Rs identified in FDA's registration database are the Medical, Dental and Hospital Supplies Merchant Wholesalers Industry (NAICS 42345) and the Ophthalmic Goods Merchant Wholesalers Industry (NAICS 42346). Source: U.S. Census Bureau, 2010b; FDA, 2010a,b

6-9
Table 6-7. Distribution of R/R Firms by Size under a Class II/Class III UDI Alternative
Type of Industry (a) Numbers of Firms by Employment Size
Total 1-4 5-19 20-499 >500 Hospital Equipment & Supplies 7,031 4,282 1,811 795 143 Ophthalmic Goods 1,075 579 313 165 18 Total 8,106 4,861 2,124 960 161 Percent of Total - 60.0% 26.2% 11.8% 2.0% Distribution 438 263 115 52 9 (a) The industries that are used to distribute the R/R firms identified in FDA's registration database are the Medical, Dental and Hospital Supplies Merchant Wholesalers Industry (NAICS 42345) and the Ophthalmic Goods Merchant Wholesalers Industry (NAICS 42346). Source: U.S. Census Bureau, 2010b; FDA, 2010a,b, SBA, 2006.
6.3.2 C osts and I mpacts of an Alter native C over ing Only C lass I I and C lass I I I Devices
Using the establishment and firm counts discussed in Section 6.3.2, ERG computed the costs of
meeting all of the requirements as discussed in Section Four. Table 6-8 summarizes the costs by cost
category and compares these costs to the same costs presented in Section Four. Only U.S. industry costs
are compared (costs to the issuing agencies remain the same).
As Table 6-8 shows, costs for all cost items are reduced under this alternative. The total
annualized cost estimated for this alternative under an assumption of immediate implementation is $80.4
million per year, which is a $49.6 million reduction from the $130.1 million per year for industry
estimated for the proposed rule. Impacts on firms remain the same as those estimated for the proposed
rule, because this alternative does not affect the per-establishment costs, nor does it affect the need for
DM.
6.4 ONL Y C L ASS I I I DE V I C E S R E QUI R E UDI
In this alternative, it is assumed that FDA requires UDI only for Class III devices, with DM
requirements applied only to Class III devices. Establishments that label Class III devices must be
identified before costs and impacts can be estimated. Section 6.4.1presents the methodology for
identifying these establishments. Section 6.4.2 presents the costs and impacts associated with this
alternative.

6-10
Table 6-8. Aggregate Annualized Costs to All Labelers under the Class II/Class III UDI Alternative Relative to the Proposed Rule
Cost Element
Initial Labelers R/Rs Total Proposed Rule
First-Year Annualized and
Recurring First-Year Annualized
and Recurring First-Year Annualized
and Recurring First-Year Annualized and
Recurring Labeling and Database Requirements Administration and planning $26,563,707 NA $1,206,036 NA $27,769,742 NA $46,534,208 NA Barcode registration costs $354,702 NA $570,194 NA $924,896 NA $2,156,044 NA Equipment and other investments $44,060,539 $22,586,527 $4,135,788 $1,137,663 $48,196,327 $23,724,190 $82,803,532 $39,573,903 Incremental label cost and time NA $7,447,350 NA $447,218 NA $7,894,568 NA $9,453,078 Label redesign cost $26,648,398 NA $1,706,731 NA $28,355,129 NA $47,762,669 NA Software (with training) $100,180,654 $12,155,836 $4,725,272 $399,352 $104,905,926 $12,555,188 $187,084,368 $22,200,409 Recordkeeping and Reporting (GUDID) $1,625,588 $219,899 $163,780 $18,038 $1,789,367 $237,936 $3,148,757 $415,783 Total Labeling and Database Requirements $199,433,586 $42,409,611 $12,507,801 $2,002,270 $211,941,387 $44,411,882 $369,489,579 $71,643,173 Direct Marking Implants $12,038,857 $845,151 NA NA $12,038,857 $845,151 $14,091,249 $845,151 Multi-use devices $14,919,691 $1,141,787 NA NA $14,919,691 $1,141,787 $16,892,574 $1,141,787 Total Direct Marking $26,958,548 $1,986,938 NA NA $26,958,548 $1,986,938 $30,983,823 $1,986,938 Total--All Cost Items $226,392,134 $44,396,549 $12,507,801 $2,707,975 $238,899,935 $46,398,820 $400,473,402 $73,630,111 Annualized Investment Total (a) $32,233,147 $1,780,829 $34,013,976 $56,422,276 Total Annualized Costs $76,629,696 $4,488,804 $80,412,796 $130,052,387
(a) Annualized at 7 percent over 10 years. Source: Section Four and previous tables.
6-11
6.4.1 M ethodology for I dentifying C lass I I I Device L abeler s
ERG used FDA’s Registration & Listing database, which provides the product codes associated
with each listed device for each establishment, and matched those product codes to Class identifiers in
FDA’s product codes database (FDA, 2010b). Those devices that were identified as Class III devices
were captured in the analysis, and counts of establishments by type (manufacturer, reprocessor,
specification developer, and R/R) were recalculated, using the same methodology outlined in Appendix A
and summarized in Section Three. The number of firms was not identified by Class III only, so ERG
assumed that one firm operates one establishment. This assumption possibly overstates firm-level costs
estimated for the software cost component because the assumption maximizes the number of firms that
would be affected. ERG then assumed that the distribution by size and NAICS for both firms and
facilities would continue to be the same distributions used to estimate numbers of affected establishments
for all affected entities (see Section Three for more information). For this analysis, however, ERG
assumed no Class III devices are sold with UPCs, so ERG made no adjustment for UPC exceptions.
Table 6-9 presents the count of manufacturing establishments with any Class III devices. The
total number of manufacturing establishments with Class III devices is 359 in comparison to the 4,901
total manufacturing establishments in FDA’s Registration & Listing database. Table 6-10 presents the
count of reprocessing and specification development establishments that label Class III devices. As this
table shows, the count of reprocessing establishments drops from 21 to 0 and the count of specification
developers drops from 1,346 to 64, when compared with the original counts under the proposed rule. Both
tables array the counts of establishments by employment size, and Table 6-9 also arrays the counts by
NAICS.
Table 6-11 then presents the number of firms whose establishments initially label Class III
devices (i.e., manufacturers, reprocessors, and specification writers), distributed by size. The number of
initial labeling firms is reduced to 423 from 5,566 (before exceptions and baseline compliance are
considered). All cost calculations then proceed generally the same way as was presented in Section Four,
except with the reduced numbers of affected firms and establishments among the initial labelers. ERG
continues to assume that the percentages of establishments currently barcoding with variable barcodes
remain the same under this alternative. However, it is possible that establishments labeling Class III
devices might be more likely to barcode with variable barcodes than those labeling Class I or Class II
devices.

6-12
Table 6-9. Number of U.S. Medical Device Manufacturing Establishments, Distributed Using 2007 Census Data on NAICS and Establishment Size Class under a Class III UDI Alternative
Establishment Size Class 325413 334510 334517 339112 339113 339114 339115 Total 1 to 4 3 12 3 22 45 20 15 119 5 to 9 2 4 1 11 22 11 6 58 10 to 19 2 4 2 11 20 6 5 51 20 to 49 3 7 2 12 18 4 5 51 Total with fewer than 50 employees 10 27 8 56 105 41 31 280 Percent of estab. with fewer than 50 emp. 65% 69% 73% 71% 80% 91% 84% 78% 50 to 99 2 4 1 8 11 2 3 31 Total with 50-99 employees 2 4 1 8 11 2 3 31 Percent of estab. with 50-99 employees 11% 9% 13% 10% 9% 5% 8% 9% 100 to 249 2 4 1 9 9 1 2 27 Total with 100-249 employees 2 4 1 9 9 1 2 27 Percent of estab. with 100-249 employees 11% 11% 6% 11% 7% 3% 5% 8% 250 to 499 1 3 0 4 4 1 1 14 500 to 999 0 1 0 2 1 0 0 5 1,000 or more 0 1 0 1 1 0 0 3 Total with 250+ employees 2 4 1 6 6 1 1 22 Percent of estab. with 250+ employees 13% 11% 8% 8% 5% 1% 3% 6% Total 15 39 11 79 132 46 37 359 Source: U.S. Census Bureau, 2010a and b and FDA's Registration & Listing Database, 2010a.

6-13
Table 6-10. Distribution of Reprocessors and Specification Developers (Establishments) by Size under a Class III UDI Alternative
Code Industry Code Description Total
Establishments 1-4 5-9 (a) 10-19 20-49
(b) 50-99
(c) 100-
249 (d) 250-
499 (e) 500-999
1000 or
more
NA Single-Use Device Reprocessors 0 0 0 0 0 0 0 0 0 0
541330 Engineering Services Estabs. 57,726 30,966 9,006 7,897 6,241 2,182 1,060 243 79 52 Percent of Total 54% 16% 14% 11% 4% 2% 0% 0% 0%
NA Specification Developers (f) 64 34 10 9 7 2 1 0 0 0 Source: U.S. Census Bureau, 2010b; FDA, 2010a.
Table 6-11. Count of Initial Labeling Firms by Employment Size Class under a Class III UDI Alternative
Code Industry Code Description Total Firms 1-4 5-19 20-99 100-199
200-499
500-999 1000+
NA Single-Use Device Reprocessors 0 0 0 0 0 0 0 0
541330 Engineering Services Estabs. 46,761 27,530 12,562 5,109 664 407 160 329 Percent of Total 59% 27% 11% 1% 1% 0% 1%
NA Specification Developers 64 38 17 7 1 1 0 0 NA Total Manufacturers 359 123 111 74 16 12 5 17 NA All Initial Labelers 423 161 128 81 17 13 6 18
Source: FDA, 2010a,b; U.S. Census Bureau, 2010b.
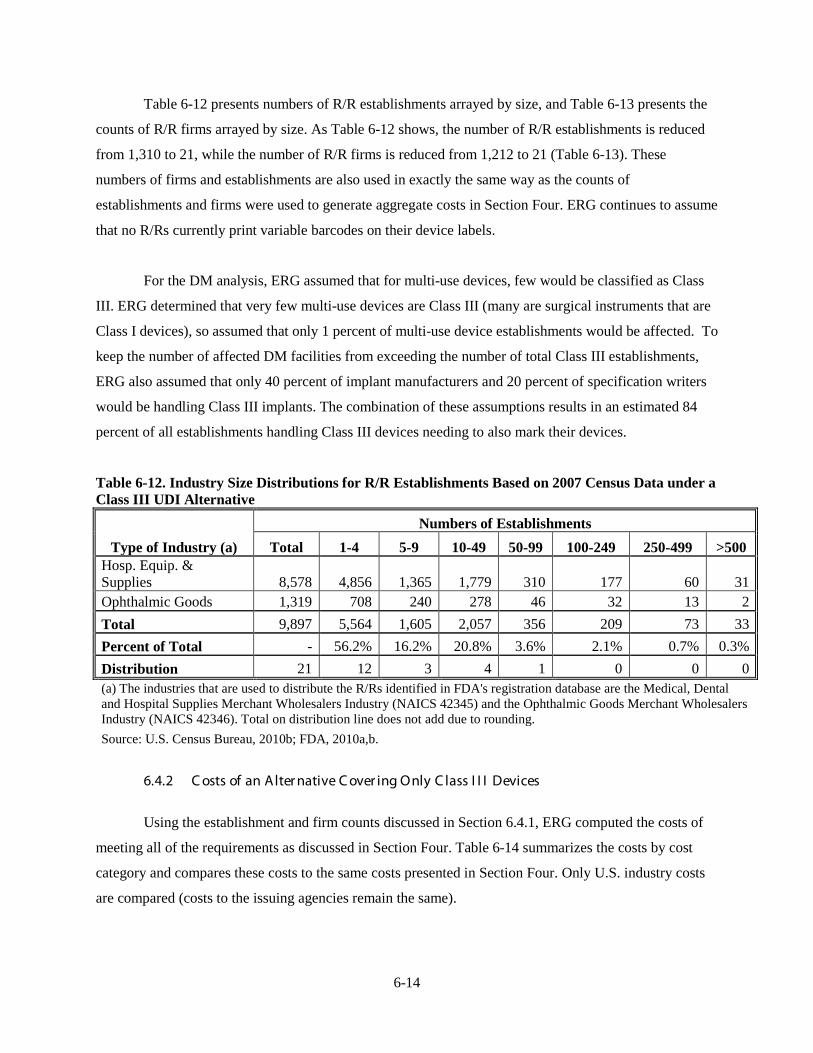
6-14
Table 6-12 presents numbers of R/R establishments arrayed by size, and Table 6-13 presents the
counts of R/R firms arrayed by size. As Table 6-12 shows, the number of R/R establishments is reduced
from 1,310 to 21, while the number of R/R firms is reduced from 1,212 to 21 (Table 6-13). These
numbers of firms and establishments are also used in exactly the same way as the counts of
establishments and firms were used to generate aggregate costs in Section Four. ERG continues to assume
that no R/Rs currently print variable barcodes on their device labels.
For the DM analysis, ERG assumed that for multi-use devices, few would be classified as Class
III. ERG determined that very few multi-use devices are Class III (many are surgical instruments that are
Class I devices), so assumed that only 1 percent of multi-use device establishments would be affected. To
keep the number of affected DM facilities from exceeding the number of total Class III establishments,
ERG also assumed that only 40 percent of implant manufacturers and 20 percent of specification writers
would be handling Class III implants. The combination of these assumptions results in an estimated 84
percent of all establishments handling Class III devices needing to also mark their devices.
Table 6-12. Industry Size Distributions for R/R Establishments Based on 2007 Census Data under a Class III UDI Alternative
Type of Industry (a) Numbers of Establishments
Total 1-4 5-9 10-49 50-99 100-249 250-499 >500 Hosp. Equip. & Supplies 8,578 4,856 1,365 1,779 310 177 60 31 Ophthalmic Goods 1,319 708 240 278 46 32 13 2 Total 9,897 5,564 1,605 2,057 356 209 73 33 Percent of Total - 56.2% 16.2% 20.8% 3.6% 2.1% 0.7% 0.3% Distribution 21 12 3 4 1 0 0 0 (a) The industries that are used to distribute the R/Rs identified in FDA's registration database are the Medical, Dental and Hospital Supplies Merchant Wholesalers Industry (NAICS 42345) and the Ophthalmic Goods Merchant Wholesalers Industry (NAICS 42346). Total on distribution line does not add due to rounding. Source: U.S. Census Bureau, 2010b; FDA, 2010a,b.
6.4.2 C osts of an Alter native C over ing Only C lass I I I Devices
Using the establishment and firm counts discussed in Section 6.4.1, ERG computed the costs of
meeting all of the requirements as discussed in Section Four. Table 6-14 summarizes the costs by cost
category and compares these costs to the same costs presented in Section Four. Only U.S. industry costs
are compared (costs to the issuing agencies remain the same).
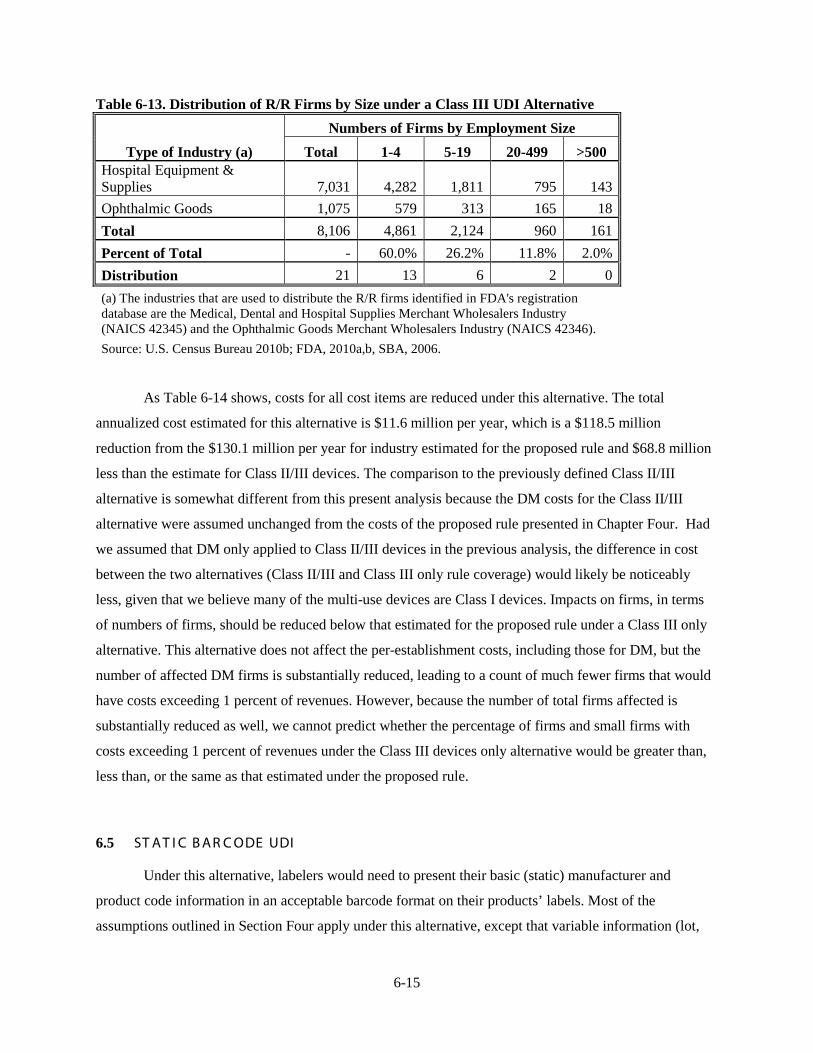
6-15
Table 6-13. Distribution of R/R Firms by Size under a Class III UDI Alternative
Type of Industry (a) Numbers of Firms by Employment Size
Total 1-4 5-19 20-499 >500 Hospital Equipment & Supplies 7,031 4,282 1,811 795 143 Ophthalmic Goods 1,075 579 313 165 18 Total 8,106 4,861 2,124 960 161 Percent of Total - 60.0% 26.2% 11.8% 2.0% Distribution 21 13 6 2 0 (a) The industries that are used to distribute the R/R firms identified in FDA's registration database are the Medical, Dental and Hospital Supplies Merchant Wholesalers Industry (NAICS 42345) and the Ophthalmic Goods Merchant Wholesalers Industry (NAICS 42346). Source: U.S. Census Bureau 2010b; FDA, 2010a,b, SBA, 2006.
As Table 6-14 shows, costs for all cost items are reduced under this alternative. The total
annualized cost estimated for this alternative is $11.6 million per year, which is a $118.5 million
reduction from the $130.1 million per year for industry estimated for the proposed rule and $68.8 million
less than the estimate for Class II/III devices. The comparison to the previously defined Class II/III
alternative is somewhat different from this present analysis because the DM costs for the Class II/III
alternative were assumed unchanged from the costs of the proposed rule presented in Chapter Four. Had
we assumed that DM only applied to Class II/III devices in the previous analysis, the difference in cost
between the two alternatives (Class II/III and Class III only rule coverage) would likely be noticeably
less, given that we believe many of the multi-use devices are Class I devices. Impacts on firms, in terms
of numbers of firms, should be reduced below that estimated for the proposed rule under a Class III only
alternative. This alternative does not affect the per-establishment costs, including those for DM, but the
number of affected DM firms is substantially reduced, leading to a count of much fewer firms that would
have costs exceeding 1 percent of revenues. However, because the number of total firms affected is
substantially reduced as well, we cannot predict whether the percentage of firms and small firms with
costs exceeding 1 percent of revenues under the Class III devices only alternative would be greater than,
less than, or the same as that estimated under the proposed rule.
6.5 ST AT I C B AR C ODE UDI
Under this alternative, labelers would need to present their basic (static) manufacturer and
product code information in an acceptable barcode format on their products’ labels. Most of the
assumptions outlined in Section Four apply under this alternative, except that variable information (lot,

6-16
Table 6-14. Aggregate Annualized Costs to All Labelers under the Class III UDI Alternative Relative to the Proposed Rule
Cost Element
Initial Labelers R/Rs Total Proposed Rule
First-Year Annualized and
Recurring First-Year
Annualized and
Recurring First-Year Annualized
and Recurring First-Year Annualized and
Recurring Labeling and Database Requirements Administration and planning $2,998,556 NA $52,654 NA $3,051,210 NA $46,534,208 NA Barcode registration costs $40,098 NA $27,338 NA $67,436 NA $2,156,044 NA Equipment and other investments $4,957,181 $2,545,197 $180,565 $49,669 $5,137,746 $2,594,866 $82,803,532 $39,573,903 Incremental label cost and time NA $598,278 NA $15,385 NA $613,663 NA $9,453,078 Label redesign cost $3,006,505 NA $74,514 NA $3,081,019 NA $47,600,999 NA Software (with training) $21,842,634 $2,538,629 $226,554 $19,147 $22,069,188 $2,557,776 $187,084,368 $22,200,409 Recordkeeping and Reporting (GUDID) $182,989 $24,786 $7,150 $788 $190,139 $25,573 $3,148,757 $415,783 Total Labeling and Database Requirements $33,027,963 $5,706,891 $568,776 $84,989 $33,596,739 $5,791,879 $369,327,910 $71,643,173 Direct Marking Implants $4,505,461 $313,955 NA NA $4,505,461 $313,955 $12,038,857 $845,151 Multi-use devices $149,197 $11,418 NA NA $149,197 $11,418 $14,919,691 $1,141,787 Total Direct Marking $4,654,658 $325,373 NA NA $4,654,658 $325,373 $26,958,548 $1,986,938 Total--All Cost Items $37,682,621 $6,032,263 $568,776 $2,707,975 $38,251,397 $6,117,252 $396,286,458 $73,630,111 Annualized Investment Total (a) $5,365,157 $80,981 $5,446,138 $56,422,276 Total Annualized Costs $11,397,421 $2,788,955 $11,563,390 $130,052,387 (a) Annualized at 7 percent over 10 years. Source: Section Four and previous tables.

6-17
batch, serial number) would not have to appear in a barcode. ERG assumes that nothing else needs to
change on the labeling (except as needed to meet the date format requirement) and that any existing
variable information can be included in the labeling.
The effects of this alternative on each of the cost categories analyzed in Section Four are
examined for initial labelers (manufacturers, reprocessors, specification developers) and R/Rs in the
sections below.
6.5.1 M anufactur er s, R epr ocessor s, and Specification Developer s
The number of establishments and the level to which they are affected will be substantially
reduced under this static barcode alternative. This section reviews the cost categories outlined in Section
Four and addresses the costs under static barcoding assumptions and how they differ from the costs under
the proposed rule.
6.5.1.1 UDI Planning C osts
Under this alternative, the only affected manufacturing establishments are those that do not
currently barcode static manufacturer and product information. ERG estimates that most larger device
labelers barcode static information (at a minimum). Those that do not barcode static information are
assumed to be primarily small establishments. ERG assumes that the AdvaMed survey results (which
indicate that two-thirds of manufacturers currently are barcoding) (AdvaMed, 2004) apply only to the
larger establishments (50 employees or more). ERG assumes that 10 percent of initial labelers in the 50 to
99 employee size group, 30 percent in the 100 to 249 size group, 60 percent in the 250-499 size group and
85 percent in the 500+ employee size group are using static and/or variable barcodes. These assumptions
result in two-thirds of establishments with more than 50 employees being estimated to use at least static
barcoding. Additionally 5 percent of all establishments with fewer than 50 employees are assumed to use
a static barcode. No reprocessors or specification developers are assumed to do static barcoding currently.
The planning and administrative costs associated with going from no barcodes to a static barcode
are expected to be substantially less than those associated going from no barcodes to a variable barcode.
The time to read and understand the rule would remain the same, but the other activities would require
less time. ERG assumes that total time needed to plan for a static barcode application would be one-half
of that for planning for a variable barcode. Table 6-15 shows the assumed per-establishment costs for the
initial labelers that currently do no barcoding and now would plan for the static barcode alternative. Even
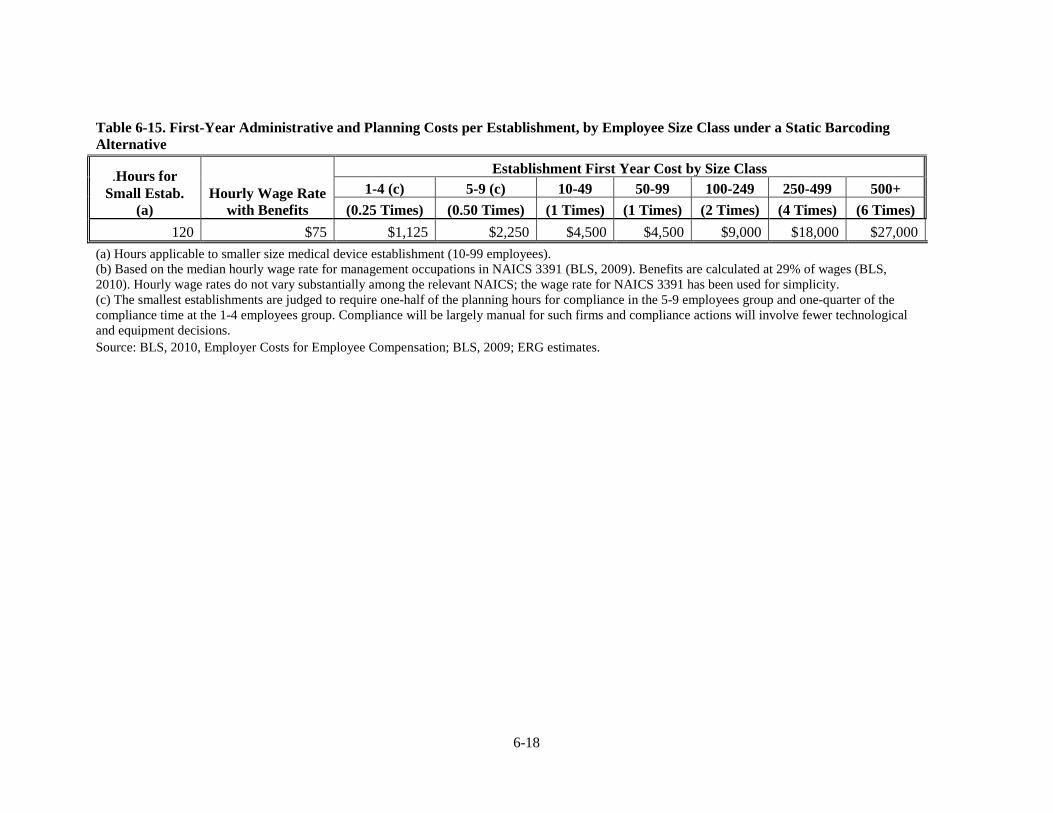
6-18
Table 6-15. First-Year Administrative and Planning Costs per Establishment, by Employee Size Class under a Static Barcoding Alternative
.Hours for Small Estab.
(a) Hourly Wage Rate
with Benefits
Establishment First Year Cost by Size Class 1-4 (c) 5-9 (c) 10-49 50-99 100-249 250-499 500+
(0.25 Times) (0.50 Times) (1 Times) (1 Times) (2 Times) (4 Times) (6 Times) 120 $75 $1,125 $2,250 $4,500 $4,500 $9,000 $18,000 $27,000
(a) Hours applicable to smaller size medical device establishment (10-99 employees). (b) Based on the median hourly wage rate for management occupations in NAICS 3391 (BLS, 2009). Benefits are calculated at 29% of wages (BLS, 2010). Hourly wage rates do not vary substantially among the relevant NAICS; the wage rate for NAICS 3391 has been used for simplicity. (c) The smallest establishments are judged to require one-half of the planning hours for compliance in the 5-9 employees group and one-quarter of the compliance time at the 1-4 employees group. Compliance will be largely manual for such firms and compliance actions will involve fewer technological and equipment decisions. Source: BLS, 2010, Employer Costs for Employee Compensation; BLS, 2009; ERG estimates.
6-19
those who are not affected by this alternative (e.g., the two-thirds of all larger establishments)
would require time to read and understand the rule. Under the static barcode alternative,
unaffected facilities are expected to need one-half the time allotted for reading and understanding
the rule than under the proposed rule, since they would only need to understand the rule up to the
point that they realize they are already in compliance. Thus, 2.5 to 30 hours are assigned for this
task, depending on the size of the facility.
The costs in Table 6-16 reflect the addition of these hours for the manufacturers expected
to be unaffected by static barcode requirements. Establishments in the smallest employment
group that are assumed to meet exceptions under this alternative remain the same as those with
exceptions under the proposed rule. The costs for this group to read and understand their
exception are assumed to be the same as those incurred under the proposed rule. These costs are
added into Table 6-16. As the table shows, planning and administrative costs under the static
barcode assumption are estimated to be $31.4 million in the first year. This is $11.8 million less
than the $43.2 million estimated for initial labelers under the proposed rule.
6.5.1.2 B ar code R egistr ation C osts
Barcode registration costs are assumed to be the same under the static barcode alternative
as under the proposed rule, since whether the barcodes are static or variable does not affect the
number of firms that must register. A total of $0.6 million is estimated as a first-year cost of
barcode registration.
6.5.1.3 E quipment C osts
Under the static barcode alternative, manufacturers with no barcodes can continue to use
their same labeling procedures, and simply add static barcodes to their existing labels. Since
variable information is not needed, a one-time change to product labels would be needed. Printing
plates can thus continue to be used. No additional equipment costs are expected, although label
redesign costs would be incurred (see below). With no equipment costs, this alternative would
result in a $71.5 million savings in initial costs and a $36.5 million savings in recurring costs for
initial labelers compared to the costs under the proposed rule (see Table 4-15).

6-20
Table 6-16. First-Year Administrative and Planning Costs per Establishment, by Employee Size Class under a Static Barcoding Alternative
Establish-ment Type
Number of Establishments, by Size Class Establishment First-Year Costs, by Size Class Aggregate
Costs 1-4 5-9 10-49 50-99 100-249
250-499 500+ Total 1-4 5-9 10-49 50-99 100-249 250-499 500+
325413 10 19 71 23 23 17 10 74 $15,567 $43,100 $608,511 $190,279 $288,780 $265,008 $104,054 $1,515,299 334510 44 37 151 49 57 36 23 397 $22,809 $4,399 $1,294,109 $402,344 $726,344 $550,168 $234,024 $3,234,197 334517 12 12 45 20 8 6 6 108 $5,947 $1,482 $386,658 $160,232 $105,221 $87,869 $57,503 $804,912 339112 81 98 311 104 119 51 34 797 $41,644 $11,719 $2,667,853 $842,246 $1,521,665 $785,351 $337,012 $6,207,490 339113 165 189 527 155 119 60 28 1,244 $85,326 $22,632 $4,518,059 $1,260,856 $1,532,383 $919,950 $277,858 $8,617,064 339114 72 97 145 30 18 7 2 370 $37,288 $11,549 $1,238,885 $241,843 $226,632 $110,605 $16,085 $1,882,887 339115 56 48 143 39 26 8 8 327 $29,165 $5,693 $1,223,903 $314,506 $334,041 $115,695 $75,712 $2,098,715 Spec. Dev. 722 210 330 51 25 6 3 1,346 $1,624,580 $944,970 $2,966,908 $457,900 $444,889 $203,978 $164,945 $6,808,170 Reproc. - 11 2 2 2 4 - 21 $0 $49,500 $18,000 $18,000 $36,000 $144,000 $0 $265,500
Total, All NAICS 1,162 721 1,725 472 396 195 113 4,784 $1,862,326 $1,095,045 $14,922,885 $3,888,206 $5,215,956 $3,182,624 $1,267,193 $31,434,235
Source: ERG estimates based on Tables 4-12 and 6-8. Note: numbers of establishments reflect the removal of numbers of labelers with exceptions to the proposed rule (i.e., ERG assumes that 70 percent of establishments in the 1-4 size class and 30 percent of the 5-9 size class meet exceptions because they manufacture custom devices). Additionally, 10 percent of the remaining manufacturers in these size groups are assumed to use UPCs only (meeting UDI requirements) and are removed from counts.
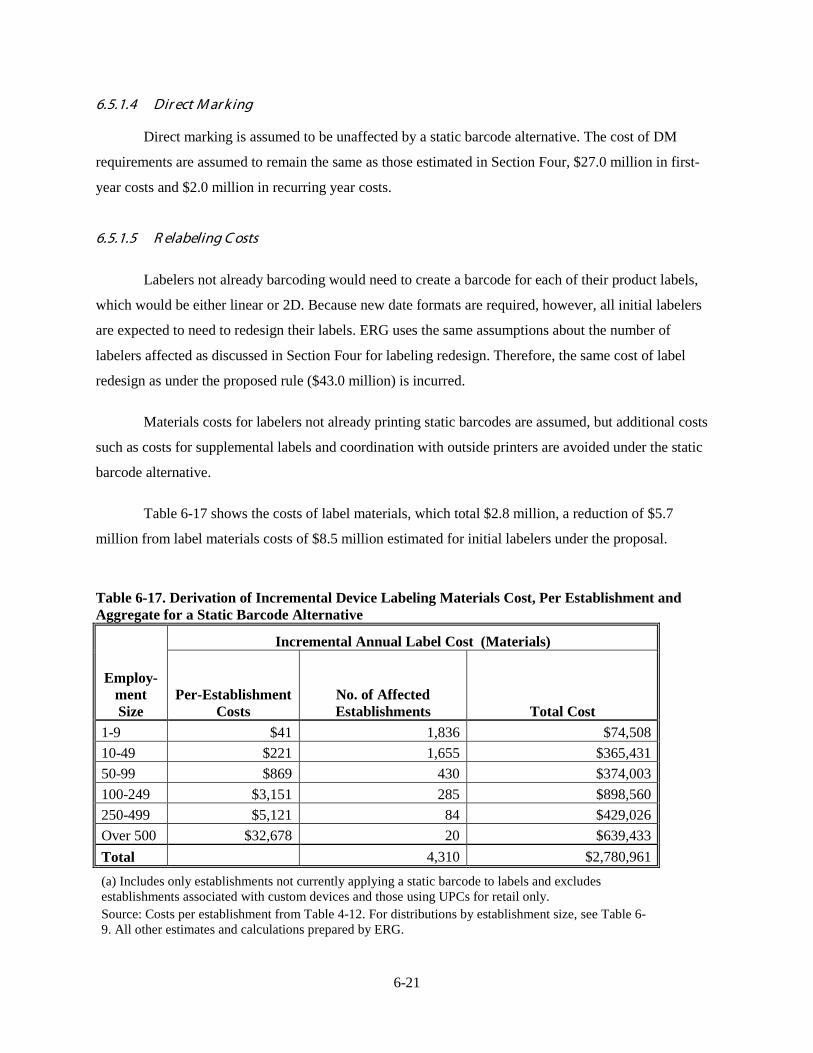
6-21
6.5.1.4 Dir ect M ar king
Direct marking is assumed to be unaffected by a static barcode alternative. The cost of DM
requirements are assumed to remain the same as those estimated in Section Four, $27.0 million in first-
year costs and $2.0 million in recurring year costs.
6.5.1.5 R elabeling C osts
Labelers not already barcoding would need to create a barcode for each of their product labels,
which would be either linear or 2D. Because new date formats are required, however, all initial labelers
are expected to need to redesign their labels. ERG uses the same assumptions about the number of
labelers affected as discussed in Section Four for labeling redesign. Therefore, the same cost of label
redesign as under the proposed rule ($43.0 million) is incurred.
Materials costs for labelers not already printing static barcodes are assumed, but additional costs
such as costs for supplemental labels and coordination with outside printers are avoided under the static
barcode alternative.
Table 6-17 shows the costs of label materials, which total $2.8 million, a reduction of $5.7
million from label materials costs of $8.5 million estimated for initial labelers under the proposal.
Table 6-17. Derivation of Incremental Device Labeling Materials Cost, Per Establishment and Aggregate for a Static Barcode Alternative
Employ-ment Size
Incremental Annual Label Cost (Materials)
Per-Establishment Costs
No. of Affected Establishments Total Cost
1-9 $41 1,836 $74,508 10-49 $221 1,655 $365,431 50-99 $869 430 $374,003 100-249 $3,151 285 $898,560 250-499 $5,121 84 $429,026 Over 500 $32,678 20 $639,433 Total 4,310 $2,780,961 (a) Includes only establishments not currently applying a static barcode to labels and excludes establishments associated with custom devices and those using UPCs for retail only. Source: Costs per establishment from Table 4-12. For distributions by establishment size, see Table 6-9. All other estimates and calculations prepared by ERG.

6-22
6.5.1.6 Softwar e I ntegr ation C osts
ERG assumes under the static barcode alternative that initial labelers without static barcodes on
their labels would be able to print those barcodes in the same way as they currently print labels.
Furthermore, static numbers can be or can replace the product numbers that are used throughout existing
software systems, such as those used to track device information internally. Because variable information
is not contained in the barcode, the firms can continue to use their current systems of tracking lot, batch or
serial numbers and no new software is required. This results in a savings of $174.0 million in first-year
costs and a $21.1 million savings in recurring costs (see Table 4-13 for costs of software integration).
6.5.1.7 G UDI D C osts
GUDID costs remain the same under the static barcode alternative as under the proposed rule and
total $2.7 million in the first year and $0.4 million in recurring years.
6.5.1.8 T otal C osts to M anufactur er s under the Static B ar code Alter native
Table 6-18 shows the total costs to initial labelers under the static barcode alternative. First year
costs are $104.6 million and recurring annual costs are $5.1 million. Annualized, these costs are about
$20.0 million per year, which is $99.9 million less per year than the costs for initial labelers estimated
under the proposed rule ($120.0 million).
Table 6-18. Total Investment and Annual Recurring Costs for UDI Implementation for Medical Device Manufacturers under a Static Barcode Alternative
Cost Element First-Year Annualized and Recurring Administration and planning $31,434,235 NA Barcode registration costs $578,246 NA Direct marking $26,958,548 $1,986,938 Equipment and other investments NA NA Incremental label materials cost NA $2,780,961 Label redesign cost 42,952,729 NA Software (with training) NA NA GUDID $2,702,704 $366,658 Total $104,626,463 $5,134,557 Annualized Investment Total (a) $14,896,455 Total Annualized Costs $20,031,012 (a) First-year costs are annualized at 7 percent over 10 years. Source: See previous tables.

6-23
6.5.2 R elabeler s/R epackager s
ERG assumes that R/Rs that currently label with static barcodes do so in the same percentages as
those assumed for initial labelers and incur the same planning costs as initial labelers under the static
barcode alternative as shown in Table 6-15. The one-time planning and administrative costs estimated
using these assumptions are $2.9 million, as shown in Table 6-19.
Barcode registration costs are assumed to remain the same as under the proposed rule and total
$1.6 million in the first year. Label redesign costs are also incurred. These redesign costs are the same as
those estimated for R/Rs under the proposed rule because the date format change is assumed to affect all
R/Rs. These costs total $4.6 million in the first year. GUDID costs of $0.4 million in the first year and
$49,000 in recurring years is also assumed to remain the same as those under the proposed rule. As for
initial labelers, no incremental equipment costs or software integration costs are assumed.
Table 6-19. Administrative and Planning Costs for R/Rs under the Static Barcode Alternative
Relabeler Size
Number of
Relabelers
Percentage Without
Static Barcodes
Number Needing Full
Planning Effort
Planning Cost
Reading Cost (a)
Total Cost
1-4 736 95% 700 $787,102 $6,904 $794,006 5-9 212 95% 202 $454,097 $1,992 $456,089 10-49 272 95% 259 $1,163,960 $2,553 $1,166,513 50-99 47 90% 42 $190,841 $884 $191,725 100-249 28 70% 19 $174,283 $1,556 $175,839 250-499 10 40% 4 $69,570 $1,087 $70,657 >500 4 15% 1 $17,690 $696 $18,387 Total 1,310 1,226 $2,857,544 $15,671 $2,873,216
(a) 2.5 hours at a fully loaded management wage of $75/hour is assumed for those in compliance to read the rule. Source: Table 4-16 and ERG estimates.
Because of changes to date formats, R/Rs, regardless of whether they currently barcode, are
assumed to need to redesign their labels. Therefore, label redesign costs remain the same under this
alternative as under the proposed rule, $4.6 million in the first year. The R/Rs that do not currently print
barcodes on their labels could incur additional label materials costs. These recurring label materials costs
are shown in Table 6-20 and total $0.2 million per year.

6-24
Table 6-20. Derivation of Incremental Device Labeling Materials Cost for R/Rs, Per Establishment and Aggregate for a Static Barcode Alternative
Employment Size
Number of Affected
Establishments
Average Per Establishment
Incremental Cost Total Incremental
Material Cost 1-9 901 $41 $36,578 10-49 259 $221 $57,163 50-99 42 $869 $36,854 100-249 19 $3,151 $61,018 250-499 4 $5,121 $19,793 500+ 1 $32,678 $21,411 Total 1,226 $232,817 Source: See Tables 4-12 and 6-12.
Using these assumptions, the total costs to R/Rs are estimated to be $9.5 million in first-year
costs, with recurring year costs of $0.3 million. Annualized, this is $1.6 million per year (see Table 6-21),
which is a reduction of $8.5 million over the proposed rule costs to R/Rs of $10.1 million per year.
Table 6-21. Total Investment and Annual Recurring Costs for UDI Implementation under a Static Barcode Alternative for R/Rs
Cost Element First-Year Annual Recurring Administration and planning $2,873,216 NA Barcode registration $1,577,798 NA Equipment and other investments NA NA Incremental label materials cost NA $232,817 Label redesign cost $4,648,270 NA Software (with training) NA NA GUDID $446,053 $49,125 Total $9,545,336 $281,942 Annualized Investment Total (a) $1,359,041 Total Annualized Costs $1,640,983 (a) First-year costs are annualized at 7 percent over 10 years. Source: See previous tables.
When the static barcode alternative costs for R/Rs are added to the static barcode alternative costs
for manufacturers, the total first year costs to all affected entities under the static barcode alternative are
estimated to be $114.2 million, with recurring costs totalling $5.4 million per year. The total annualized
cost for this alternative to all affected labelers is estimated to be $21.7 million per year. This is $108.4

6-25
million per year less that the costs estimated under the proposed rule, which total $130.1 million per year
for industry under an immediate implementation assumption (see Table 6-22).
Table 6-22. Total Investment and Annual Recurring Costs for UDI Implementation for Medical Device Manufacturers and R/Rs under Static Barcode Alternative
Cost Element First-Year Annualized and Recurring Administration and planning $34,307,451 NA Barcode registration costs $2,156,044 NA Equipment and other investments NA NA Direct marking $26,958,548 $1,986,938 Incremental label material cost NA $3,013,778 Label redesign cost $47,600,999 NA Software (with training) NA NA GUDID $3,148,757 $415,783 Total $114,171,800 $5,416,499 Annualized Investment Total (a) $16,255,496 Total Annualized Costs $21,671,995 (a) First-year costs are annualized at 7 percent over 10 years. Source: See previous tables.
6.6 C L ASS I I /I I I W I T H V AR I AB L E B AR C ODI NG AND C L ASS I W I T H ST AT I C B AR C ODI NG (G M P-E X E M PT DE V I C E S E X C L UDE D)
The next alternative that ERG investigates combines two alternatives. Under this alternative, the
Class II and Class III devices are required to have variable barcodes on their labeling, whereas Class I
devices are required only to have static barcodes. DM is still required for all devices, regardless of class
of device. In addition to requiring Class I devices to meet static barcoding requirements, this alternative
assumes a very small subset of Class I devices are exempt from all UDI requirements, but not the date
formatting requirement. Such devices are those that are exempt from Good Manufacturing Practice
(GMP) requirements. The GMP-exempt devices include items such as toothbrushes and bedpans. To
estimate the costs of this alternative, we used the costs per establishment of requiring all devices to meet
all UDI requirements, as presented in Section Four. We then used those costs along with the numbers of
establishments associated with Class I only devices or GMP-exempt devices (depending on type of cost,
e.g., equipment, software, GUDID) to compute costs savings by type of cost. When we determined all
cost savings associated with this alternative compared to the analysis in Section Four, we subtracted these
savings from the annualized $130.1 million aggregate cost reported in Section Four to estimate the cost of

6-26
the this alternative. See Section 6.5 for more information on why static barcoding results in cost savings
in many of the cost categories.
The first step was to identify the count of establishments that would incur costs savings under this
alternative. Table 6-23 shows the results of a query using FDA’s Registration & Listing database (FDA,
2010), combined with a list of procodes that FDA identified as GMP-exempt (FDA, 2012). The counts of
establishments reflect those establishments that handle only Class I devices or that handle only Class I
GMP-exempt devices. As the table shows, initial labelers meeting the Class I only definition number
2,467, of which 550 handle GMP-exempt devices only. This leaves 1,917 establishments that would need
to meet static barcoding requirements. Among repackagers/relabelers, 829 were identified as handling
Class I only devices, of which 129 handle GMP-exempt devices only. This leaves 700 establishments that
would need to meet static barcoding requirements.
ERG assumed that the size distribution of the establishments needing to meet static barcoding
requirements or that would not be required to meet any UDI requirements because they handle only
GMP-exempt devices are reflective of the size distributions used for all establishments as shown in Table
3-5 and Table 3-8. Table 6-24 distributes the count of initial labelers identified as Class I only that are
subject to static barcoding requirements and the count of initial labelers identified as GMP-exempt
establishments across the employment size groups used in the main analysis. This approximation of
numbers of establishments by size could somewhat overstate cost savings estimates because Class I only
establishments are somewhat likelier to be smaller establishments that specialize in one type of device.
However, some establishments that handle Class I devices along with other classes of device could reduce
costs on certain manufacturing lines. We are not able to perform a detailed device-by-device analysis,
however. To the extent that some costs savings might be realized by other establishments, the total cost
savings might just as easily be underestimated.
The next step, also shown in Table 6-24, is required to reduce the number of initial labeling
establishments that would realize costs savings under this alternative because they are already likely to be
excluded from meeting UDI requirements. The analysis in Section Four excluded a number of very small
establishments because, for example, they meet a custom device exclusion or their labeling contains
UPCs, which are considered to meet UDI requirements. Additionally, some establishments were assumed
in Section Four to already barcode using variable barcodes and were removed from the analysis for that
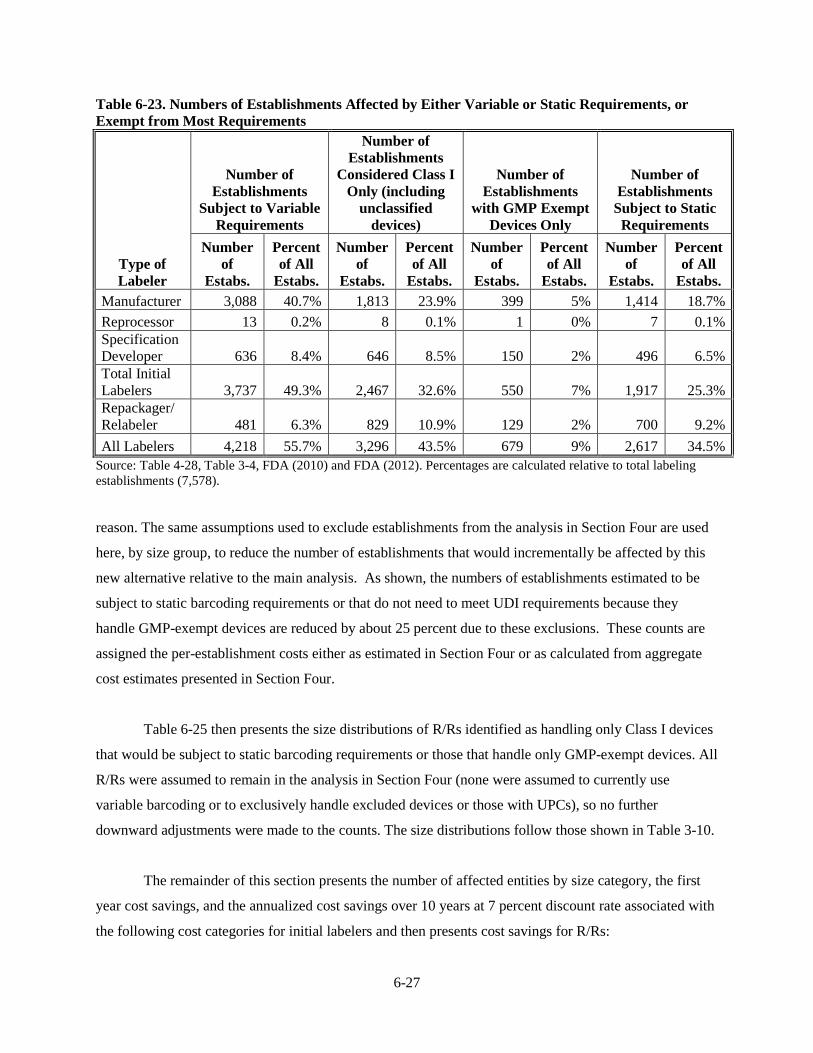
6-27
Table 6-23. Numbers of Establishments Affected by Either Variable or Static Requirements, or Exempt from Most Requirements
Type of Labeler
Number of Establishments
Subject to Variable Requirements
Number of Establishments
Considered Class I Only (including
unclassified devices)
Number of Establishments
with GMP Exempt Devices Only
Number of Establishments
Subject to Static Requirements
Number of
Estabs.
Percent of All
Estabs.
Number of
Estabs.
Percent of All
Estabs.
Number of
Estabs.
Percent of All
Estabs.
Number of
Estabs.
Percent of All
Estabs. Manufacturer 3,088 40.7% 1,813 23.9% 399 5% 1,414 18.7% Reprocessor 13 0.2% 8 0.1% 1 0% 7 0.1% Specification Developer 636 8.4% 646 8.5% 150 2% 496 6.5% Total Initial Labelers 3,737 49.3% 2,467 32.6% 550 7% 1,917 25.3% Repackager/ Relabeler 481 6.3% 829 10.9% 129 2% 700 9.2% All Labelers 4,218 55.7% 3,296 43.5% 679 9% 2,617 34.5%
Source: Table 4-28, Table 3-4, FDA (2010) and FDA (2012). Percentages are calculated relative to total labeling establishments (7,578).
reason. The same assumptions used to exclude establishments from the analysis in Section Four are used
here, by size group, to reduce the number of establishments that would incrementally be affected by this
new alternative relative to the main analysis. As shown, the numbers of establishments estimated to be
subject to static barcoding requirements or that do not need to meet UDI requirements because they
handle GMP-exempt devices are reduced by about 25 percent due to these exclusions. These counts are
assigned the per-establishment costs either as estimated in Section Four or as calculated from aggregate
cost estimates presented in Section Four.
Table 6-25 then presents the size distributions of R/Rs identified as handling only Class I devices
that would be subject to static barcoding requirements or those that handle only GMP-exempt devices. All
R/Rs were assumed to remain in the analysis in Section Four (none were assumed to currently use
variable barcoding or to exclusively handle excluded devices or those with UPCs), so no further
downward adjustments were made to the counts. The size distributions follow those shown in Table 3-10.
The remainder of this section presents the number of affected entities by size category, the first
year cost savings, and the annualized cost savings over 10 years at 7 percent discount rate associated with
the following cost categories for initial labelers and then presents cost savings for R/Rs:
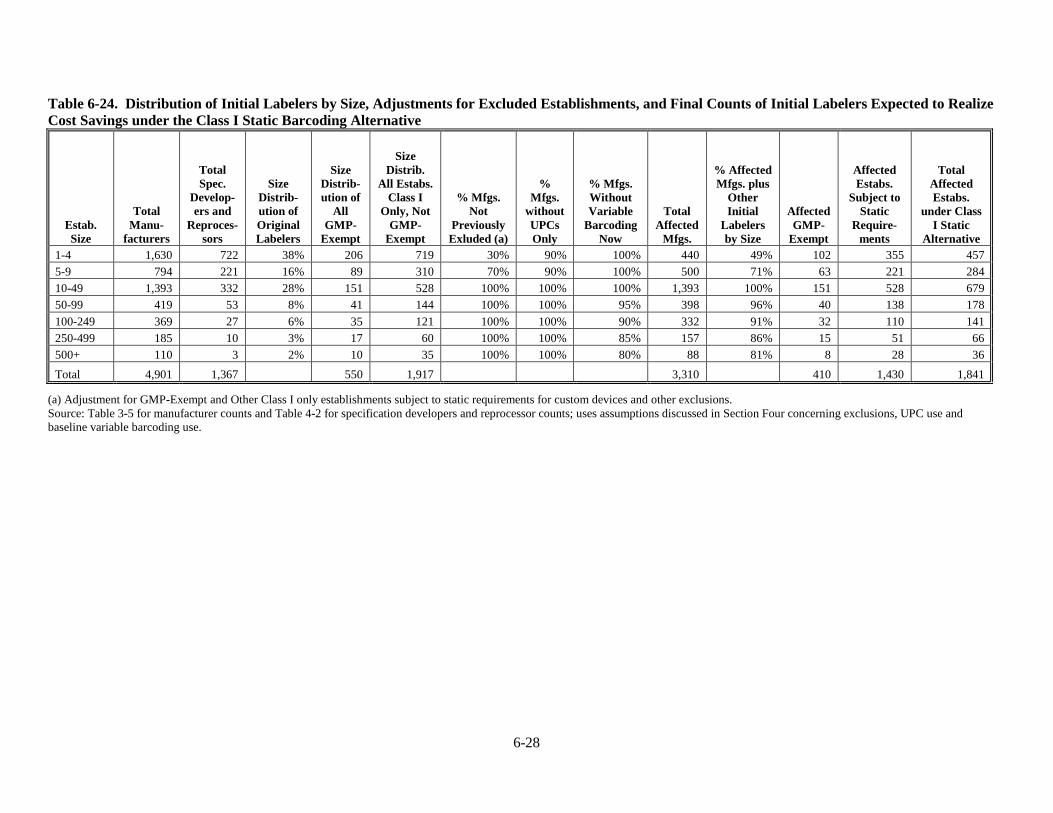
6-28
Table 6-24. Distribution of Initial Labelers by Size, Adjustments for Excluded Establishments, and Final Counts of Initial Labelers Expected to Realize Cost Savings under the Class I Static Barcoding Alternative
Estab. Size
Total Manu-
facturers
Total Spec.
Develop-ers and
Reproces-sors
Size Distrib-ution of Original Labelers
Size Distrib-ution of
All GMP-
Exempt
Size Distrib.
All Estabs. Class I
Only, Not GMP-
Exempt
% Mfgs. Not
Previously Exluded (a)
% Mfgs.
without UPCs Only
% Mfgs. Without Variable
Barcoding Now
Total Affected
Mfgs.
% Affected Mfgs. plus
Other Initial
Labelers by Size
Affected GMP-
Exempt
Affected Estabs.
Subject to Static
Require-ments
Total Affected Estabs.
under Class I Static
Alternative 1-4 1,630 722 38% 206 719 30% 90% 100% 440 49% 102 355 457 5-9 794 221 16% 89 310 70% 90% 100% 500 71% 63 221 284 10-49 1,393 332 28% 151 528 100% 100% 100% 1,393 100% 151 528 679 50-99 419 53 8% 41 144 100% 100% 95% 398 96% 40 138 178 100-249 369 27 6% 35 121 100% 100% 90% 332 91% 32 110 141 250-499 185 10 3% 17 60 100% 100% 85% 157 86% 15 51 66 500+ 110 3 2% 10 35 100% 100% 80% 88 81% 8 28 36 Total 4,901 1,367 550 1,917 3,310 410 1,430 1,841
(a) Adjustment for GMP-Exempt and Other Class I only establishments subject to static requirements for custom devices and other exclusions. Source: Table 3-5 for manufacturer counts and Table 4-2 for specification developers and reprocessor counts; uses assumptions discussed in Section Four concerning exclusions, UPC use and baseline variable barcoding use.
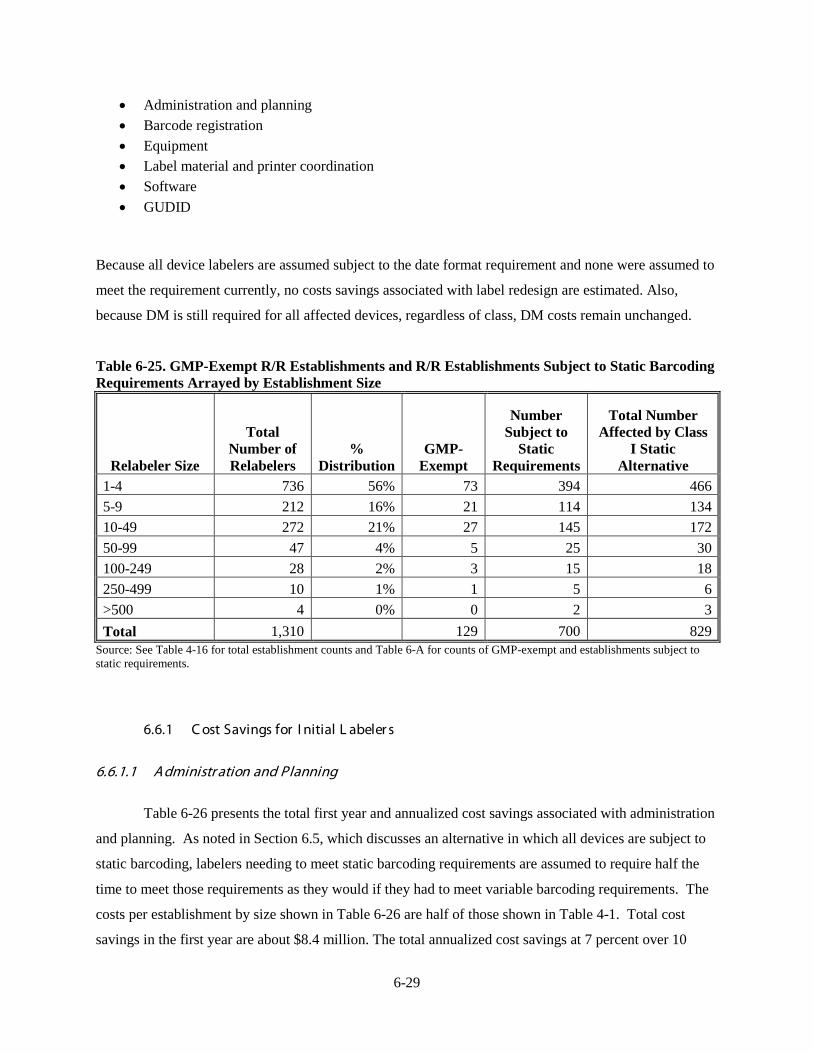
6-29
• Administration and planning • Barcode registration • Equipment • Label material and printer coordination • Software • GUDID
Because all device labelers are assumed subject to the date format requirement and none were assumed to
meet the requirement currently, no costs savings associated with label redesign are estimated. Also,
because DM is still required for all affected devices, regardless of class, DM costs remain unchanged.
Table 6-25. GMP-Exempt R/R Establishments and R/R Establishments Subject to Static Barcoding Requirements Arrayed by Establishment Size
Relabeler Size
Total Number of Relabelers
% Distribution
GMP-Exempt
Number Subject to
Static Requirements
Total Number Affected by Class
I Static Alternative
1-4 736 56% 73 394 466 5-9 212 16% 21 114 134 10-49 272 21% 27 145 172 50-99 47 4% 5 25 30 100-249 28 2% 3 15 18 250-499 10 1% 1 5 6 >500 4 0% 0 2 3 Total 1,310 129 700 829
Source: See Table 4-16 for total establishment counts and Table 6-A for counts of GMP-exempt and establishments subject to static requirements.
6.6.1 C ost Savings for I nitial L abeler s
6.6.1.1 Administr ation and Planning
Table 6-26 presents the total first year and annualized cost savings associated with administration
and planning. As noted in Section 6.5, which discusses an alternative in which all devices are subject to
static barcoding, labelers needing to meet static barcoding requirements are assumed to require half the
time to meet those requirements as they would if they had to meet variable barcoding requirements. The
costs per establishment by size shown in Table 6-26 are half of those shown in Table 4-1. Total cost
savings in the first year are about $8.4 million. The total annualized cost savings at 7 percent over 10
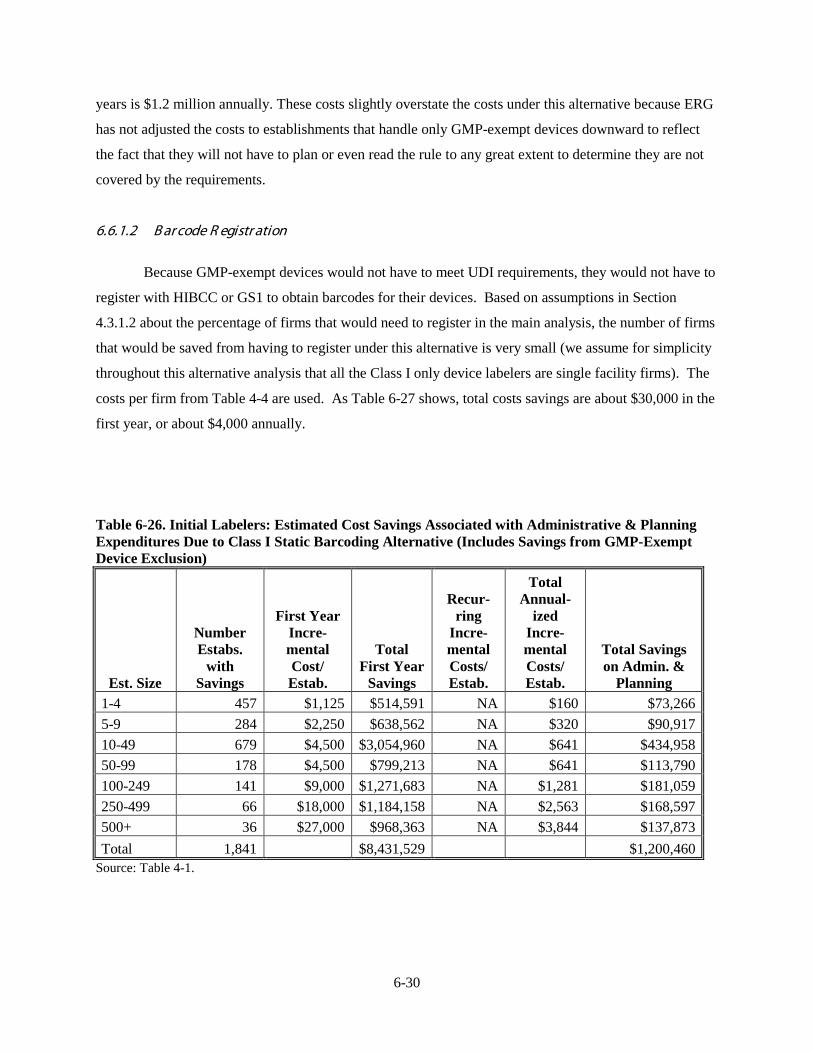
6-30
years is $1.2 million annually. These costs slightly overstate the costs under this alternative because ERG
has not adjusted the costs to establishments that handle only GMP-exempt devices downward to reflect
the fact that they will not have to plan or even read the rule to any great extent to determine they are not
covered by the requirements.
6.6.1.2 B ar code R egistr ation
Because GMP-exempt devices would not have to meet UDI requirements, they would not have to
register with HIBCC or GS1 to obtain barcodes for their devices. Based on assumptions in Section
4.3.1.2 about the percentage of firms that would need to register in the main analysis, the number of firms
that would be saved from having to register under this alternative is very small (we assume for simplicity
throughout this alternative analysis that all the Class I only device labelers are single facility firms). The
costs per firm from Table 4-4 are used. As Table 6-27 shows, total costs savings are about $30,000 in the
first year, or about $4,000 annually.
Table 6-26. Initial Labelers: Estimated Cost Savings Associated with Administrative & Planning Expenditures Due to Class I Static Barcoding Alternative (Includes Savings from GMP-Exempt Device Exclusion)
Est. Size
Number Estabs.
with Savings
First Year Incre-mental Cost/ Estab.
Total First Year
Savings
Recur- ring
Incre-mental Costs/ Estab.
Total Annual-
ized Incre-mental Costs/ Estab.
Total Savings on Admin. &
Planning 1-4 457 $1,125 $514,591 NA $160 $73,266 5-9 284 $2,250 $638,562 NA $320 $90,917 10-49 679 $4,500 $3,054,960 NA $641 $434,958 50-99 178 $4,500 $799,213 NA $641 $113,790 100-249 141 $9,000 $1,271,683 NA $1,281 $181,059 250-499 66 $18,000 $1,184,158 NA $2,563 $168,597 500+ 36 $27,000 $968,363 NA $3,844 $137,873 Total 1,841 $8,431,529 $1,200,460
Source: Table 4-1.

6-31
Table 6-27. Initial Labelers: Estimated Cost Savings Associated with Barcode Registration under the Class I Static Barcoding Alternative
Est. Size
Number GMP-
Exempt
% Assumed
to Be Registered
Number Assumed without
Registration
Cost of Registra-
tion
Total First Year Cost
Savings
Annualized Cost Savings
for Registration
1-4 102 85% 15 $500 $7,648 $1,089 5-9 63 85% 9 $500 $4,745 $676 10-49 151 90% 15 $500 $7,568 $1,077 50-99 40 95% 2 $500 $990 $141 100-249 32 95% 2 $4,000 $6,300 $897 250-499 15 95% 1 $4,000 $2,933 $418 500+ 8 99% 0 NA $0 $0 Total 410 44 $30,185 $4,298
Source: Table 4-4 and Section 4.1.3.2. 6.6.1.3 E quipment
Static barcodes do not require the digital printing equipment needed to meet variable barcoding
requirements. Thus all Class I only establishments would save the costs of purchasing, installing and
operating digital printing equipment. The costs per establishment are averaged using the facility counts
and total capital costs and labor costs that are presented in Table 4-7 and used with the numbers of Class I
only establishments expected to need to meet static barcoding requirements or that handle GMP-exempt
devices only. Table 6-28 shows that the cost savings are $28.2 million in the first year and $14.4 million
in recurring years. Annualized, this is $18.4 million a year in costs savings. Table 6-28. Initial Labelers: Estimated Cost Savings Associated with Equipment Expenditures under the Class I Static Barcoding Alternative (Includes Savings from GMP-Exempt Device Exclusion)
Est. Size
Number Estabs.
with Savings
First Year Incre-mental
Cost/ Estab.
Total First Year
Savings
Recurring Incremental Costs/ Estab.
Total Recurring
Costs
Total Annualized Incremental Costs/ Estab.
Total Savings on Equipment
1-4 457 $414 $189,369 $41 $18,937 $100 $45,899 5-9 284 $414 $117,495 $41 $11,750 $100 $28,478 10-49 679 $23,341 $15,845,693 $9,281 $6,300,616 $12,604 $8,556,686 50-99 178 $23,341 $4,145,417 $9,281 $1,648,314 $12,604 $2,238,528 100-249 141 $24,236 $3,424,466 $16,317 $2,305,587 $19,768 $2,793,154 250-499 66 $41,641 $2,739,435 $36,583 $2,406,640 $42,511 $2,796,674 500+ 36 $47,266 $1,695,199 $46,407 $1,664,415 $53,137 $1,905,773
Total 1,841 $28,157,075 $14,356,25
8 $18,365,192 Source: Averages taken from Table 4-7.
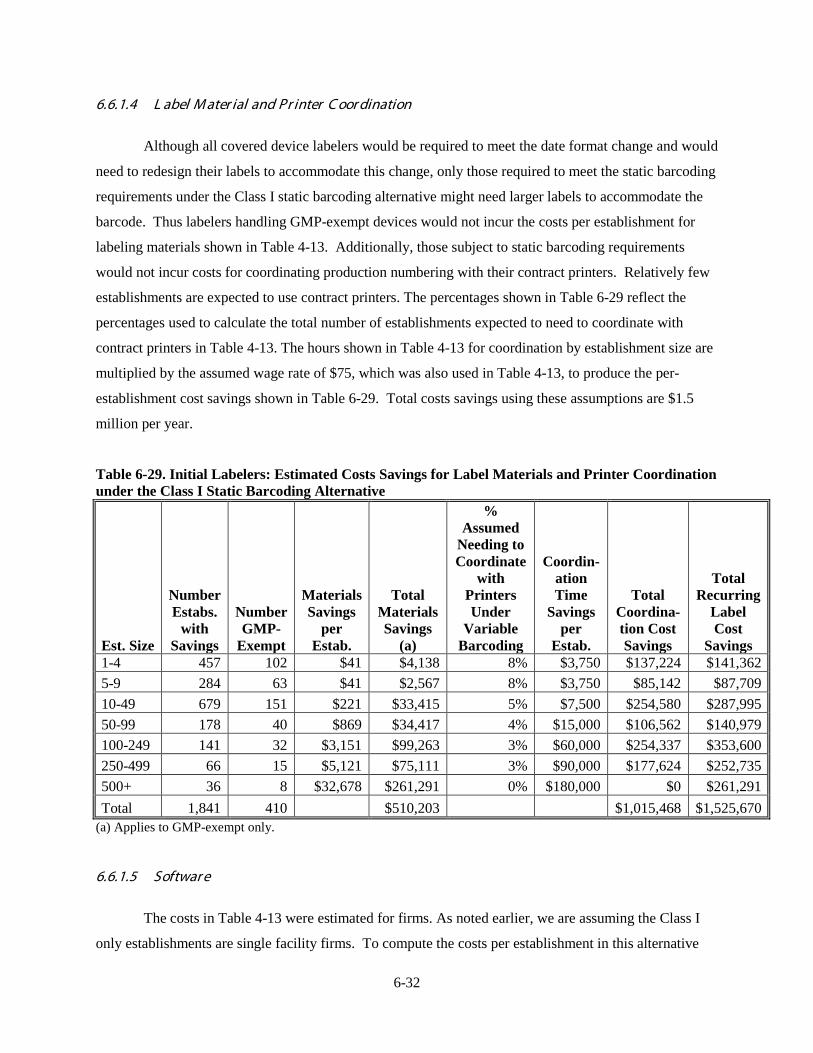
6-32
6.6.1.4 L abel M ater ial and Pr inter C oor dination
Although all covered device labelers would be required to meet the date format change and would
need to redesign their labels to accommodate this change, only those required to meet the static barcoding
requirements under the Class I static barcoding alternative might need larger labels to accommodate the
barcode. Thus labelers handling GMP-exempt devices would not incur the costs per establishment for
labeling materials shown in Table 4-13. Additionally, those subject to static barcoding requirements
would not incur costs for coordinating production numbering with their contract printers. Relatively few
establishments are expected to use contract printers. The percentages shown in Table 6-29 reflect the
percentages used to calculate the total number of establishments expected to need to coordinate with
contract printers in Table 4-13. The hours shown in Table 4-13 for coordination by establishment size are
multiplied by the assumed wage rate of $75, which was also used in Table 4-13, to produce the per-
establishment cost savings shown in Table 6-29. Total costs savings using these assumptions are $1.5
million per year.
Table 6-29. Initial Labelers: Estimated Costs Savings for Label Materials and Printer Coordination under the Class I Static Barcoding Alternative
Est. Size
Number Estabs.
with Savings
Number GMP-
Exempt
Materials Savings
per Estab.
Total Materials Savings
(a)
% Assumed
Needing to Coordinate
with Printers Under
Variable Barcoding
Coordin-ation Time
Savings per
Estab.
Total Coordina-tion Cost Savings
Total Recurring
Label Cost
Savings 1-4 457 102 $41 $4,138 8% $3,750 $137,224 $141,362 5-9 284 63 $41 $2,567 8% $3,750 $85,142 $87,709 10-49 679 151 $221 $33,415 5% $7,500 $254,580 $287,995 50-99 178 40 $869 $34,417 4% $15,000 $106,562 $140,979 100-249 141 32 $3,151 $99,263 3% $60,000 $254,337 $353,600 250-499 66 15 $5,121 $75,111 3% $90,000 $177,624 $252,735 500+ 36 8 $32,678 $261,291 0% $180,000 $0 $261,291 Total 1,841 410 $510,203 $1,015,468 $1,525,670
(a) Applies to GMP-exempt only.
6.6.1.5 Softwar e
The costs in Table 4-13 were estimated for firms. As noted earlier, we are assuming the Class I
only establishments are single facility firms. To compute the costs per establishment in this alternative

6-33
analysis, we used the first year aggregate costs by size shown in Table 4-13 and divided them by the
original count of firms, also shown in Table 4-13 (this somewhat understates cost savings at the larger
establishment sizes). Recurring year costs per establishment were also computed the same way, so they
are somewhat lower than the average cost per firm shown in Table 4-13. The costs for firms in the 1-4
employees size group are assigned to establishments in the 1-4 employees size group.
ERG assigned costs in the following way:
• The costs for firms in the 5-19 employees size group are assigned to establishments in the 5-9
employees size group.
• The costs for firms in the 20-99 employees size group are assigned to the establishments in the 10-49 and the 50-99 employees size group.
• The costs for firms in the 100-199 employees size group are assigned to the establishments in the
100-249 employees size group.
• The costs for firms in the 200-499 employees size group are assigned to the 250-499 employees size group.
• The costs for firms in the 499-999 employees size group are assigned to establishments in the
500+ employees size group. No establishments were assigned the costs of the largest firms.
Table 6-30 shows the results of these assumptions. First year costs savings are estimated to be
$52.4 million and recurring cost savings are expected to be about $7.2 million. Annualized, this is $14.6
million per year.
6.6.1.6 G UDI D
Establishments handling only GMP-exempt devices would not have to submit information to the
GUDID. Thus those establishments would save both the set up costs and recurring costs of submitting
data. Table 6-31 shows the costs per establishment for both first year and recurring year activities, which
were presented in Table 4-15. As Table 6-31 shows, the first year costs savings are about $229,000, and
recurring year cost savings are about $31,000, for an annualized cost of about $63,000 per year.
6.6.1.7 T otal C ost Savings for I nitial L abeler s
Table 6-32 shows the total annualized cost savings for initial labelers. These cost savings total
$35.8 million per year.

6-34
Table 6-30. Initial Labelers: Estimated Cost Savings Associated with Software Expenditures under the Class I Static Barcoding Alternative (Includes Savings from GMP-Exempt Device Exclusion) (a)
Est. Size
Number Estabs.
with Savings
First Year Incre-mental Cost/ Estab.
Total First Year
Savings
Recur- ring
Incre-mental Costs/ Estab.
Total Recurring
Costs
Total Annual-
ized Incre-mental Costs/ Estab.
Total Savings on Software
1-4 457 $900 $411,673 $61 $27,902 $189 $86,515 5-9 284 $10,500 $2,979,956 $1,700 $482,469 $3,195 $906,748 10-49 679 $25,966 $17,627,488 $3,991 $2,709,410 $7,688 $5,219,168 50-99 178 $25,966 $4,611,555 $3,991 $708,813 $7,688 $1,365,395 100-249 141 $62,229 $8,792,774 $8,290 $1,171,406 $17,150 $2,423,299 250-499 66 $114,731 $7,547,780 $14,689 $966,314 $31,024 $2,040,949 500+ 36 $291,715 $10,462,423 $30,365 $1,089,043 $71,898 $2,578,657 Total 1,841 $52,433,649 $7,155,358 $14,620,730
Source: Table 4-13. Note that these costs were estimated for firms. It is assumed that most Class I Only establishments are single-facility firms, so these employment sizes also approximate the size of the firm.
Table 6-31. Initial Labelers: Estimated Costs Savings Associated with GUDID under the Class I Static Barcoding Alternative
Est. Size
Number GMP-
Exempt
First Year Cost per
Estab.
Total First Year
Cost Savings
Recurring Year Cost per Estab.
Total Recurring Year Cost
Savings
Annual-ized Cost per
Estab.
Total Annualized
Cost Savings
1-4 102 $450 $45,890 $75 $7,648 $139 $14,182 5-9 63 $450 $28,473 $75 $4,745 $139 $8,799 10-49 151 $750 $113,514 $75 $11,351 $182 $27,513 50-99 40 $438 $17,323 $75 $2,970 $137 $5,436 100-249 32 $438 $13,782 $75 $2,363 $137 $4,325 250-499 15 $438 $6,417 $75 $1,100 $137 $2,014 500+ 8 $438 $3,498 $75 $600 $137 $1,098 Total 410 $228,896 $30,777 $63,367
Source: Table 4-14.
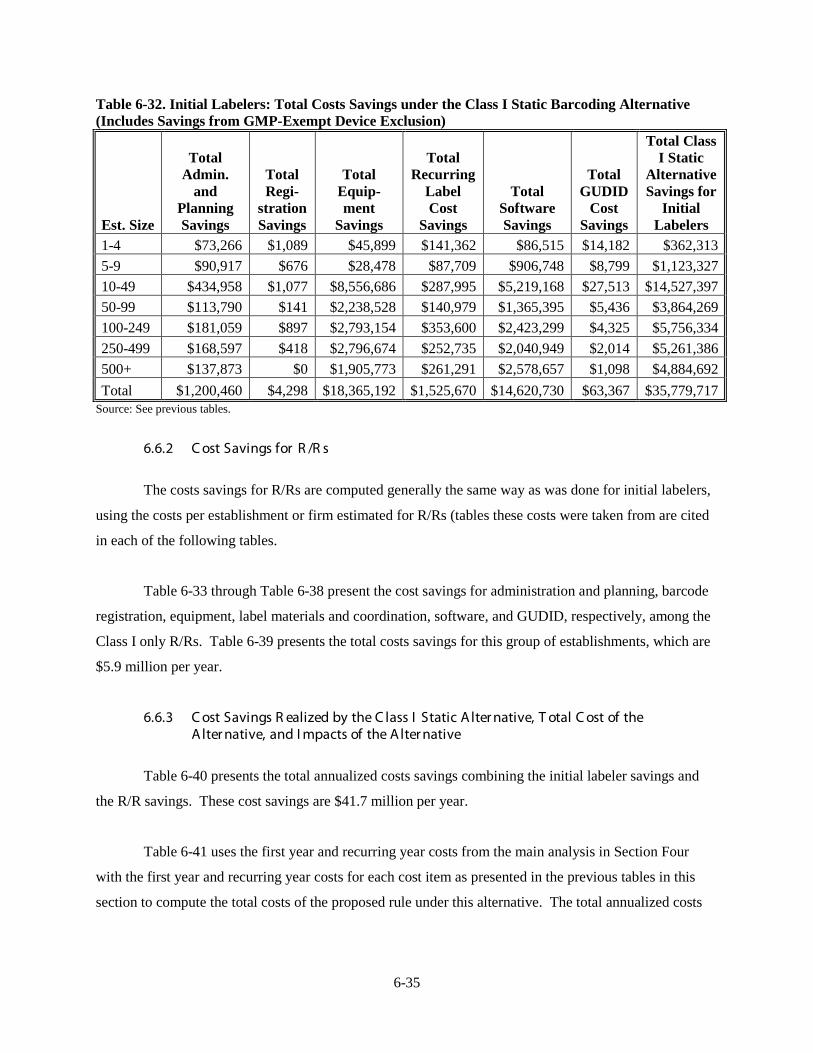
6-35
Table 6-32. Initial Labelers: Total Costs Savings under the Class I Static Barcoding Alternative (Includes Savings from GMP-Exempt Device Exclusion)
Est. Size
Total Admin.
and Planning Savings
Total Regi-
stration Savings
Total Equip-ment
Savings
Total Recurring
Label Cost
Savings
Total Software Savings
Total GUDID
Cost Savings
Total Class I Static
Alternative Savings for
Initial Labelers
1-4 $73,266 $1,089 $45,899 $141,362 $86,515 $14,182 $362,313 5-9 $90,917 $676 $28,478 $87,709 $906,748 $8,799 $1,123,327 10-49 $434,958 $1,077 $8,556,686 $287,995 $5,219,168 $27,513 $14,527,397 50-99 $113,790 $141 $2,238,528 $140,979 $1,365,395 $5,436 $3,864,269 100-249 $181,059 $897 $2,793,154 $353,600 $2,423,299 $4,325 $5,756,334 250-499 $168,597 $418 $2,796,674 $252,735 $2,040,949 $2,014 $5,261,386 500+ $137,873 $0 $1,905,773 $261,291 $2,578,657 $1,098 $4,884,692 Total $1,200,460 $4,298 $18,365,192 $1,525,670 $14,620,730 $63,367 $35,779,717
Source: See previous tables.
6.6.2 C ost Savings for R /R s
The costs savings for R/Rs are computed generally the same way as was done for initial labelers,
using the costs per establishment or firm estimated for R/Rs (tables these costs were taken from are cited
in each of the following tables.
Table 6-33 through Table 6-38 present the cost savings for administration and planning, barcode
registration, equipment, label materials and coordination, software, and GUDID, respectively, among the
Class I only R/Rs. Table 6-39 presents the total costs savings for this group of establishments, which are
$5.9 million per year.
6.6.3 C ost Savings R ealized by the C lass I Static A lter native, T otal C ost of the Alter native, and I mpacts of the Alter native
Table 6-40 presents the total annualized costs savings combining the initial labeler savings and
the R/R savings. These cost savings are $41.7 million per year.
Table 6-41 uses the first year and recurring year costs from the main analysis in Section Four
with the first year and recurring year costs for each cost item as presented in the previous tables in this
section to compute the total costs of the proposed rule under this alternative. The total annualized costs

6-36
estimated are $88.4 million per year, which reflects the total $41.7 million cost savings per year over the
$130.1 million per year estimated in Section Four.
Table 6-33. Repackagers/Relabelers: Estimated Cost Savings Associated with Administrative & Planning Expenditures under the Class I Static Barcoding Alternative (Includes Savings from GMP-Exempt Device Exclusion)
Est. Size
Number Estabs.
with Savings
First Year Incre-mental Cost/ Estab.
Total First Year Savings
Recur- ring
Incre-mental Costs/ Estab.
Total Annual-
ized Incre-mental Costs/ Estab.
Total Savings on Admin. & Planning
1-4 466 $563 $262,156 NA $80 $37,325 5-9 134 $1,125 $151,244 NA $160 $21,534 10-49 172 $2,250 $387,675 NA $320 $55,196 50-99 30 $2,250 $67,094 NA $320 $9,553 100-249 18 $4,500 $78,779 NA $641 $11,216 250-499 6 $9,000 $55,032 NA $1,281 $7,835 500+ 3 $13,500 $37,316 NA $1,922 $5,313 Total 829 $1,039,297 $147,972
Source: From Table 4-16.
Table 6-34. Repackagers/Relabers: Estimated Cost Savings Associated with Barcode Registration under the Class I Static Barcoding Alternative
Est. Size Number GMP-
Exempt Cost of
Registration Total First Year
Cost Savings Annualized Cost
Savings for Registration 1-4 73 $500 $36,261 $5,163 5-9 21 $500 $10,460 $1,489 10-49 27 $500 $13,406 $1,909 50-99 5 $500 $2,320 $330 100-249 3 $4,000 $10,897 $1,551 250-499 1 $4,000 $3,806 $542 500+ 0 NA $0 $0 Total 129 $77,150 $10,984
Source: Table 4-18.
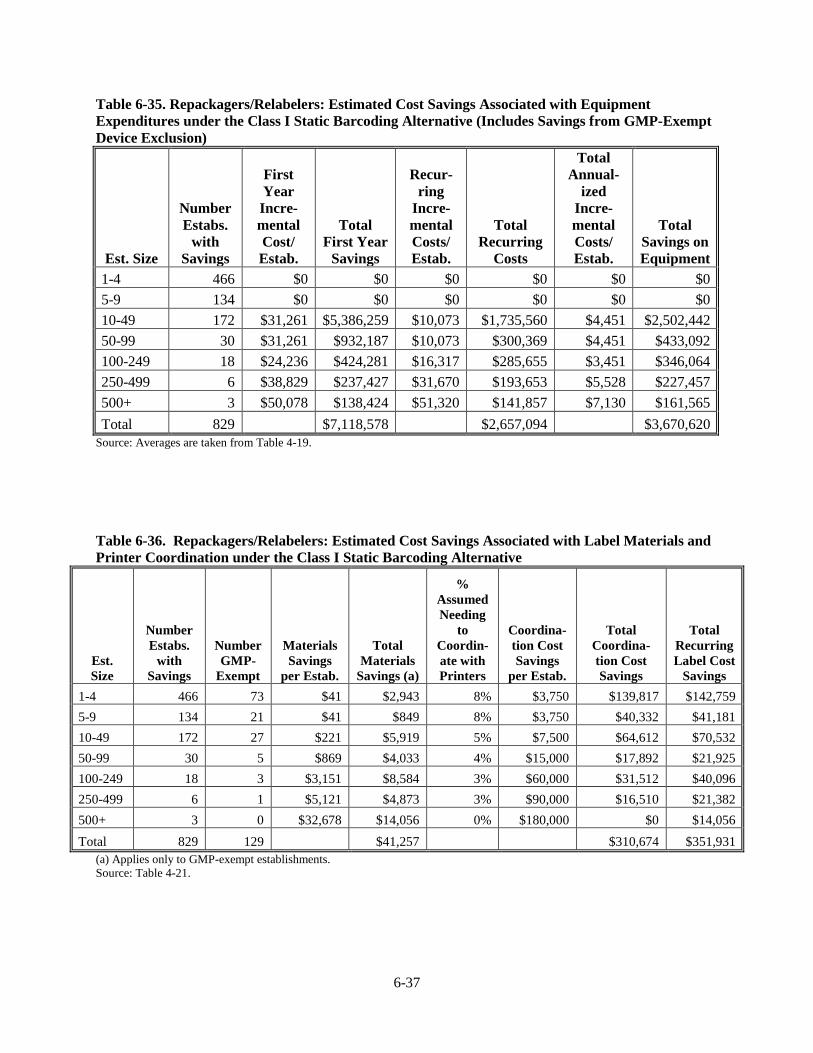
6-37
Table 6-35. Repackagers/Relabelers: Estimated Cost Savings Associated with Equipment Expenditures under the Class I Static Barcoding Alternative (Includes Savings from GMP-Exempt Device Exclusion)
Est. Size
Number Estabs.
with Savings
First Year Incre-mental Cost/ Estab.
Total First Year
Savings
Recur- ring
Incre-mental Costs/ Estab.
Total Recurring
Costs
Total Annual-
ized Incre-mental Costs/ Estab.
Total Savings on Equipment
1-4 466 $0 $0 $0 $0 $0 $0 5-9 134 $0 $0 $0 $0 $0 $0 10-49 172 $31,261 $5,386,259 $10,073 $1,735,560 $4,451 $2,502,442 50-99 30 $31,261 $932,187 $10,073 $300,369 $4,451 $433,092 100-249 18 $24,236 $424,281 $16,317 $285,655 $3,451 $346,064 250-499 6 $38,829 $237,427 $31,670 $193,653 $5,528 $227,457 500+ 3 $50,078 $138,424 $51,320 $141,857 $7,130 $161,565 Total 829 $7,118,578 $2,657,094 $3,670,620
Source: Averages are taken from Table 4-19.
Table 6-36. Repackagers/Relabelers: Estimated Cost Savings Associated with Label Materials and Printer Coordination under the Class I Static Barcoding Alternative
Est. Size
Number Estabs.
with Savings
Number GMP-
Exempt
Materials Savings
per Estab.
Total Materials
Savings (a)
% Assumed Needing
to Coordin-ate with Printers
Coordina-tion Cost Savings
per Estab.
Total Coordina-tion Cost Savings
Total Recurring Label Cost
Savings 1-4 466 73 $41 $2,943 8% $3,750 $139,817 $142,759 5-9 134 21 $41 $849 8% $3,750 $40,332 $41,181 10-49 172 27 $221 $5,919 5% $7,500 $64,612 $70,532 50-99 30 5 $869 $4,033 4% $15,000 $17,892 $21,925 100-249 18 3 $3,151 $8,584 3% $60,000 $31,512 $40,096 250-499 6 1 $5,121 $4,873 3% $90,000 $16,510 $21,382 500+ 3 0 $32,678 $14,056 0% $180,000 $0 $14,056 Total 829 129 $41,257 $310,674 $351,931
(a) Applies only to GMP-exempt establishments. Source: Table 4-21.

6-38
Table 6-37. Repackagers/Relabelers: Estimated Cost Savings Associated with Software Expenditures under the Class I Static Barcoding Alternative (Includes Savings from GMP-Exempt Device Exclusion)
Est. Size
Number Estabs.
with Savings
First Year Incre-mental Cost/ Estab.
Total First Year
Savings
Recur- ring
Incre-mental Costs/ Estab.
Total Recurring
Costs
Total Annual-
ized Incre-mental Costs/ Estab.
Total Savings
on Software
1-4 466 $900 $419,450 $61 $28,429 $189 $88,150 5-9 134 $10,500 $1,411,612 $1,700 $228,547 $3,195 $429,528 10-49 172 $10,500 $1,809,150 $1,700 $292,910 $3,195 $550,492 50-99 30 $27,000 $805,128 $4,150 $123,751 $7,994 $238,383 100-249 18 $27,000 $472,673 $4,150 $72,652 $7,994 $139,950 250-499 6 $76,000 $464,716 $10,125 $61,911 $20,946 $128,076 500+ 3 $190,000 $525,192 $24,325 $67,238 $51,377 $142,014 Total 829 $5,907,921 $875,438 $1,716,593
Source: Table 4-13. Note that these costs were estimated for firms. It is assumed that most Class I Only establishments are single-facility firms, so these employment sizes also approximate the size of the firm.
Table 6-38. Repackagers/Relabelers: Estimated Costs Savings Associated with GUDID under the Class I Static Barcoding Alternative
Est. Size
Number GMP-
Exempt
First Year
Cost per Estab.
Total First Year Cost
Savings
Recurring Year Cost per Estab.
Total Recurring Year Cost
Savings
Annual-ized Cost
per Estab.
Total Annualized
Cost Savings 1-4 73 $300 $21,757 $38 $2,720 $80 $5,817 5-9 21 $300 $6,276 $38 $784 $80 $1,678 10-49 27 $450 $12,065 $38 $1,005 $102 $2,723 50-99 5 $438 $2,030 $38 $174 $100 $463 100-249 3 $438 $1,192 $38 $102 $100 $272 250-499 1 $438 $416 $38 $36 $100 $95 500+ 0 $438 $188 $38 $16 $100 $43 Total 129 $43,924 $4,838 $11,091
Source: Table 4-23.

6-39
Table 6-39. Repackagers/Relablers: Total Estimated Cost Savings under the Class I Static Barcoding Alternative (Includes Savings from GMP-Exempt Exclusion)
Est. Size
Total Admin.
and Planning Savings
Total Regi-
stration Savings
Total Equipment
Savings
Total Recurring
Label Cost
Saving
Total Software Savings
GUDID Cost
Savings
Total Class I Static
Alternative Savings for
Initial Labelers
1-4 $37,325 $5,163 $0 $142,759 $88,150 $5,817 $279,214 5-9 $21,534 $1,489 $0 $41,181 $429,528 $1,678 $495,410 10-49 $55,196 $1,909 $2,502,442 $70,532 $550,492 $2,723 $3,183,295 50-99 $9,553 $330 $433,092 $21,925 $238,383 $463 $703,746 100-249 $11,216 $1,551 $346,064 $40,096 $139,950 $272 $539,148 250-499 $7,835 $542 $227,457 $21,382 $128,076 $95 $385,388 500+ $5,313 $0 $161,565 $14,056 $142,014 $43 $322,991 Total $147,972 $10,984 $3,670,620 $351,931 $1,716,593 $11,091 $5,909,192
Source: See previous tables.
Table 6-40. Total Cost Savings for All Labelers under the Class I Static Barcoding Alternative (Includes Savings from GMP-Exempt Exclusion)
Est. Size
Total Savings
Planning &
Adminis-tration
Total Regi-
stration Savings
Total Savings
Equipment
Total Savings
Recurring Labeling
Costs
Total Savings
Software
Total Savings GUDID
Total Savings
With Class I Static Altern-
ative 1-4 $110,591 $6,252 $45,899 $284,122 $174,665 $19,999 $641,528 5-9 $112,451 $2,165 $28,478 $128,890 $1,336,276 $10,477 $1,618,737 10-49 $490,154 $2,986 $11,059,128 $358,527 $5,769,660 $30,236 $17,710,692 50-99 $123,343 $471 $2,671,620 $162,904 $1,603,778 $5,899 $4,568,014 100-249 $192,275 $2,448 $3,139,218 $393,695 $2,563,248 $4,597 $6,295,482 250-499 $176,433 $960 $3,024,131 $274,117 $2,169,025 $2,109 $5,646,774 500+ $143,186 $0 $2,067,338 $275,347 $2,720,671 $1,141 $5,207,683 Total $1,348,433 $15,282 $22,035,812 $1,877,601 $16,337,323 $74,458 $41,688,909
Source: See previous tables.
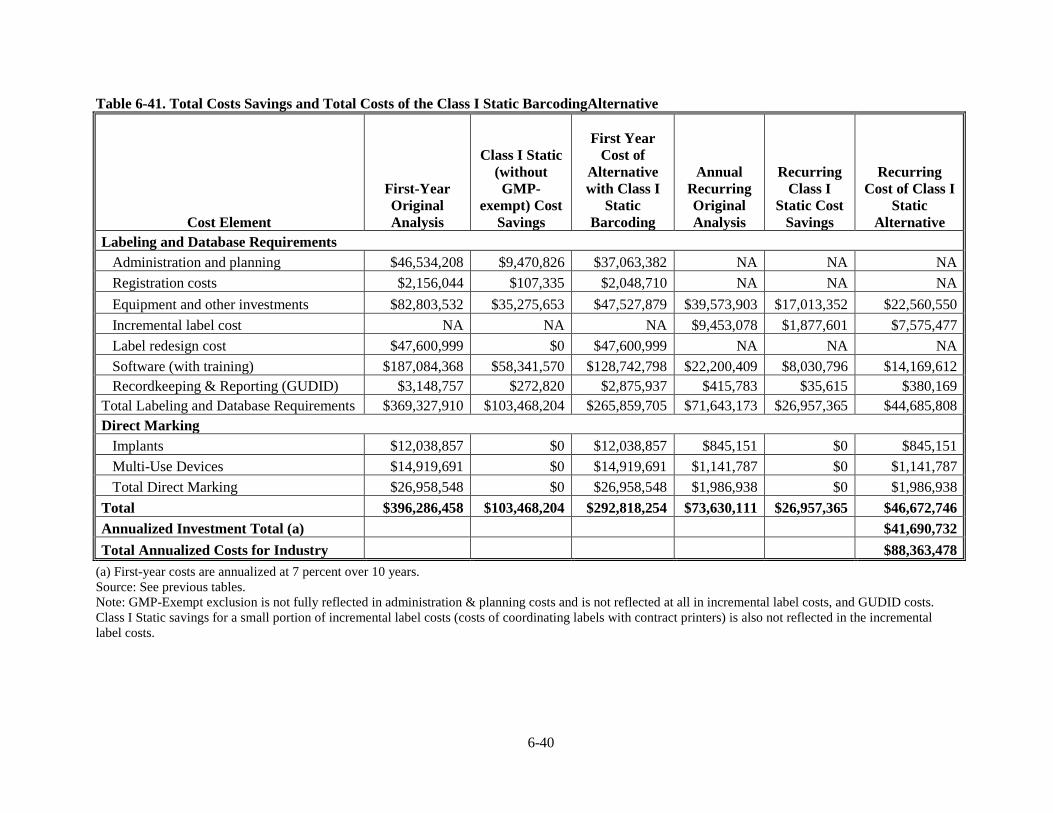
6-40
Table 6-41. Total Costs Savings and Total Costs of the Class I Static BarcodingAlternative
Cost Element
First-Year Original Analysis
Class I Static (without GMP-
exempt) Cost Savings
First Year Cost of
Alternative with Class I
Static Barcoding
Annual Recurring Original Analysis
Recurring Class I
Static Cost Savings
Recurring Cost of Class I
Static Alternative
Labeling and Database Requirements Administration and planning $46,534,208 $9,470,826 $37,063,382 NA NA NA Registration costs $2,156,044 $107,335 $2,048,710 NA NA NA Equipment and other investments $82,803,532 $35,275,653 $47,527,879 $39,573,903 $17,013,352 $22,560,550 Incremental label cost NA NA NA $9,453,078 $1,877,601 $7,575,477 Label redesign cost $47,600,999 $0 $47,600,999 NA NA NA Software (with training) $187,084,368 $58,341,570 $128,742,798 $22,200,409 $8,030,796 $14,169,612 Recordkeeping & Reporting (GUDID) $3,148,757 $272,820 $2,875,937 $415,783 $35,615 $380,169 Total Labeling and Database Requirements $369,327,910 $103,468,204 $265,859,705 $71,643,173 $26,957,365 $44,685,808 Direct Marking Implants $12,038,857 $0 $12,038,857 $845,151 $0 $845,151 Multi-Use Devices $14,919,691 $0 $14,919,691 $1,141,787 $0 $1,141,787 Total Direct Marking $26,958,548 $0 $26,958,548 $1,986,938 $0 $1,986,938 Total $396,286,458 $103,468,204 $292,818,254 $73,630,111 $26,957,365 $46,672,746 Annualized Investment Total (a) $41,690,732 Total Annualized Costs for Industry $88,363,478
(a) First-year costs are annualized at 7 percent over 10 years. Source: See previous tables. Note: GMP-Exempt exclusion is not fully reflected in administration & planning costs and is not reflected at all in incremental label costs, and GUDID costs. Class I Static savings for a small portion of incremental label costs (costs of coordinating labels with contract printers) is also not reflected in the incremental label costs.
6-41
Because DM will still be required, the impacts on firms shown in Section Five could still occur.
However, some multi-use device manufacturers, if they manufacture Class I devices only, could face
substantially reduced costs. To the extent that this situation occurs, this alternative could possibly reduce
the number of firms estimated to have costs exceeding 1 percent of revenues. We do not, however, have
any information on whether firms that manufacturer only Class I devices that require DM are among the
groups of firms considered likely to face costs exceeding 1 percent of revenues.
6.6.4 T iming of I nvestments under the C lass I Only Static B ar coding Alter native
For another comparison, we arrayed the costs over time, replacing the costs for Class I only
devices as shown in Table 4-29 with the costs for Class I only devices to meet static labeling requirements
and excluding GMP-exempt establishments.32
Table 4-29
We used all the same timing assumptions for Class I
devices that were used in . We have not presented the entire array here but show the results of
the arrayed costs compared to the original present value and annualized costs shown in Table 4-29 in
Section 4.4. As Table 6-42 shows, when costs are arrayed over time, this alternative saves less than one
might think from seeing the cost savings above. This is because most of the cost savings do not appear
until six years out when Class I devices must meet UDI requirements and because all device labels
(including those on GMP-exempt devices) require the date format change, triggering the cost of label
changes. Over a 10-year period of analysis, the alternative costs $66.5 million, saving $26.2 million over
the costs presented in Section Four. Over a 20-year period, the alternative costs $66.1 million and saves
$30.7 million over the costs presented in Section Four.
6.7 C OST S T O F DA F OR E ST AB L I SH I NG T H E G UDI D UNDE R F UR L S
FDA is not currently planning to implement the GUDID within the Electronic Registration and
Listing System (FURLS), but ERG investigated the costs to do so. Because a module could be relatively
easily attached to the present FURLS system, such an approach would be less expensive than setting up
the GUDID as a separate system.
Currently, all medical device labeling establishments are required to register annually with FDA
and list the medical devices on which they perform a number of activities, including manufacturing,
reprocessing, specification development, and repackaging/relabeling (see Appendix A). Unless they
32 Costs for label redesign remain the same as shown in Table 4-29, but the recurring costs for labeling line
uses the costs shown in Table 6-41. DM costs also remain the same. All reinvestment costs for Class I only are eliminated. These costs are for software and equipment, which are not needed for static barcoding.

6-42
receive a waiver, establishments must provide registration and listing information electronically, using
FURLS. Establishments may submit registration and listing information on screen or by completing and
uploading an electronic form.
Table 6-42. Class I Static Barcoding with GMP-Exempt Devices Excluded and with Implementation Time Considered
Original Analysis
(Table 4-29)
Class I Static, GMP-Exempt Not
Covered Cost Savings NPV over 20 yrs. at 7% $1,097,581,910 $749,304,294 $348,277,615
Annualized (7%, 20 yrs.) $96,826,138 $66,101,892 $30,724,246 NPV over 20 yrs. at 3% $1,488,576,565 $989,303,972 $499,272,593 Annualized (3%, 20 yrs) $97,141,483 $64,559,968 $32,581,515 NPV over 10 yrs. at 7% $696,259,478 $499,415,109 $196,844,368 Annualized (7%, 10 yrs.) $92,646,435 $66,453,716 $26,192,719 NPV over 10 yrs. at 3% $811,901,404 $571,474,054 $240,427,350
Annualized (3%, 10 yrs.) $92,407,391 $65,042,906 $27,364,486 Source: See previous tables and Table 4-29.
Under this alternative, FDA would require labeling establishments to upload additional
information on their medical devices into a database (the GUDID), functioning within the FURLS. The
data for this database would be collected by adding new functionality to FURLS. This new functionality
would allow the establishments and FDA to do the following:
• Establishments would be able to submit the UDI and associated product information for each medical device they label and sell. As with registration and listing information, UDI listing information could be submitted on screen or uploaded from an electronic form.
• FDA would be able to view a set of standard reports and run queries (and view resulting ad
hoc reports) on submitted UDI information.
• The public would be able to view a set of standard reports containing publicly available UDI listing information.
ERG assumes that, as with the rest of FURLS, the UDI input and reporting functionality would be
English-only.
6-43
Providing this new functionality would require designing and developing the following additions to
FURLS:
• New screens, linked to existing fields for a listed medical device, for submitting/updating/deleting the UDI for a product and for submitting/updating associated product information.
• An electronic form that can be uploaded to FURLS.
• A set of standard reports for viewing medical device and UDI listing information.
• An interface for the public to use to select and view reports.
• A secure interface for authorized personnel to use to run special queries and reports. 6.7.1 I nitial Development and Deployment
To develop the new UDI listing and reporting functionality, FDA would need to develop:
• A set of detailed requirements.
• A specifications document.
• New data tables for the FURLS database.
• Mockups and actual screens for submitting information.
• Electronic form for uploading information.
• Mockups and actual screens for selecting reports (public).
• Mockups and actual screens for selecting reports and running queries (secure).
• Mockups and actual functionality for reports.
• On-screen help information and detailed documentation.
FDA would then need to:
• Conduct testing and make any revisions required.
• Submit the application for review and clearance, making any revisions required.
• Deploy the application.
• Conduct outreach to the medical device community to communicate UDI listing requirements and methods.
As Table 6-43 shows, ERG estimates that this task to create the GUDID module within the
FURLS system would take about 4,700 hours to set up. Using an approximate weighted average hourly
6-44
wage between software engineers and support staff of $100 per hour, ERG estimates that the initial cost
of set up would be $470,000.
6.7.2 Oper ation and M aintenance
Once the application is deployed, FDA would need to:
• Host and maintain the UDI listing and reporting functionality along with the rest of FURLS.
• Provide Helpdesk services for the UDI listing and reporting functionality within FURLS.
Although the operating ease of this system is uncertain at this point, ERG judged that the
database might continue to need development and maintenance work over time, especially in earlier years
because of possible growing pains associated with a new system. ERG estimated that 4,700 hours per year
would need to be added to the FURLS tasks to accommodate these operations. See Table 6-43 for the cost
calculations. The recurring costs associated with these tasks total $470,000 per year. (The constancy of
the first-year and recurring annual expenses is coincidental.)
6.7.3 Annualized C osts to F DA of the G UDI D System
When the first-year costs and recurring costs are annualized, ERG estimates that the cost to set up
and maintain the GUDID would cost FDA about $0.1 million per year, assuming a discount rate of 7
percent over 10 years.
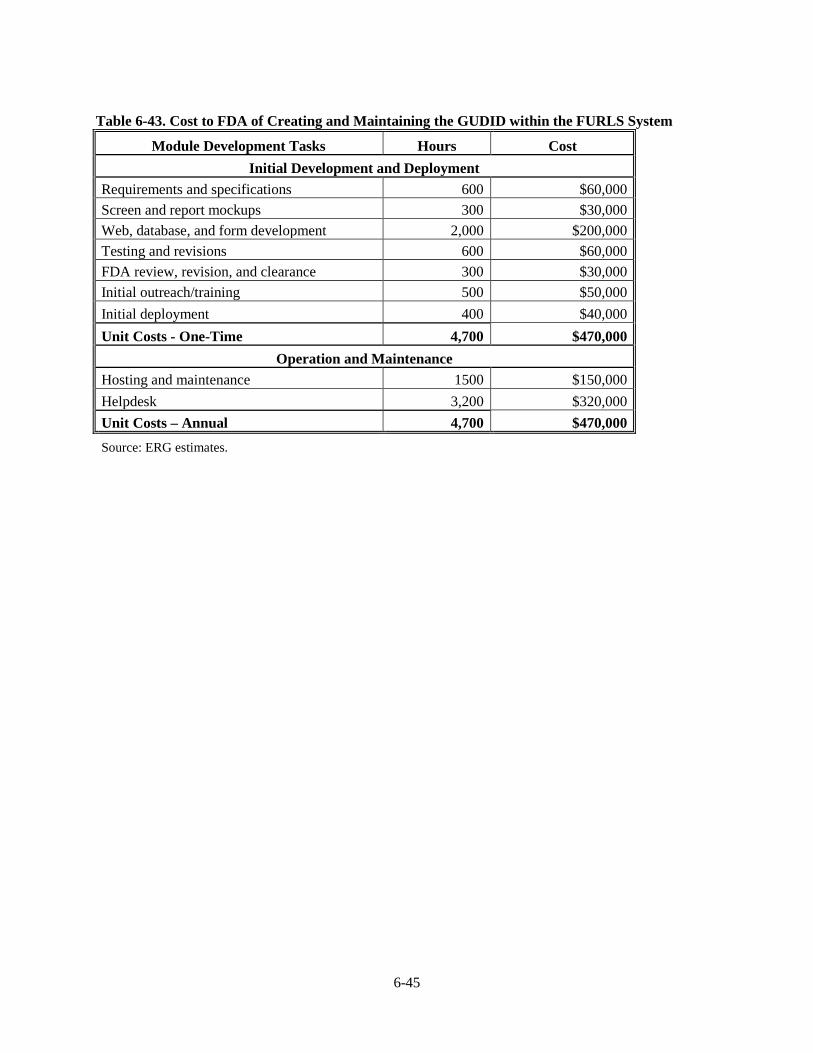
6-45
Table 6-43. Cost to FDA of Creating and Maintaining the GUDID within the FURLS System
Module Development Tasks Hours Cost Initial Development and Deployment
Requirements and specifications 600 $60,000 Screen and report mockups 300 $30,000 Web, database, and form development 2,000 $200,000 Testing and revisions 600 $60,000 FDA review, revision, and clearance 300 $30,000 Initial outreach/training 500 $50,000 Initial deployment 400 $40,000 Unit Costs - One-Time 4,700 $470,000
Operation and Maintenance Hosting and maintenance 1500 $150,000 Helpdesk 3,200 $320,000 Unit Costs – Annual 4,700 $470,000 Source: ERG estimates.

7-1
SE C T I ON SE V E N
I NI T I AL R E G UL AT OR Y F L E X I B I L I T Y ANAL Y SI S
The Regulatory Flexibility Act, as amended by the Small Business Regulatory Enforcement
Fairness Act (SBREFA) requires all notice and comment rulemaking to be accompanied by a Regulatory
Flexibility Analysis (RFA) unless the agency can certify that the rule would have no significant impact on
a substantial number of small entities. FDA has decided to perform an Initial Regulatory Flexibility
Analysis (IRFA), regardless of whether the proposed rule is ultimately certified.
When an RFA is prepared for a proposed rulemaking, the analysis is an IRFA, and this IRFA
must address the following (as cited in P.L. 104-121):
• a description of the reasons why action by the agency is being considered;
• a succinct statement of the objectives of, and legal basis for, the proposed rule;
• a description of and, where feasible, an estimate of the number of small entities to which the proposed rule will apply;
• a description of the projected reporting, recordkeeping and other compliance requirements of the proposed rule, including an estimate of the classes of small entities which will be subject to the requirement and the type of professional skills necessary for preparation of the report or record;
• an identification, to the extent practicable, of all relevant Federal rules which may duplicate, overlap or conflict with the proposed rule;
• a description of any significant alternatives to the proposed rule which accomplish the stated objectives of applicable statutes and which minimize any significant economic impact of the proposed rule on small entities.
This section addresses each of these major areas in the following sections.
7.1 NE E D F OR T H E PR OPOSE D R UL E
The need for the proposed rule is laid out in the Preamble to the Proposed Rule.
7.2 OB J E C T I V E S AND L E G AL B ASI S OF T H E PR OPOSE D R UL E
The primary objectives of the proposed rule are discussed in the Preamble to the Proposed Rule.

7-2
7.3 E ST I M AT E OF SM AL L E NT I T I E S AF F E C T E D B Y T H E PR OPOSE D R UL E
Section Four provides estimates of the number of small entities affected by the proposed rule. As
Table 3-6 in Section Three showed, ERG identified a total of 6,569 domestic firms that are considered
labelers. For all relevant initial labeling NAICS, small entities are those with fewer than 500 employees,
while for R/Rs, small entities are those with fewer than 100 employees (SBA, 2008).
Many of these small entities, however, are expected not to be affected by the proposed rule
because FDA has offered exceptions to labelers of certain devices such as custom devices, and labelers
who label only with UPCs for retail sale (see Section 4.2.2). These latter devices are considered to be in
compliance with UDI labeling requirements already. Therefore, many of the smallest labelers are
considered very likely to be unaffected by the proposed rule. An estimated 1,334 small businesses out of
6,345 small businesses estimated to be currently registered with FDA as labelers (21 percent) are
considered likely to be unaffected. Table 7-1 presents the counts of firms, both initial labelers and R/Rs,
by size, after the exceptions and exclusive UPC use are considered. As the table shows 5,234 out of the
6,569 firms identified as labelers (80 percent) are expected to be subject to the proposed rule. Of these,
5,010 (96 percent of affected) are identified as small entities. An additional 41 small firms are estimated
to use variable barcodes, therefore, 4,969 small firms are estimated to be affected by the UDI labeling
requirements of the proposed rule.
7.4 R E C OR DK E E PI NG , R E POR T I NG AND OT H E R C OM PL I ANC E R E QUI R E M E NT S OF T H E PR OPOSE D R UL E
7.4.1 R ecor dkeeping and R epor ting R equir ements
The primary recordkeeping and reporting requirements of the proposed rule are organized by cost
category as follows:
• Administrative and Planning Costs—these costs include costs for creating and revising SOPs. Approximately 25 percent of the cost of this cost category was considered to apply to this task. All affected small entities would need to consider whether the requirements affect their SOPs and revise existing SOPs or create new ones. This is considered a managerial task primarily, although clerical work might be required. Medical device labelers of all sizes routinely create and revise SOPs.
• Barcode Registration Costs—only a fraction of small entities are expected to need to register. ERG estimates that 474 small entities will need to register. The time needed to fill out the web-based form is considered a minimal portion of the overall planning
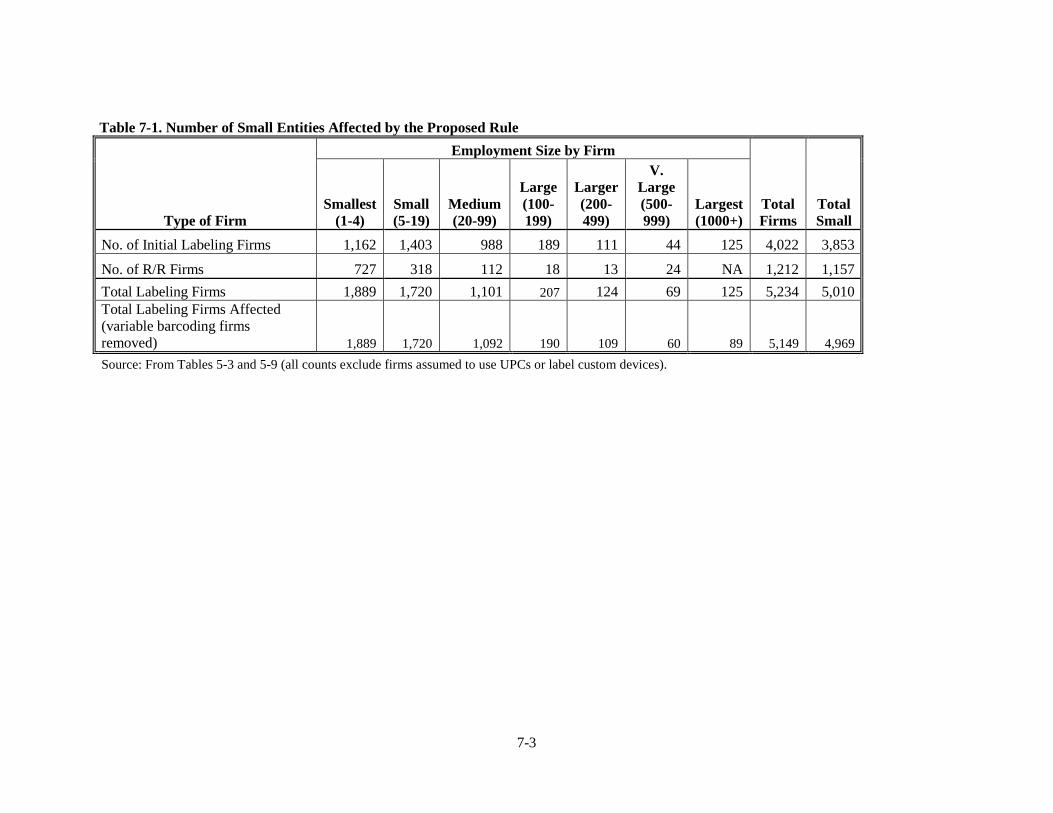
7-3
Table 7-1. Number of Small Entities Affected by the Proposed Rule
Type of Firm
Employment Size by Firm
Total Firms
Total Small
Smallest (1-4)
Small (5-19)
Medium (20-99)
Large (100-199)
Larger (200-499)
V. Large (500-999)
Largest (1000+)
No. of Initial Labeling Firms 1,162 1,403 988 189 111 44 125 4,022 3,853
No. of R/R Firms 727 318 112 18 13 24 NA 1,212 1,157 Total Labeling Firms 1,889 1,720 1,101 207 124 69 125 5,234 5,010 Total Labeling Firms Affected (variable barcoding firms removed) 1,889 1,720 1,092 190 109 60 89 5,149 4,969 Source: From Tables 5-3 and 5-9 (all counts exclude firms assumed to use UPCs or label custom devices).

7-4
effort. The registration form asks for identifying information, the type of applicant (e.g., manufacturer), the revenue class to which the applicant belongs, a check off box for each revenue class for identifying the appropriate fee, and credit card information. ERG assumes a manager would be completing this form.33
• Equipment Costs—a portion of this cost category is the labor to operate verifiers. ERG assumes that a part of the task of operating the verifiers is to indicate in records the outcome of the verification task and what was done to correct any problems found. Most small entities were assumed to need to meet this requirement incrementally. The labor category assumed for this task was a quality control inspector. Maintaining records of this type is routine in the medical device labeling industries.
• Direct Marking—only a relatively small fraction of small entities are expected to need to do DM. ERG estimates, however, that 106 small entities might need to file exceptions for DM, which is expected to require 10 hours per exception and could involve submission of an exception notification to FDA. The submission would document the reason for the exception. It is assumed that this is not a routine staff function and, therefore, is a management-level task. Additionally, among those small entities not filing exceptions, 135 firms are expected to need to verify the safety of marking systems for implants and multi-use equipment. (See Section 4.3.1.4 for more information on these numbers and assumptions.) Because many similar products are already marked by other firms, this task would entail literature searches for information on the products that are already marked and preparing a summary of the information found. Management time is assumed for this type of task.
• Software—integration of variable barcoding into IT systems requires acquisition of software modules, testing, verification, and validation of those software systems. Even the smallest facilities would require some testing, so all small entities are expected to need to document testing, verification, and in some cases, validation outcomes, both on a one-time basis, and to a more limited extent, on a recurring basis. This task is likely to be performed by inspection or QA workers. However, except for the very smallest entities, this software installation should automate all UDI-related recordkeeping tasks, which mostly involve ensuring that the UDI appear on all device records that FDA currently requires to be maintained. Personnel running the reports are assumed to be the same personnel who ordinarily run similar IT reports that currently do not contain the UDI. These might be IT staff, accounting staff, or clerical workers, depending on the size and sophistication of the operation. The incremental task of ensuring a UDI appears on device records, where this is assumed to be done manually (among the 1-4 employees size group), is considered negligible for the very few products likely to be labeled by entities in this size group. This is judged to be a clerical task.
• GUDID—this is the major recordkeeping and reporting task in this proposed rule, because so much of the recordkeeping and reporting tasks associated with device records are assumed to become automated using the software discussed above. Adding a UDI to existing or future device records is considered a minimal task with automation. The GUDID task requires that firms input additional information on each device they manufacture. Currently all device manufacturers must list devices by type and provide some information on the device. The proposed rule would require them to provide UDI information for each device type, which could cover, for example, several dozens of individual products. For each product, the entities
33 HIBCC’s form is used as the basis for detailing these requirements.

7-5
would need to provide the UDI assigned and a number of other relatively easily obtained information items (see Section 4.3.1.7 for a list of the data required). For the smallest firms, this task is made simple by the relatively small number of products for which they would need to provide data and by the (presumed) ease of use of FDA’s web-based data entry system. Those entities with many more products would use an upload process, with an assumed upload function provided by FDA online. The software systems assumed to be used at the larger entities (within the small firm group) should automate much of the uploading. Because all of these entities already use similar web-based systems or upload similarly formatted data to FDA’s FURLS system for the registration and listing process, all should have personnel familiar with using web-based or SPL-uploading systems. Much of this work can be handled by whoever handles these tasks now (IT personnel, managers, or even trained technicians or clerical staff). A total of 3 to 4.5 hours per small entity is assumed in the first year, followed by one hour per year to add or edit information.
7.4.2 Other C ompliance T asks
Other compliance tasks include planning implementation of the UDI requirements, running new
labeling equipment, running new direct marking lasers, applying supplemental labels, and designing new
labels. All small entities either currently perform such tasks (planning for implementation of new FDA
rules and designing labels), are assumed to have personnel that would be trained to perform such tasks
with new equipment (running new printing/labeling equipment or DM lasers), or the tasks require little to
no new skills (adding a supplemental label).
7.5 OT H E R F E DE R AL R UL E S
There are no known Federal rules that duplicate, overlap, or conflict with the proposed rule.
7.6 C OST S T O AND I M PAC T S ON SM AL L E NT I T I E S AS A R E SUL T OF T H E PR OPOSE D
R UL E
The proposed rule would cost small entities approximately $68.2 million per year, or about 52
percent of the total annualized costs of the rule to industry (see Table 7-2). Most small entities would face
costs ranging from $1,000 per year per entity at the smallest firms to about $34,000 at the largest small
firms (250-499 employees. With DM costs considered, the highest costs per firm are estimated at
$111,000 per year per firm at the largest small firms ($78,000 plus $34,000). A very few small entities
might face such costs (17 small entities in the 250-499 employees size group that would be required to
mark implants) (see Table 5-3 in Section Five for additional breakouts of costs by size). Costs as a
percentage of revenues do not exceed 1 percent at all firms except for the very few that would be required
to mark devices. Among those firms, 32 small firms out of a total of 115 estimated small firms that are
expected to directly mark devices would have costs exceeding 1 percent of revenues (28 percent of small
firms expected to mark devices) (see Table 5-10 in Section Five). These percentages range from about 1.6
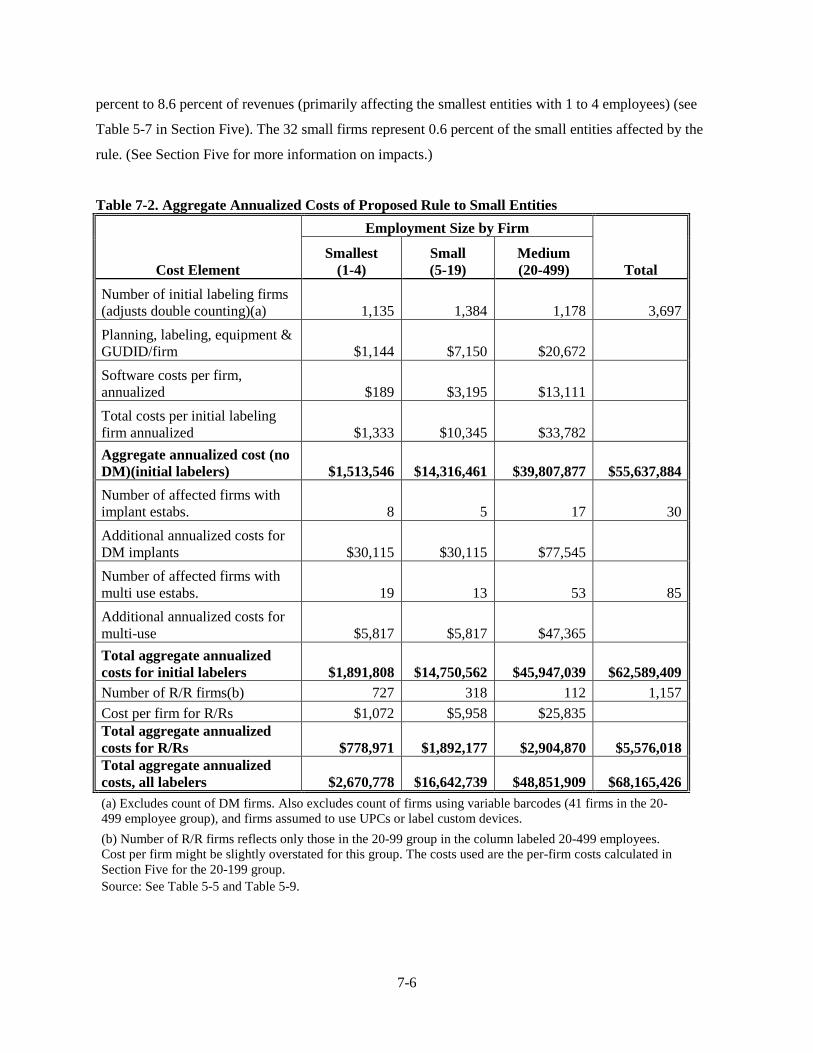
7-6
percent to 8.6 percent of revenues (primarily affecting the smallest entities with 1 to 4 employees) (see
Table 5-7 in Section Five). The 32 small firms represent 0.6 percent of the small entities affected by the
rule. (See Section Five for more information on impacts.)
Table 7-2. Aggregate Annualized Costs of Proposed Rule to Small Entities
Cost Element
Employment Size by Firm
Total Smallest
(1-4) Small (5-19)
Medium (20-499)
Number of initial labeling firms (adjusts double counting)(a) 1,135 1,384 1,178 3,697 Planning, labeling, equipment & GUDID/firm $1,144 $7,150 $20,672 Software costs per firm, annualized $189 $3,195 $13,111 Total costs per initial labeling firm annualized $1,333 $10,345 $33,782 Aggregate annualized cost (no DM)(initial labelers) $1,513,546 $14,316,461 $39,807,877 $55,637,884 Number of affected firms with implant estabs. 8 5 17 30 Additional annualized costs for DM implants $30,115 $30,115 $77,545 Number of affected firms with multi use estabs. 19 13 53 85 Additional annualized costs for multi-use $5,817 $5,817 $47,365 Total aggregate annualized costs for initial labelers $1,891,808 $14,750,562 $45,947,039 $62,589,409 Number of R/R firms(b) 727 318 112 1,157 Cost per firm for R/Rs $1,072 $5,958 $25,835 Total aggregate annualized costs for R/Rs $778,971 $1,892,177 $2,904,870 $5,576,018 Total aggregate annualized costs, all labelers $2,670,778 $16,642,739 $48,851,909 $68,165,426 (a) Excludes count of DM firms. Also excludes count of firms using variable barcodes (41 firms in the 20-499 employee group), and firms assumed to use UPCs or label custom devices. (b) Number of R/R firms reflects only those in the 20-99 group in the column labeled 20-499 employees. Cost per firm might be slightly overstated for this group. The costs used are the per-firm costs calculated in Section Five for the 20-199 group. Source: See Table 5-5 and Table 5-9.
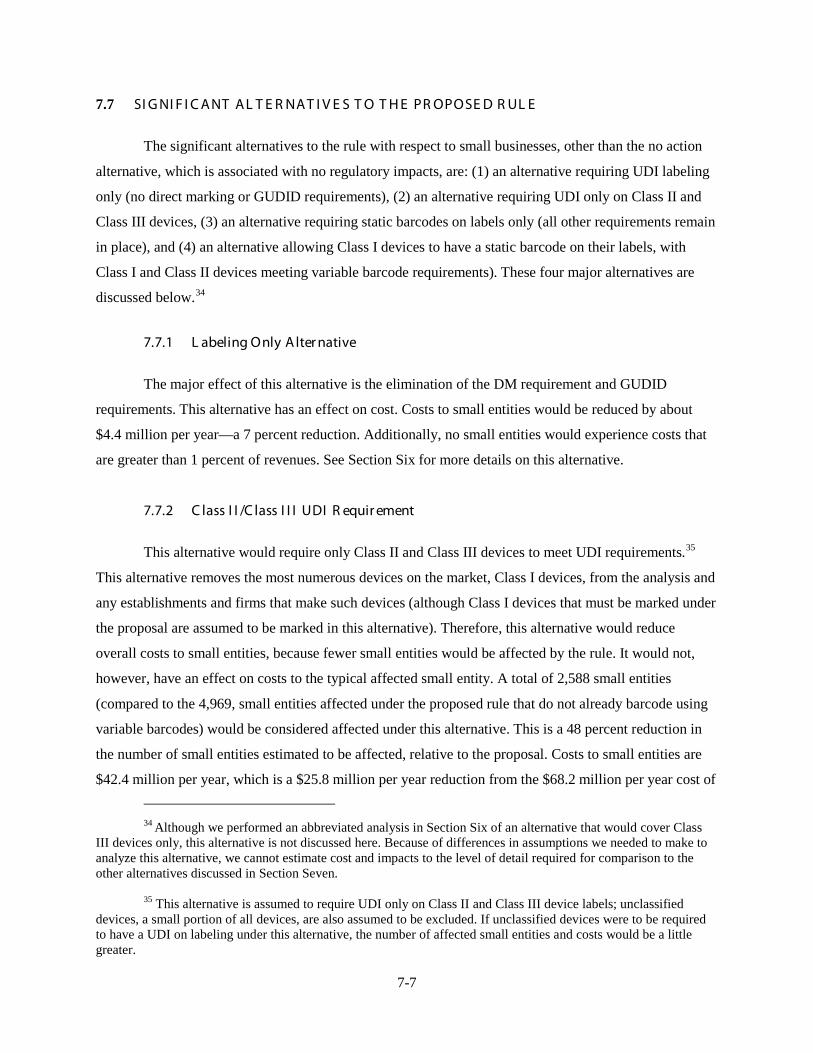
7-7
7.7 SI G NI F I C ANT AL T E R NAT I V E S T O T H E PR OPOSE D R UL E
The significant alternatives to the rule with respect to small businesses, other than the no action
alternative, which is associated with no regulatory impacts, are: (1) an alternative requiring UDI labeling
only (no direct marking or GUDID requirements), (2) an alternative requiring UDI only on Class II and
Class III devices, (3) an alternative requiring static barcodes on labels only (all other requirements remain
in place), and (4) an alternative allowing Class I devices to have a static barcode on their labels, with
Class I and Class II devices meeting variable barcode requirements). These four major alternatives are
discussed below.34
7.7.1 L abeling Only Alter native
The major effect of this alternative is the elimination of the DM requirement and GUDID
requirements. This alternative has an effect on cost. Costs to small entities would be reduced by about
$4.4 million per year—a 7 percent reduction. Additionally, no small entities would experience costs that
are greater than 1 percent of revenues. See Section Six for more details on this alternative.
7.7.2 C lass I I /C lass I I I UDI R equir ement
This alternative would require only Class II and Class III devices to meet UDI requirements.35
34 Although we performed an abbreviated analysis in Section Six of an alternative that would cover Class
III devices only, this alternative is not discussed here. Because of differences in assumptions we needed to make to analyze this alternative, we cannot estimate cost and impacts to the level of detail required for comparison to the other alternatives discussed in Section Seven.
This alternative removes the most numerous devices on the market, Class I devices, from the analysis and
any establishments and firms that make such devices (although Class I devices that must be marked under
the proposal are assumed to be marked in this alternative). Therefore, this alternative would reduce
overall costs to small entities, because fewer small entities would be affected by the rule. It would not,
however, have an effect on costs to the typical affected small entity. A total of 2,588 small entities
(compared to the 4,969, small entities affected under the proposed rule that do not already barcode using
variable barcodes) would be considered affected under this alternative. This is a 48 percent reduction in
the number of small entities estimated to be affected, relative to the proposal. Costs to small entities are
$42.4 million per year, which is a $25.8 million per year reduction from the $68.2 million per year cost of
35 This alternative is assumed to require UDI only on Class II and Class III device labels; unclassified
devices, a small portion of all devices, are also assumed to be excluded. If unclassified devices were to be required to have a UDI on labeling under this alternative, the number of affected small entities and costs would be a little greater.
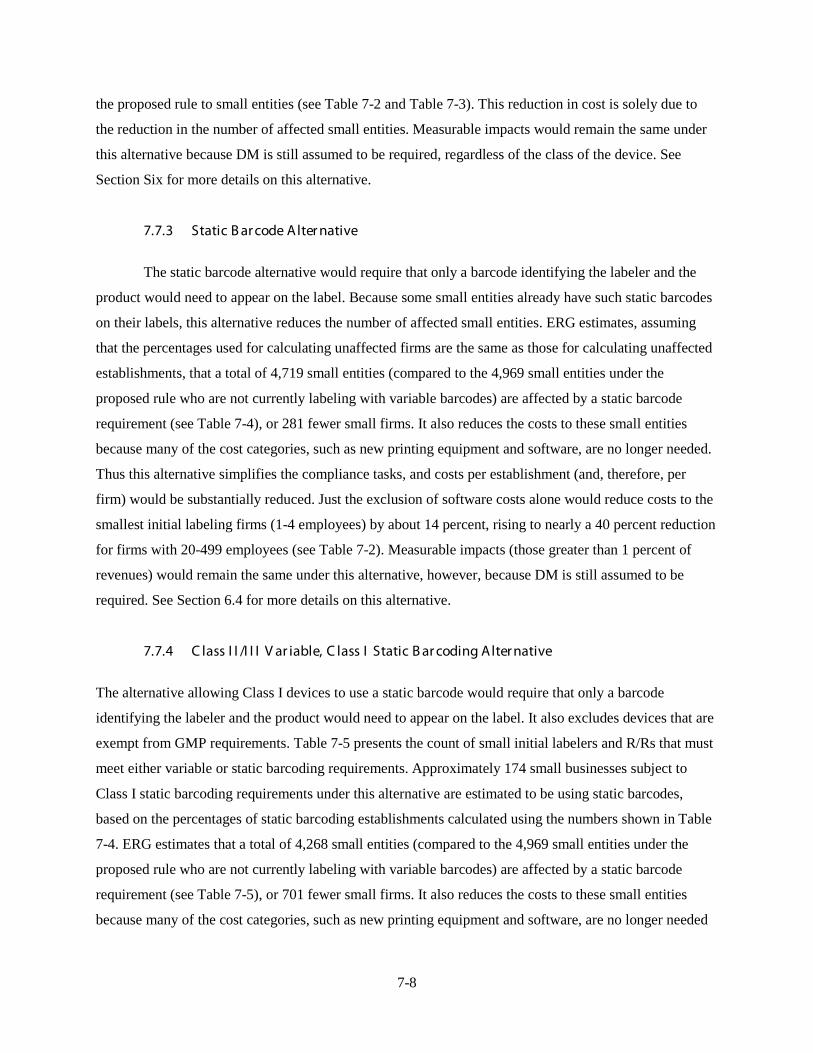
7-8
the proposed rule to small entities (see Table 7-2 and Table 7-3). This reduction in cost is solely due to
the reduction in the number of affected small entities. Measurable impacts would remain the same under
this alternative because DM is still assumed to be required, regardless of the class of the device. See
Section Six for more details on this alternative.
7.7.3 Static B ar code Alter native
The static barcode alternative would require that only a barcode identifying the labeler and the
product would need to appear on the label. Because some small entities already have such static barcodes
on their labels, this alternative reduces the number of affected small entities. ERG estimates, assuming
that the percentages used for calculating unaffected firms are the same as those for calculating unaffected
establishments, that a total of 4,719 small entities (compared to the 4,969 small entities under the
proposed rule who are not currently labeling with variable barcodes) are affected by a static barcode
requirement (see Table 7-4), or 281 fewer small firms. It also reduces the costs to these small entities
because many of the cost categories, such as new printing equipment and software, are no longer needed.
Thus this alternative simplifies the compliance tasks, and costs per establishment (and, therefore, per
firm) would be substantially reduced. Just the exclusion of software costs alone would reduce costs to the
smallest initial labeling firms (1-4 employees) by about 14 percent, rising to nearly a 40 percent reduction
for firms with 20-499 employees (see Table 7-2). Measurable impacts (those greater than 1 percent of
revenues) would remain the same under this alternative, however, because DM is still assumed to be
required. See Section 6.4 for more details on this alternative.
7.7.4 C lass I I /I I I V ar iable, C lass I Static B ar coding Alter native
The alternative allowing Class I devices to use a static barcode would require that only a barcode
identifying the labeler and the product would need to appear on the label. It also excludes devices that are
exempt from GMP requirements. Table 7-5 presents the count of small initial labelers and R/Rs that must
meet either variable or static barcoding requirements. Approximately 174 small businesses subject to
Class I static barcoding requirements under this alternative are estimated to be using static barcodes,
based on the percentages of static barcoding establishments calculated using the numbers shown in Table
7-4. ERG estimates that a total of 4,268 small entities (compared to the 4,969 small entities under the
proposed rule who are not currently labeling with variable barcodes) are affected by a static barcode
requirement (see Table 7-5), or 701 fewer small firms. It also reduces the costs to these small entities
because many of the cost categories, such as new printing equipment and software, are no longer needed
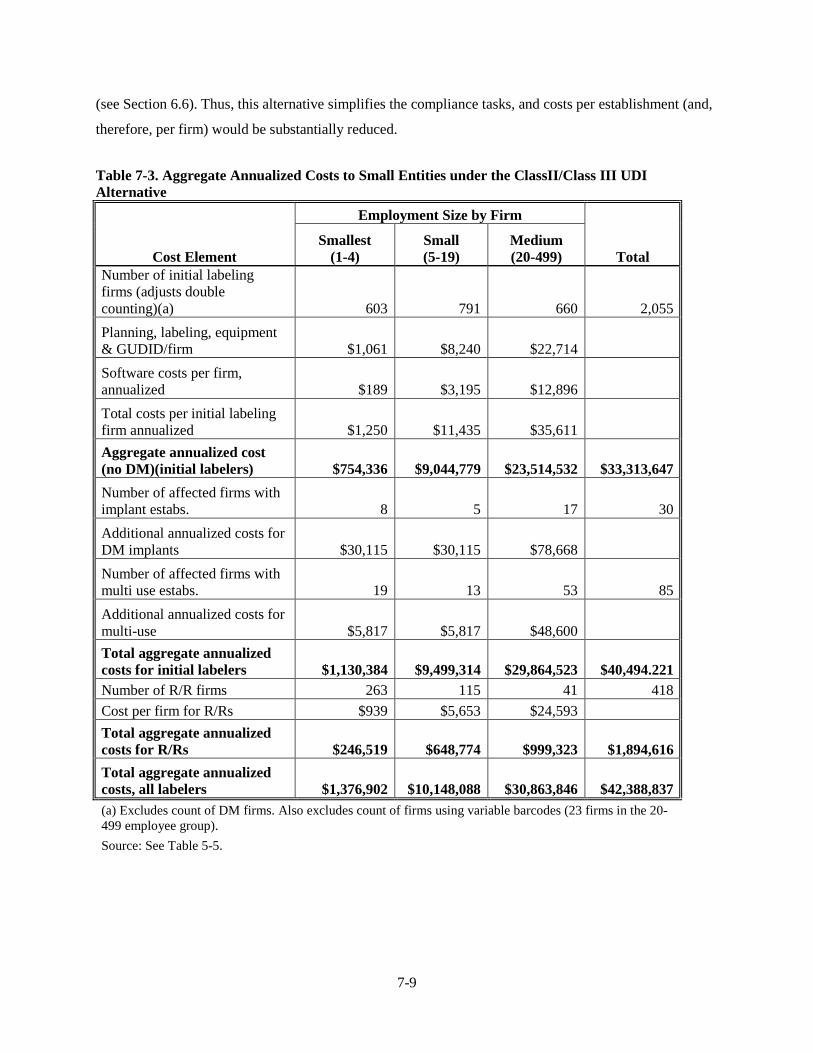
7-9
(see Section 6.6). Thus, this alternative simplifies the compliance tasks, and costs per establishment (and,
therefore, per firm) would be substantially reduced.
Table 7-3. Aggregate Annualized Costs to Small Entities under the ClassII/Class III UDI Alternative
Cost Element
Employment Size by Firm
Total Smallest
(1-4) Small (5-19)
Medium (20-499)
Number of initial labeling firms (adjusts double counting)(a) 603 791 660 2,055 Planning, labeling, equipment & GUDID/firm $1,061 $8,240 $22,714 Software costs per firm, annualized $189 $3,195 $12,896 Total costs per initial labeling firm annualized $1,250 $11,435 $35,611 Aggregate annualized cost (no DM)(initial labelers) $754,336 $9,044,779 $23,514,532 $33,313,647 Number of affected firms with implant estabs. 8 5 17 30 Additional annualized costs for DM implants $30,115 $30,115 $78,668 Number of affected firms with multi use estabs. 19 13 53 85 Additional annualized costs for multi-use $5,817 $5,817 $48,600 Total aggregate annualized costs for initial labelers $1,130,384 $9,499,314 $29,864,523 $40,494.221 Number of R/R firms 263 115 41 418 Cost per firm for R/Rs $939 $5,653 $24,593 Total aggregate annualized costs for R/Rs $246,519 $648,774 $999,323 $1,894,616 Total aggregate annualized costs, all labelers $1,376,902 $10,148,088 $30,863,846 $42,388,837 (a) Excludes count of DM firms. Also excludes count of firms using variable barcodes (23 firms in the 20-499 employee group). Source: See Table 5-5.
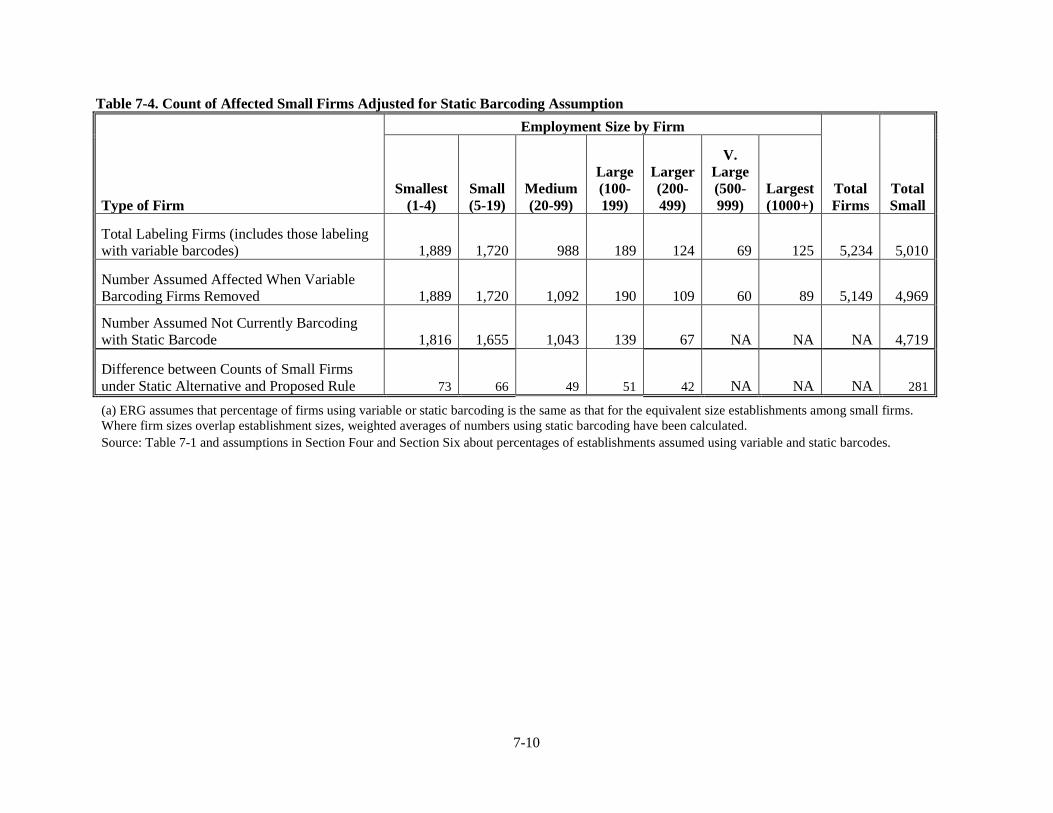
7-10
Table 7-4. Count of Affected Small Firms Adjusted for Static Barcoding Assumption
Type of Firm
Employment Size by Firm
Total Firms
Total Small
Smallest (1-4)
Small (5-19)
Medium (20-99)
Large (100-199)
Larger (200-499)
V. Large (500-999)
Largest (1000+)
Total Labeling Firms (includes those labeling with variable barcodes) 1,889 1,720 988 189 124 69 125 5,234 5,010
Number Assumed Affected When Variable Barcoding Firms Removed 1,889 1,720 1,092 190 109 60 89 5,149 4,969
Number Assumed Not Currently Barcoding with Static Barcode 1,816 1,655 1,043 139 67 NA NA NA 4,719
Difference between Counts of Small Firms under Static Alternative and Proposed Rule 73 66 49 51 42 NA NA NA 281
(a) ERG assumes that percentage of firms using variable or static barcoding is the same as that for the equivalent size establishments among small firms. Where firm sizes overlap establishment sizes, weighted averages of numbers using static barcoding have been calculated. Source: Table 7-1 and assumptions in Section Four and Section Six about percentages of establishments assumed using variable and static barcodes.
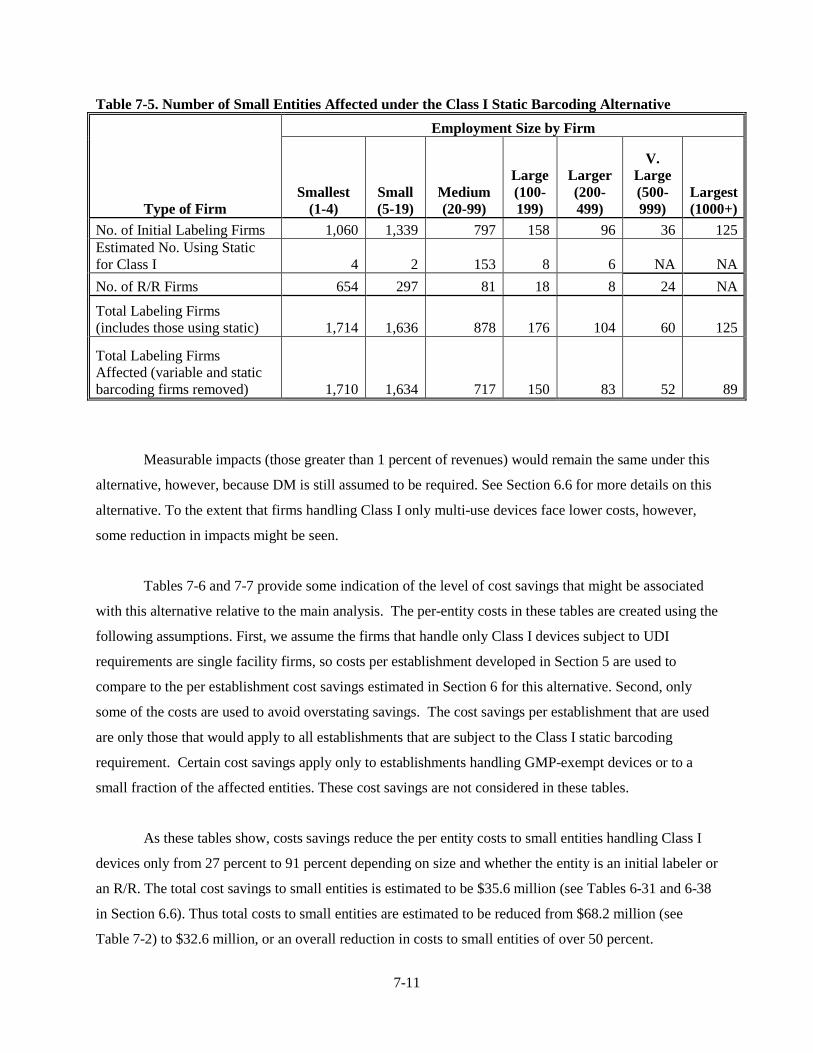
7-11
Table 7-5. Number of Small Entities Affected under the Class I Static Barcoding Alternative
Type of Firm
Employment Size by Firm
Smallest (1-4)
Small (5-19)
Medium (20-99)
Large (100-199)
Larger (200-499)
V. Large (500-999)
Largest (1000+)
No. of Initial Labeling Firms 1,060 1,339 797 158 96 36 125 Estimated No. Using Static for Class I 4 2 153 8 6 NA NA No. of R/R Firms 654 297 81 18 8 24 NA
Total Labeling Firms (includes those using static) 1,714 1,636 878 176 104 60 125
Total Labeling Firms Affected (variable and static barcoding firms removed) 1,710 1,634 717 150 83 52 89
Measurable impacts (those greater than 1 percent of revenues) would remain the same under this
alternative, however, because DM is still assumed to be required. See Section 6.6 for more details on this
alternative. To the extent that firms handling Class I only multi-use devices face lower costs, however,
some reduction in impacts might be seen.
Tables 7-6 and 7-7 provide some indication of the level of cost savings that might be associated
with this alternative relative to the main analysis. The per-entity costs in these tables are created using the
following assumptions. First, we assume the firms that handle only Class I devices subject to UDI
requirements are single facility firms, so costs per establishment developed in Section 5 are used to
compare to the per establishment cost savings estimated in Section 6 for this alternative. Second, only
some of the costs are used to avoid overstating savings. The cost savings per establishment that are used
are only those that would apply to all establishments that are subject to the Class I static barcoding
requirement. Certain cost savings apply only to establishments handling GMP-exempt devices or to a
small fraction of the affected entities. These cost savings are not considered in these tables.
As these tables show, costs savings reduce the per entity costs to small entities handling Class I
devices only from 27 percent to 91 percent depending on size and whether the entity is an initial labeler or
an R/R. The total cost savings to small entities is estimated to be $35.6 million (see Tables 6-31 and 6-38
in Section 6.6). Thus total costs to small entities are estimated to be reduced from $68.2 million (see
Table 7-2) to $32.6 million, or an overall reduction in costs to small entities of over 50 percent.
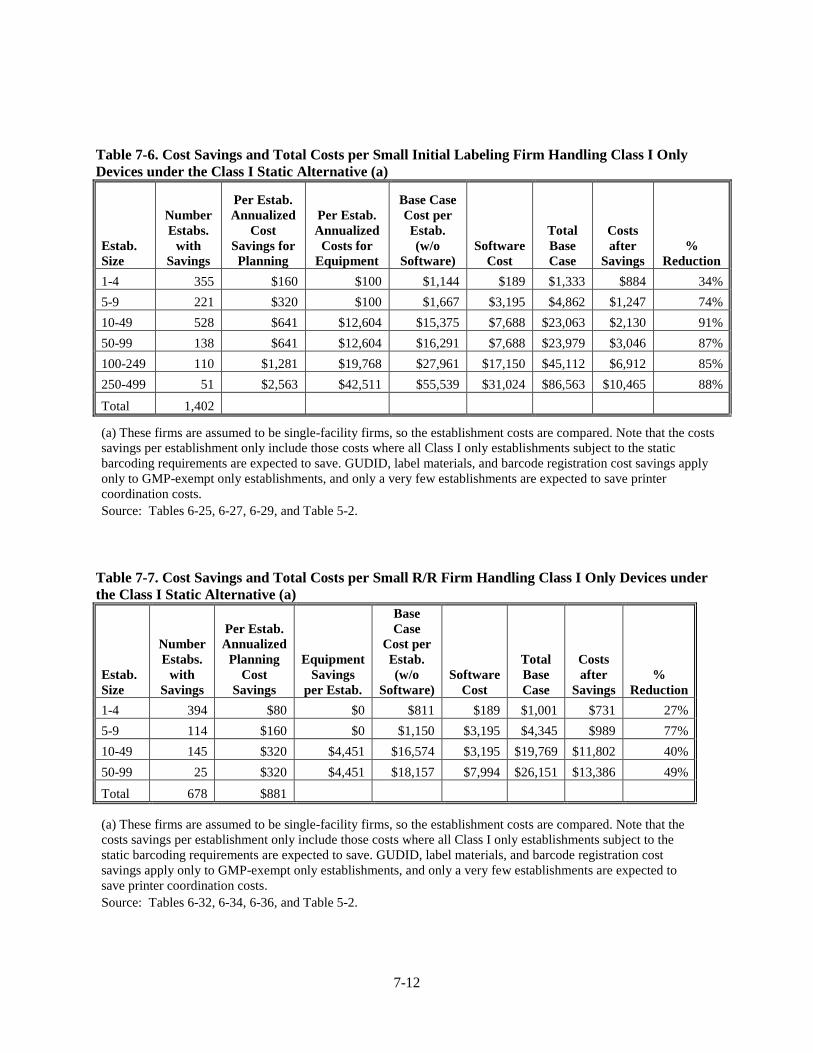
7-12
Table 7-6. Cost Savings and Total Costs per Small Initial Labeling Firm Handling Class I Only Devices under the Class I Static Alternative (a)
Estab. Size
Number Estabs.
with Savings
Per Estab. Annualized
Cost Savings for Planning
Per Estab. Annualized
Costs for Equipment
Base Case Cost per Estab. (w/o
Software) Software
Cost
Total Base Case
Costs after
Savings %
Reduction 1-4 355 $160 $100 $1,144 $189 $1,333 $884 34% 5-9 221 $320 $100 $1,667 $3,195 $4,862 $1,247 74% 10-49 528 $641 $12,604 $15,375 $7,688 $23,063 $2,130 91% 50-99 138 $641 $12,604 $16,291 $7,688 $23,979 $3,046 87% 100-249 110 $1,281 $19,768 $27,961 $17,150 $45,112 $6,912 85% 250-499 51 $2,563 $42,511 $55,539 $31,024 $86,563 $10,465 88% Total 1,402
(a) These firms are assumed to be single-facility firms, so the establishment costs are compared. Note that the costs savings per establishment only include those costs where all Class I only establishments subject to the static barcoding requirements are expected to save. GUDID, label materials, and barcode registration cost savings apply only to GMP-exempt only establishments, and only a very few establishments are expected to save printer coordination costs. Source: Tables 6-25, 6-27, 6-29, and Table 5-2.
Table 7-7. Cost Savings and Total Costs per Small R/R Firm Handling Class I Only Devices under the Class I Static Alternative (a)
Estab. Size
Number Estabs.
with Savings
Per Estab. Annualized
Planning Cost
Savings
Equipment Savings
per Estab.
Base Case
Cost per Estab. (w/o
Software) Software
Cost
Total Base Case
Costs after
Savings %
Reduction 1-4 394 $80 $0 $811 $189 $1,001 $731 27% 5-9 114 $160 $0 $1,150 $3,195 $4,345 $989 77% 10-49 145 $320 $4,451 $16,574 $3,195 $19,769 $11,802 40% 50-99 25 $320 $4,451 $18,157 $7,994 $26,151 $13,386 49% Total 678 $881
(a) These firms are assumed to be single-facility firms, so the establishment costs are compared. Note that the costs savings per establishment only include those costs where all Class I only establishments subject to the static barcoding requirements are expected to save. GUDID, label materials, and barcode registration cost savings apply only to GMP-exempt only establishments, and only a very few establishments are expected to save printer coordination costs. Source: Tables 6-32, 6-34, 6-36, and Table 5-2.

8-1
SE C T I ON E I G H T
UNC E R T AI NT Y A NAL Y SI S
The cost estimate presented in Section Four is associated with uncertainty, with some cost
categories more uncertain than others. This section qualitatively discusses the uncertainty of the cost
estimates for each of the major cost categories and presents an upper bound and lower bound estimate for
each cost category, as well as total cost.
The maximum number of firms and establishments expected to be affected by the proposed rule
is reasonably certain. All entities that would be affected by the proposed rule should be registered with
FDA. If there are any that should be registered with FDA but are not, they are out of compliance with
FDA’s registration and listing requirements. Therefore, they would be unlikely to incur costs because if
they did not know that registration and listing requirements apply to them, then they probably would not
realize UDI applies to them. More uncertain are the share of establishments involved in labeling devices
for retail outlets only. These uncertainties are handled within bounding estimates ERG has made for each
cost category. These bounding estimates depend on factors that ERG has developed based on our sense of
the uncertainty in each cost category (see Table 8-1).
It is not as certain, however, how many establishments would meet an exception to the proposed
rule on the basis of labeling of devices such as custom devices that would be covered by the general
exceptions. ERG estimated that 1,141 establishments in the 1-4 employee size group and 238
establishments in the 5-9 employee size group would meet an exception for this reason. However, at
$1,333 and $4,862 per establishment (see Section Five),36
Table 8-1
respectively, if none of these establishments
met such an exception, this would add only $2.7 million per year to the costs of the rule (a 2 percent
increase).
presents ERG’s bounding assumptions for each of the cost categories. The first
category, Planning and Administrative Costs, is ERG’s best estimate of the time needed for companies to
undertake basic compliance preparations, although some entities might spend more or less time. The true
overall average across most entities is unlikely to vary too widely (i.e., an order of magnitude) from the
estimate. However, the requirement to meet the date format change in 90 days could have an effect on
36 Table 5-3 reports the cost for the 1-4 employee size group; the costs for the 5-9 employees size group is
calculated as the annualized cost for software for this group in Table 5-3 ($3,195) plus the annualized cost for all other requirements except DM for this size group in Table 5-2 ($1,667). The number of establishments excludes any estimates of establishments assumed to be using UPCs exclusively beyond those estimated under the proposed rule.
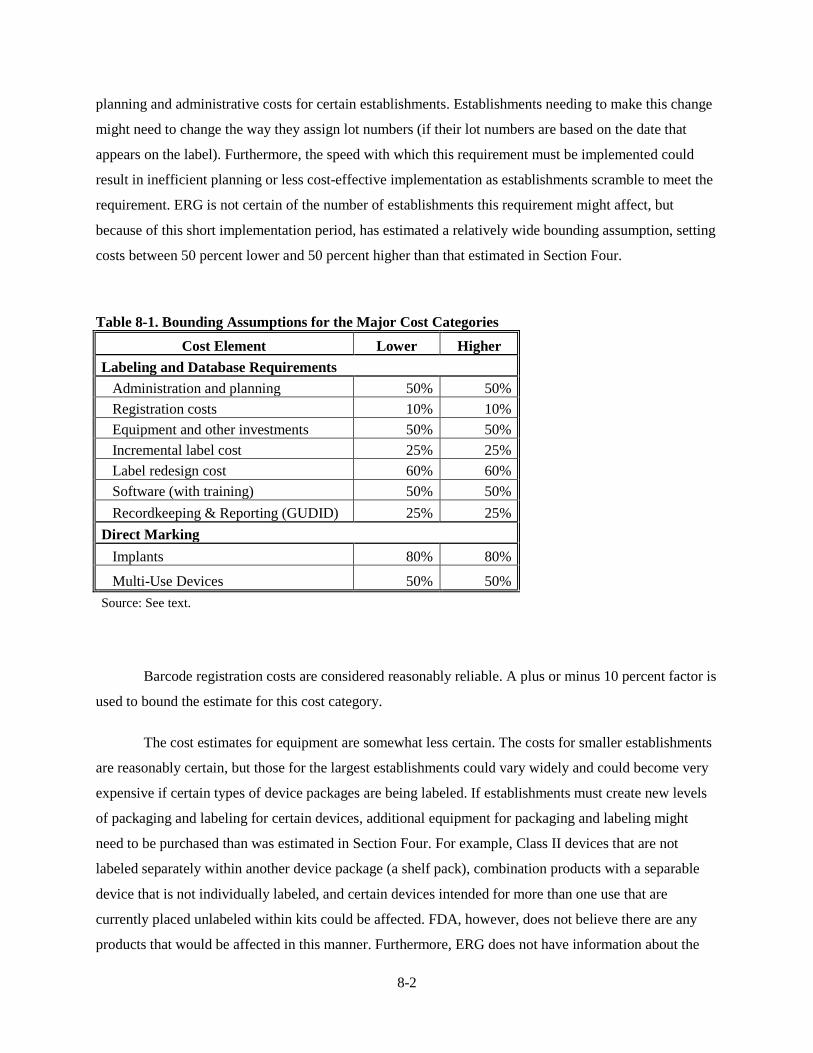
8-2
planning and administrative costs for certain establishments. Establishments needing to make this change
might need to change the way they assign lot numbers (if their lot numbers are based on the date that
appears on the label). Furthermore, the speed with which this requirement must be implemented could
result in inefficient planning or less cost-effective implementation as establishments scramble to meet the
requirement. ERG is not certain of the number of establishments this requirement might affect, but
because of this short implementation period, has estimated a relatively wide bounding assumption, setting
costs between 50 percent lower and 50 percent higher than that estimated in Section Four.
Table 8-1. Bounding Assumptions for the Major Cost Categories Cost Element Lower Higher
Labeling and Database Requirements Administration and planning 50% 50% Registration costs 10% 10% Equipment and other investments 50% 50% Incremental label cost 25% 25% Label redesign cost 60% 60% Software (with training) 50% 50% Recordkeeping & Reporting (GUDID) 25% 25% Direct Marking Implants 80% 80%
Multi-Use Devices 50% 50% Source: See text.
Barcode registration costs are considered reasonably reliable. A plus or minus 10 percent factor is
used to bound the estimate for this cost category.
The cost estimates for equipment are somewhat less certain. The costs for smaller establishments
are reasonably certain, but those for the largest establishments could vary widely and could become very
expensive if certain types of device packages are being labeled. If establishments must create new levels
of packaging and labeling for certain devices, additional equipment for packaging and labeling might
need to be purchased than was estimated in Section Four. For example, Class II devices that are not
labeled separately within another device package (a shelf pack), combination products with a separable
device that is not individually labeled, and certain devices intended for more than one use that are
currently placed unlabeled within kits could be affected. FDA, however, does not believe there are any
products that would be affected in this manner. Furthermore, ERG does not have information about the
8-3
prevalence of such devices or the number of establishments to which this situation might apply.
Alternatively, establishments would be able to judge which of several options (e.g., switching from
outside printing to in-house printing) are the least expensive for them in complying with UDI
requirements. ERG did not attempt to judge which options would be chosen on the basis of cost, which
could overstate the equipment costs. To account for these uncertainties, ERG has estimated uncertainty
factors of plus or minus 50 percent for equipment costs.
It is possible that few establishments would need additional materials for labels. The lower bound
of the material costs could be substantially smaller than our estimate because:
• The proposed rule allows for shelf packs to be labeled in lieu of individual items,
• 2D barcodes (which are very small) can be used to represent UDI information, and
• Label redesign should solve many label size issues without the need to expand label area.
However, ERG is also uncertain that the approximation of label materials costs (2 percent of all
packaging materials costs) and the potential cost increase associated with larger packaging/labeling areas
(estimated at 10 percent). We are also uncertain about the cost implications of the need to change label
designs within 90 days of implementation. This requirement could lead to less cost-effective means of
complying as establishments rush to meet the deadline, including, possibly, the need to go through two
separate rounds of label redesign to accommodate, first, the date format change, and second, the UDI
change. However, we are not certain of the number of such affected entities and may have overstated the
costs under the timing assumption that all affected establishments would redesign labels in the first year.
Device labelers that are currently required to have dates on their labels have a previously established date
format and are not affected by the proposed rule requirement. The number of labelers who choose to use a
date on their labels is not known, but could be relatively small. All of these uncertainties and assumptions
could make costs too low or too high. An uncertainty factor of plus or minus 25 percent has been chosen
for this cost category.
Label redesign costs are more speculative, given the range of technical, regulatory, and marketing
considerations at play. It is not known how many establishments might be able to integrate UDI
requirements into usual label redesign cycles, which could reduce the incremental cost of label redesign,
although the long lead times offered by the proposed implementation schedule implies that many
establishments might be able to do this (but the number who must meet an earlier deadline for date format
changes is not known). Alternatively, costs could be much higher at establishments with unusual
8-4
packaging and labeling issues, including any that might be affected by the need to label and package at a
new level. A plus or minus 60 percent factor is used to create the upper and lower bound estimate for this
cost item.
Software costs are also considered highly speculative. ERG believes that costs could be
overstated because it is not certain how much of the integration costs would be performed as a result of
complying with the proposed rule and how much would be performed as a result of corporate preferences
for integration. The integration would, however, yield benefits in terms of recordkeeping and reporting
cost savings, so the lower bound factor reflects the judgment that some integration might be performed to
reduce incremental costs of recordkeeping and reporting. ERG estimates that uncertainty factors of plus
or minus 50 percent are reasonable for this cost item. GUDID costs are considered reasonable estimates,
so have been given factors of plus or minus 25%.
Direct marking costs range in their certainty. Implants are considered the most uncertain, due to
the paucity of data about the extent to which implants are currently directly marked and whether extensive
health and safety testing might be required among those not currently marked. Although contacts have
indicated that most implants that can be marked (subject to size and material constraints) are directly
marked and that health and safety issues should not arise, ERG judges that information is too limited to
reduce the uncertainty and that higher costs for marking implants could arise. On the other hand, if all of
the implants currently able to be marked are being marked, and those not currently marked would meet
the exceptions for direct marking, costs for marking implants could be overstated. Additionally, if
“technologically feasible” implies that a plain-text UDI must be marked, even if it must be magnified to
be read, this could substantially increase costs. If any exceptions needed to be made on the basis of health
and safety, which could be a much lengthier process than the exception process considered in Section
Four, costs for exceptions could be higher. Also, if FDA were to deny a portion of the exceptions
currently estimated to be requested, substantially more establishments would need to install equipment,
increasing the equipment and operating costs for DM. Because of all these uncertainties, ERG estimates
an uncertainty factor of plus or minus 80 percent.
For multi-use devices, ERG believes the uncertainty is significant, again due mainly to the
paucity of data on current marking practices and, to a lesser extent than that for implants, the issue of
technological feasibility. Therefore, ERG has selected a factor of plus or minus 50 percent to calculate
bounding estimates.
8-5
These factors produce the bounding estimates shown in Table 8-2. As the table shows, with
uncertainty considered (and with no implementation schedule used), ERG has estimated that the low end
of the cost of the proposed rule to U.S. industry would be $66.3 million per year, where the high end of
the cost of the proposed rule would be $193.8 million per year, compared to the central-estimate costs to
U.S. industry of $130.1 million per year.
ERG also performed a cost bounding estimate for the Class I Static Barcoding Alternative
discussed in Section 6.6. After reviewing the uncertainty ranges in Table 8-1, ERG determined that these
ranges sufficiently captured the uncertainty not only in the costs presented in Section 4, but also the cost
savings presented in Section 6.6 and has not changed those assumptions. Then, using the costs shown in
Table 6-41, ERG recalculated results for the bounding table using the lower costs for the Class I Static
Barcoding Alternative and presented the results in Table 8-3. As the table shows, with uncertainty
considered (and with no implementation schedule used), ERG has estimated that the low end of the cost
of the Class I Static Barcoding Alternative to U.S. industry would be $44.9 million per year, where the
high end of the cost of the alternative would be $131.8 million per year, compared to the central-estimate
costs to U.S. industry of $88.4 million per year.
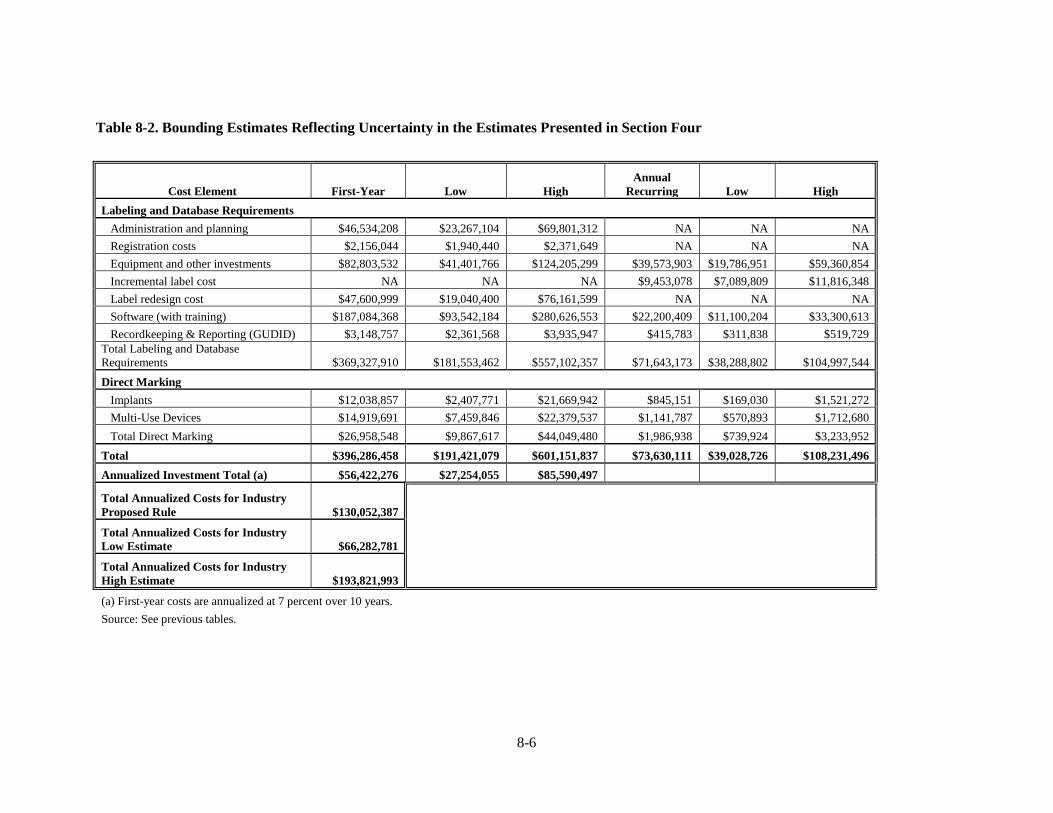
8-6
Table 8-2. Bounding Estimates Reflecting Uncertainty in the Estimates Presented in Section Four
Cost Element First-Year Low High Annual
Recurring Low High Labeling and Database Requirements Administration and planning $46,534,208 $23,267,104 $69,801,312 NA NA NA Registration costs $2,156,044 $1,940,440 $2,371,649 NA NA NA Equipment and other investments $82,803,532 $41,401,766 $124,205,299 $39,573,903 $19,786,951 $59,360,854 Incremental label cost NA NA NA $9,453,078 $7,089,809 $11,816,348 Label redesign cost $47,600,999 $19,040,400 $76,161,599 NA NA NA Software (with training) $187,084,368 $93,542,184 $280,626,553 $22,200,409 $11,100,204 $33,300,613 Recordkeeping & Reporting (GUDID) $3,148,757 $2,361,568 $3,935,947 $415,783 $311,838 $519,729 Total Labeling and Database Requirements $369,327,910 $181,553,462 $557,102,357 $71,643,173 $38,288,802 $104,997,544 Direct Marking Implants $12,038,857 $2,407,771 $21,669,942 $845,151 $169,030 $1,521,272 Multi-Use Devices $14,919,691 $7,459,846 $22,379,537 $1,141,787 $570,893 $1,712,680 Total Direct Marking $26,958,548 $9,867,617 $44,049,480 $1,986,938 $739,924 $3,233,952 Total $396,286,458 $191,421,079 $601,151,837 $73,630,111 $39,028,726 $108,231,496 Annualized Investment Total (a) $56,422,276 $27,254,055 $85,590,497
Total Annualized Costs for Industry Proposed Rule $130,052,387
Total Annualized Costs for Industry Low Estimate $66,282,781
Total Annualized Costs for Industry High Estimate $193,821,993
(a) First-year costs are annualized at 7 percent over 10 years. Source: See previous tables.
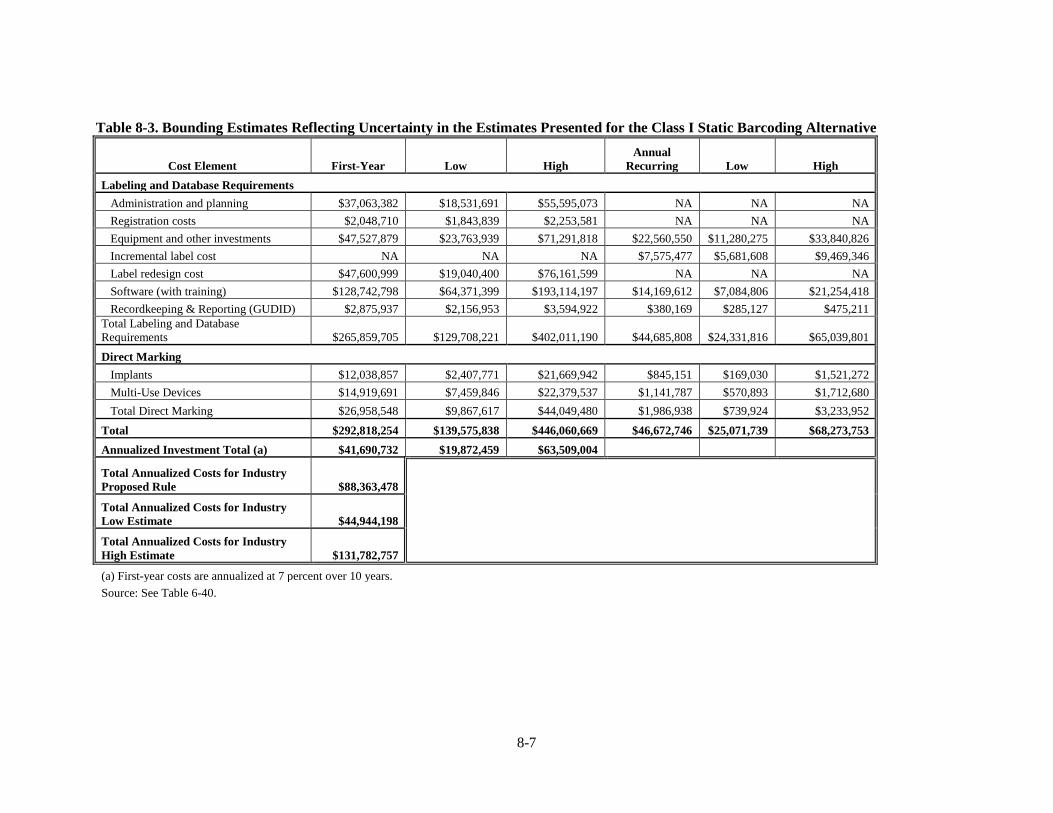
8-7
Table 8-3. Bounding Estimates Reflecting Uncertainty in the Estimates Presented for the Class I Static Barcoding Alternative
Cost Element First-Year Low High Annual
Recurring Low High Labeling and Database Requirements Administration and planning $37,063,382 $18,531,691 $55,595,073 NA NA NA Registration costs $2,048,710 $1,843,839 $2,253,581 NA NA NA Equipment and other investments $47,527,879 $23,763,939 $71,291,818 $22,560,550 $11,280,275 $33,840,826 Incremental label cost NA NA NA $7,575,477 $5,681,608 $9,469,346 Label redesign cost $47,600,999 $19,040,400 $76,161,599 NA NA NA Software (with training) $128,742,798 $64,371,399 $193,114,197 $14,169,612 $7,084,806 $21,254,418 Recordkeeping & Reporting (GUDID) $2,875,937 $2,156,953 $3,594,922 $380,169 $285,127 $475,211 Total Labeling and Database Requirements $265,859,705 $129,708,221 $402,011,190 $44,685,808 $24,331,816 $65,039,801 Direct Marking Implants $12,038,857 $2,407,771 $21,669,942 $845,151 $169,030 $1,521,272 Multi-Use Devices $14,919,691 $7,459,846 $22,379,537 $1,141,787 $570,893 $1,712,680 Total Direct Marking $26,958,548 $9,867,617 $44,049,480 $1,986,938 $739,924 $3,233,952 Total $292,818,254 $139,575,838 $446,060,669 $46,672,746 $25,071,739 $68,273,753 Annualized Investment Total (a) $41,690,732 $19,872,459 $63,509,004
Total Annualized Costs for Industry Proposed Rule $88,363,478
Total Annualized Costs for Industry Low Estimate $44,944,198
Total Annualized Costs for Industry High Estimate $131,782,757
(a) First-year costs are annualized at 7 percent over 10 years. Source: See Table 6-40.

REFERENCES
AdvaMed. 2004. Automatic identification in the medical device supply chain: A survey report. Available at http://www.advamed.org/NR/rdonlyres/84BC292C-91DA-49AE-8630-7973DC4BB250/0/auto_id_survey.pdf.
Allen, D. 2004. Package Coding and Printing. Pharmaceutical and Medical Packaging News, May. Available at http://www.pmpnews.com/article/package-coding-and-printing.
American Hospital Association (AHA). 2010. Chartbook: Trends Affecting Hospitals and Health Systems Appendix 3: Supplementary Data Tables Utilization and Volume. Available at http://www.aha.org/aha/trendwatch/chartbook/2010/appendix3.ppt#257,2,Table.
Barcodesinc.com 2008. Handheld Barcode Scanners. Available at http://www.barcodediscount.com/cats/barcode-scanners/handheld.htm.
Batesko, B. 2006. Telephone Conversation between Bob Batesko, Bell-Mark, and Ayesha Berlind, ERG. June 29, 2006.
Bureau of Labor Statistics (BLS). 2010. Employer Costs for Employee Compensation Table 5. Private industry, by major occupational group and bargaining status (June 9, 2010 Release). Available at http://www.bls.gov/news.release/ecec.t05.htm.
Bureau of Labor Statistics (BLS). 2009. National Industry-Specific Occupational Employment and Wage Estimates - May 2009. Available at http://www.bls.gov/oes/current/oessrci.htm.
Bureau of Labor Statistics (BLS). 2007. International Comparisons of Hourly Compensation Costs for Production Workers in Manufacturing, Supplementary Tables. Table 1: Indexes of Hourly Compensation Costs in U.S. Dollars (U.S. = 100).
Direct Marking Manufacturer A. 2010. Email between Direct Marking Manufacturer A and Carlie McCullough, ERG. May 19, 2010.
Eastern Research Group, Inc. (ERG) 2002. Analysis of Medical Device Industry Procedures and Costs for Revising Labeling. Final Report. August 28.
GS1. 2008. Telephone Conversation between Dan Wilkenson and Tim Welch, GS1, and Anne Jones, ERG. August 4, 2008.
Hackett, E. 2002. In-line Printing on Tyvek. Available at http://www.pmpnews.com/article/line-printing-tyvek.
Hankin, B. 2010. Telephone Conversation between Bob Hankin, HIBCC, and Anne Jones, ERG. May 18, 2010.
Health Industry Business Communications Council (HIBCC). 2010. Labeler Identification Application. Available at http://www.hibcc.org/AUTOIDUPN/LICApp.pdf.
Hohberger, C. 2006. Telephone Conversation between Clive Hohberger, Zebra Technology Corporation, and John Eyraud, ERG. January 10, 2006.
Internal Revenue Service (IRS). 2007. Corporation Source Book.
R-2
Mara, Charles. Personal communication between John Eyraud of ERG and Charles Mara, Consultant, Concord, MA. June 17, 2010.
Mass Group. 2007. Concatenated Barcode Product Marking Scenarios. Prepared for Eastern Research Group, Inc.
Medical Device Manufacturer A. 2006. Telephone Conversation between Medical Device Manufacturer A and Ayesha Berlind, ERG. May 1, 2006.
Medical Device Manufacturer B. 2006. Email between Medical Device Manufacturer B and ERG. June 26, 2006.
Medical Device Manufacturer C. 2006. Telephone Conversation between Medical Device Manufacturer C and Ayesha Berlind, ERG. June 15, 2006.
Medical Device Manufacturer D. 2006. Telephone Conversation between Medical Device Manufacturer D and Ayesha Berlind, ERG. June 24, 2006.
Medical Device Manufacturer E. 2006. Email between Medical Device Manufacturer E and ERG. August 9, 2006.
Medical Device Manufacturer F. 2006. Telephone Conversation between Medical Device Manufacturer F and Ayesha Berlind, ERG. July 26, 2006.
Medical Device Manufacturer G. 2007. Telephone Conversation between Medical Device Manufacturer G and ERG.
Morin, P. 2006. Telephone Conversation between Philip Morin, Morin Automation, and John Eyraud, ERG. July 26, 2006.
Pitts, J. 2006. Telephone Conversation between John Pitts, Domino Amjet Co., and John Eyraud, ERG. July 25, 2006.
Rivera, S. 2009. Telephone Conversation between Sara Rivera, California Department of Health Services (MediCal), and ERG. January 26, 2009.
Secunda, J. 2010. Telephone Conversation with Jeff Secunda, AdvaMed, and ERG. April 1, 2010.
Sherman, J. 2006. Telephone Conversation between John Sherman, Defense Medical Logistics Standard Support Program Office, and John Eyraud, ERG. March 7, 2006.
Small Business Administration (SBA). 2006. Firm Size Data. Available at http://www.sba.gov/advo/research/data.html#us.
Small Manufacturer A. 2008. Telephone Conversation between Small Manufacturer A and Anne Jones, ERG. March 3, 2008.
Small Manufacturer B. 2008. Telephone Conversation between Small Manufacturer B and Anne Jones, ERG. July 16, 2008.
Sponge Manufacturer A. 2010. Telephone Conversation between Sponge Manufacturer A and Carlie McCullough, ERG. June 2, 2010.

R-3
Sponge Manufacturer B. 2010b. Telephone Conversation between Sponge Manufacturer B and Carlie McCullough, ERG. June 2, 2010.
Sponge Manufacturer B. 2010a. Telephone Conversation between Sponge Manufacturer B and Carlie McCullough, ERG. June 16, 2010.
Summit Publishing Company. 2000. Medical Device Maker Says Goodbye to Extra Labels and Replaces Them With On-Line Thermal Transfer Printing. Available at http://www.bell-mark.com/cust_applications/medicaldevice2.html.
U.S. Census Bureau 2010a. Economic Census- 2007 Data. Available at http://www.census.gov/econ/census07/index.html.
U.S. Census Bureau 2010b. County Business Patterns (NAICS), 2007 Data. Available at http://censtats.census.gov/cgi-bin/cbpnaic/cbpsel.pl.
U.S. Food and Drug Administration (FDA) 2010a. Registration & Listing Database, Online Version.
U.S Food and Drug Administration (FDA) 2010b. Product Codes Database, Online Version.
U.S. Food and Drug Administration (FDA) 2002. General Principals of Software Validation: Final Guidance for Industry and FDA Staff. Available at http://www.fda.gov/medicaldevices/deviceregulationandguidance/guidancedocuments/ucm085281.htm.
Vaczek, D. 2006. Facing A Bar Code Deadline. Available at http://www.pmpnews.com/article/facing-bar-code-deadline.
Vendor A. 2010. Telephone Conversation and Email between Vendor A and Carlie McCullough, ERG.
Vendor B. 2010. Telephone Conversation and Email between Vendor B and Carlie McCullough, ERG.
Vendor C. 2010. Telephone Conversation and Email between Vendor C and Carlie McCullough, ERG.
Villotti, R. 2010. Telephone Conversations and Emails between Ralph Villotti, Telesis Technology, and Carlie McCullough, ERG. May 4, May 17, and June 11, 2010.
Zebra Technologies. 2005. Planning a DoD UID Bar Code Marking System. Application White Paper. Available at http://www.zebra.com/id/zebra/na/en/documentlibrary/whitepapers/dod_uid_barcode_marking_system.DownloadFile.File.tmp/WP13934_UID_Apr06.pdf?dvar1=White%20Paper&dvar2=Planning%20a%20DoD%20UID%20Bar%20Code%20Marking%20System.%20A%20pra.
Zitella, L. 2006. Telephone Conversation between Leo Zitella, Greydon, Inc., and John Eyraud, ERG. July 26, 2006.

A-1
APPENDIX A
DE V E L OPM E NT OF C OUNT S OF L AB E L E R S POT E NT I AL L Y SUB J E C T T O T H E PR OPOSE D R UL E
Definition of Labeler in the Draft Proposal
The draft proposal (Version 4, dated December 17, 2009) requires a label placed on a device to
bear a unique device identifier, subject to a few exceptions. Therefore, an entity that labels a device
would, in most cases, be affected by the proposal.
The definition of a labeler is as follows:
Labeler means—(A) any person who causes a label to be applied to a device with the intent that the device will be introduced into interstate commerce without any subsequent replacement or modification of the label; (B) any person who causes the label of a device to be modified with the intent that the device will be introduced into interstate commerce without any subsequent replacement or modification of the label.
This definition is subject to the following limitation:
The term labeler does not include a person who labels a device, or who modifies the label of a device, pursuant to the instructions of the person who places the device into interstate commerce. Instead, the person who places the device into interstate commerce is deemed the labeler.
FDA’s Registration and Listing Database
To determine who is a labeler, we turned to FDA’s registration and listing database. The
registration and listing database contains the names, addresses and device types of all entities responsible
for reporting to FDA about medical devices they handle in some way. All entities that would be
considered a labeler should be registered and list each of their devices in this database. However, not all
registrants are labelers.
Table A-1 presents the list of all domestic entities that are involved in some manner with medical
devices. Foreign firms generally fall into similar categories.37
37 The only difference is the category of foreign exporter of devices located in a foreign country. Unless
such an establishment also manufactures or repackages/relabels, it is not a labeler. This establishment type appears in the database as “export device to United States but perform no other operation on device.”
The table indicates who must register and
list. It also provides an indication of who should be counted as a labeler and the rationale for this
determination (FDA’s database does not indicate who must label, but the type of establishment and

A-2
Table A-1. Identification of Labelers
Type of Establishment Register List Count as Labeler? Rationale
Manufacturer Yes Yes Yes The manufacturer of a listed device is always a labeler
Manufacturer of Custom Device Yes Yes Yes* Appears as a manufacturer in the database; would most likely not be affected by UDI requirements
(meet an exception in proposal) Manufacturer of components that are packaged and labeled for distribution
Yes Yes Yes Appears as a manufacturer in the database
Manufacturer of components distributed only to finished device manufacturer
No No No Do not appear in the registration and listing database
U.S. Manufacturer of export only device Yes Yes No Appears separately from manufacturers in database; would not be affected by UDI proposal
Repackager or Relabeler Yes Yes Yes Modifies the label; appears as repackager/relabeler in the database
Contract manufacturer who distributes device for specification developer
Yes Yes No Applies label pursuant to instructions (specification developer registers and lists device); appears as
custom manufacturer in database Contract manufacturer who does not commercially distribute
No No No Does not appear in the database
Contract manufacturer of component No No No Does not appear in database Contract labeler or packager No No No Does not appear in database Contract sterilizer who distributes the device Yes Yes No Unless they are a relabeler, they do not change the
label, therefore any sterilizer not also listed as relabeler is not a labeler; appear in database as
contract sterilizer Contract Sterilizer who does not distributes the device
No No No Does not appear in database
Kit assembler Yes Yes Yes Subset of repackager/relabeler establishment type Domestic distributor No No No Does not appear in database
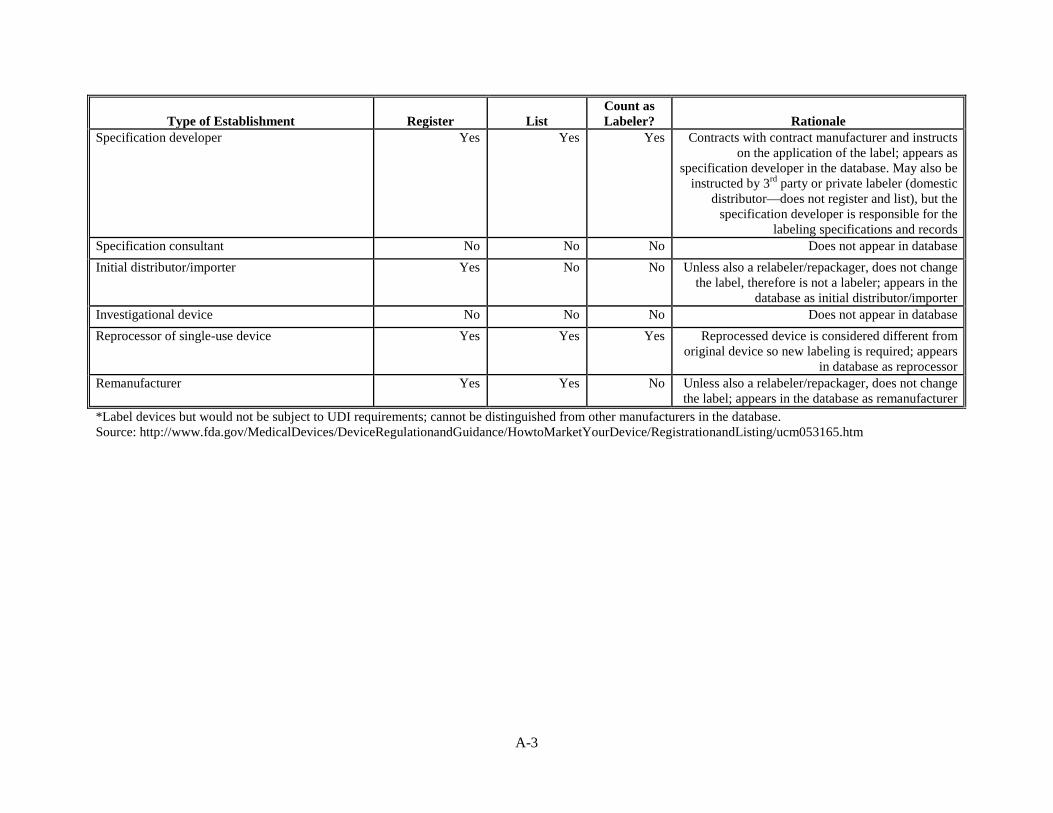
A-3
Type of Establishment Register List Count as Labeler? Rationale
Specification developer Yes Yes Yes Contracts with contract manufacturer and instructs on the application of the label; appears as
specification developer in the database. May also be instructed by 3rd party or private labeler (domestic
distributor—does not register and list), but the specification developer is responsible for the
labeling specifications and records Specification consultant No No No Does not appear in database Initial distributor/importer Yes No No Unless also a relabeler/repackager, does not change
the label, therefore is not a labeler; appears in the database as initial distributor/importer
Investigational device No No No Does not appear in database Reprocessor of single-use device Yes Yes Yes Reprocessed device is considered different from
original device so new labeling is required; appears in database as reprocessor
Remanufacturer Yes Yes No Unless also a relabeler/repackager, does not change the label; appears in the database as remanufacturer
*Label devices but would not be subject to UDI requirements; cannot be distinguished from other manufacturers in the database. Source: http://www.fda.gov/MedicalDevices/DeviceRegulationandGuidance/HowtoMarketYourDevice/RegistrationandListing/ucm053165.htm
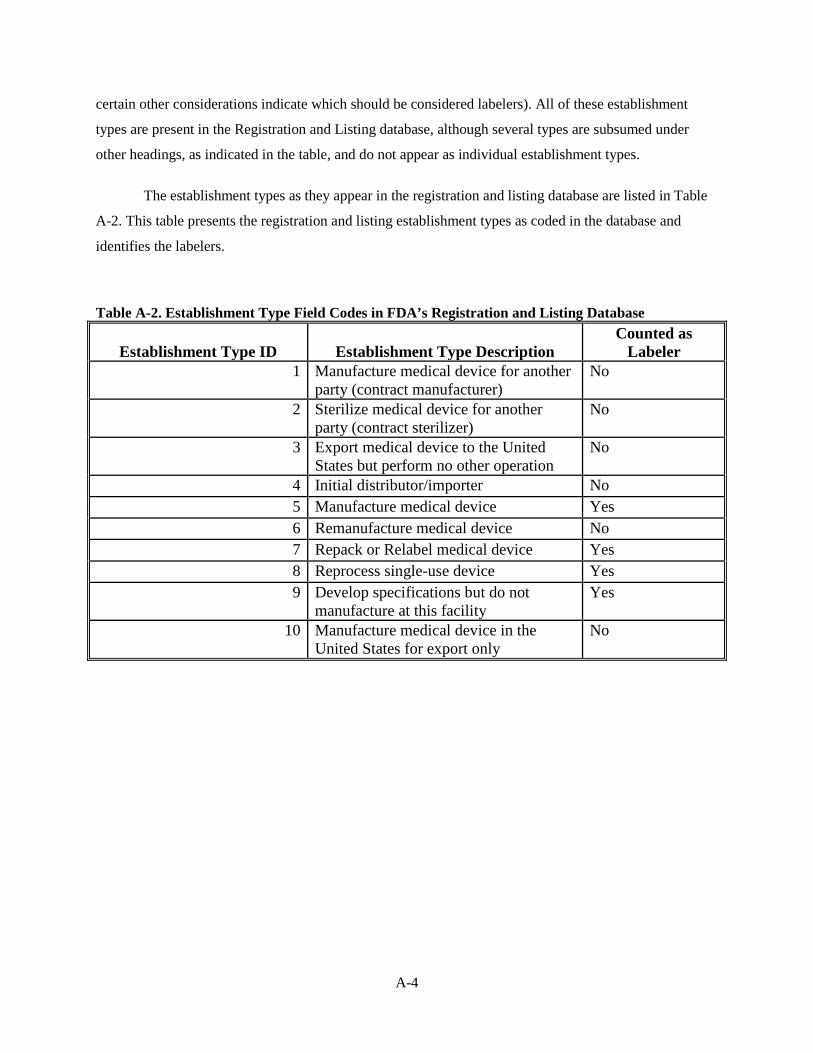
A-4
certain other considerations indicate which should be considered labelers). All of these establishment
types are present in the Registration and Listing database, although several types are subsumed under
other headings, as indicated in the table, and do not appear as individual establishment types.
The establishment types as they appear in the registration and listing database are listed in Table
A-2. This table presents the registration and listing establishment types as coded in the database and
identifies the labelers.
Table A-2. Establishment Type Field Codes in FDA’s Registration and Listing Database
Establishment Type ID Establishment Type Description Counted as
Labeler 1 Manufacture medical device for another
party (contract manufacturer) No
2 Sterilize medical device for another party (contract sterilizer)
No
3 Export medical device to the United States but perform no other operation
No
4 Initial distributor/importer No 5 Manufacture medical device Yes 6 Remanufacture medical device No 7 Repack or Relabel medical device Yes 8 Reprocess single-use device Yes 9 Develop specifications but do not
manufacture at this facility Yes
10 Manufacture medical device in the United States for export only
No

A-5
Therefore, four establishment type codes were identified as labelers: (5) manufacturers, (7)
repackagers/relabelers, (8) reprocessors, and (9) specification developers.
Method for Using the Registration and Listing Databases to Count Labelers
The online registration and listing database is organized as several relational databases, most of
which can be linked using registration key, device listing ID, contact ID, or other field found in one or
more of the database tables. The following databases were used to identify the count of firms and
establishments considered likely to be affected by the draft proposed rule:
Registration—The registration database contains all current and pending registrants (as of March
4, 2010, FDA’s latest update available online when this analysis was performed). It establishes the
registration key, a field that uniquely identifies all registrants, active and pending, and is the link between
the Registration database and several of the other databases (pending registrants do not have a registration
number yet, so registration number cannot be used as a link among the various databases).
• Listing Establishment Type—This database contains the IDs for current devices listed by all registrants required to list and indicates the establishment type (Table A-2). The listing ID is not used at this time but it will become useful for linking to product codes that identify the type of device in the database named Listing PCD, also included among the online databases.
• Owner Operator—This database provides the firm name and ID (both owner operator ID and a contact ID) associated with the owner firm of the registrants in the Registration database.
• Contact Addresses—This database provides the address information for the firms in the Owner Operator database, which can be accessed using the contact ID found in the Owner Operator database.
•
The Registration database was filtered prior to any work to link databases. We eliminated all
records associated with agents rather than establishments (since each establishment also has an agent and,
therefore, there are two records associated with each registrant). To do this, we used the address type
field. An “F” in this field identified records associated with a facility; a “U” identified information
associated with the facility’s agent. All records with a “U” in that field were deleted. The Registration
database needed to be linked to the Listing Establishment Type database to identify registrants by type
(Table A-2). Thus, we linked the Registration database to the Listing Establishment Type using the
registration key. A number of registration keys drop out in this linked database; these registration keys are
A-6
those registrants with no listings. Registrants with no listings are (barring database errors) initial
distributors/importers (the only group required to register but not list; see Table A-1).
We then created a database of the linked Registration and Listing Establishment Type, which
included the registrant (as represented by the registration key), much of their registration data, including
address, the information device listing ID, and the establishment type code. Establishment type, however,
depends on the device listing, so a registrant can be listed as more than one establishment type. For
example, a registrant might manufacture one listed device, relabel another, and custom manufacture a
third. Therefore, we determined that in order to ensure that no affected entities were missed and that none
were double counted, we ranked the establishment types and queried the database in the following way.
We ranked manufacturers first, reprocessors second, specification writers third, repackagers/relabelers
fourth, remanufacturers fifth, sterilizers sixth, custom manufacturers seventh, and all others last.
With this ranking scheme in mind, we first queried the master database of registrants and listings
for all registrants with a listing associated with the manufacturer ID (establishment type = 5). We pulled
out of the master database all of these registrants, including all of the data found in the master database to
create a separate database of all manufacturers. All of these registrants, therefore, manufacture at least one
listed device.
The remaining master database no longer contained manufacturers. We then identified all
registrants with a device listing associated with reprocessing among those registrants remaining in the
master database, pulled these records and created a database of reprocessors. The master database, now
with manufacturers and reprocessors removed, was then queried to identify the specification writers, and
so on. At the end of this process we had created eight databases: manufacturers, reprocessors,
specification developers, repackagers/relabelers, remanufacturers, sterilizers, custom manufacturers, and
all others. Note that the databases for remanufacturers, sterilizers, custom manufacturers and all others do
not contain any registrants that have been identified as performing any functions related to labeling for
any listed device.
At this point we queried each of these databases to output unique registration key counts (each
registration key could be associated with numerous devices, so to identify numbers of registrants, rather
than numbers of device listings, unique registration keys needed to be identified). These counts are shown
in Table A-1 in the column labeled “Total Registrants.” Additionally, using the address information
included in the original Registration database (carried through to each establishment type database), we
were able to identify which establishments were domestic and which were foreign, using a field labeled

A-7
“Country Code” (US = domestic and all other codes = foreign). Unique registration key counts were then
identified for all domestic and foreign establishments in each of the establishment type databases (except
for the “all other” database, which was not analyzed further). These counts are shown in Table A-1 by
establishment type.
We then wanted to identify which of the foreign establishments were owned by foreign firms and
which were owned by domestic firms. Continuing to use the establishment type databases, we linked each
of the establishment type databases to the owner-operator file using the registration key. The owner-
operator file contains the contact ID, which was used to link to a contact address file that lists the owner-
operator address 38
Table A-2
.The owner-operator can be identified as foreign or U.S. based using the country code
in the contact address file. We then present information on all owner firms by whether those owners are
foreign or domestic and what types of labelers they own (see ). Note that double counting
occurs because some firms own more than one labeler type. We then counted unique registration keys to
count domestic or foreign establishments owned by domestic firms or domestic or foreign establishments
owned by foreign firms. This information is presented in Table A-1 by labeling establishment type.
One additional change was made manually to all tables. Two domestic reprocessing
establishments (with one domestic owner) were found to be missing device listing information in the
Device Listing Database as well as the Establishment Type Database, thus dropped out of this analysis.
ERG was familiar with these establishments based on our previous work in 2008 to identify reprocessors
when we last analyzed possible UDI impacts. FDA’s web-based search of the registration and listing
databases provides the correct listing information for these establishments, so they have been added into
the counts of reprocessors obtained from the downloaded databases.
38 Every registered establishment has an owner operator. The owner operator can be the official
correspondent or might assign another person to act as the official correspondent. When the owner operator opts to be the official correspondent, this means the owner operator address and the official correspondent address are the same and that the contact ID in the R&L database is the same (and there is no sub-account). If the owner operator assigns another person as official correspondent, this is set up as a sub-account. When the official correspondent is set up in a sub-account, this creates another contact ID. This contact ID has its own address. Therefore, the R&L file Contact Addresses contains both the owner operator contact IDs and the official correspondent contact IDs (but only if a sub-account has been set up) and there could be two different addresses associated with an establishment (owner operator and official correspondent). Because the owner operator is considered the legal corporate entity, the address associated with the owner operator defines whether that owner operator is a foreign or domestic entity; the address of the official correspondent would generally not be useful for identifying whether the registered establishment has a foreign affiliation.
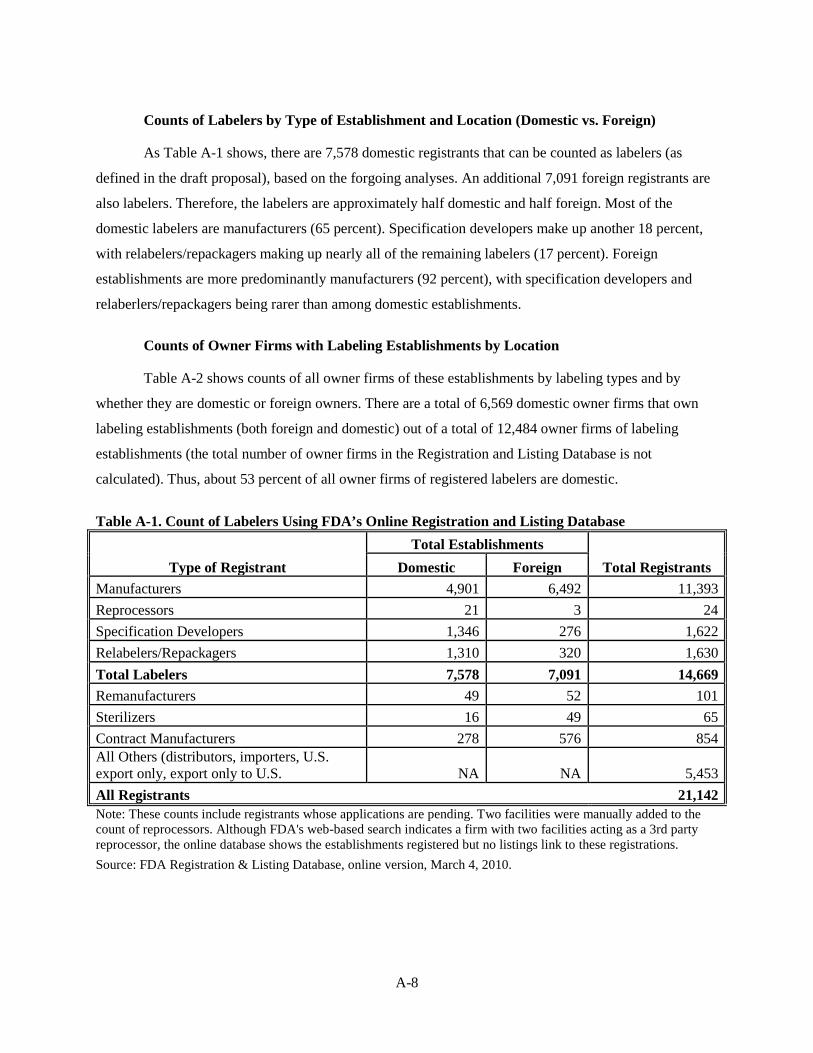
A-8
Counts of Labelers by Type of Establishment and Location (Domestic vs. Foreign)
As Table A-1 shows, there are 7,578 domestic registrants that can be counted as labelers (as
defined in the draft proposal), based on the forgoing analyses. An additional 7,091 foreign registrants are
also labelers. Therefore, the labelers are approximately half domestic and half foreign. Most of the
domestic labelers are manufacturers (65 percent). Specification developers make up another 18 percent,
with relabelers/repackagers making up nearly all of the remaining labelers (17 percent). Foreign
establishments are more predominantly manufacturers (92 percent), with specification developers and
relaberlers/repackagers being rarer than among domestic establishments.
Counts of Owner Firms with Labeling Establishments by Location
Table A-2 shows counts of all owner firms of these establishments by labeling types and by
whether they are domestic or foreign owners. There are a total of 6,569 domestic owner firms that own
labeling establishments (both foreign and domestic) out of a total of 12,484 owner firms of labeling
establishments (the total number of owner firms in the Registration and Listing Database is not
calculated). Thus, about 53 percent of all owner firms of registered labelers are domestic.
Table A-1. Count of Labelers Using FDA’s Online Registration and Listing Database
Type of Registrant Total Establishments
Total Registrants Domestic Foreign Manufacturers 4,901 6,492 11,393 Reprocessors 21 3 24 Specification Developers 1,346 276 1,622 Relabelers/Repackagers 1,310 320 1,630 Total Labelers 7,578 7,091 14,669 Remanufacturers 49 52 101 Sterilizers 16 49 65 Contract Manufacturers 278 576 854 All Others (distributors, importers, U.S. export only, export only to U.S. NA NA 5,453 All Registrants 21,142 Note: These counts include registrants whose applications are pending. Two facilities were manually added to the count of reprocessors. Although FDA's web-based search indicates a firm with two facilities acting as a 3rd party reprocessor, the online database shows the establishments registered but no listings link to these registrations. Source: FDA Registration & Listing Database, online version, March 4, 2010.

A-9
Table A-2. Number of Firms with Labeling Establishments Listed in FDA’s Registration and Listing Database
Firms Manufacturers Reprocessors Specification Developers
Repackagers/ Relabelers
All Labelers
Domestic 4,241 21 1,306 1,212 6,569 Foreign 5,440 4 242 330 5,915 Total Firms 9,681 23 1,548 1,542 12,484 Note: Sum of firms by specific establishment types will not add to all labelers because some firms own more than one type of establishment. A total of 211 domestic firms have been double counted (that is, the difference between the sum of all domestic labelers and the sum of all firms listed as manufacturers, reprocessors, specification developers and repackagers/relabelers is 211). Six firms listed two contact IDs, leading to double-counting when domestic and foreign firms are counted separately. The counts for these six firms were removed from the foreign count but not from the domestic count. Additionally, five foreign establishments are identified as being owned by both a foreign parent and a U.S subsidiary; they are counted as foreign owned. Finally, one firm with two establishments was added to the count of reprocessors; see Table A-1. Source: FDA Registration & Listing Database, online version, March 4, 2010.
Domestic and Foreign Establishments by Location of Owner Firm
Domestic owner firms do not own only domestic establishments and foreign owner firms also do
not own only foreign establishments. Table A-1 provides a count of establishments, foreign and domestic,
by the ownership location (foreign or domestic) of their owner firms. This information is useful for
identifying the potential numbers of firms and their establishments that would not be considered small
under Small Business Administration definitions. Foreign firms, even if owning U.S. establishments and
meeting SBA size criteria, would not be considered small businesses under SBA definitions. However,
U.S. firms, if they meet size criteria, even if a portion of their business is associated with a foreign
establishment, would be considered small businesses under SBA definitions. Note that only 226 domestic
establishments have a foreign owner firm, but 794 foreign establishments have a U.S. owner firm.
Generally, though, domestic establishments have domestic owner firms and foreign establishments have
foreign owner firms.

A-10
Table A-1. Numbers of Domestic and Foreign Establishments by Location of Owner Firm
Type of Labeler
Domestic Establishments Foreign Establishments
With U.S. Owner Firm
With Foreign Owner Firm Total
With U.S. Owner Firm
With Foreign Owner Firm
Manufacturers 4,748 153 4,901 715 5,777 Reprocessors 20 1 21 - 3 Specification Developers 1,324 22 1,346 49 227 Relabelers/Repackagers 1,260 50 1,310 30 290 Total Labelers 7,352 226 7,578 794 6,297 Source: FDA Registration & Listing Database, online version, March 4, 2010. An additional firm was added to domestic reprocessor establishments with U.S. owner firm. See Table A-1.

B-1
APPENDIX B
SUM M AR Y OF DE V I C E M ANUF AC T UR E R I NT E R V I E W S
ERG interviewed a selection of medical device manufacturers about the impacts of a UDI
requirement on their operations and their perceptions about the implications for the industry as a whole.
These manufacturers produce a wide range of medical devices, from implants to gloves. Most of them are
barcoding their products in some capacity.
These calls covered a wider range of assumptions than those on which the present analysis is
based, often addressing issues involving full serialization, direct marking, and labeling below the current
level of labeling. Based on the manufacturers’ comments, the smaller manufacturers might incur a
relatively large cost burden to convert to UDI because they have made fewer of the investments. The
larger manufacturers, however, because of the potentially greater complexity and automation of their
manufacturing lines, might also face high costs for integrating a UDI system into their current lines (e.g.,
Medical Device Manufacturer F in the discussion below, 2006). ERG also contacted manufacturers of
printing equipment to confirm some of the current trends regarding the printing technologies used by
medical device manufacturers.
Some of the manufacturers said they would prefer to print the barcode directly on the label, rather
than by adding a sticker, in order to avoid the testing required to ensure that the sticker adheres
(especially after sterilization). The manufacturers noted that changes are regularly made to medical device
labels. Changes occur regularly, ranging from 2 to 4 times a year. The manufacturer interviews are
summarized below.
Medical Device Manufacturer A
Medical device manufacturer A (2006) is barcoding products already and recently changed
barcode formats (from the Health Industry Bar Code, a US-based bar code standard, to the European
Article Number code) to facilitate greater international recognition of their label. Their barcode currently
identifies employed to identify the product and the product lot.
B-2
The cost to modify the structure of the barcode from the HIBCC to the EAN format was minimal.
The manufacturer already had digital printers that could easily convert from one barcode format to
another. The company paid $20,000 to $30,000 in registration costs to obtain the new barcode numbers
for their 27,000 products. Another $50,000 was spent on administrative tasks associated with the
changeover and on using the printer software to change the barcode structure.
Overall, their cost to modify the barcode was approximately $70,000 to $80,000. The
manufacturer noted that costs would be much higher for manufacturers who had not yet purchased
barcode printers or who did not have the “right” barcode printer.
Medical Device Manufacturer B
Medical device manufacturer B implemented barcoding in compliance with the basic requirement
that all medical and surgical supplies be marked with a universal product number (UPN) but has not
implemented the more demanding DOD UID requirement. 39
The company does not present lot or serial
numbers on its labeling. The company spent 2 years preparing for the UPN labeling task. Linear barcodes
are used on most of the products’ primary and secondary packaging, while a few products are labeled
with 2D barcodes.
The investment required to comply with the UPN requirement was limited because the company
already had the necessary printers. Two verification scanners were installed on each production line.
Significant IT costs were incurred to tie the barcode data to the company’s Enterprise Resource Planning
(ERP) system, which tracks manufacturing information. Personnel also needed to familiarize themselves
with the HIBCC standard and write SOPs for barcoding and the requisite training. Training was
conducted at every manufacturing plant. The manufacturer lost some label inventory, but the cost of label
redesign and label reapprovals far outweighed that of label inventory loss.
39 DOD requires that all medical and surgical supplies purchased by the Department must be marked with a
UPN to facilitate identification of such products and to expedite ordering and receiving these products. The UPN is encoded in a bar code on the packaging or device.

B-3
Medical Device Manufacturer C
Medical device manufacturer C has been compliant with the UPN initiative for the past 5 or 6
years using linear bar codes and has considered lot or serial number additions. They are fully compliant
with the UPN requirement on secondary packaging and 95 percent compliant on primary packaging. The
remaining 5 percent of products do not have enough space on the packaging to accommodate a bar code,
but this issue could be resolved with the purchase of new equipment.
In order to include the bar code on its product labels, the company had to purchase a new printing
plate for each of its 300 catalog numbers at a cost of roughly $500 each. Digital printers will be needed if
the firm is to print lot numbers on their labels. The company has not thus far attempted to print any UDI-
type information on their labels and has not wanted to modify their form, fill, and seal machines on each
of several packaging/labeling lines.
Planning for the UPN effort required 40 percent of a supervisor’s time and 30 percent of the time
for 4 subordinates for a year or roughly 3,200 hours. Assuming a modest overall hourly cost of $75 per
hour (fully loaded), this translates to a cost of $240,000.
For secondary packaging, the manufacturer changed to digital printing and spent $75,000 on 13
thermal transfer printers. Some primary packaging is still preprinted (roughly 20 percent), but all
secondary packaging is printed in-house. For the secondary packaging, they also purchased customized
software for quality control of labeling at a cost of $130,000. They employ 12 barcode verifiers for
production of 300 products. Further, validation of equipment and training required 20 percent of a
supervisor’s time for 8 months. The manufacturer noted that validation instructions are not readily
available, so they found the calibration of the equipment to be very challenging.
Packaging scrap loss was about $20,000 to $30,000. However, they are no longer holding such
inventories, so these losses would be less if they were to take on a similar project at the present time.
When asked to try to determine what it would cost them to go to a UDI system involving placing
a serialized UDI on existing packaging, the manufacturer indicated that putting on a serial number is a
huge project. ERG judged that printing a lot number on packages would also be a very large project and
generate as many new equipment requirements. They are not currently set up with a labeling system that

B-4
can put a unique serial or lot number on product labels. They have many primary packaging systems,
which form, fill, and seal packages. The lid is printed online and sealed. This type of system is widely
used in medical device manufacturing.
They currently use printing plates in a flexographic printing system. To print any variable
information on their labels, they would have to buy new printing and label application devices. The
manufacturer believes that a thermal transfer applicator device would be needed at $100,000 per machine
(a thermal transfer printer would also be needed). This machine would print, place and apply the label all
as one function.
They also estimated that they would need one verifier per line. In order to perform QA
verification on the output of the process, they’d need a barcode reader on each product. This facility has 4
automated and 10 manual lines and therefore they would need 14 verifiers. Equipment validations would
take months to do. The contact estimated that an engineer would need to spend two months on
“paperwork.”
While serialization is beyond the FDA scope, this company estimated that a serialization project
would involve a team, tying up resources for a year or two, or even longer. Software integration would be
needed. Their current system does everything for them, including planning production, assigning lot
numbers, and determining what to bill. In a serialized UDI system, the software would need to perform
additional functions. Software integration would cost $200,000-$250,000 plant wide. Additionally,
software validation is very involved. A total of 4 to 5 people’s time for a year would be needed for
software validation.40 This company judged that validation work would cost about $10,000 per line. If
validation is done well, product scrap rates probably will not be affected. Recurring costs include
additional QA staff, maintenance on equipment, and systems administration.41
Medical Device Manufacturer D
Medical device manufacturer D has implemented the DOD UID on its equipment that costs
$5,000 or more (mainly electromagnetic machines). They comply by adding a label that is similar to the
one already there and encoding it with the unique identifier. The costs to develop their system included 40 According to the manufacturer, equipment validation would entail 2 person-months of time. ERG
assumes this would not add appreciably to the overall labor needs of 4-5 person-years for software validation. 41 The latter two categories do not necessarily appear incremental to existing costs, however.

B-5
the investment cost of two thermal transfer Zebra printers at $5,000 each, printing ribbons, printer
software, and training. The manufacturer considered the DOD effort to have a relatively low start-up cost
but noted that uniquely identifying all medical devices (specifically, serialization) could generate much
higher costs. The products affected by the DOD requirement are often low-volume, made-to-order items.
Other medical devices are made in much larger quantities and thus the volume of labels that need to be
printed will be greater.
The manufacturer noted that the cost to implement unique identification can vary by product,
noting especially the technological challenge for marking implants. Directly marking an implant can
affect its clinical use as the mark could affect the smoothness of the device or present toxicological issues.
Other products, however, such as in-vivo products, that have some component that is outside the body,
such as catheters, are prime candidates for serialized unique identification. Manufacturer D also indicated
that at least 5 years would be needed to implement serialized unique identification.
Medical Device Manufacturer E
In this interview the company described its analysis of a full serialization requirement for its
devices. At present this manufacturer reported using only conventional lot numbering techniques. The
manufacturer reported lot sizes from a few units to over 100,000 items, with many lots numbering in the
thousands.
The manufacturer reported that implementation of a serialized UDI would require complex
manufacturing changes in each of more than a dozen plants in four countries. The manufacturer estimated
that production costs overall would increase by 5 percent. Included in this estimate are:
• Capital investments in specialized barcode printers, verifiers, and supporting computers and software;
• Incremental costs for new labels at a cost of $0.01 to $0.03 each. They estimated that 900 million labels would be needed;
• An increase in direct labor costs of 5 percent.
This company appeared to interpret the serialization concept as requiring direct marking on each
device rather than serialization at the existing level of labeling. This estimate, therefore, probably
overstates costs if serialization at the current level of labeling is to be employed.

B-6
Medical Device Manufacturer F
Manufacturer F, a large manufacturer, noted that the greatest challenge to implementing UDI will
be the enormous diversity of devices. Assuming that the diversity issue can be addressed, uniquely
identifying devices by assigning a serialized number to each item would still be a major challenge for the
industry. While the technology is available to get the serial number onto devices, reading the numbers
might pose a challenge for some further down the chain of distribution. UDI will also require electronic
printing and only a small percentage of firms are currently using these techniques.
This contact argued that serialization would be a very large effort for large companies. While they
may have the capital to invest in the changes required, it is a huge undertaking nonetheless. Small
companies would likely require 3 to 8 years for implementation, while large manufacturers might need 4
to 10 years.
The economic burden imposed by implementing serialization would vary with the number of
products and volume produced. Significant infrastructure would be required. First, it can be assumed that
UDI would require compliance with standards. These standards would need to be developed and larger
companies would assume a part of this requirement. Further, UDI would necessitate having a system in
place that allows tracking and tracing product through the chain of distribution. The infrastructure cost to
do this might be larger for small manufacturers because large manufacturers already have some of this in
place a result of working together with large health care product distributors. For the larger
manufacturers, the cost is in implementing it for the wide array of products. Also, one potential side effect
of serialization or of lot numbering will be more scrapped product. Product will need to be removed if the
label is incorrectly produced.
Assuming 5 products per production line, the cost to implement unique identification might be $3
million per line or more for a serialized barcode.42
These estimates include equipment changes, such as
the purchase of a printer, verifier, and software, and the associated validation. In addition, the
manufacturer noted that training of various personnel will be required, including 1 hour for packaging line
operators, 3 hours for those in distribution, and 10 to 15 hours for end users.
42 This cost is considered reflective of the highly automated and complex manufacturing scenario posited
by this manufacturer and is considered applicable to the larger manufacturers. If direct marking was required, that would increase those costs significantly (as much as another $3 million per line).
B-7
Medical Device Manufacturer G
A large manufacturer reported that a federally mandated UDI requirement would have no impact
on its operations, assuming that the federal requirement is consistent with the GS1 international standards
on product identification. The company has implemented a UDI system, employing the Global Trade
Identification Number (GTIN) protocol, fully throughout its organization. This manufacturer decided
several years ago to undertake a UDI-like implementation program in order to meet likely forthcoming
international requirements and as part of their overall business plan. The company uses the GTIN as the
internal identifier for each of its products.
The company has purchased a number of other medical device manufacturers, including some
relatively small companies (i.e., fewer than fifty employees) and all of these companies have been
brought within the umbrella of the company’s device identification system. The company representative
noted a lot of internal satisfaction with the decision to move toward UDI comprehensively. All parts of
the organization are subject to a consistent set of requirements.
The company could not estimate the cost of implementing UDI. The representative had sought to
obtain such information from some of the larger operating units but none of the divisions had been able to
reliably describe their costs. The move toward UDI was combined over time with enhancements of their
enterprise software program and could not be isolated. Corporate headquarters helped some of the
smallest business units in the company to implement UDI. The consistency of the UDI requirement across
divisions also facilitated the compliance actions for each division.
The company representative noted that the company purchased a number of common printers,
verifiers, and software packages across the operating divisions. The representative noted that the more
electronically integrated a company’s divisions are, the easier it will be develop a consistent UDI system.
Companies that use a lot of paper communications and are more loosely integrated will incur higher UDI
implementation costs.
Small Manufacturer A
This very small manufacturer acts mostly as a distributor (they import items and do catalog sales),
but they do manufacture two items that would be classified as medical devices. One is a voice

B-8
amplification system for people with voice problems, which FDA classifies as a Class II device. The other
is a cloth “handkerchief with ties” for covering stoma (holes in airways) to keep dust out. Therefore, only
two products would be affected by a barcoding requirement. They primarily do catalog sales, but
occasionally are called on by a pharmacy to provide for a customer, but they do not operate as a retail
operation (i.e., they don’t use UPCs on their labels). They consider themselves a “mom & pop” operation,
with four children helping out, for a total of 6 working.
Their production lines are completely manual, including labeling. They manufacture a group of
voice amplification systems and put them in a box. When they have assembled 25 or so items, they then
affix labels and put them in inventory, when they determine that they are low on inventory, the put
together another 25 systems. They make about 200 systems per year. For stoma cloths, they bring in the
material, stitch up the cloths, put 5 in a bag, then when they have accumulated about 25, they label them,
and put them in inventory. They make about 50 bags of 5 stoma cloths a year. If they had to put a barcode
on their labeling, they’d use a supplemental sticker.
They currently have a barcode on one product (but not one they themselves manufacture, so this
is a relabeling exercise). The customer is a California public utility commission. The commission orders a
few artificial larynxes per year. The commission requested that the Very Small Manufacturer A affix a
barcode, but didn’t specify what barcode to use. The barcode is just a product identifier (they are not
registered with GS1 or HIBCC). Our contact was not sure what type of barcode it was. The barcoding
software they purchased offered a variety, and they picked one out that looked like it might be useful. It
was a 16-digit code where the numbers appear under the bars [linear barcode; static]. Their customer was
not certain what they wanted, but did approve the one selected. They use an inkjet printer to print the
barcode on the labels.
If they were required to barcode their other items, they would continue with the same labels and
would just add a supplemental label to their current labels.
Our contact mentioned that he has had some experience with redesigning labels. When asked to
consider what it might cost to add a supplemental label, he stated that he estimated the entire cost of
everything, including planning, redesign, labor to put on extra sticker, purchasing equipment, software,
etc. to cost about 50 cents per label, which he did not think would be different whether a variable or static
barcode was required. This is not a problem for their voice amplifier, since they make about a $60-$70
profit on each one, but their profit on their stoma cloths is much smaller—about $1.85 per bag of 5. A 50
B-9
cent per label increase in cost would be large on a per-item basis. Overall, though he thought costs would
be small [about $100 per year for the 200/per year amplifier and $300 per year for the 50/month stoma
cloths bags.]
Small Manufacturer B
Very Small Manufacturer B is an Original Equipment Manufacturer (OEM), with 10-14 persons
who serves many other companies that market and distribute the product under their own name. They
produce various electrocardiographs (Class II devices) and medical recorders. They operate one
production line, but it is operated as Just in Time, and they can change the line any time to another
product. The line is manual and labels are applied manually at the end of the process and labels change
depending on which customer has ordered the equipment (the customer’s name, mostly manufacturers or
distributors, is the one that goes on the label, not theirs). They do not currently do any barcoding and
outsource all of their label printing.
If they had to add a barcode to their labeling, they would probably continue to use their contract
printer, but might bring it in house if given enough lead time and had a chance to redesign with this in
mind. They need to label inside battery boxes in some cases; printing equipment needed for those types of
labels is very expensive; a redesign might help avoid a label there and have it go outside the box. Their
outside printer can handle barcoding without any problem, but variable barcoding would be more
expensive. Some of their products are serialized; their printer handles this, but with barcoding, another
layer of complexity is added. Also, another issue on some of their devices is that the labels need to
withstand washing.
When asked to consider what effect a barcoding requirement might have on their costs, the
representative indicated that he thought it was mostly just a per-label cost increase if variable information
is needed in the barcode. If only static information was required, he did not believe any costs would be
incurred. If variable information was required on labels that are not already serialized, he thought the
costs could be 4-5 times as much per label (now on the order of a few cents). On small orders (some of
their customers only order 2 to 500 units) variable labels could cost as much as $2-4 per label; for large
lot customers, the cost might be $0.50- $0.60 per label. Overall, though, in terms of total costs, he did not
expect costs to be significant.

B-10
He felt that a barcode requirement (static or variable) would cause no real problems, except that
he felt they might be getting into size issues on some of their devices that are very small, with limited
labeling room on the device, especially if FDA wanted both a human readable and machine readable
number on the label.


![Unique Device Identification (UDI) · Under 21 CFR 801.45, “[a] device that must bear a unique device identifier (UDI) on its label must also bear a permanent marking providing](https://img.pdfslide.us/doc/110x75/5fc34384055a3d13c55ed596/unique-device-identification-udi-under-21-cfr-80145-aoea-device-that-must.jpg)