Embed Size (px)
Citation preview
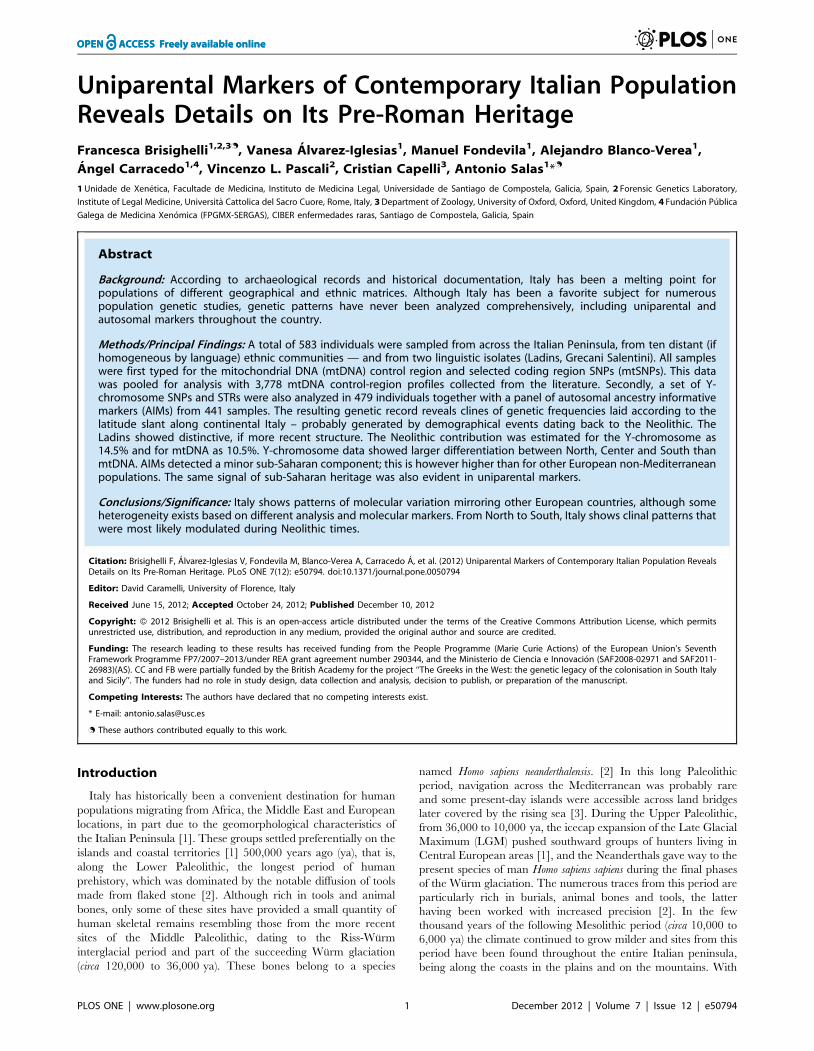
Uniparental Markers of Contemporary Italian PopulationReveals Details on Its Pre-Roman HeritageFrancesca Brisighelli1,2,3., Vanesa Alvarez-Iglesias1, Manuel Fondevila1, Alejandro Blanco-Verea1,
Angel Carracedo1,4, Vincenzo L. Pascali2, Cristian Capelli3, Antonio Salas1*.
1 Unidade de Xenetica, Facultade de Medicina, Instituto de Medicina Legal, Universidade de Santiago de Compostela, Galicia, Spain, 2 Forensic Genetics Laboratory,
Institute of Legal Medicine, Universita Cattolica del Sacro Cuore, Rome, Italy, 3 Department of Zoology, University of Oxford, Oxford, United Kingdom, 4 Fundacion Publica
Galega de Medicina Xenomica (FPGMX-SERGAS), CIBER enfermedades raras, Santiago de Compostela, Galicia, Spain
Abstract
Background: According to archaeological records and historical documentation, Italy has been a melting point forpopulations of different geographical and ethnic matrices. Although Italy has been a favorite subject for numerouspopulation genetic studies, genetic patterns have never been analyzed comprehensively, including uniparental andautosomal markers throughout the country.
Methods/Principal Findings: A total of 583 individuals were sampled from across the Italian Peninsula, from ten distant (ifhomogeneous by language) ethnic communities — and from two linguistic isolates (Ladins, Grecani Salentini). All sampleswere first typed for the mitochondrial DNA (mtDNA) control region and selected coding region SNPs (mtSNPs). This datawas pooled for analysis with 3,778 mtDNA control-region profiles collected from the literature. Secondly, a set of Y-chromosome SNPs and STRs were also analyzed in 479 individuals together with a panel of autosomal ancestry informativemarkers (AIMs) from 441 samples. The resulting genetic record reveals clines of genetic frequencies laid according to thelatitude slant along continental Italy – probably generated by demographical events dating back to the Neolithic. TheLadins showed distinctive, if more recent structure. The Neolithic contribution was estimated for the Y-chromosome as14.5% and for mtDNA as 10.5%. Y-chromosome data showed larger differentiation between North, Center and South thanmtDNA. AIMs detected a minor sub-Saharan component; this is however higher than for other European non-Mediterraneanpopulations. The same signal of sub-Saharan heritage was also evident in uniparental markers.
Conclusions/Significance: Italy shows patterns of molecular variation mirroring other European countries, although someheterogeneity exists based on different analysis and molecular markers. From North to South, Italy shows clinal patterns thatwere most likely modulated during Neolithic times.
Citation: Brisighelli F, Alvarez-Iglesias V, Fondevila M, Blanco-Verea A, Carracedo A, et al. (2012) Uniparental Markers of Contemporary Italian Population RevealsDetails on Its Pre-Roman Heritage. PLoS ONE 7(12): e50794. doi:10.1371/journal.pone.0050794
Editor: David Caramelli, University of Florence, Italy
Received June 15, 2012; Accepted October 24, 2012; Published December 10, 2012
Copyright: � 2012 Brisighelli et al. This is an open-access article distributed under the terms of the Creative Commons Attribution License, which permitsunrestricted use, distribution, and reproduction in any medium, provided the original author and source are credited.
Funding: The research leading to these results has received funding from the People Programme (Marie Curie Actions) of the European Union’s SeventhFramework Programme FP7/2007–2013/under REA grant agreement number 290344, and the Ministerio de Ciencia e Innovacion (SAF2008-02971 and SAF2011-26983)(AS). CC and FB were partially funded by the British Academy for the project ‘‘The Greeks in the West: the genetic legacy of the colonisation in South Italyand Sicily’’. The funders had no role in study design, data collection and analysis, decision to publish, or preparation of the manuscript.
Competing Interests: The authors have declared that no competing interests exist.
* E-mail: [email protected]
. These authors contributed equally to this work.
Introduction
Italy has historically been a convenient destination for human
populations migrating from Africa, the Middle East and European
locations, in part due to the geomorphological characteristics of
the Italian Peninsula [1]. These groups settled preferentially on the
islands and coastal territories [1] 500,000 years ago (ya), that is,
along the Lower Paleolithic, the longest period of human
prehistory, which was dominated by the notable diffusion of tools
made from flaked stone [2]. Although rich in tools and animal
bones, only some of these sites have provided a small quantity of
human skeletal remains resembling those from the more recent
sites of the Middle Paleolithic, dating to the Riss-Wurm
interglacial period and part of the succeeding Wurm glaciation
(circa 120,000 to 36,000 ya). These bones belong to a species
named Homo sapiens neanderthalensis. [2] In this long Paleolithic
period, navigation across the Mediterranean was probably rare
and some present-day islands were accessible across land bridges
later covered by the rising sea [3]. During the Upper Paleolithic,
from 36,000 to 10,000 ya, the icecap expansion of the Late Glacial
Maximum (LGM) pushed southward groups of hunters living in
Central European areas [1], and the Neanderthals gave way to the
present species of man Homo sapiens sapiens during the final phases
of the Wurm glaciation. The numerous traces from this period are
particularly rich in burials, animal bones and tools, the latter
having been worked with increased precision [2]. In the few
thousand years of the following Mesolithic period (circa 10,000 to
6,000 ya) the climate continued to grow milder and sites from this
period have been found throughout the entire Italian peninsula,
being along the coasts in the plains and on the mountains. With
PLOS ONE | www.plosone.org 1 December 2012 | Volume 7 | Issue 12 | e50794
the Neolithic period, from circa 6,000 BC to 2,800 BC, the
traditional hunting and gathering economy was replaced by the
introduction of agriculture, stock rearing, weaving and pottery.
This new cultural influence came particularly from the Eastern
Mediterranean and the Near East. Using the pottery production
above all, it has been possible to reconstruct fairly accurately the
various phases of this complex period [2]. During the Copper,
Bronze and Iron ages, numerous population movements occurred
between the Mediterranean basin and the Middle East [4].
Exchange of metals would determine the transformation of the
first social organizations in ancient civilizations [4]. Sardinia, Sicily
and Tuscany were among the first Italian territories to be occupied
by humans due to their strategic location and the presence in their
territories of important metal resources [5].
Different cultures, recognized on the basis of different arche-
ological findings, settlements and burial traditions, arose in the
period between the Mesolithic and Iron Age. Before the Roman
conquest, ancient Italy was characterized only by the presence of
Indo-European populations [6] living in the Italian Peninsula since
the second millennium BC, corresponding to the period between
the Iron Age and Romanization [2]. During all this period there
were also increasing contacts with the Phoenician and Greek
colonists: the former being largely present on the coasts of Sardinia
and western Sicily and the latter in Southern Italy. These colonies
had a considerable influence on the development of local cultures
(from the Picenian to Campano-Samnite and the Apulian to
Bruttio-Lucanian) [5].
The record of all the populations that inhabited the Italian
territory during (pre)-history is incomplete; many records were of
uncertain location and/or ambiguous denomination [6]. At the
beginning of the first millennium BC the following native tribes
could be distinguished on the Italian territory: the Ligures, on the
coast that bears their name, in the northern Apennine valleys, part
of the pre-alpine valleys and the western Po Valley; the Sicani, in
the interior of Sicily; and the Itali, in present-day Calabria (from
whom comes the name ‘Italy’, which was to be extended to all the
territory of the peninsula). Besides the already mentioned
Terramare tribe, on the southern edge of the Po Valley, and the
Villanovans, probably from Eastern Europe who settled through-
out Central Italy, there were also the Umbrians to the east of the
upper basin of the Tiber. The Veneti, who occupied the territory
that still bears their name, originally came from Illyria as did the
Messapii (now modern Salento or South Apulia) and Iapyges, who
settled in present-day Puglia (Apulia) [5]. Many other populations
of Central-Southern Italy were created by the mixing of local and
foreign elements dating back to the previous millennium; it is the
case of the Sabines and Latini who settled in Lazio together with
Falisci, Aequi, Volsci, Hernici and Ausones. The interior of
Abruzzo was dominated by the Vestini, Paeligni and Marsi, while
the central Adriatic coast was populated by Picentes, Marrucini
and Frentani. The Apennine area of Molise and Basilicata was
peopled by the Samnites and Lucanians. In Calabria and Sicily
there were also the Bruttii and Siculi.
The Phoenician colonization of the coasts of the Western
Mediterranean were mainly limited in Italy to Sardinia and
western Sicily and preceded that of the Greeks. It was followed by
Punic settlements (Trapani, Palermo, Cagliari) linked to the
ancient Phoenician colony of Carthage.
At the time of the Roman Empire, at least two non-Indo-
European populations still inhabited Italy, namely, the Ligures, in
the northwestern area, and the Etruscans with settlements located
in areas far from the Etruria (Tuscany and High Latium), such as
the Po Plain and the coast of Campania. At the same time, Sardinia
experienced the flourishing of a non-Indo-European Nuragic
civilization and, then, the Phoenician colonization.
Genetics alone cannot disentangle the extremely complex
demography of Italy through history. Some demographic move-
ments have however left signals on uniparental and nuclear
markers. Most of the genetic studies targeted local, e.g. [7], or
regional, e.g. [8–11], Italian populations.
For the Y-chromosome, some attempts have been undertaken to
analyze Italian variation to a more general scale [12–14]. Many
studies have analyzed specific haplogroups in the Y-chromosomes,
e.g. [15,16], or the mtDNA, e.g. [8,9]. In general, the different
studies indicate that the genetic structure of the present Italian
population seems to reflect, at least in part, the ethnic stratification
of pre-Roman times [14]. Studies carried out in the past appear to
show a major North–South cline consistent with archaeological
estimates of two distinct processes: the first colonization of the area
during the Paleolithic period and the subsequent Neolithic
expansion from the Middle East after the last glacial [14]. There
is some correspondence between patterns of variation at the Y-
chromosome and geography. Thus, northern Italy shows similar
frequencies as the haplogroups of Central Europe, with prevalence
of the western R1-M173 haplogroup compare to the eastern I-
M170. In the North, E3b1-M35 and J2-M172 show low
frequencies but are more prevalent in the South, which has been
interpreted to be a signal of the gene flow coming from Central
European Neolithic farmers [17]. R1a1-M17 is rather rare, both
in the North, where it probably originates from eastern Europe,
and in the South, of possible Greek provenience [17]. Occurrence
of J2-M172 Y-chromosomes in Tuscany has been related to the
Etruscan heritage of the region (see [17]). The two Italian major
islands, Sicily and Sardinia, show a different demographic history.
The Y-chromosome variability of Sicily shares a common history
with that of southern Italy, enriched by an additional Arab
contribution, but also North African and Greek influences [18].
On the other hand, Sardinia has been considered to be a genetic
outlier within Europe showing clear signals of founder effects;
some scholars suggest that its peoples could be of ancient Iberian
origin [19]; recent genetic studies point to genetic contribution
coming from southern France [20].
On the other hand, mitochondrial DNA studies show that Italy
does not differ too much from other European populations;
however, some populations have the same peculiarities and
preserve signals of the ancient past demographic event, such as
the Tuscans [8,9], or the Ladins [7,21,22]. Recently, patterns of
variation observed in haplogroup U5b3 demonstrated for the first
time the existence of a North Italian pre-historical human refuge
from the hostile Central European regions covered by the ice of
the Last Glacial Maximum period [20]; this area, as was also the
Franco-Cantabrian region [23–26], served as a region of
European repopulation during the beginning of the Holocene.
The main aim of the present study was comprehensively to
analyze the patterns of mtDNA and Y-chromosome variation in
Italy. This study differs from previous ones in that: (1) it provides
mtDNA data from 12 new sample populations from Italy; (2) we
analyzed two linguistic isolates, Ladin and Grecani Salentini, the
latter sampled for the first time in this study; (3) we analyzed a
sample population from Lucera (Southern Italy) for the first time, a
population that according to documentation received an impor-
tant input of North African immigrants during the thirteenth
century; (4) we analyzed the patterns of mtDNA variation in Italy
globally, that is, by combining more than 3,700 control region
profiles from the literature (41 population samples in total) coupled
with the more than 580 new profiles provided here; (5) Y-
chromosome haplotype and haplogroup patterns are analyzed in
Patterns of mtDNA Variation in Italy
PLOS ONE | www.plosone.org 2 December 2012 | Volume 7 | Issue 12 | e50794
parallel with the mtDNA data in order to determine the possible
differences that occurred historically in the male versus female
demographic movements; and (6) the influx of migrants from
Africa (North and sub-Saharan) and other regions is also analyzed
using phylogeographic inferences, and also a model of admixture
based on haplotypic data and a panel of ancestry informative
markers (AIMs).
Materials and Methods
Ethics statementWritten informed consent was obtained from all sample donors.
Analysis of mtDNA sequences was approved by the institutional
review boards of the Universita Cattolica del Sacro Cuore (Roma).
Moreover, the study conforms to the Spanish Law for Biomedical
Research (Law 14/2007- 3 of July).
SamplesA total of 583 individuals were sampled from along the Italian
Peninsula, representing 12 different populations (Figure 1), two of
them (Ladin and Grecani Salentini) being linguistic isolates, and
the Lucera being a historical enclave of Arabs coming from North
Africa. A brief description of these latter three populations is given
below.
In the Italian territory, the Alpine arc represents one of the main
areas of presence of alloglot populations, some of them biologically
isolated for historical and geographic reasons [27]. At the end of
the medieval period (,1200 AD) and especially in the valley zone,
a first colonization of native peasants began, starting with the use
of lands previously exploited only for pasture and the lumber.
Successively, with different modalities and under the control of laic
and ecclesiastical owners, the colonization process involved
migrant nuclei from the Tyrol, Carinthian area and other zones
[28]. Currently, the Alpine arc populations are differentiated with
a remarkable cultural diversity that is well represented by linguistic
elements. Thus, besides the official main languages, numerous
minority languages or dialects are also the cultural patrimony of
linguistic minorities [27,29]. Ladin is often attributed to be a relic
of vulgar Latin dialects associated with Rhaeto-Romance
languages. In the vast multi-ethnic Holy Roman Empire, and
then after 1804 the Austrian empire, the Ladins were left in
relative peace and were allowed to continue the use of their
language and culture.
Grecani Salentini is a Hellenic-speaking linguistic island of
Salento, situated in southern Puglia, and consisting of nine
municipalities in which a neo-Greek dialect, also known as
Grecanic or Griko, is spoken. The origins of this linguistic island in
Salentine Greece are uncertain. The German linguist G. Rohlfs
proposed its origin in the Magna Graecia region; while O. Parlangeli
suggests a Byzantine derivation of the Griki of Salento. Greek
researchers (e.g. A. Karanastasis) claim the input of Byzantine
elements in the pre-existing Magna Graecia matrix. The Greek
arrival in the Salentine Peninsula occurred both in the Magna
Graecia, and posterior Byzantine dominations. The numerous
villages of Grecani Salentini had a Greek culture and language
and practiced the Greek-orthodox religion. In the beginning of the
Norman conquest (eleventh century), and more intensively with
the arrival of different casati (clans) (Svevian, Angioin, Aragones,
etc), the catholic clergy supplanted those of the orthodox faith
[30].
The Lucera population has received an important influx from
North African Arab peoples (see [31]). Thus, after the collapse of
the Roman Empire in Europe, the Arab domination spread into
the Mediterranean Basin. Referred to either as Moors in Iberia or
Saracens in Southern Italy and Sicily, Arabs arrived in Europe in
711 AD, and in 831 AD Iberia and Sicily were almost completely
subjected to Arab domination [31]. In the thirteenth century,
Frederick II moved the Sicilian Arabs to the city of Lucera (North
Apulia) [32]. This sample was genotyped for STRs and Y-
chromosome SNPs in Capelli et al. [31]
To the best of our knowledge, all individuals collected in the
present study were not maternally and paternally closely related;
they had different surnames and all the donors referred back at
least two generations in the region where the samples were
collected.
All the samples were analyzed for the control region and
selected mtSNPs (see below). A subset of the samples comprised
unrelated males (n = 292) representing seven different populations.
These samples were genotyped for a panel of 17 Y-chromosome
SNPs (see below), and were previously genotyped for the Yfiler
[33]. In addition, autosomal ancestry informative markers (AIMs)
were genotyped in 441 individuals (see below).
DNA extractionBlood extraction was performed with a salting-out method [34],
modified and re-adapted to buccal cells. Swabs were incubated in
500 ml of 0.2 sodium acetate, 35 ml of 10% SDS and 20 ml of
20 mg/ml Proteinase K for 16 hours at 56uC. They were then
removed and 500 ml of 3 M NaCl solution was added. Proteins
were removed by centrifugation, and the DNA precipitated by
adding 1 ml of ethanol 100% at 220uC for a few hours. After
centrifugation, the DNA pellet was twice washed with ethanol
70%, dried and re-suspended in water. For the blood samples,
aliquots of 500 ml each were thawed and red cells selectively lysed
by a 16 lysis buffer. After three washes with the lysis buffer, white
cells were pelleted and the DNA extracted using the salting-out
protocol. All the samples were quantified by direct comparison
with standard on agarose 1% minigels (1 g of agarose in 100 ml of
TBE 1X- from the 1:10 diluition of TBE 10X).
PCR and mtDNA control region sequencingMtDNA has been sequenced for the complete control region,
from position 16024 (in HVS-I) to 569 (in HVS-II). The first and
second hypervariable regions (HVS-I/II) were amplified via the
polymerase chain reaction (PCR) and using primers reported by
Alvarez-Iglesias et al. [35].
PCR was carried out in a 25 ml reaction mix with 16 reaction
buffer (20 mM Tris-HCl, ph 8.0, 0.1 mM EDTA, 1 mM DDT,
50% (v/v) glycerol), 1.5 mM MgCl2, 200 mM each dNTP,
0.4 mM each primer, 2.5 U (Units). Taq polymerase and 0.1–
1 ng DNA template was added to the reaction mixture (Taq DNA
Polymerase, recombinant. INVITROGENH Corporation). Am-
plification was carried out in a GENE AMPH PCR SYSTEM
9700 (Applied Biosystems, Foster City, California,U.S.A.) using a
hot start at 95uC for 1 min, followed by 36 cycles at 95uC for
30 sec, 55uC for 60 sec, and 72uC for 30 sec and a final extension
at 72uC for 15 min. Before the sequencing reaction, PCR products
were checked by electrophoresis in polyacrylamide non-denatur-
ing gel (T9, C5), and subsequently the gel was stained with silver
nitrate. PCR products were then purified with a MultiScreenHPCRm96 Plate (Millipore, Bedford, Ma 01730, U.S.A), 96-well
device.The vacuum-based, size exclusion separation effectively
and quickly removed the containing salts, unincorporated dNTPs
and primers from PCR reactions. Cycle sequencing was
performed on both strands in a GENE AMPH PCR SYSTEM
9700 (AB) thermal cycler using the ABI PrismH dRhodamine
Terminator Cycle Sequencing Ready Reaction Kit (AB). This kit
consists of a reaction mix composed of: DNA-modified and
Patterns of mtDNA Variation in Italy
PLOS ONE | www.plosone.org 3 December 2012 | Volume 7 | Issue 12 | e50794
termostable polymerase, Buffer Tris-HCl (pH 9.0), MgCl2,
dNTPs, dichlororhodamine-marked ddNTPs. An aliquote of
30 ng amplicon and 3.2 rM primers were added to a 2 ml
reaction mix. Sequencing was carried out using a hot start at 96uCfor 4 min, followed by 36 cycles at 96uC for 15 sec, 50uC for
10 sec, 60uC for 2 sec and a final extension at 60uC for 10 min.
The removal of excess dideoxy terminators, primers and buffer
was accomplished with an alcoholic purification.
The sequence products were denatured with deionized form-
amide and analyzed by capillary electrophoresis on an ABI
PRISM 3130H Genetic Analyzer (AB).The resulting data were
analyzed with PE/ABD software Sequencing Analysis 5.2 and
sequences were aligned and compared with the Cambridge
sequence [36] from position 16024 to16569 for HVS-I and from
position 1 to 600 for HVS-II by the SeqScape v.2.0 (AB).
Analysis of mtDNA coding region SNPsBiallelic markers were genotyped using a multiplex approach
[37]. The selected SNPs were combined into two multiplex
reactions. Multiplex 1 included a selection of SNPs defining
common European haplogroups [38]. Multiplex 2 included
exclusively polymorphisms defining sub-lineages inside hap-
logroup H. Primers were designed in order to adjust the annealing
temperatures and amplicon lengths to allow analysis in multiplex
reactions [37]. The sizes of the PCR products ranged from 80 to
224 bp.
Both multiplexes were performed using 10 ng of DNA template
in a 25 ml reaction volume comprising 16Taq Gold Buffer (AB),
200 mM of each dNTP, 2 mM MgCl2 and 0.5 U of AmpliTaq
Gold Polymerase (AB). For the primer concentrations, see [37].
Amplification was carried out using a GENE AMPH PCR
SYSTEM 9700 (AB) thermocycler. After a 95uC pre-incubation
step for 11 min, PCR was performed for a total of 32 cycles using
the following conditions: 94uC denaturation for 30 sec, annealing
at 60uC for 30 sec and extension at 72uC for 1 min, followed by a
15 min final extension at 72uC. PCR products were checked by
polyacrylamide gel electrophoresis (T9, C5) visualized by silver
staining.
After amplification, PCR products required purification to
remove primers and unincorporated dNTPs. Post-PCR purifica-
tion was performed with ExoSapIT (Amershan Pharmacia
Biotech): 1 ml of PCR product was incubated with 0.5 ml of
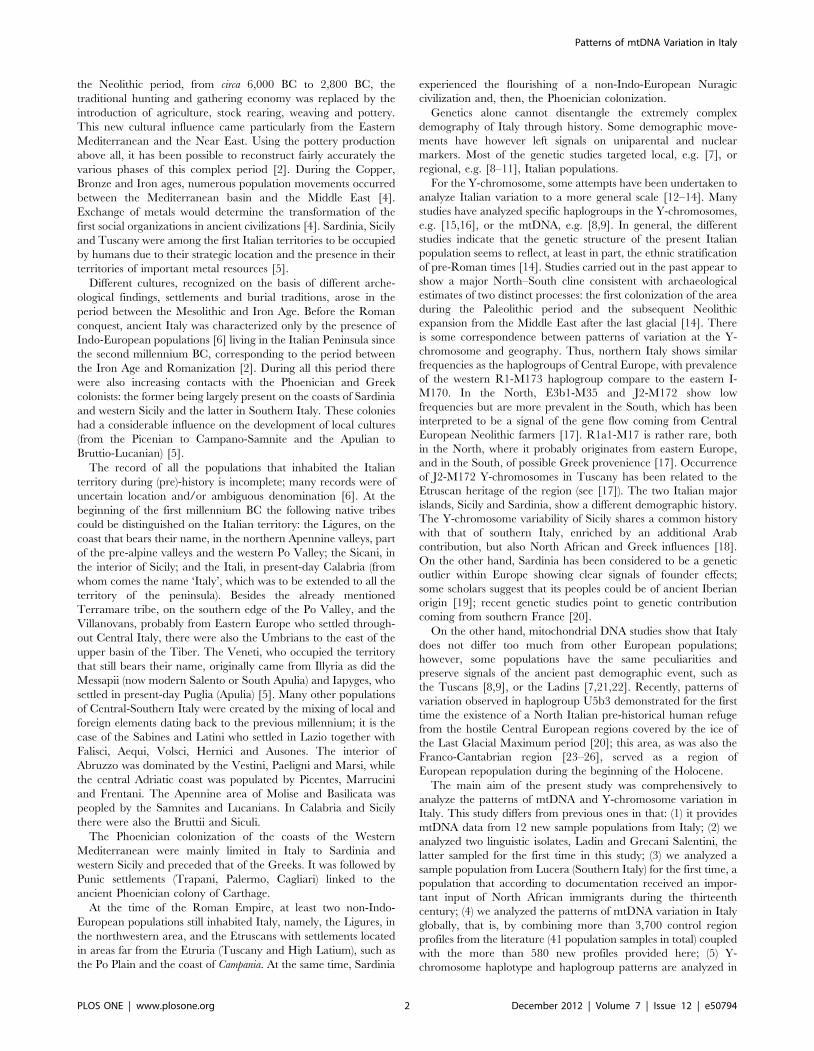
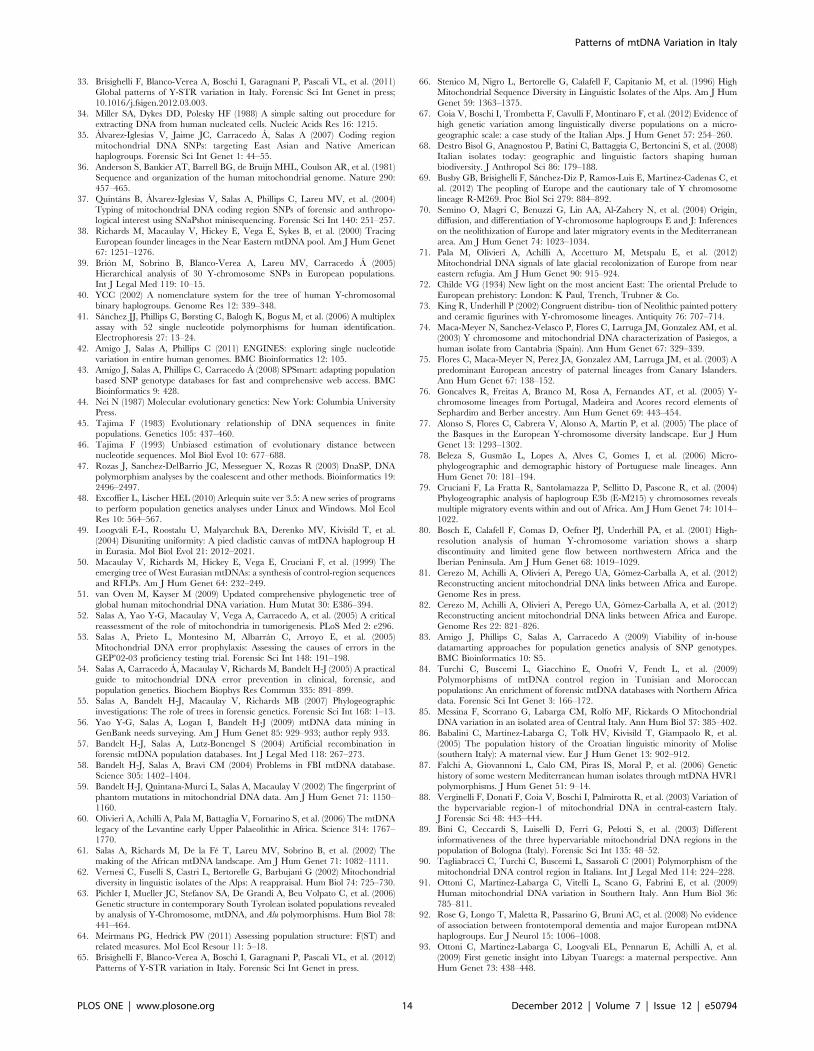
Figure 1. Map showing the location of the samples analyzed in the present study and those collected from the literature (seeTable 1). Pie charts on the left display the distribution of mtDNA haplogroup frequencies, and those on the right the Y-chromosome haplogroupfrequencies.doi:10.1371/journal.pone.0050794.g001
Patterns of mtDNA Variation in Italy
PLOS ONE | www.plosone.org 4 December 2012 | Volume 7 | Issue 12 | e50794
ExoSapIT for 15 min at 37uC followed by 15 min at 80uC for
enzyme inactivation. The minisequencing reaction was performed
in a GENE AMPH PCR SYSTEM 9700 (AB) thermocycler
following the recommendations of the manufacturer: 2 ml of
SNaPshot ready reaction mix, 0.2 mM of extension primer for
each SNP (see [37]) and 1 ml of both purified PCR products in a
total volume of 7 ml. The reaction mixture was subjected to 25
single base extension cycles of denaturation at 96uC for 10 sec,
annealing at 50uC for 5 sec and with an extension at 60uC during
30 sec. After minisequencing reactions, a post-extension treatment
to remove the 59-phosphoryl group of ddNTPs aided the
prevention of co-migration of unincorporated ddNTPs with
extended primers and production of a high background signal.
The final volume (7 ml) was treated with 0.7 ml of SAP (Amersham
Biosciences) for 60 min at 37uC, followed by 15 min at 80uC for
enzyme inactivation.
The minisequencing products (1.5 ml) were mixed with 10 ml of
HiDiTM formamide and 0.2 ml of GeneScan-120 LIZ size
standard (AB) and electroforesis was performed on an ABI
PRISM 3130H Genetic Analyser (AB). The resulting data was
analyzed with Gene Mapper ID.
Minisequencing of SNPs characterizing additional typicalEuropean haplogroups
Samples that were determined (using the SNP panel above) as
being derived from J/T (T14766C; C7028T; T4216C), U
(T14766C; C7028T; A12308G) and the U-subclade K
(T14766C; C7028T; A12308G; A10398G), were further geno-
typed using an additional set of 14 haplogroup-specific SNP
markers that identify the following sub-branches: J1 (G3010A), J1b
(G3010A; C13879T), J1c (G3010A; C114798T), J2 (G15257A),
T2a (A14687G), T2b (G5147A), U5a (A14793G), U5a1
(A14793G; A15218G), U5b (A7768G), U5b1 (A7768G;
A5656G), U5b2 (A7768G; C1721T), K1 (T14798C; T1189C),
K1a (T14798C; T1189C; C0497T) and K2 (T14798C; T1189C;
T9716C). PCR and minisequencing reactions were performed as
described above. For PCR and minisequencing primer concen-
trations, see Table S1.
Genotyping of Y-SNPsBiallelic markers were genotyped using a multiplex approach
[39]. A set of 30 SNPs was tested, allowing assignation of the
analyzed Y-chromosome to haplogroups (Hg), following the
nomenclature and the phylogenetic relationships defined from
the Y Chromosome Consortium [40]. The selected method for
allele discrimination was a single base extension reaction using the
SNaPshot multiplex kit (AB). We added the M269 marker to the
first of the four multiplexes, in order better to dissect the sub-
haplogroup R1b (R1b3). The primers of this marker were M269-F
59-TCA TGC CTA GCC TCA TTC CT-39 and M269-R 59-
TCT TTT GTG TGC CTT CTG AGG-39, and the minisequen-
cing primer 59-GGA ATG ATC AGG GTT TGG TTA AT-39.
Genotyping of AIMsA panel of 52 AIMs were genotyped according to Sanchez et al.
[41] in a subset of 441 individuals. Several other population
datasets were used for inter-population comparisons. This data
corresponded to the CEPH panel (http://www.cephb.fr/en/
cephdb/) as reported in HapMap (http://hapmap.ncbi.nlm.nih.
gov/) and was collected using the data-mining tool SPSmart
[42,43]; it includes population samples from all over the world
(Africa, Europe, Asia, etc.); see legend of Figure 2 for more
information.
Statistical analysisA total of 42 Italian population samples were analyzed for
mtDNA in the present study. Comparative inter-population
analyses were also carried out for the HVS-I segment ranging
from 16024 to 16365, since this is the analyzed segment common
to all of them. Haplotype (H) and nucleotide diversity (p) and other
diversity indices [44–46] were computed using DnaSP 4.10.3
software [47]. Problematic variation located around 16189,
usually associated to length heteroplasmy e.g. 16182C or
16183C, was ignored. Analysis of molecular variance (AMOVA)
was carried out using Arlequin 3.5. [48]. Nomenclature of mtDNA
lineages followed previous studies e.g. [23,25,38,49,50]; see
Phylotree for a compilation of the worldwide phylogeny and an
update of the nomenclature based on entire mtDNA genomes
[51]. Genotyping and documentation errors were monitored
following the phylpogenetic principles previously applied e.g. [52–
59].
Mitochondrial DNA and Y-chromosome data was collected
from the literature. The mtDNA data generated in the present
study was analyzed together with 3,834 mtDNA HVS-I Italian
profiles collected from the literature (Table S2; 76 sample
populations). The Y-SNPs were analyzed together with 1,251
Italian profiles reported in the literature (16 population samples). A
full list of references for all the data used in the present study is
given in Table S2.
Haplogroup frequencies were estimated by chromosome
counting. Statistical differences in haplogroup frequencies were
evaluated using a Pearson’s chi- square test and by setting up the
nominal significant value a as 0.05.
Finally, classification of mtDNA sequences into haplogroups
was performed following phylogenetic criteria (Phylotree Build 14,
http://www.phylotree.org/) and using both the control region
sequence profile and mtSNPs.
Results
Molecular diversity of mtDNA and Y-chromosome Italianprofiles
Diversity indices were computed for all the populations
analyzed in the present study and also in those Italian populations
samples reported in the literature (Tables 1 and 2). Population
samples were also grouped in main regions (North, Central, South,
West, and East) in order to investigate the role of geography in the
distribution of mtDNA variation.
Mitochondrial DNA haplotypes for the samples analyzed in the
present study are reported in Table S3. Table 1 shows the
molecular diversity values based on mtDNA data for 41 Italian
population samples. The values indicate that the Isle of Elba is, by
far, the Italian population sample that shows the lowest diversity
for all the indices computed, probably as a consequence of its
relative isolation from the country. It has been reported that this
was a well-known enclave of Etruscan influence, and some
mtDNA particularities have been described before [8,9]. Alterna-
tively, low molecular diversity could be due to low sample sizes,
although this fact is mirrored in the standard deviation of the
different estimates. Excluding the Isle of Elba, haplotype diversity
in Italy ranges from 0.834 to 1, nucleotide diversity from 0.01003
to 0.02409, and the average value of nucleotide differences from
3.4 to 8.19 (a value that is correlated with the nucleotide diversity).
In general, Italy shows some level of heterogeneity when examined
for diversity values.
When grouping populations by main geographical regions, it
can be observed that Central Italy has slightly lower values than
North and South Italy for all the indices computed (Table 1). The
Patterns of mtDNA Variation in Italy
PLOS ONE | www.plosone.org 5 December 2012 | Volume 7 | Issue 12 | e50794
higher diversity values were found in South Italy. Diversity values
are however very similar when examining populations located in
West Italy versus those in the East. The inclusion of Sicily (as part of
South Italy) in the computation does not substantially change these
estimates (Table 1).
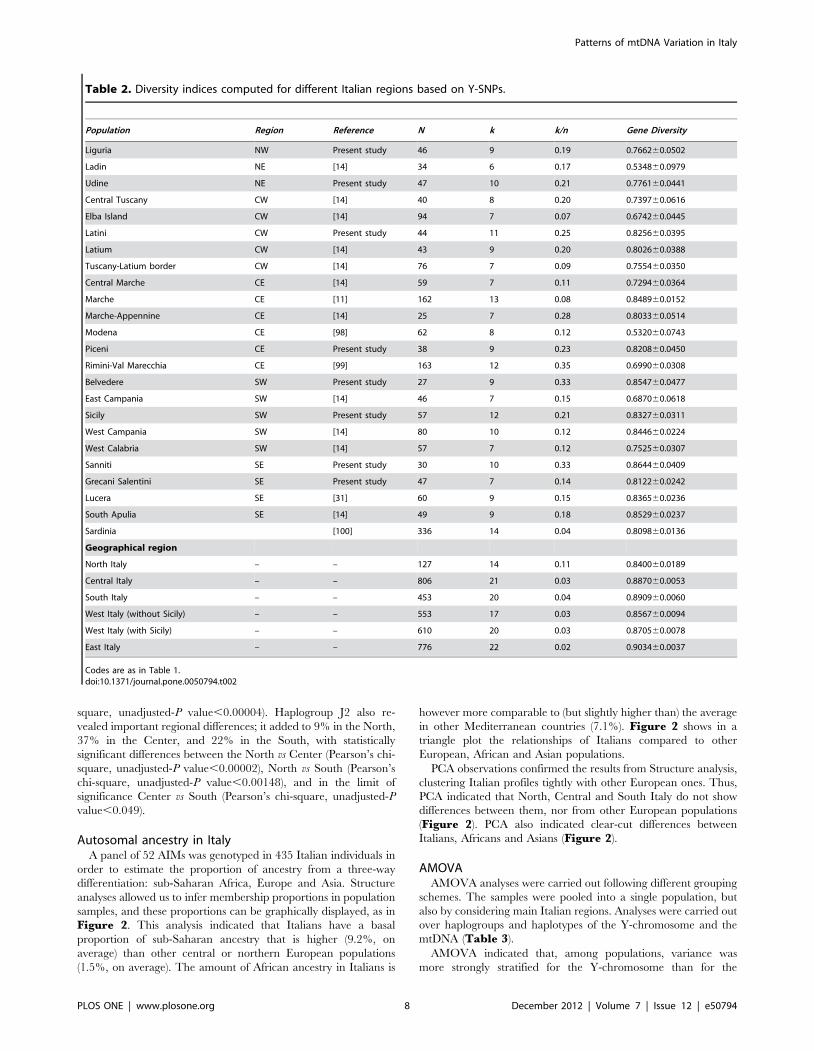
Y-SNP data were obtained for all the samples analyzed in the
present study (Table S4). Table 2 shows the diversity indices for
the Y-SNPs in different Italian populations. The Y-STR diversity
values for the samples analyzed in the present study and other
Italian and European samples have already been reported in
Brisighelli et al. [33]. As expected, diversity values of Y-SNP
haplogroup patterns are lower than those obtained for the mtDNA
haplotypes given that the indices are based on haplogroup and not
on Y-STR haplotypes. In fact, values based on Y-STR profiles
(minimum or extended Yfiler profiles) [33] are higher than those
observed for the HVS-I profiles. Ladins are among the populations
with the lowest Y-SNP diversity values, while the Grecani
Salentini show diversity values that are comparable to other
Italian samples. Modena shows remarkable low haplotype
diversity values.
PhylogeographyThe mtDNA haplogroup make-up of Italy as observed in our
samples fits well with expectations in a typical European
population. Thus, most of the Italian mtDNAs (,89%) could be
attributed to European haplogroups H (,40%), I (,3%), J (,9%),
T (,11%), U (,20%; U minus U6), V (,3%), X (,2%) and W
(,1%); Figure 1. There are however important differences in
haplogroup frequencies when examining them by main geograph-
ical regions. Thus, for instance, haplogroup H is 59% in the
North, 46% in the Center, and decays to ,33% in the South;
moreover, these regional differences are statistically significant:
North vs South (Pearson’s chi-square, unadjusted-P val-
ue,0.00003), and Center vs South (Pearson’s chi-square, unad-
justed-P value,0.03724).
Mitochondrial DNA haplotypes of African origin are mainly
represented by haplogroups M1 (0.3%), U6 (0.8%) and L (1.2%);
from here onwards, L will be used to refer to all mtDNA lineages,
excluding the non-African branches N and M [60,61].
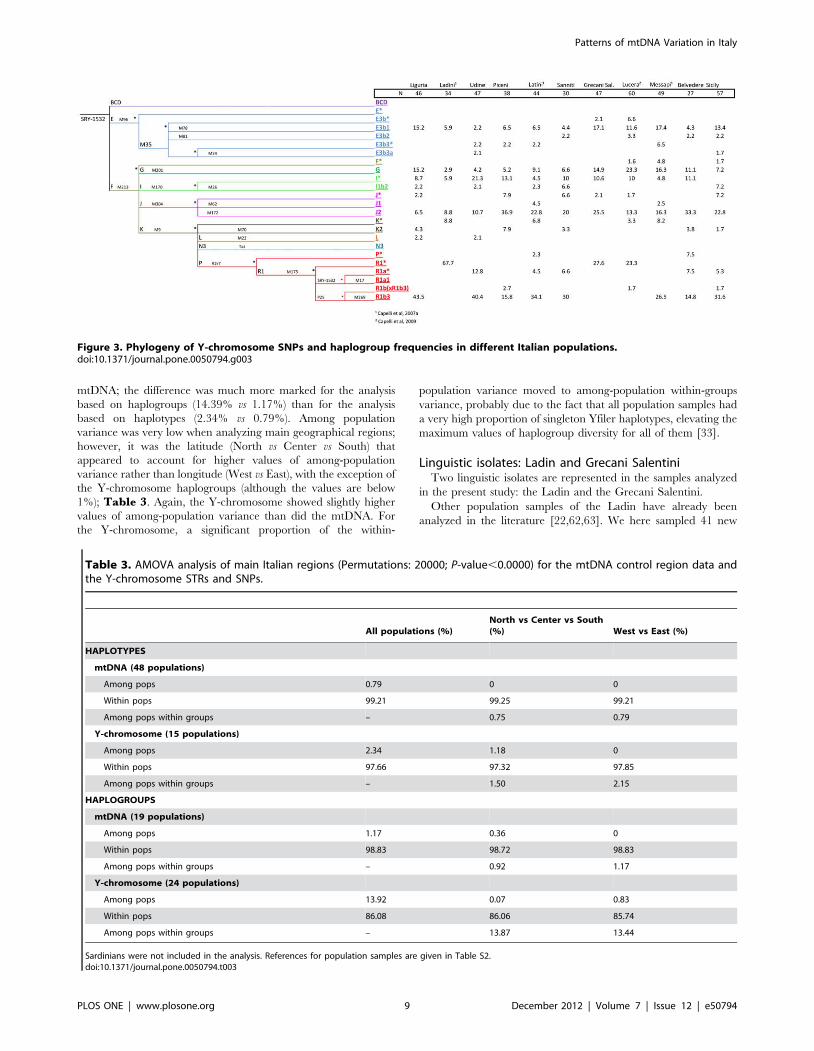
A total of 282 Y-chromosomes were analyzed for a set of Y-
SNPs and were classified into 22 different haplogroups (Figure 3).
Two haplogroups were not found, even though markers defining
these clades were tested: N3 and R1a1. Five haplogroups
represented 76.71% of the total chromosomes: R1b3, J2,
I(xI1b2), E3b1 and G. The frequencies averaged across popula-
tions were 26%, 21.2%, 10.2%, 9.9% and 9.2%, respectively. The
remaining haplogroups sum to 23.2% in the total sample, and
never above 4% in single population samples.
R1b3 frequency was found to be higher in the northern part of
the country, while the Y-chromosome haplogroups G and E3b1,
J2 and I(xI1b2)frequencies were higher in the south and in the
central part of the country, respectively (Figure 1).
Regional differences are substantially higher in the Y-chromo-
some than in the mtDNA. Thus, for instance, haplogroup R in the
Y-chromosome was 54% in the North, 18% in the Center, and
31% in the South. Frequency differences were statistically
significant between North vs Center (Pearson’s chi-square,
unadjusted-P value = 0.0014), and North vs South (Pearson’s chi-
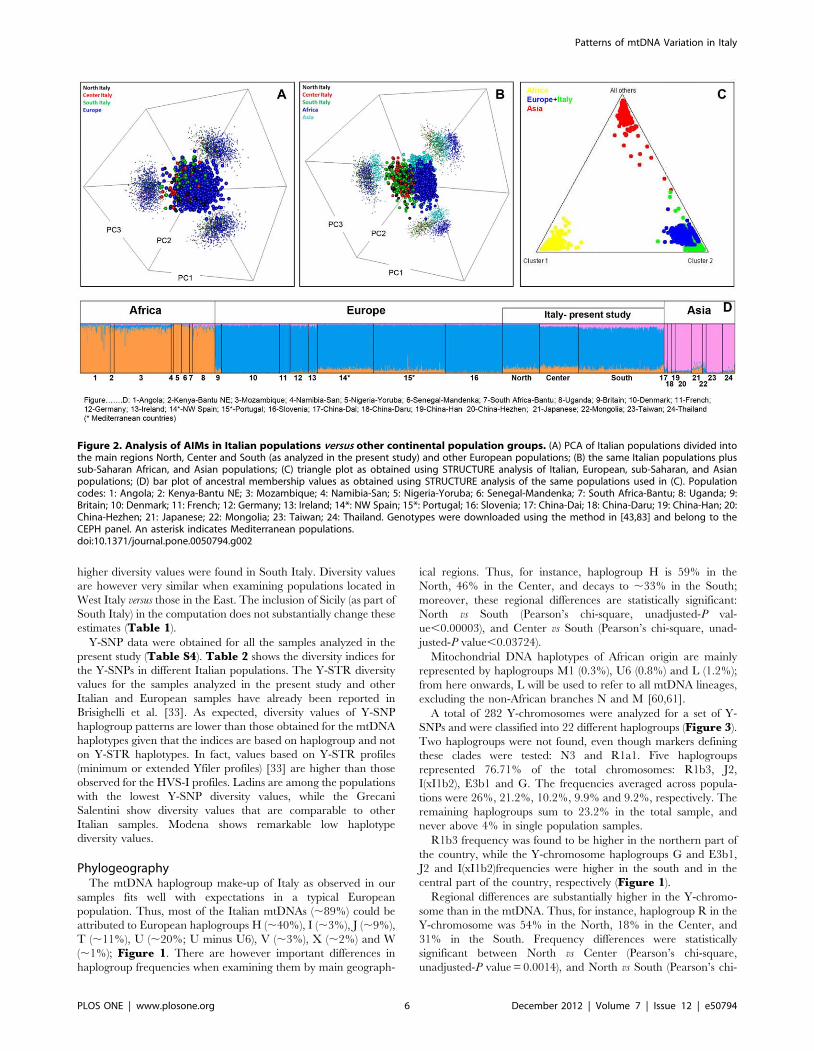
Figure 2. Analysis of AIMs in Italian populations versus other continental population groups. (A) PCA of Italian populations divided intothe main regions North, Center and South (as analyzed in the present study) and other European populations; (B) the same Italian populations plussub-Saharan African, and Asian populations; (C) triangle plot as obtained using STRUCTURE analysis of Italian, European, sub-Saharan, and Asianpopulations; (D) bar plot of ancestral membership values as obtained using STRUCTURE analysis of the same populations used in (C). Populationcodes: 1: Angola; 2: Kenya-Bantu NE; 3: Mozambique; 4: Namibia-San; 5: Nigeria-Yoruba; 6: Senegal-Mandenka; 7: South Africa-Bantu; 8: Uganda; 9:Britain; 10: Denmark; 11: French; 12: Germany; 13: Ireland; 14*: NW Spain; 15*: Portugal; 16: Slovenia; 17: China-Dai; 18: China-Daru; 19: China-Han; 20:China-Hezhen; 21: Japanese; 22: Mongolia; 23: Taiwan; 24: Thailand. Genotypes were downloaded using the method in [43,83] and belong to theCEPH panel. An asterisk indicates Mediterranean populations.doi:10.1371/journal.pone.0050794.g002
Patterns of mtDNA Variation in Italy
PLOS ONE | www.plosone.org 6 December 2012 | Volume 7 | Issue 12 | e50794
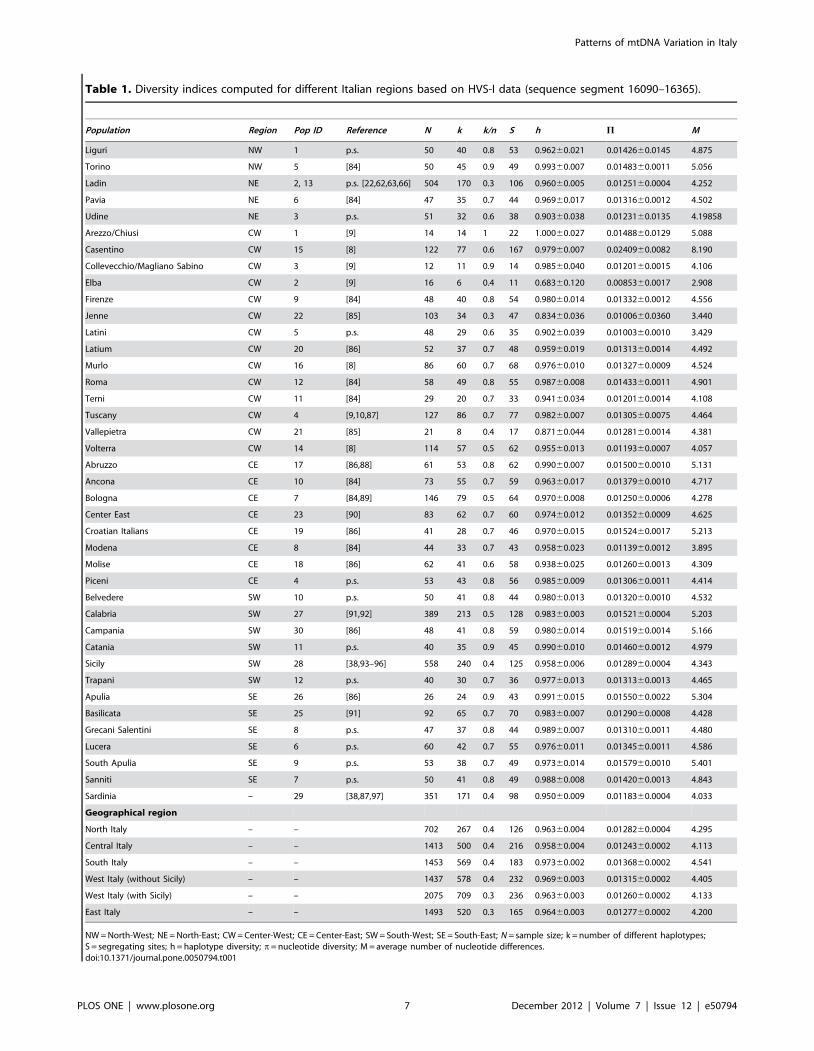
Table 1. Diversity indices computed for different Italian regions based on HVS-I data (sequence segment 16090–16365).
Population Region Pop ID Reference N k k/n S h P M
Liguri NW 1 p.s. 50 40 0.8 53 0.96260.021 0.0142660.0145 4.875
Torino NW 5 [84] 50 45 0.9 49 0.99360.007 0.0148360.0011 5.056
Ladin NE 2, 13 p.s. [22,62,63,66] 504 170 0.3 106 0.96060.005 0.0125160.0004 4.252
Pavia NE 6 [84] 47 35 0.7 44 0.96960.017 0.0131660.0012 4.502
Udine NE 3 p.s. 51 32 0.6 38 0.90360.038 0.0123160.0135 4.19858
Arezzo/Chiusi CW 1 [9] 14 14 1 22 1.00060.027 0.0148860.0129 5.088
Casentino CW 15 [8] 122 77 0.6 167 0.97960.007 0.0240960.0082 8.190
Collevecchio/Magliano Sabino CW 3 [9] 12 11 0.9 14 0.98560.040 0.0120160.0015 4.106
Elba CW 2 [9] 16 6 0.4 11 0.68360.120 0.0085360.0017 2.908
Firenze CW 9 [84] 48 40 0.8 54 0.98060.014 0.0133260.0012 4.556
Jenne CW 22 [85] 103 34 0.3 47 0.83460.036 0.0100660.0360 3.440
Latini CW 5 p.s. 48 29 0.6 35 0.90260.039 0.0100360.0010 3.429
Latium CW 20 [86] 52 37 0.7 48 0.95960.019 0.0131360.0014 4.492
Murlo CW 16 [8] 86 60 0.7 68 0.97660.010 0.0132760.0009 4.524
Roma CW 12 [84] 58 49 0.8 55 0.98760.008 0.0143360.0011 4.901
Terni CW 11 [84] 29 20 0.7 33 0.94160.034 0.0120160.0014 4.108
Tuscany CW 4 [9,10,87] 127 86 0.7 77 0.98260.007 0.0130560.0075 4.464
Vallepietra CW 21 [85] 21 8 0.4 17 0.87160.044 0.0128160.0014 4.381
Volterra CW 14 [8] 114 57 0.5 62 0.95560.013 0.0119360.0007 4.057
Abruzzo CE 17 [86,88] 61 53 0.8 62 0.99060.007 0.0150060.0010 5.131
Ancona CE 10 [84] 73 55 0.7 59 0.96360.017 0.0137960.0010 4.717
Bologna CE 7 [84,89] 146 79 0.5 64 0.97060.008 0.0125060.0006 4.278
Center East CE 23 [90] 83 62 0.7 60 0.97460.012 0.0135260.0009 4.625
Croatian Italians CE 19 [86] 41 28 0.7 46 0.97060.015 0.0152460.0017 5.213
Modena CE 8 [84] 44 33 0.7 43 0.95860.023 0.0113960.0012 3.895
Molise CE 18 [86] 62 41 0.6 58 0.93860.025 0.0126060.0013 4.309
Piceni CE 4 p.s. 53 43 0.8 56 0.98560.009 0.0130660.0011 4.414
Belvedere SW 10 p.s. 50 41 0.8 44 0.98060.013 0.0132060.0010 4.532
Calabria SW 27 [91,92] 389 213 0.5 128 0.98360.003 0.0152160.0004 5.203
Campania SW 30 [86] 48 41 0.8 59 0.98060.014 0.0151960.0014 5.166
Catania SW 11 p.s. 40 35 0.9 45 0.99060.010 0.0146060.0012 4.979
Sicily SW 28 [38,93–96] 558 240 0.4 125 0.95860.006 0.0128960.0004 4.343
Trapani SW 12 p.s. 40 30 0.7 36 0.97760.013 0.0131360.0013 4.465
Apulia SE 26 [86] 26 24 0.9 43 0.99160.015 0.0155060.0022 5.304
Basilicata SE 25 [91] 92 65 0.7 70 0.98360.007 0.0129060.0008 4.428
Grecani Salentini SE 8 p.s. 47 37 0.8 44 0.98960.007 0.0131060.0011 4.480
Lucera SE 6 p.s. 60 42 0.7 55 0.97660.011 0.0134560.0011 4.586
South Apulia SE 9 p.s. 53 38 0.7 49 0.97360.014 0.0157960.0010 5.401
Sanniti SE 7 p.s. 50 41 0.8 49 0.98860.008 0.0142060.0013 4.843
Sardinia – 29 [38,87,97] 351 171 0.4 98 0.95060.009 0.0118360.0004 4.033
Geographical region
North Italy – – 702 267 0.4 126 0.96360.004 0.0128260.0004 4.295
Central Italy – – 1413 500 0.4 216 0.95860.004 0.0124360.0002 4.113
South Italy – – 1453 569 0.4 183 0.97360.002 0.0136860.0002 4.541
West Italy (without Sicily) – – 1437 578 0.4 232 0.96960.003 0.0131560.0002 4.405
West Italy (with Sicily) – – 2075 709 0.3 236 0.96360.003 0.0126060.0002 4.133
East Italy – – 1493 520 0.3 165 0.96460.003 0.0127760.0002 4.200
NW = North-West; NE = North-East; CW = Center-West; CE = Center-East; SW = South-West; SE = South-East; N = sample size; k = number of different haplotypes;S = segregating sites; h = haplotype diversity; p= nucleotide diversity; M = average number of nucleotide differences.doi:10.1371/journal.pone.0050794.t001
Patterns of mtDNA Variation in Italy
PLOS ONE | www.plosone.org 7 December 2012 | Volume 7 | Issue 12 | e50794
square, unadjusted-P value,0.00004). Haplogroup J2 also re-
vealed important regional differences; it added to 9% in the North,
37% in the Center, and 22% in the South, with statistically
significant differences between the North vs Center (Pearson’s chi-
square, unadjusted-P value,0.00002), North vs South (Pearson’s
chi-square, unadjusted-P value,0.00148), and in the limit of
significance Center vs South (Pearson’s chi-square, unadjusted-P
value,0.049).
Autosomal ancestry in ItalyA panel of 52 AIMs was genotyped in 435 Italian individuals in
order to estimate the proportion of ancestry from a three-way
differentiation: sub-Saharan Africa, Europe and Asia. Structure
analyses allowed us to infer membership proportions in population
samples, and these proportions can be graphically displayed, as in
Figure 2. This analysis indicated that Italians have a basal
proportion of sub-Saharan ancestry that is higher (9.2%, on
average) than other central or northern European populations
(1.5%, on average). The amount of African ancestry in Italians is
however more comparable to (but slightly higher than) the average
in other Mediterranean countries (7.1%). Figure 2 shows in a
triangle plot the relationships of Italians compared to other
European, African and Asian populations.
PCA observations confirmed the results from Structure analysis,
clustering Italian profiles tightly with other European ones. Thus,
PCA indicated that North, Central and South Italy do not show
differences between them, nor from other European populations
(Figure 2). PCA also indicated clear-cut differences between
Italians, Africans and Asians (Figure 2).
AMOVAAMOVA analyses were carried out following different grouping
schemes. The samples were pooled into a single population, but
also by considering main Italian regions. Analyses were carried out
over haplogroups and haplotypes of the Y-chromosome and the
mtDNA (Table 3).
AMOVA indicated that, among populations, variance was
more strongly stratified for the Y-chromosome than for the
Table 2. Diversity indices computed for different Italian regions based on Y-SNPs.
Population Region Reference N k k/n Gene Diversity
Liguria NW Present study 46 9 0.19 0.766260.0502
Ladin NE [14] 34 6 0.17 0.534860.0979
Udine NE Present study 47 10 0.21 0.776160.0441
Central Tuscany CW [14] 40 8 0.20 0.739760.0616
Elba Island CW [14] 94 7 0.07 0.674260.0445
Latini CW Present study 44 11 0.25 0.825660.0395
Latium CW [14] 43 9 0.20 0.802660.0388
Tuscany-Latium border CW [14] 76 7 0.09 0.755460.0350
Central Marche CE [14] 59 7 0.11 0.729460.0364
Marche CE [11] 162 13 0.08 0.848960.0152
Marche-Appennine CE [14] 25 7 0.28 0.803360.0514
Modena CE [98] 62 8 0.12 0.532060.0743
Piceni CE Present study 38 9 0.23 0.820860.0450
Rimini-Val Marecchia CE [99] 163 12 0.35 0.699060.0308
Belvedere SW Present study 27 9 0.33 0.854760.0477
East Campania SW [14] 46 7 0.15 0.687060.0618
Sicily SW Present study 57 12 0.21 0.832760.0311
West Campania SW [14] 80 10 0.12 0.844660.0224
West Calabria SW [14] 57 7 0.12 0.752560.0307
Sanniti SE Present study 30 10 0.33 0.864460.0409
Grecani Salentini SE Present study 47 7 0.14 0.812260.0242
Lucera SE [31] 60 9 0.15 0.836560.0236
South Apulia SE [14] 49 9 0.18 0.852960.0237
Sardinia [100] 336 14 0.04 0.809860.0136
Geographical region
North Italy – – 127 14 0.11 0.840060.0189
Central Italy – – 806 21 0.03 0.887060.0053
South Italy – – 453 20 0.04 0.890960.0060
West Italy (without Sicily) – – 553 17 0.03 0.856760.0094
West Italy (with Sicily) – – 610 20 0.03 0.870560.0078
East Italy – – 776 22 0.02 0.903460.0037
Codes are as in Table 1.doi:10.1371/journal.pone.0050794.t002
Patterns of mtDNA Variation in Italy
PLOS ONE | www.plosone.org 8 December 2012 | Volume 7 | Issue 12 | e50794
mtDNA; the difference was much more marked for the analysis
based on haplogroups (14.39% vs 1.17%) than for the analysis
based on haplotypes (2.34% vs 0.79%). Among population
variance was very low when analyzing main geographical regions;
however, it was the latitude (North vs Center vs South) that
appeared to account for higher values of among-population
variance rather than longitude (West vs East), with the exception of
the Y-chromosome haplogroups (although the values are below
1%); Table 3. Again, the Y-chromosome showed slightly higher
values of among-population variance than did the mtDNA. For
the Y-chromosome, a significant proportion of the within-
population variance moved to among-population within-groups
variance, probably due to the fact that all population samples had
a very high proportion of singleton Yfiler haplotypes, elevating the
maximum values of haplogroup diversity for all of them [33].
Linguistic isolates: Ladin and Grecani SalentiniTwo linguistic isolates are represented in the samples analyzed
in the present study: the Ladin and the Grecani Salentini.
Other population samples of the Ladin have already been
analyzed in the literature [22,62,63]. We here sampled 41 new
Figure 3. Phylogeny of Y-chromosome SNPs and haplogroup frequencies in different Italian populations.doi:10.1371/journal.pone.0050794.g003
Table 3. AMOVA analysis of main Italian regions (Permutations: 20000; P-value,0.0000) for the mtDNA control region data andthe Y-chromosome STRs and SNPs.
All populations (%)North vs Center vs South(%) West vs East (%)
HAPLOTYPES
mtDNA (48 populations)
Among pops 0.79 0 0
Within pops 99.21 99.25 99.21
Among pops within groups – 0.75 0.79
Y-chromosome (15 populations)
Among pops 2.34 1.18 0
Within pops 97.66 97.32 97.85
Among pops within groups – 1.50 2.15
HAPLOGROUPS
mtDNA (19 populations)
Among pops 1.17 0.36 0
Within pops 98.83 98.72 98.83
Among pops within groups – 0.92 1.17
Y-chromosome (24 populations)
Among pops 13.92 0.07 0.83
Within pops 86.08 86.06 85.74
Among pops within groups – 13.87 13.44
Sardinians were not included in the analysis. References for population samples are given in Table S2.doi:10.1371/journal.pone.0050794.t003
Patterns of mtDNA Variation in Italy
PLOS ONE | www.plosone.org 9 December 2012 | Volume 7 | Issue 12 | e50794
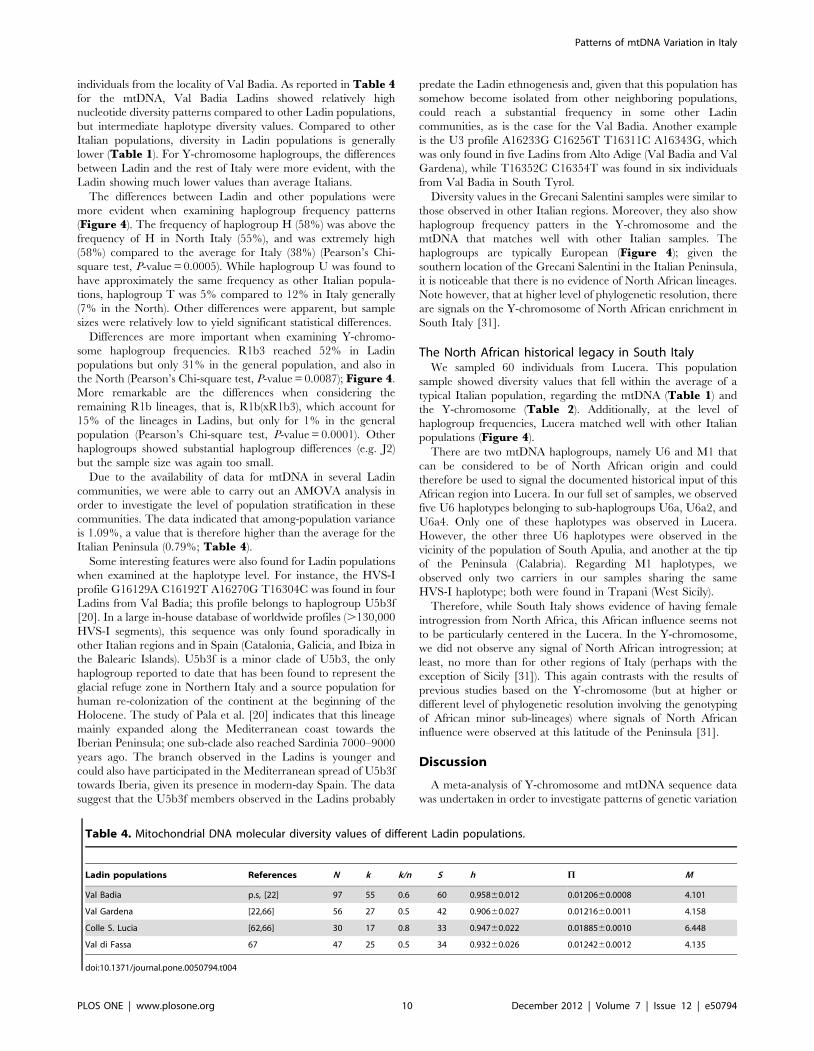
individuals from the locality of Val Badia. As reported in Table 4for the mtDNA, Val Badia Ladins showed relatively high
nucleotide diversity patterns compared to other Ladin populations,
but intermediate haplotype diversity values. Compared to other
Italian populations, diversity in Ladin populations is generally
lower (Table 1). For Y-chromosome haplogroups, the differences
between Ladin and the rest of Italy were more evident, with the
Ladin showing much lower values than average Italians.
The differences between Ladin and other populations were
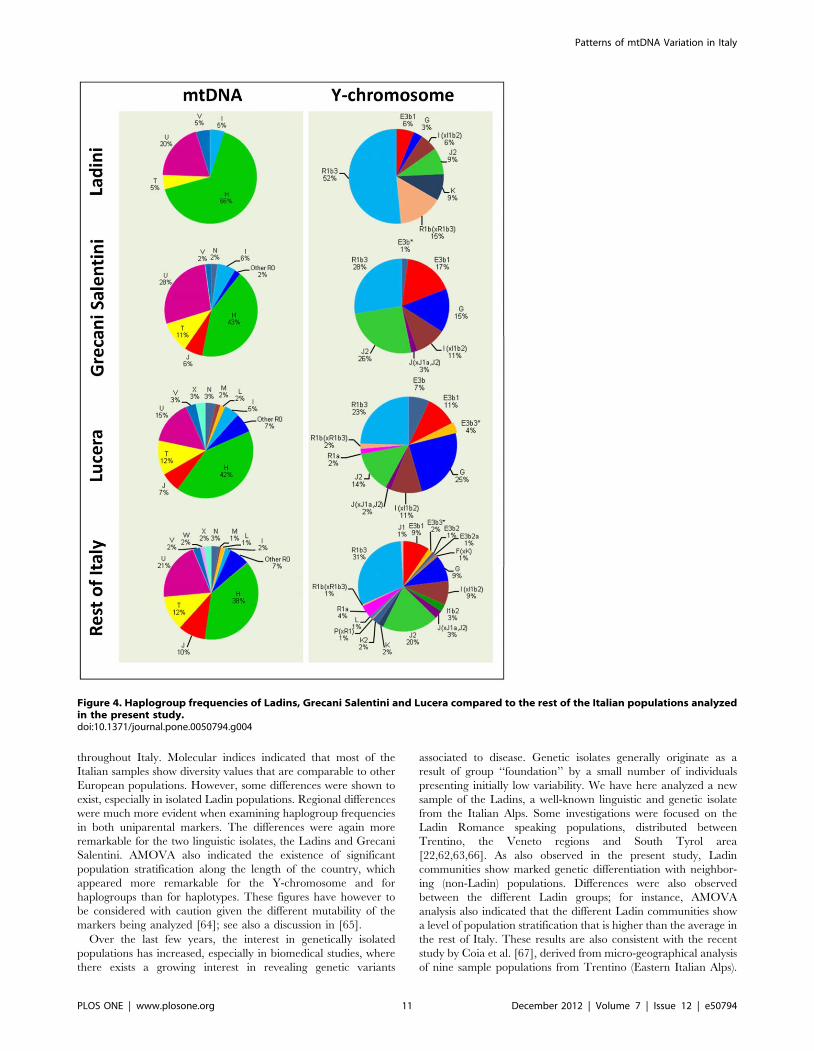
more evident when examining haplogroup frequency patterns
(Figure 4). The frequency of haplogroup H (58%) was above the
frequency of H in North Italy (55%), and was extremely high
(58%) compared to the average for Italy (38%) (Pearson’s Chi-
square test, P-value = 0.0005). While haplogroup U was found to
have approximately the same frequency as other Italian popula-
tions, haplogroup T was 5% compared to 12% in Italy generally
(7% in the North). Other differences were apparent, but sample
sizes were relatively low to yield significant statistical differences.
Differences are more important when examining Y-chromo-
some haplogroup frequencies. R1b3 reached 52% in Ladin
populations but only 31% in the general population, and also in
the North (Pearson’s Chi-square test, P-value = 0.0087); Figure 4.
More remarkable are the differences when considering the
remaining R1b lineages, that is, R1b(xR1b3), which account for
15% of the lineages in Ladins, but only for 1% in the general
population (Pearson’s Chi-square test, P-value = 0.0001). Other
haplogroups showed substantial haplogroup differences (e.g. J2)
but the sample size was again too small.
Due to the availability of data for mtDNA in several Ladin
communities, we were able to carry out an AMOVA analysis in
order to investigate the level of population stratification in these
communities. The data indicated that among-population variance
is 1.09%, a value that is therefore higher than the average for the
Italian Peninsula (0.79%; Table 4).
Some interesting features were also found for Ladin populations
when examined at the haplotype level. For instance, the HVS-I
profile G16129A C16192T A16270G T16304C was found in four
Ladins from Val Badıa; this profile belongs to haplogroup U5b3f
[20]. In a large in-house database of worldwide profiles (.130,000
HVS-I segments), this sequence was only found sporadically in
other Italian regions and in Spain (Catalonia, Galicia, and Ibiza in
the Balearic Islands). U5b3f is a minor clade of U5b3, the only
haplogroup reported to date that has been found to represent the
glacial refuge zone in Northern Italy and a source population for
human re-colonization of the continent at the beginning of the
Holocene. The study of Pala et al. [20] indicates that this lineage
mainly expanded along the Mediterranean coast towards the
Iberian Peninsula; one sub-clade also reached Sardinia 7000–9000
years ago. The branch observed in the Ladins is younger and
could also have participated in the Mediterranean spread of U5b3f
towards Iberia, given its presence in modern-day Spain. The data
suggest that the U5b3f members observed in the Ladins probably
predate the Ladin ethnogenesis and, given that this population has
somehow become isolated from other neighboring populations,
could reach a substantial frequency in some other Ladin
communities, as is the case for the Val Badia. Another example
is the U3 profile A16233G C16256T T16311C A16343G, which
was only found in five Ladins from Alto Adige (Val Badia and Val
Gardena), while T16352C C16354T was found in six individuals
from Val Badia in South Tyrol.
Diversity values in the Grecani Salentini samples were similar to
those observed in other Italian regions. Moreover, they also show
haplogroup frequency patters in the Y-chromosome and the
mtDNA that matches well with other Italian samples. The
haplogroups are typically European (Figure 4); given the
southern location of the Grecani Salentini in the Italian Peninsula,
it is noticeable that there is no evidence of North African lineages.
Note however, that at higher level of phylogenetic resolution, there
are signals on the Y-chromosome of North African enrichment in
South Italy [31].
The North African historical legacy in South ItalyWe sampled 60 individuals from Lucera. This population
sample showed diversity values that fell within the average of a
typical Italian population, regarding the mtDNA (Table 1) and
the Y-chromosome (Table 2). Additionally, at the level of
haplogroup frequencies, Lucera matched well with other Italian
populations (Figure 4).
There are two mtDNA haplogroups, namely U6 and M1 that
can be considered to be of North African origin and could
therefore be used to signal the documented historical input of this
African region into Lucera. In our full set of samples, we observed
five U6 haplotypes belonging to sub-haplogroups U6a, U6a2, and
U6a4. Only one of these haplotypes was observed in Lucera.
However, the other three U6 haplotypes were observed in the
vicinity of the population of South Apulia, and another at the tip
of the Peninsula (Calabria). Regarding M1 haplotypes, we
observed only two carriers in our samples sharing the same
HVS-I haplotype; both were found in Trapani (West Sicily).
Therefore, while South Italy shows evidence of having female
introgression from North Africa, this African influence seems not
to be particularly centered in the Lucera. In the Y-chromosome,
we did not observe any signal of North African introgression; at
least, no more than for other regions of Italy (perhaps with the
exception of Sicily [31]). This again contrasts with the results of
previous studies based on the Y-chromosome (but at higher or
different level of phylogenetic resolution involving the genotyping
of African minor sub-lineages) where signals of North African
influence were observed at this latitude of the Peninsula [31].
Discussion
A meta-analysis of Y-chromosome and mtDNA sequence data
was undertaken in order to investigate patterns of genetic variation
Table 4. Mitochondrial DNA molecular diversity values of different Ladin populations.
Ladin populations References N k k/n S h P M
Val Badia p.s, [22] 97 55 0.6 60 0.95860.012 0.0120660.0008 4.101
Val Gardena [22,66] 56 27 0.5 42 0.90660.027 0.0121660.0011 4.158
Colle S. Lucia [62,66] 30 17 0.8 33 0.94760.022 0.0188560.0010 6.448
Val di Fassa 67 47 25 0.5 34 0.93260.026 0.0124260.0012 4.135
doi:10.1371/journal.pone.0050794.t004
Patterns of mtDNA Variation in Italy
PLOS ONE | www.plosone.org 10 December 2012 | Volume 7 | Issue 12 | e50794
throughout Italy. Molecular indices indicated that most of the
Italian samples show diversity values that are comparable to other
European populations. However, some differences were shown to
exist, especially in isolated Ladin populations. Regional differences
were much more evident when examining haplogroup frequencies
in both uniparental markers. The differences were again more
remarkable for the two linguistic isolates, the Ladins and Grecani
Salentini. AMOVA also indicated the existence of significant
population stratification along the length of the country, which
appeared more remarkable for the Y-chromosome and for
haplogroups than for haplotypes. These figures have however to
be considered with caution given the different mutability of the
markers being analyzed [64]; see also a discussion in [65].
Over the last few years, the interest in genetically isolated
populations has increased, especially in biomedical studies, where
there exists a growing interest in revealing genetic variants
associated to disease. Genetic isolates generally originate as a
result of group ‘‘foundation’’ by a small number of individuals
presenting initially low variability. We have here analyzed a new
sample of the Ladins, a well-known linguistic and genetic isolate
from the Italian Alps. Some investigations were focused on the
Ladin Romance speaking populations, distributed between
Trentino, the Veneto regions and South Tyrol area
[22,62,63,66]. As also observed in the present study, Ladin
communities show marked genetic differentiation with neighbor-
ing (non-Ladin) populations. Differences were also observed
between the different Ladin groups; for instance, AMOVA
analysis also indicated that the different Ladin communities show
a level of population stratification that is higher than the average in
the rest of Italy. These results are also consistent with the recent
study by Coia et al. [67], derived from micro-geographical analysis
of nine sample populations from Trentino (Eastern Italian Alps).
Figure 4. Haplogroup frequencies of Ladins, Grecani Salentini and Lucera compared to the rest of the Italian populations analyzedin the present study.doi:10.1371/journal.pone.0050794.g004
Patterns of mtDNA Variation in Italy
PLOS ONE | www.plosone.org 11 December 2012 | Volume 7 | Issue 12 | e50794
Genetic differences between Ladin samples are most likely to be
due to the limited historical gene flow existing between these
communities [22]. In this regard, it is also noticeable that, while
the South Tyrol populations show clear signatures of isolation, the
Veneto groups presented a high degree of genetic variability [68].
The Grecani Salentini also showed signatures of genetic
isolation when compared to other Italian populations, but the
differences are not as marked as observed for the Ladins. The
differences with respect to neighboring Italian populations were
not evident when observing individual haplotypes (as occurs with
the Ladins), but were clearer when considering haplogroup
frequencies (Figure 4). Larger sample sizes are needed in order
to gather more signatures about the demographic past of this
population. Thus, the Ladins show a more distinctive pattern than
the Grecani Salentini, which is to be expected given that not only
is the Ladin population a linguistic isolate, but also that these
communities are confined to isolated geographical areas of the
Alps.
Apart from the regional and local genetic differences observed
in Italy, it is also worth examining global genetic patterns along the
length of continental Italy.
Geographical clines of Y-chromosome haplogroups in Europe
have been previously reported in the literature [13]; these patterns
have found support in archaeological and linguistic evidence. In
the Italian peninsula, the Y-chromosome variation also shows a
clinal pattern along the North–South axis; the Mesolithic
haplogroup R1*(xR1a1) shows higher frequency in the North
while the Neolithic haplogroup J2-M172 is superposed to this
Mesolithic strata with frequency patterns running in the opposite
direction [14,69]. The results of the present study agreed with
these earlier findings. Thus, for instance, R1b3 reached 31% in
the North, 16% in the Center, and 14% in the South. Frequency
of Y-chromosome haplogroup J2 was found to be 9% in the
North, 37% in the Center, and 22% in the South (average in Italy:
14.5%). Haplogroup J2 is widely believed to be associated with the
spread of agriculture from Mesopotamia. The main spread of J2
into the Mediterranean area is thought to have coincided with the
expansion of agricultural populations during the Neolithic period.
As reported by Di Giacomo et al. [12], haplogroup J ‘‘…constitutes
not only the signature of a single wave-of-advance from the Levant but, to a
greater extent, also of the expansion of the Greek world, with an accompanying
novel quota of genetic variation produced during its demographic growth…’’;
also that ‘‘…in the central and west Mediterranean, the entry of J
chromosomes may have occurred mainly by sea, i.e., in the south–east of both
Spain and Italy…’’. J2-M12 is almost totally represented by its
sublineage J2-M102, which shows frequency peaks in both the
southern Balkans and north-central Italy (14%; [13]). J2-M67 is
most frequent in the Caucasus, and J2-M92 indicates affinity
between Anatolia and southern Italy (21.6%; [13]). For the J1-
M170 clade, the peaks of J1-M267 are in the Levant and in
northern Africa, and it is closely associated to the diffusion of the
Arab people, dropping abruptly outside of this area (including
Anatolia and the Iberian peninsula), even if it shows an
appreciable percentage in Sicily [70]. In a recent study, Pala et
al. [71] confirmed that mtDNA haplogroups J and T and their
major sub-clades (J1 and J2, T1 and T2) most likely arose in the
Near East at the time of the first settlement by modern humans
and the LGM. These haplogroups started to spread from the Near
East into Europe immediately after the peak of the last glaciation,
about 19 kya ago, with a major expansions in Europe in the Late
Glacial period, about 16–12 kya ago, thus indicating that many of
the Neolithic expansions from southern Europe into Central
Europe and the Mediterranean might have been indigenous
dispersal of these lineages.
Latitudinal clinal frequency patterns are also observed for the
mtDNA haplogroups mirroring those of the Y-chromosome. As
reported by Richards et al. [38], haplogroups H, K, T*, T2, W,
and X are the major contributors to the Late Upper Paleolithic,
and the central-Mediterranean region has the greatest Middle
Upper Paleolithic component outside the Caucasus. In agreement
with the Y-chromosome, we observed that all these Paleolithic
haplogroups together add to approximately 70.3% in the North,
60.8% in the Center, and 54% in the South of Italy. The opposite
pattern was observed for the main mtDNA Neolithic component,
represented by haplogroups J and T1, which accounted for 5.8%
in the North, 10.3% in the Center, and 14.1% in the South (Italian
average: 10.5%).
As early as 1934, [72], Vere Gordon Childe suggested that the
indigenous communities of hunters and gatherers of the Mesolithic
European cultures were replaced by communities of farmers
migrating to the North from the Middle East, a process that lasted
for several generations. The first stream of emigration followed the
route along the continental Balkan Peninsula and the Danube,
while another, slightly later, emigration spread along the coasts of
the Mediterranean Sea from East to West. The latter path would
fit well with the distribution of other Neolithic cultural features,
such as the so-called Cardium Pottery (or Cardial Ware) [73], the
ceramic decorative style that better defines the Neolithic culture.
This culture entered from Greece towards the South-Center of
Italy through the Adriatic Sea, carried by the same farmers that
introduced, for instance, Y-chromosome haplogroup J2 at about
the same frequency in Central and South Italy, but with lower
introgression into the North; from here followed further Mediter-
ranean expansions towards Iberia.
The sub-clade E3b1 (probably originating in eastern Africa) has
a wide distribution in sub-Saharan Africa, Middle East and
Europe. This haplogroup reaches a frequency of 8% in the North
and Center and slightly higher in the South of Italy, 11%
(Figure 1). It has also been argued that the European distribution
of E3b1 is compatible with the Neolithic demic diffusion of
agriculture [15]; thus, two sub-clades, E3b1a- M78 and E3b1c-
M123 present a higher occurrence in Anatolia, the Balkans and
the Italian peninsula. Another sub-clade, E3b1b-M81 is associated
with the Berber populations and is commonly found in regions
that have had historical gene flow with Northern Africa, such as
the Iberian peninsula [74,75]–[76–78], including the Canary
Islands [75], and Sicily [70,79]; the absence of microsatellite
variation suggests a very recent arrival from North Africa [80]. If
we assume that all E3b1 represents the only Y-chromosome
continental African contribution to Italy and L and U6 lineages
the continental African mtDNA component, the African compo-
nent in Italy is higher for the Y-chromosome (8–11%) than for
mtDNA (1–2%). The origin of sub-Saharan African mtDNAs in
Europe (including Italian samples) has been recently investigated
by Cerezo et al. [81]; the results indicate that a significant
proportion of these lineages could have arrived in Italy more than
10,000 years ago; therefore, their presence in Europe does not
necessarily date to the time of the Roman Empire, the Atlantic
slave trade or to modern migration.
In addition, the Northern African influence in the Italian
Peninsula is evidenced by the presence of Northern African Y
chromosome haplogroups (E1-M78) in three geographically close
samples across the southern Apennine mountains: East Campania,
Northwest Apulia and Lucera [31]. The Lucera sample analyzed
in the present study did not however show a higher impact from
North Africa than for other areas from southern Italy [31].
Finally, in agreement with uniparental markers, analysis of
AIMs as carried out in the present study indicated that Italy shows
Patterns of mtDNA Variation in Italy
PLOS ONE | www.plosone.org 12 December 2012 | Volume 7 | Issue 12 | e50794
a very minor sub-Saharan African component that is, however,
slightly higher than non-Mediterranean Europe. This agrees with
the recent findings of Cerezo et al. [82] based on the analysis of
entire mtDNA genomes pointing to the arrival in ancient and
historical times of sub-Saharan African people to the Mediterra-
nean Europe, followed by admixture.
The present study represents the largest meta-analysis carried
out to date for the Italian peninsula. We observed that the Y-
chromosome and the mtDNA retain the imprint of the major
ancestral events occurring in Italy; however, the Y-chromosome
shows more marker regional differences than does the mtDNA. It
is difficult to infer what proportion of these differences can be
attributed not only exclusively to gender demographic differences,
but also to the fact that both markers were analyzed to different
levels of molecular resolution. Italy shows clines of variation
attributable to the demographic movements of the first Paleolithic
settlements, posteriorly modeled by the Mesolithic and, to a lesser
extent, Neolithic farmers. Regional differences arose with time,
which are more notable in linguistic isolates, such as the Ladin
populations, and to a minor extent, the Grecani Salentini. Lot of
effort has been dedicated during the last two decades to the study
of Italian populations. Further studies are needed in order to dig
into some of the many demographic movements occurring in the
Italian peninsula along history. Entire genome sequencing of
particular lineages (in the line of e.g. [20]) and nuclear DNA
genomic studies are needed in order to explore hypothesis beyond
what has been done to date in Italy.
Supporting Information
Table S1 mtSNPs and primers used to characterize J/Tand U and some of their sub-clades.(XLS)
Table S2 References to the population samples used inthe present study for population comparison analysis.(XLS)
Table S3 Mitochondrial DNA control region haplotypesobtained from the samples analyzed in the presentstudy.(XLS)
Table S4 Y-SNP and Y-STR profiles of the Italiansamples analyzed in the present study. Note that the Y-
STR data has already been reported in Brisighelli et al. [65].
(XLS)
Acknowledgments
We would like to thank two anonymous reviewers for their very useful
comments on the present study.
Author Contributions
Conceived and designed the experiments: FB CC AS. Performed the
experiments: FB VAI MF ABV. Analyzed the data: FB AS. Contributed
reagents/materials/analysis tools: AC VLP AS. Wrote the paper: FB AS.
Critically revised the paper and made suggestions on a first draft: CC.
Approved the final version of the manuscript: FB VAI MF ABV AC VLP
AS.
References
1. Cunliffe B (2001) The Oxford Illustrated History of Prehistoric Europe: Oxford
University Press.
2. Guidi A, Piperno M (2005) Italia preistorica. Roma: Laterza.
3. Abulafia D (2001) The Great Sea: A human history of the MediterraneanOxford University Press.
4. Buti GG (1974) Preistoria e storia delle regioni d’Italia: Sansoni Universita.
5. Devoto G (1977) Gli antichi italici: Firenze, Vallecchi.
6. Pallottino M (1981) Genti e culture dell’Italia preromana. Jouvence: 136.
7. Stenico M, Nigro L, Barbujani G (1998) Mitochondrial lineages in Ladin-speaking communities of the eastern Alps. Proc R Soc Lond B 265: 555–561.
8. Achilli A, Olivieri A, Pala M, Metspalu E, Fornarino S, et al. (2007)
Mitochondrial DNA variation of modern Tuscans supports the near easternorigin of Etruscans. Am J Hum Genet 80: 759–768.
9. Brisighelli F, Capelli C, Alvarez-Iglesias V, Onofri V, Paoli G, et al. (2009) The
Etruscan timeline: A recent Anatolian connection. Eur J Hum Genet 17: 693–
696.
10. Francalacci P, Bertranpetit J, Calafell F, Underhill PA (1996) Sequence diversityof the control region of mitochondrial DNA in Tuscany and its implications for
the peopling of Europe. Am J Phys Anthropol 100: 443–460.
11. Onofri V, Alessandrini F, Turchi C, Fraternale B, Buscemi L, et al. (2007) Y-chromosome genetic structure in sub-Apennine populations of Central Italy by
SNP and STR analysis. Int J Legal Med 121: 234–237.
12. Di Giacomo F, Luca F, Anagnou N, Ciavarella G, Corbo RM, et al. (2003)
Clinal patterns of human Y chromosomal diversity in continental Italy andGreece are dominated by drift and founder effects. Mol Phylogenet Evol 28:
387–395.
13. Semino O, Passarino G, Oefner PJ, Lin AA, Arbuzova S, et al. (2000) Thegenetic legacy of Paleolithic Homo sapiens sapiens in extant Europeans: A Y
chromosome perspective. Science 290: 1155–1159.
14. Capelli C, Brisighelli F, Scarnicci F, Arredi B, Caglia A, et al. (2007) Y
chromosome genetic variation in the Italian peninsula is clinal and supports anadmixture model for the Mesolithic-Neolithic encounter. Mol Phylogenet Evol
44: 228–239.
15. Semino O, Magri C, Benuzzi G, Lin AA, Al-Zahery N, et al. (2004) Origin,
diffusion, and differentiation of Y-chromosome haplogroups E and J: Inferenceson the neolithization of Europe and later migratory events in the Mediterranean
area. Am J Hum Genet 74: 1023–1034.
16. Trombetta B, Cruciani F, Sellitto D, Scozzari R (2011) A new topology of thehuman Y chromosome haplogroup E1b1 (E-P2) revealed through the use of
newly characterized binary polymorphisms. PLoS ONE 6: e16073.
17. Francalacci P, Sanna D (2008) History and geography of human Y-chromosome
in Europe: A SNP perspective. J Anthropol Sci 86: 59–89.
18. Di Gaetano C, Cerutti N, Crobu F, Robino C, Inturri S, et al. (2009) Differential
Greek and northern African migrations to Sicily are supported by genetic
evidence from the Y chromosome. Eur J Hum Genet 17: 91–99.
19. Brigaglia M (1989) Storia della Sardegna. Edizioni Della Torre.
20. Pala M, Achilli A, Olivieri A, Kashani BH, Perego UA, et al. (2009)
Mitochondrial haplogroup U5b3: A distant echo of the epipaleolithic in Italy
and the legacy of the early Sardinians. Am J Hum Genet 84: 814–821.
21. Montanini L, Regna-Gladin C, Eoli M, Albarosa R, Carrara F, et al. (2005)
Instability of mitochondrial DNA and MRI and clinical correlations in
malignant gliomas. J Neurooncol 74: 87–89.
22. Thomas MG, Barnes I, Weale ME, Jones AL, Forster P, et al. (2008) New
genetic evidence supports isolation and drift in the Ladin communities of the
South Tyrolean Alps but not an ancient origin in the Middle East. Eur J Hum
Genet 16: 124–134.
23. Achilli A, Rengo C, Magri C, Battaglia V, Olivieri A, et al. (2004) The molecular
dissection of mtDNA haplogroup H confirms that the Franco-Cantabrian glacial
refuge was a major source for the European gene pool. Am J Hum Genet 75:
910–918.
24. Torroni A, Bandelt H-J, Macaulay V, Richards M, Cruciani F, et al. (2001) A
signal, from human mtDNA, of postglacial recolonization in Europe. Am J Hum
Genet 69: 844–852.
25. Alvarez-Iglesias V, Mosquera-Miguel A, Cerezo M, Quintans B, Zarrabeitia
MT, et al. (2009) New population and phylogenetic features of the internal
variation within mitochondrial DNA macro-haplogroup R0. PLoS One 4:
e5112.
26. Gomez-Carballa A, Olivieri A, Behar DM, Achilli A, Torroni A, et al. (2012)
Genetic continuity in the Franco-Cantabrian region: New clues from
autochthonous mitogenomes. PLoS ONE 7: e32851.
27. De Concini W (2003) Gli altri d’Italia: minoranze linguistiche allo specchio
Pergine Valsugana (TN).
28. Castagnetti A (2004) Storia del Trentino. (L’eta Medievale). 3 Vol, Bologna, Il
Mulino, 2000–2005.
29. De Concini W (1997) Gli altri delle Alpi. Minoranze linguistiche dell’arco alpino
italiano. Trento, Grafiche Artigianelli.
30. Carducci L (1993) Storia del Salento. La terra de’Otranto dale origini ai primi
del cinquecento. Galatina: Congedo.
31. Capelli C, Onofri V, Brisighelli F, Boschi I, Scarnicci F, et al. (2009) Moors and
Saracens in Europe: Estimating the medieval North African male legacy in
southern Europe. Eur J Hum Genet 17: 848–852.
32. Norman D (1975) The Arabs and Medieval Europe. London, UK Longmann
Group Limited.
Patterns of mtDNA Variation in Italy
PLOS ONE | www.plosone.org 13 December 2012 | Volume 7 | Issue 12 | e50794
33. Brisighelli F, Blanco-Verea A, Boschi I, Garagnani P, Pascali VL, et al. (2011)Global patterns of Y-STR variation in Italy. Forensic Sci Int Genet in press;
10.1016/j.fsigen.2012.03.003.
34. Miller SA, Dykes DD, Polesky HF (1988) A simple salting out procedure for
extracting DNA from human nucleated cells. Nucleic Acids Res 16: 1215.
35. Alvarez-Iglesias V, Jaime JC, Carracedo A, Salas A (2007) Coding region
mitochondrial DNA SNPs: targeting East Asian and Native Americanhaplogroups. Forensic Sci Int Genet 1: 44–55.
36. Anderson S, Bankier AT, Barrell BG, de Bruijn MHL, Coulson AR, et al. (1981)
Sequence and organization of the human mitochondrial genome. Nature 290:
457–465.
37. Quintans B, Alvarez-Iglesias V, Salas A, Phillips C, Lareu MV, et al. (2004)Typing of mitochondrial DNA coding region SNPs of forensic and anthropo-
logical interest using SNaPshot minisequencing. Forensic Sci Int 140: 251–257.
38. Richards M, Macaulay V, Hickey E, Vega E, Sykes B, et al. (2000) Tracing
European founder lineages in the Near Eastern mtDNA pool. Am J Hum Genet67: 1251–1276.
39. Brion M, Sobrino B, Blanco-Verea A, Lareu MV, Carracedo A (2005)Hierarchical analysis of 30 Y-chromosome SNPs in European populations.
Int J Legal Med 119: 10–15.
40. YCC (2002) A nomenclature system for the tree of human Y-chromosomal
binary haplogroups. Genome Res 12: 339–348.
41. Sanchez JJ, Phillips C, Børsting C, Balogh K, Bogus M, et al. (2006) A multiplex
assay with 52 single nucleotide polymorphisms for human identification.Electrophoresis 27: 13–24.
42. Amigo J, Salas A, Phillips C (2011) ENGINES: exploring single nucleotidevariation in entire human genomes. BMC Bioinformatics 12: 105.
43. Amigo J, Salas A, Phillips C, Carracedo A (2008) SPSmart: adapting population
based SNP genotype databases for fast and comprehensive web access. BMC
Bioinformatics 9: 428.
44. Nei N (1987) Molecular evolutionary genetics: New York: Columbia UniversityPress.
45. Tajima F (1983) Evolutionary relationship of DNA sequences in finitepopulations. Genetics 105: 437–460.
46. Tajima F (1993) Unbiased estimation of evolutionary distance betweennucleotide sequences. Mol Biol Evol 10: 677–688.
47. Rozas J, Sanchez-DelBarrio JC, Messeguer X, Rozas R (2003) DnaSP, DNA
polymorphism analyses by the coalescent and other methods. Bioinformatics 19:
2496–2497.
48. Excoffier L, Lischer HEL (2010) Arlequin suite ver 3.5: A new series of programsto perform population genetics analyses under Linux and Windows. Mol Ecol
Res 10: 564–567.
49. Loogvali E-L, Roostalu U, Malyarchuk BA, Derenko MV, Kivisild T, et al.
(2004) Disuniting uniformity: A pied cladistic canvas of mtDNA haplogroup H
in Eurasia. Mol Biol Evol 21: 2012–2021.
50. Macaulay V, Richards M, Hickey E, Vega E, Cruciani F, et al. (1999) Theemerging tree of West Eurasian mtDNAs: a synthesis of control-region sequences
and RFLPs. Am J Hum Genet 64: 232–249.
51. van Oven M, Kayser M (2009) Updated comprehensive phylogenetic tree of
global human mitochondrial DNA variation. Hum Mutat 30: E386–394.
52. Salas A, Yao Y-G, Macaulay V, Vega A, Carracedo A, et al. (2005) A critical
reassessment of the role of mitochondria in tumorigenesis. PLoS Med 2: e296.
53. Salas A, Prieto L, Montesino M, Albarran C, Arroyo E, et al. (2005)
Mitochondrial DNA error prophylaxis: Assessing the causes of errors in theGEP’02-03 proficiency testing trial. Forensic Sci Int 148: 191–198.
54. Salas A, Carracedo A, Macaulay V, Richards M, Bandelt H-J (2005) A practical
guide to mitochondrial DNA error prevention in clinical, forensic, and
population genetics. Biochem Biophys Res Commun 335: 891–899.
55. Salas A, Bandelt H-J, Macaulay V, Richards MB (2007) Phylogeographic
investigations: The role of trees in forensic genetics. Forensic Sci Int 168: 1–13.
56. Yao Y-G, Salas A, Logan I, Bandelt H-J (2009) mtDNA data mining inGenBank needs surveying. Am J Hum Genet 85: 929–933; author reply 933.
57. Bandelt H-J, Salas A, Lutz-Bonengel S (2004) Artificial recombination inforensic mtDNA population databases. Int J Legal Med 118: 267–273.
58. Bandelt H-J, Salas A, Bravi CM (2004) Problems in FBI mtDNA database.Science 305: 1402–1404.
59. Bandelt H-J, Quintana-Murci L, Salas A, Macaulay V (2002) The fingerprint of
phantom mutations in mitochondrial DNA data. Am J Hum Genet 71: 1150–
1160.
60. Olivieri A, Achilli A, Pala M, Battaglia V, Fornarino S, et al. (2006) The mtDNAlegacy of the Levantine early Upper Palaeolithic in Africa. Science 314: 1767–
1770.
61. Salas A, Richards M, De la Fe T, Lareu MV, Sobrino B, et al. (2002) The
making of the African mtDNA landscape. Am J Hum Genet 71: 1082–1111.
62. Vernesi C, Fuselli S, Castri L, Bertorelle G, Barbujani G (2002) Mitochondrial
diversity in linguistic isolates of the Alps: A reappraisal. Hum Biol 74: 725–730.
63. Pichler I, Mueller JC, Stefanov SA, De Grandi A, Beu Volpato C, et al. (2006)
Genetic structure in contemporary South Tyrolean isolated populations revealedby analysis of Y-Chromosome, mtDNA, and Alu polymorphisms. Hum Biol 78:
441–464.
64. Meirmans PG, Hedrick PW (2011) Assessing population structure: F(ST) and
related measures. Mol Ecol Resour 11: 5–18.
65. Brisighelli F, Blanco-Verea A, Boschi I, Garagnani P, Pascali VL, et al. (2012)
Patterns of Y-STR variation in Italy. Forensic Sci Int Genet in press.
66. Stenico M, Nigro L, Bertorelle G, Calafell F, Capitanio M, et al. (1996) HighMitochondrial Sequence Diversity in Linguistic Isolates of the Alps. Am J Hum
Genet 59: 1363–1375.
67. Coia V, Boschi I, Trombetta F, Cavulli F, Montinaro F, et al. (2012) Evidence ofhigh genetic variation among linguistically diverse populations on a micro-
geographic scale: a case study of the Italian Alps. J Hum Genet 57: 254–260.
68. Destro Bisol G, Anagnostou P, Batini C, Battaggia C, Bertoncini S, et al. (2008)Italian isolates today: geographic and linguistic factors shaping human
biodiversity. J Anthropol Sci 86: 179–188.
69. Busby GB, Brisighelli F, Sanchez-Diz P, Ramos-Luis E, Martinez-Cadenas C, etal. (2012) The peopling of Europe and the cautionary tale of Y chromosome
lineage R-M269. Proc Biol Sci 279: 884–892.
70. Semino O, Magri C, Benuzzi G, Lin AA, Al-Zahery N, et al. (2004) Origin,diffusion, and differentiation of Y-chromosome haplogroups E and J: Inferences
on the neolithization of Europe and later migratory events in the Mediterraneanarea. Am J Hum Genet 74: 1023–1034.
71. Pala M, Olivieri A, Achilli A, Accetturo M, Metspalu E, et al. (2012)
Mitochondrial DNA signals of late glacial recolonization of Europe from neareastern refugia. Am J Hum Genet 90: 915–924.
72. Childe VG (1934) New light on the most ancient East: The oriental Prelude to
European prehistory: London: K Paul, Trench, Trubner & Co.
73. King R, Underhill P (2002) Congruent distribu- tion of Neolithic painted pottery
and ceramic figurines with Y-chromosome lineages. Antiquity 76: 707–714.
74. Maca-Meyer N, Sanchez-Velasco P, Flores C, Larruga JM, Gonzalez AM, et al.(2003) Y chromosome and mitochondrial DNA characterization of Pasiegos, a
human isolate from Cantabria (Spain). Ann Hum Genet 67: 329–339.
75. Flores C, Maca-Meyer N, Perez JA, Gonzalez AM, Larruga JM, et al. (2003) Apredominant European ancestry of paternal lineages from Canary Islanders.
Ann Hum Genet 67: 138–152.
76. Goncalves R, Freitas A, Branco M, Rosa A, Fernandes AT, et al. (2005) Y-chromosome lineages from Portugal, Madeira and Acores record elements of
Sephardim and Berber ancestry. Ann Hum Genet 69: 443–454.
77. Alonso S, Flores C, Cabrera V, Alonso A, Martin P, et al. (2005) The place ofthe Basques in the European Y-chromosome diversity landscape. Eur J Hum
Genet 13: 1293–1302.
78. Beleza S, Gusmao L, Lopes A, Alves C, Gomes I, et al. (2006) Micro-phylogeographic and demographic history of Portuguese male lineages. Ann
Hum Genet 70: 181–194.
79. Cruciani F, La Fratta R, Santolamazza P, Sellitto D, Pascone R, et al. (2004)Phylogeographic analysis of haplogroup E3b (E-M215) y chromosomes reveals
multiple migratory events within and out of Africa. Am J Hum Genet 74: 1014–1022.
80. Bosch E, Calafell F, Comas D, Oefner PJ, Underhill PA, et al. (2001) High-
resolution analysis of human Y-chromosome variation shows a sharpdiscontinuity and limited gene flow between northwestern Africa and the
Iberian Peninsula. Am J Hum Genet 68: 1019–1029.
81. Cerezo M, Achilli A, Olivieri A, Perego UA, Gomez-Carballa A, et al. (2012)Reconstructing ancient mitochondrial DNA links between Africa and Europe.
Genome Res in press.
82. Cerezo M, Achilli A, Olivieri A, Perego UA, Gomez-Carballa A, et al. (2012)Reconstructing ancient mitochondrial DNA links between Africa and Europe.
Genome Res 22: 821–826.
83. Amigo J, Phillips C, Salas A, Carracedo A (2009) Viability of in-house
datamarting approaches for population genetics analysis of SNP genotypes.
BMC Bioinformatics 10: S5.
84. Turchi C, Buscemi L, Giacchino E, Onofri V, Fendt L, et al. (2009)
Polymorphisms of mtDNA control region in Tunisian and Moroccan
populations: An enrichment of forensic mtDNA databases with Northern Africadata. Forensic Sci Int Genet 3: 166–172.
85. Messina F, Scorrano G, Labarga CM, Rolfo MF, Rickards O Mitochondrial
DNA variation in an isolated area of Central Italy. Ann Hum Biol 37: 385–402.
86. Babalini C, Martınez-Labarga C, Tolk HV, Kivisild T, Giampaolo R, et al.
(2005) The population history of the Croatian linguistic minority of Molise(southern Italy): A maternal view. Eur J Hum Genet 13: 902–912.
87. Falchi A, Giovannoni L, Calo CM, Piras IS, Moral P, et al. (2006) Genetic
history of some western Mediterranean human isolates through mtDNA HVR1polymorphisms. J Hum Genet 51: 9–14.
88. Verginelli F, Donati F, Coia V, Boschi I, Palmirotta R, et al. (2003) Variation of
the hypervariable region-1 of mitochondrial DNA in central-eastern Italy.J Forensic Sci 48: 443–444.
89. Bini C, Ceccardi S, Luiselli D, Ferri G, Pelotti S, et al. (2003) Different
informativeness of the three hypervariable mitochondrial DNA regions in thepopulation of Bologna (Italy). Forensic Sci Int 135: 48–52.
90. Tagliabracci C, Turchi C, Buscemi L, Sassaroli C (2001) Polymorphism of the
mitochondrial DNA control region in Italians. Int J Legal Med 114: 224–228.
91. Ottoni C, Martinez-Labarga C, Vitelli L, Scano G, Fabrini E, et al. (2009)
Human mitochondrial DNA variation in Southern Italy. Ann Hum Biol 36:
785–811.
92. Rose G, Longo T, Maletta R, Passarino G, Bruni AC, et al. (2008) No evidence
of association between frontotemporal dementia and major European mtDNA
haplogroups. Eur J Neurol 15: 1006–1008.
93. Ottoni C, Martinez-Labarga C, Loogvali EL, Pennarun E, Achilli A, et al.
(2009) First genetic insight into Libyan Tuaregs: a maternal perspective. Ann
Hum Genet 73: 438–448.
Patterns of mtDNA Variation in Italy
PLOS ONE | www.plosone.org 14 December 2012 | Volume 7 | Issue 12 | e50794
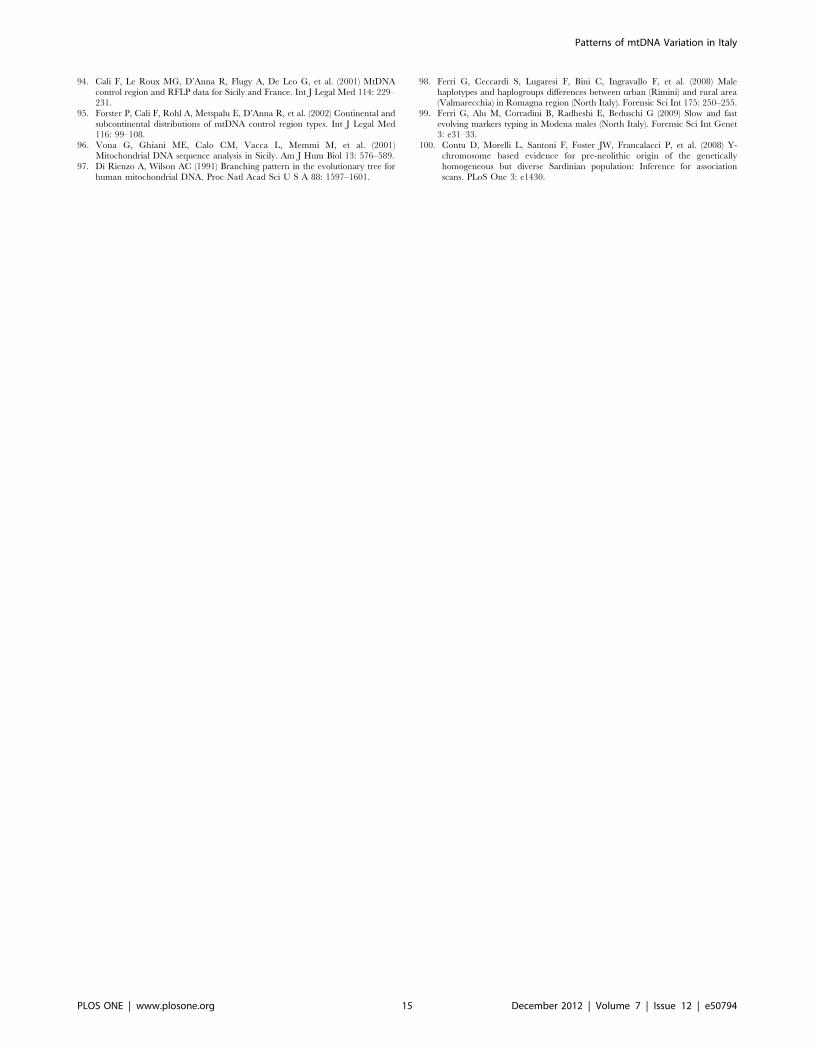
94. Cali F, Le Roux MG, D’Anna R, Flugy A, De Leo G, et al. (2001) MtDNA
control region and RFLP data for Sicily and France. Int J Legal Med 114: 229–231.
95. Forster P, Cali F, Rohl A, Metspalu E, D’Anna R, et al. (2002) Continental and
subcontinental distributions of mtDNA control region types. Int J Legal Med116: 99–108.
96. Vona G, Ghiani ME, Calo CM, Vacca L, Memmi M, et al. (2001)Mitochondrial DNA sequence analysis in Sicily. Am J Hum Biol 13: 576–589.
97. Di Rienzo A, Wilson AC (1991) Branching pattern in the evolutionary tree for
human mitochondrial DNA. Proc Natl Acad Sci U S A 88: 1597–1601.
98. Ferri G, Ceccardi S, Lugaresi F, Bini C, Ingravallo F, et al. (2008) Male
haplotypes and haplogroups differences between urban (Rimini) and rural area(Valmarecchia) in Romagna region (North Italy). Forensic Sci Int 175: 250–255.
99. Ferri G, Alu M, Corradini B, Radheshi E, Beduschi G (2009) Slow and fast
evolving markers typing in Modena males (North Italy). Forensic Sci Int Genet3: e31–33.
100. Contu D, Morelli L, Santoni F, Foster JW, Francalacci P, et al. (2008) Y-chromosome based evidence for pre-neolithic origin of the genetically
homogeneous but diverse Sardinian population: Inference for association
scans. PLoS One 3: e1430.
Patterns of mtDNA Variation in Italy
PLOS ONE | www.plosone.org 15 December 2012 | Volume 7 | Issue 12 | e50794


![PHYLOGENETIC ANALYSIS OF AVIAN PARENTAL CARE€¦ · types of parental care in bony fishes (i.e. among states of uniparental [male], uniparental [fe- male], biparental, and no parental](https://img.pdfslide.us/doc/110x75/5f0ab0957e708231d42cdb6f/phylogenetic-analysis-of-avian-parental-care-types-of-parental-care-in-bony-fishes.jpg)