Embed Size (px)
Citation preview
This PDF is a selection from an out-of-print volume from the National Bureauof Economic Research
Volume Title: When Public Sector Workers Unionize
Volume Author/Editor: Richard B. Freeman and Casey Ichniowski, eds.
Volume Publisher: University of Chicago Press
Volume ISBN: 0-226-26166-2
Volume URL: http://www.nber.org/books/free88-1
Publication Date: 1988
Chapter Title: Unions and Job Security in the Public Sector
Chapter Author: Steven G. Allen
Chapter URL: http://www.nber.org/chapters/c7913
Chapter pages in book: (p. 271 - 304)
10 Unions and Job Security in the Public Sector Steven G. Allen
Altogether, it's one sweet deal: generous pay and benefits, lifetime job security, meaningless performance evaluation, and, last, but not least, protection from all the swings of fortune that affect workers in private industry.
Alan Crawford, Washington Monthly, January 1983
10.1 Introduction
The question of how public sector employers adjust employment in periods of declining demand would not have been considered a serious issue until the last half of the 1970s. Employment at both the state and local levels grew at such a rapid and sustained pace before then that this issue arose only in a few isolated cases. This all changed with the 1974-75 recession and the widespread adoption of tax and expenditure limitations such as Proposition 13 in California. Since 1975, government employment has declined as a share of total employment, and since 1980 it has stayed about constant in absolute terms. As a result, many
Steven G. Allen is professor of economics and business at North Carolina State Uni- versity and research associate of the National Bureau of Economic Research.
The author thanks Richard Freeman, Charles Brown, Casey Ichniowski, Joe Altonji, Henry Farber, and participants of the North Carolina State University Labor Workshop for helpful comments; Jim Comer and Ron Holanek for computing assistance; and Myra Ragland for research assistance. This research was partially supported by the NBER's Public Sector Union project. The data utilized in this paper were made available in part by the Inter-University Consortium for Political and Social Research. The empirical results are reported in more detail in an earlier version of this paper, circulated as NBER working paper no. 2108.
271
272 Steven G . Allen
governments have been forced to make hard decisions about how to trim their payrolls.
This paper examines how public sector unions have been able to influence these decisions. Studies by Medoff (1979) and Blau and Kahn (1983) on the impact of unions on labor market adjustment in the private sector have found much higher temporary and indefinite layoff rates for union than for nonunion workers. There is mixed evidence on how unions affect permanent layoff rates. Freeman and Medoff (1984) report that permanent layoff rates calculated for three-digit manufacturing industries between 1958 and 1971 and in 1981 show no difference between industries that are predominantly unionized and those that are not, but they also show that the May 1973-75 and 1977 Current Population Surveys (CPS) for manufacturing workers indicate lower permanent layoff rates for union members. Blau and Kahn find higher permanent layoff rates for union than nonunion workers in manufacturing in the National Longitudinal Survey (NLS) younger male cohort, but no union-nonunion difference for manufacturing workers in the NLS older male cohort. When they expand these samples to include all sectors except construction, they find unionism has no effect on the probability of permanent layoff for either younger or older males.
Section 10.2 compares the postwar trend in unemployment rates for private and public sector workers and reports the first estimates of layoff rates for public sector workers. These results show that although there has been some convergence of the unemployment rates of these two groups, the odds of being on layoff remain much lower in the public sector. Among public sector workers, layoff probabilities are consid- erably lower for union members, a marked contrast to the pattern of higher layoff rates under unionism in the private sector.
Sections 10.3 and 10.4 compare both the theoretical and institutional factors that influence employment adjustment decisions in the public and private sector and point out how the impact of unionism is likely to vary between the two sectors. The May 1973-75 and 1983 Current Population Surveys and the 1976-82 Panel Survey of Income Dynamics (PSID) are used in sections 10.5 and 10.6 to estimate public-private and union-nonunion differences in unemployment and layoff probabil- ities. The main results, summarized in section 10.7, are: ( I ) unions reduce by a substantial amount the already low layoff and unemploy- ment probabilities in the public sector in contrast to those in the private sector, where layoff rates are much higher under unionism, and (2) nonunion public sector workers have temporary layoff rates and overall unemployment probabilities comparable to those of nonunion private sector workers.
273 Unions and Job Security
10.2 Public Sector Layoff and Unemployment Rates
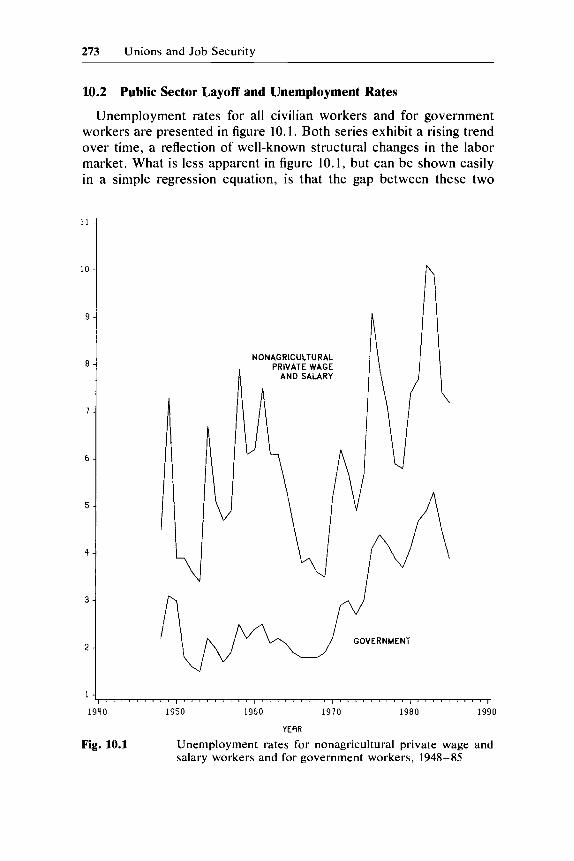
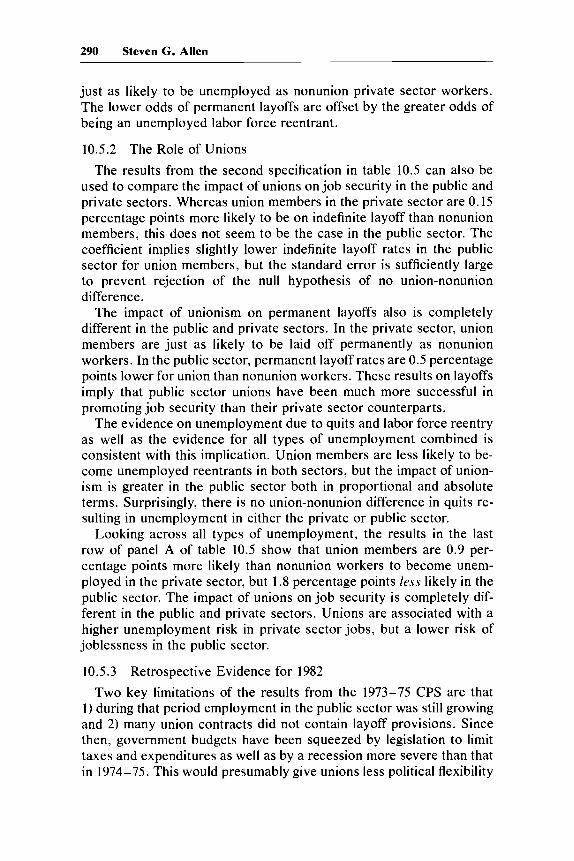
Unemployment rates for all civilian workers and for government workers are presented in figure 10.1. Both series exhibit a rising trend over time, a reflection of well-known structural changes in the labor market. What is less apparent in figure 10.1, but can be shown easily in a simple regression equation, is that the gap between these two
11
10
9
8
7
6
5
4
3
2
1
r
l " ~ ' " ' ~ ' 1 ~ ' " " " ' l ' ~ ~ ' ' / ~ ' ' I . , ' I , ' " ' I 1940 1950 1960 1910 1980 1990
YEAR
Fig. 10.1 Unemployment rates for nonagricultural private wage and salary workers and for government workers, 1948-85
274 Steven G. Allen
unemployment rates has narrowed throughout this period. Let UGOV = unemployment rate for government workers, UTOT = unemployment rate for nonagricultural private wage and salary workers, and T = time trend (1 for 1948, . . . , 38 for 1985). These variables were used to estimate the following equation:
UGOV = 1.373 + 0.086*UTOT - 0.027*T + 0.0117*T*UTOT (0.528) (0.095) (0.024) (0.0037) R2 = 0.854
This equation shows that for a given national unemployment rate, the unemployment rate for government workers was considerably higher in the later part of the sample period. For a civilian unemployment rate of 6 percent, this model predicts that the government unemploy- ment rate for 1948 would be 1.9 percent, but in 1985 it would be 3.5 percent. In other words, controlling for the overall state of the labor market, unemployment of government workers is almost twice as high today as in the late 1940s.
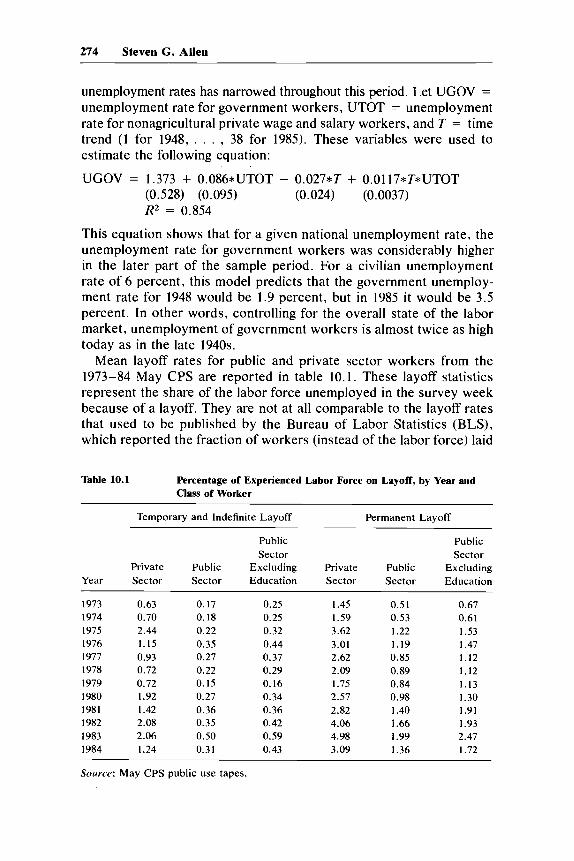
Mean layoff rates for public and private sector workers from the 1973-84 May CPS are reported in table 10.1. These layoff statistics represent the share of the labor force unemployed in the survey week because of a layoff. They are not at all comparable to the layoff rates that used to be published by the Bureau of Labor Statistics (BLS), which reported the fraction of workers (instead of the labor force) laid
Table 10.1 Percentage of Experienced Labor Force on Layoff, by Year and Class of Worker
Temporary and Indefinite Layoff Permanent Layoff
Public Public Sector Sector
Private Public Excluding Private Public Excluding Year Sector Sector Education Sector Sector Education
1973 0.63 1974 0.70 1975 2.44 1976 1.15 I977 0.93 1978 0.72 1979 0.72 1980 1.92 1981 1.42 1982 2.08 1983 2.06 1984 1.24
0. I7 0.18 0.22 0.35 0.27 0.22 0.15 0.27 0.36 0.35 0.50 0.31
0.25 0.25 0.32 0.44 0.37 0.29 0.16 0.34 0.36 0.42 0.59 0.43
I .45 1.59 3.62 3.01 2.62 2.09 I .75 2.57 2.82 4.06 4.98 3.09
0.51 0.53 1.22 1.19 0.85 0.89 0.84 0.98 1.40 1.66 I .99 1.36
0.67 0.61 1.53 1.47 1.12 1.12 1.13 1.30 1.91 I .93 2.47 1.72
Source: May CPS public use tapes.
275 Unions and Job Security
off in a particular month (rather than all previous months). The sample is restricted to the May surveys because of the availability of data on union status in that month and the computational burden of using all of the monthly tapes over a twelve-year interval. One problem with using the May survey for estimating public sector layoff rates is that educational employees are unlikely to be on layoff in that month. To adjust for this bias, separate estimates are reported for the public sector with schools, colleges, and universities excluded from the sample.
Temporary layoffs are those with recall within less than thirty days, whereas indefinite layoffs are those with recall within thirty days or more or those with no definite recall date. Because of the very small number of public sector workers experiencing either of these types of layoffs, the sum of these two layoff rates is reported in table 10.1. Both are distinguished from permanent layoffs by the expectation of recall. The permanent layoff rate is the fraction of the experienced labor force consisting of unemployed workers who said they started looking for work because they had lost their previous job.
Average temporary and indefinite layoff probabilities in May for 1973 through 1984 are about four times greater in the private than in the public sector. Between 0.6 and 2.4 percent of the experienced labor force in the private sector was on temporary or indefinite layoff during those years. The corresponding layoff probabilities for the public sector are not only much lower but their range is much narrower-between 0.2 and 0.5 percent for all public sector employees and between 0.2 and 0.6 percent for public sector employees excluding education. Al- though the time period under consideration is quite narrow, the patterns for 1975-76, 1980-81, and 1982-83 indicate that the peak in layoff rates for the public sector lags that for the private sector by one year. There is no evidence that the ratio of the public to the private temporary and indefinite layoff rate has changed between 1973 and 1984.
Permanent layoff rates also are much greater in the private sector, but the relative gap between public and private permanent layoff rates seems to have narrowed in recent years. Between 1973 and 1977, per- manent layoff rates were about three times larger in the private sector than in the public sector (two and a half times larger when education is excluded from the public sector). This gap has narrowed to about two and a half times larger between 1978 and 1984 (two times larger when education is excluded from the public sector). This narrowing is largely attributable to upward drift in the permanent layoff rate in the public sector. The layoff rate for all public sector employees was 0.5 percent in 1973 and 1974 but never fell below 0.8 percent in later years. The pattern is more pronounced when education is excluded; the layoff rate was 0.7 and 0.6 percent in 1973 and 1974 but never fell below 1 . 1 percent thereafter.
276 Steven G . Allen
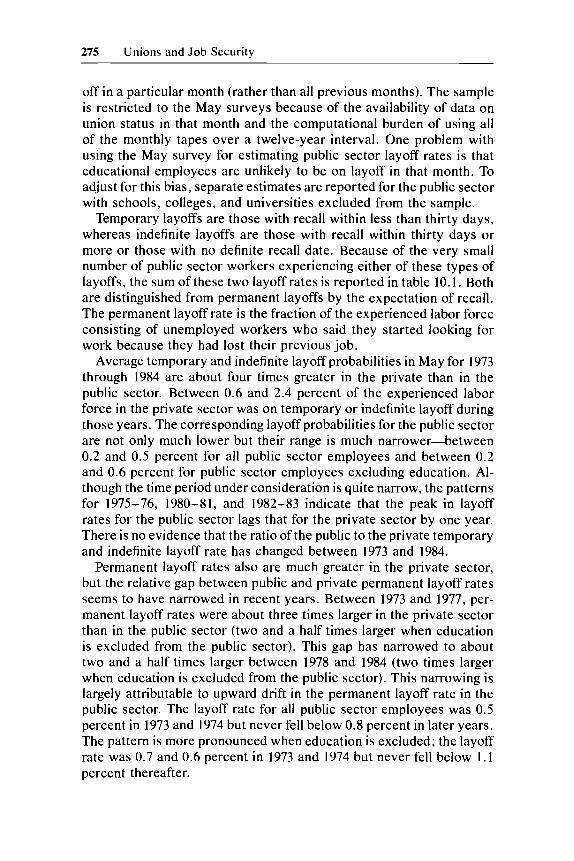
Even though the average public employee is subject to a very low layoff risk, this may be attributable to differences in the type of work between the public and the private sector. To determine whether any public sector workers are subject to layoff risks comparable to those for the average private sector worker, layoff rates for public and private sector employees are reported for selected industries in table 10.2. Because of small samples in individual years, the data are summarized in three-year groups.
These results show that the risk of temporary or indefinite layoff is greatest for public sector jobs in construction, utilities, and federal and state public administration. However, these layoff rates are almost always far below those for the average private sector worker in table
Table 10.2 Percentage of Experienced Labor Force on Layoff, by Time Period and Industry
Temporary and Indefinite Layoff Permanent Layoff
Industry 1973-75 1976-78 1979-81 1982-84 1973-75 1976-78 1979-81 1982-84
Construction Public 0.75 Private 3.15
bus lines Public 0.22 Private 0.00
sanitary services Public 0.00 Private 0.20
Public 0.20 Private 0.12
secondary schools Public 0.03 Private 0.16
Public 0.18 Private 0.26
Postal service 0.13 Federal public
administration 0.26 State public
administration 0.46 Local public
administration 0.08
Street railways,
Utilities and
Hospitals
Elementary and
Colleges
0.22 2.84
0.00 0.53
0.72 0.24
0.20 0.12
0.12 0.08
0.12 0.26 0.24
0.38
0.96
0.34
0.50 3.70
0.20 0.29
0.24 0.09
0.14 0.16
0.24 0. I9
0.14 0.00 0.08
0.40
0.44
0.19
0.17 4.63
1.30 0.88
0.90 0.60
0.27 0.50
0.23 0.14
0.22 0.37 0.04
0.29
0.46
0.45
1.09 5.97
0.45 0.61
0.90 0.57
1.11 0.62
0.26 0.30
1.05 0.60 0.34
0.71
0.56
1.10
2.19 5.95
0.55 1.43
1.14 0.60
0.67 0.82
0.59 1.29
0.47 1.12 0.32
1.21
0.97
1.23
2.38 5.48
0.55 2.35
1.64 0.89
0.47 0.72
0.56 1.31
0.53 I .06 0.08
0.95
1.38
2.00
3.61 9.12
1.17 3.70
2.61 1.55
1.62 0.99
0.92 1 S O
1.60 I .35 0.43
1.42
I .33
2.16
Source: May CPS public use tapes.
277 Unions and Job Security
10. I . The only exceptions to this general trend are employees in state public administration in 1976-78 and in urban transit in 1982-84. The odds of temporary or indefinite layoffs are practically zero in education and the postal service. Permanent layoffs in the public sector are most likely to occur in construction, utilities, and local public administration. Except for construction, these layoff rates are also well below those in the private sector in table 10.1.
The public-private comparisons within particular industry groups for temporary and indefinite layoffs in table 10.2 show that layoff rates are roughly equal in the public and private sectors in transportation, util- ities, hospitals, and education, but that private sector layoff rates are much higher in construction. The patterns for permanent layoffs are quite different. Although the private sector has higher permanent layoff rates in construction, transportation, and elementary and secondary schools, the public sector has higher permanent layoff rates in utilities and hospitals. These patterns suggest that careful controls for industry characteristics will be needed to estimate accurately the difference in layoff and unemployment probabilities between the public and private sectors.
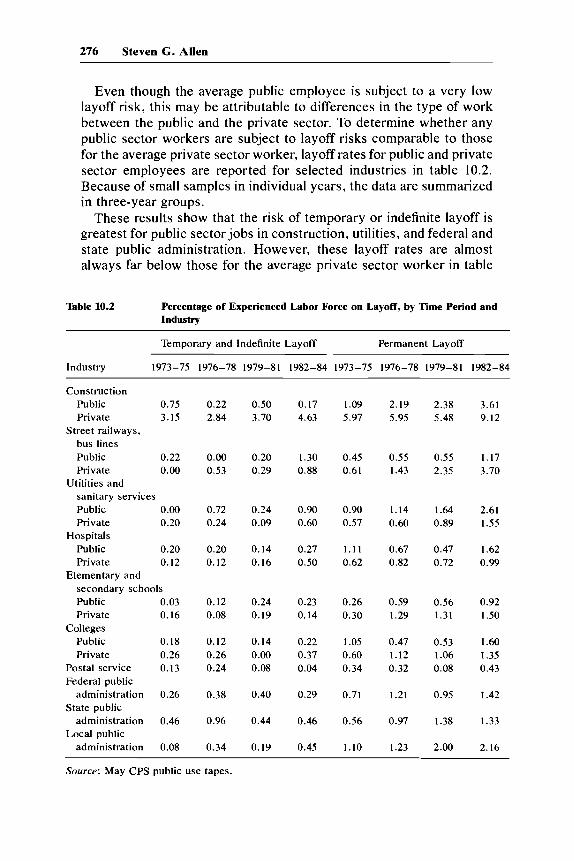
Comparisons of mean layoff rates for union and nonunion workers in the public and private sectors are reported in table 10.3. These can be computed only for 1973-1975 and 1977 because in all other years unemployed workers were not asked about union membership. Within the public sector, temporary and indefinite layoff probabilities are slightly lower (0.1 percentage points) for union workers. The average gap in permanent layoff rates is also rather small in three out of the four years. However, the exception to this overall tendency is a very important one. In 1975, at the trough of a severe recession, the permanent layoff rate for nonunion public employees was twice as large (1.4 percent) as that for union workers (0.7 percent). This suggests that when the pres-
Table 10.3 Percentage of Experienced Labor Force on Layoff, by Year, Class of Worker, and Union Status
Temporary and Indefinite Layoff Permanent Layoff
Private Sector Public Sector Private Sector Public Sector
Year Union Nonunion Union Nonunion Union Nonunion Union Nonunion
1973 1.22 0.45 0.24 0.16 1.74 1.36 0.37 0.55 1974 1.54 0.44 0.08 0.22 1.88 1.50 0.71 0.47 1975 5.56 1.58 0.04 0.28 4.26 3.45 0.72 1.38 1977 1.80 0.69 0.20 0.30 2.98 2.52 0.67 0.93
Source: May CPS public use tapes.
278 Steven G . AUen
sure for layoffs is greatest, union workers in the public sector have a much better chance of keeping their jobs than nonunion public em- ployees. The exact opposite pattern is observed in the private sector, where union members have considerably higher layoff rates than non- union workers.
10.3 Unions and Public Sector Layoffs: Theory
Demand shocks are likely to differ between the public and private sectors because of differences in technology and consumer character- istics. For instance, labor demand in agriculture and construction fluc- tuates a great deal over the course of a year because of the dictates of seasons and weather, whereas except for elementary and secondary education, public sector labor demand consists of services provided throughout the year. Demand for public services is also relatively in- sensitive to conditions in credit markets, in contrast to some goods produced in the private sector, such as construction and durable man- ufactures. These arguments indicate that there will be less seasonal and cyclical variability in demand for public services than for private goods, which will result in lower layoff rates in the public sector, other things equal.
Even if public and private employers had to deal with the same labor demand shocks, there are still a number of reasons to expect them to have different layoff rates. Two obvious factors are purely technolog- ical-public services cannot be produced for inventory in periods of slack demand, and they are very labor intensive. As a result, cuts in government budgets almost always require some cuts in payroll.
These cuts must be obtained by some combination of reduced wages, reduced hours, or reduced employment. Most government jobs are at the state and local levels, where wage studies such as Smith (1977) and Freeman (1985) tend to find rates equal to those in the private sector. In such a situation, wage cuts would produce savings in the short run but would eventually result in higher turnover and excessive recruiting, hiring, and training costs. Wage cuts in federal jobs would be less likely to create these problems, as all studies have found those rates to be well above those paid in comparable private sector jobs. The trade-off between hours and employment cuts will be heavily influenced by the attractive fringe benefit packages offered by most public sector em- ployers and the relatively small amount of specific on-the-job training in many government jobs, especially in education. Both of these factors will make it more economical to use layoffs instead of hours reductions in many public sector jobs.
This assumes, however, that all downward shifts in demand are ac- tually translated into budget cuts. Throughout the 1970s state and local
279 Unions and Job Security
governments were highly successful in obtaining federal aid under var- ious guises (revenue sharing, CETA) to maintain programs that would have been terminated otherwise. On various occasions local govern- ments also have received fiscal infusions from state governments. This avenue of revenue enhancement is not available to the federal govern- ment, but it does not have to meet the balanced budget constraint that most state and local governments face. All of these examples illustrate how governments can find substitutes for tax revenue (some of which are automatically tied to local unemployment rates and thus indirectly tied to the revenue of state and local governments) to maintain their budgets and thereby avoid layoffs.
Freeman (1985) has shown that public sector employment has less year-to-year variability than private sector employment. His study, along with the results on mean layoff rates in table 10.1, also suggests that the cyclical pattern in public sector employment lags that observed for private sector employment.
These patterns probably result from differences in sources of revenue between the public and private sectors. Much of the revenue of state and local governments comes from sources well insulated from cyclical behavior, such as property taxes and intergovernmental grants. (Fluc- tuations in revenue would arise mainly from income and sales taxes, which would vary with output and sales in a particular state, county, or city.) This dampens the impact of any shock.
Lags in making adjustments to any given shock result from the po- litical process. If these lags are long enough, managers in the public sector have more time to plan their manpower responses to declines in demand. This allows them to make greater use of hiring freezes, which allow them to reduce their adjustment costs by I ) avoiding hiring persons who will later have to be laid off and 2) using attrition to reduce the number of employees, thereby avoiding the costs of layoffs (sev- erance pay, unemployment benefits, reputation). An adequate planning horizon is absolutely essential for hiring freezes to be a very useful adjustment device. The incentive to use hiring freezes and attrition in the public sector in place of layoffs will be offset to some extent by low rates of voluntary turnover, which result in smaller reductions in employment levels through attrition than in the private sector.
It would be inappropriate to discuss public-private differences in layoff probabilities and completely ignore unemployment insurance (UI). Today almost all private and government employees are covered by UI, so differences in coverage are not likely to create differences in employee preferences for layoffs relative to other adjustment de- vices. The low unemployment rates in the public sector make it quite unlikely that any group of public sector workers will collectively receive more in benefits than they spend on payroll taxes. In fact, many gov-
280 Steven G . Allen
ernments finance UI benefits for their workers through direct reim- bursement rather than using payroll tax contributions. Thus, UI will encourage layoffs to a lesser degree in the public than the private sector.
The above discussion indicates that the factors likely to influence layoff decisions in the public sector are quite distinct from those in the private sector. In the absence of collective bargaining, no unambiguous predictions can be made about how layoff and unemployment rates are likely to vary between the public and private sectors.
Under collective bargaining, median voter models predict that, in both the public and private sectors, greater weight will be given to the preferences of older, less mobile workers in the determination of per- sonnel policies. Except in cases of drastic declines in demand, these workers will prefer a policy of layoffs based on seniority. Such a policy completely insulates them from any cutbacks in wages or hours that might otherwise be required.
Another factor behind the preference of unions in the private sector for seniority-based layoffs is the union-nonunion differential in UI sub- sidies. This is not likely to be important in the public sector because, as noted above, the financing mechanisms and low layoff rates result in effective self-insurance. Furthermore, supplemental unemployment benefits are rarely provided in union contracts in the public sector. These two factors suggest that the union-nonunion gap in layoff rates should at least be smaller in the public than the private sector.
In addition, there are unique aspects of unionism in the public sector that could result in lower layoff rates for union workers in that sector. Freeman (1986) argues that public sector unions have the ability to shift the demand curve for their services through political activity. Public sector union members represent a significant part of the electorate in many state and local elections. This allows them to use both political power and bargaining power to push for higher wages and membership. In addition, the utility function of public sector unions will put a higher weight on membership because additional members give them even more political leverage. Whether public sector unions are actually suc- cessful in obtaining higher wages and employment is an empirical ques- tion, however, because they can also serve as a lightning rod for attracting political opposition to the higher taxes required to fund higher payrolls.
This political dimension of union behavior in the public sector is likely to influence layoffs through two different channels. First, the observed lag of employment in the public sector suggests that unions as well as managers have the opportunity to plan strategies for avoiding layoffs. This can be done in a variety of different ways, such as mod- eration in wage negotiations or political pressure within the appropriate government body to keep its payrolls intact. Second, public sector unions at the local and state levels can also push for additional revenue
281 Unions and Job Security
from higher levels of government as a substitute for any drop in local or state tax revenues. For instance, in Congress public sector unions have been strong supporters of CETA which, under Titles I , 11, and VI, granted sizeable sums for public employment programs. These programs prevented a number of cities from having to lay off municipal employees.
On balance, the effect of unions on layoffs in the public sector cannot be predicted ex ante. Although the most senior workers would prefer a system of layoffs based on seniority if payroll cuts are required, the potential political power of unions may enable them to prevent such cuts from taking place or make them considerably smaller than they would have been in the absence of collective bargaining.
10.4 Unions and Public Sector Layoffs: Institutions
Rules and procedures governing layoffs in the nonunion segment of the public sector, if they exist at all, are determined by legislation or regulation. There has been only one study to my knowledge of layoff policies in the public sector. A survey of state governments by the Bureau of National Affairs (1982a) found that twenty states based lay- offs primarily or solely on seniority, twenty-four have policies that take both seniority and performance into account, and six states have no laws or policies on layoffs. Even in states in which layoffs are based on both seniority and performance, managers sometimes do not have much discretion in deciding who is to be laid off. For instance, in Utah layoffs are based on the sum of the employee’s rankings with respect to previous performance evaluations and seniority. In many cases vet- erans are given special preference in layoff or recall procedures.
During the 1981-82 recession, a number of states revised their layoff procedures to ensure that recent gains in hiring women and minorities were not eradicated by “last hired, first fired” policies. The Bureau of National Affairs (1982b) identified five states in which state agencies were required to maintain a percentage of women and minorities after a layoff equal to that in the agency prior to the layoff. In many other cases, managers were instructed to take affirmative action into con- sideration along with other criteria in deciding which persons were to be laid off and which were to be recalled.
Under collective bargaining in the private sector, procedures for layoffs are almost always specified in the union contract. Freeman and Medoff (1984) report that seniority is the most important factor in determining who gets laid off in about 80 percent of all contracts. Five different studies by BLS of contract provisions between 1970 and 1975 indicate that these practices were not as widespread in the public sector. The percentage of employees covered by agreements containing var-
282 Steven G . Allen
ious layoff-related provisions in these studies is reported in table 10.4. Most of the municipal agreements in cities with populations of 250,000 and over in 1970 contained no provisions regarding layoffs. This can be attributed to a combination of three factors: 1) the recentness of most collective bargaining relationships in that period, 2) layoff pro- cedures already specified by ordinances or civil service regulations that in many cases were presumably based at least in part on seniority, and 3) the rapid growth in municipal employment that had taken place in preceding years. Given these three factors, most unions at that time apparently placed little priority on bargaining over layoff and recall provisions. Collaborating evidence for the BLS studies is found in Eberts’s (forthcoming) study of over 500 New York school districts in the mid- 1970s-only 20 percent of public school teachers were covered by reduction-in-force (RIF) provisions.
Even five years later, the share of union contracts containing layoff and recall provisions in the public sector, although much higher than before, was still much smaller than that in the private sector. Only 65 percent of the contracts during this period contained language pertain- ing to layoffs and only 35 percent specified recall rights. Both figures are considerably higher than their counterparts in 1970, which no doubt reflects the decline in the fiscal health of many cities over this period as well as increased experience with how layoffs are conducted under civil service rules. Perry’s (1979) case study of nine school systems also points out a trend toward a greater percentage of teachers’ union contracts containing layoff provisions. He found that in 1967 contrac- tual provisions regarding layoffs were “virtually nonexistent.” Ten years later, the contracts in eight of the nine school districts contained language regarding layoffs.
Even if union contracts in the public sector are still less likely to address layoff issues than contracts in the private sector, it seems safe to conclude that much greater weight is given to seniority in determining layoffs in governments with collective bargaining agreements than in those without collective bargaining. There is also evidence that contract provisions do affect layoff decisions in the public sector. Eberts shows that RIF provisions are correlated with much lower separation rates for teachers in school districts with declining enrollment, especially for teachers with more than nine years of experience.
Layoff provisions are far from the only mechanism that public sector unions have to influence government behavior. Levine, Rubin, and Wolohojian (1981) discuss a case in Oakland where the fire fighters union used binding arbitration to reverse a city council decision to eliminate twenty-six positions in 1975. In other cases unions have ex- erted political pressure to prevent cutbacks. For instance, in 1976 the police and fire fighters unions in Cincinnati petitioned for a referendum
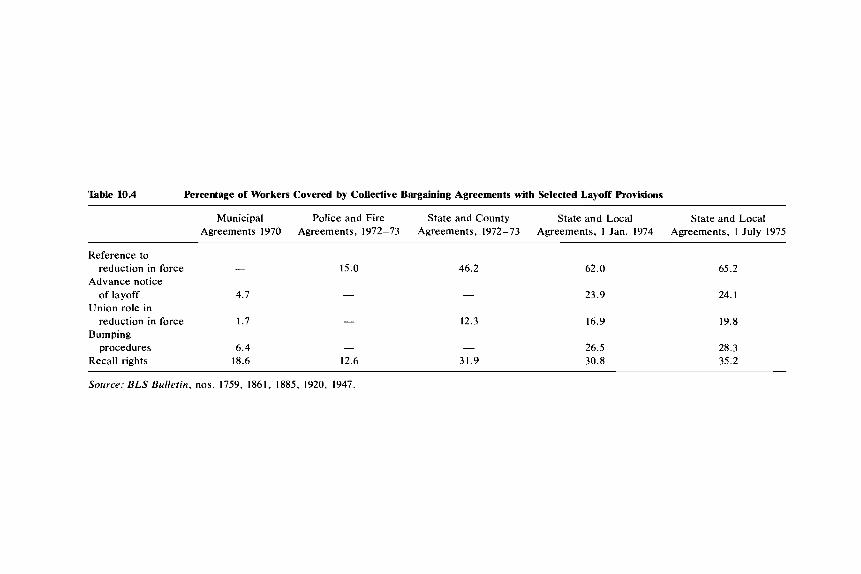
Table 10.4 Percentage of Workers Covered by Collective Bargaining Agreements with Selected Layoff Provisions
Municipal Police and Fire State and County State and Local State and Local Agreements 1970 Agreements, 1972-73 Agreements, 1972-73 Agreements, 1 Jan. 1974 Agreements, 1 July 1975
Reference to
Advance notice
Union role in reduction in force 1.7
Bumping procedures 6.4
Recall rights 18.6
reduction in force -
of layoff 4.7
15.0
-
- 12.6
46.2
-
12.3
- 31.9
62.0
23.9
16.9
26.5 30.8
65.2
24. I
19.8
28.3 35.2
Source: BLS Bulletin, nos. 1759, 1861, 1885, 1920, 1947.
284 Steven G . Allen
to freeze staffing at current levels (the petition did not pass). To protest the proposed transfer of a state-managed hospital in Pennsylvania, Wilburn and Worman (1980) report that five unions successfully joined forces to exert pressure, including radio, newspaper, and television advertisements telling residents in the area where the hospital was located that it was vital to their welfare.
A final factor that may be important in some of the period under study here is the endogeneity of UI coverage for many state and local employees before December 1974. Before 1972, when state employees in hospitals and higher education were brought into the system, rela- tively few state and local public sector employees were covered by UI. Some states had voluntarily decided to cover their own employees, and a few even had laws requiring all local employees to participate. Title I1 of the Emergency Jobs and Unemployment Assistance Act of 1974 (PL 93-567) brought almost all state and local workers into the system. Although this program was supposedly a temporary measure prompted by the 1974-75 recession, the Unemployment Compensation Amendments of 1976 ( U S . Congress 1976) made these changes per- manent. Before these federal statutes were enacted, the political power of public sector unions could increase the odds of UI coverage in areas that were heavily unionized, which would result in somewhat higher layoff rates. However, Allen (1987) found little evidence supporting this conjecture; there is only a weak correlation between unionization and UI coverage and no correlation between UI coverage and unem- ployment and layoff probabilities in the CPS.
10.5 Evidence from the Current Population Survey
To identify the separate effects of unionism and public sector status on layoff probabilities, two specifications were estimated over the May 1973-75 CPS. The first includes separate dummies for union and public sector status; the second adds a union-public sector interaction term. The extremely large sample size precludes estimation of probit equa- tions over all observations. Probit results for one-fourth of the sample, randomly selected, appear in table 10.5. Temporary layoff equations were not estimated for this sample because none of the public sector workers in the smaller sample were on temporary layoff.
10.5.1 Public-Private Comparisons How do layoff rates for public and private sector workers compare?
Once controls for union status and other job and personal character- istics are included, are the layoff probabilities for public sector workers still very small relative to those of private sector employees? The answers from the first specification largely reaffirm the results from
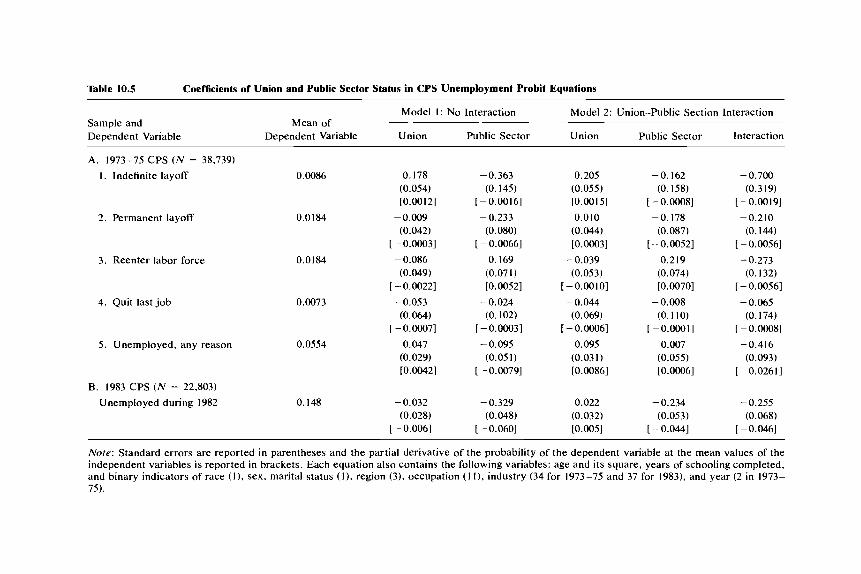
Table 10.5 Coemcients of Union and Public Sector Status in CPS Unemployment Probit Equations
Model 1: No Interaction Model 2: Union-Public Section Interaction Sample and Mean of Dependent Variable Dependent Variable Union Public Sector Union Public Sector Interaction
A. 1973-75 CPS ( N = 38,739) I . Indefinite layoff 0.0086 0.178 -0.363 0.205 - 0.162 - 0.700
(0.054) (0.145) (0.055) (0.158) (0.319) [0.0012] [ -0.00161 [0.0015] [ -0.OOOSl [ -0.00191
2. Permanent layoff 0.0184 - 0.009 - 0.233 0.010 -0.178 -0.210
3. Reenter labor force 0.0184 -0.086 (0.049)
[ -0.00221
(0.064) [ -0.00071
5 . Unemployed, any reason 0.0554 0.047
4. Quit last job 0.0073 -0.053
(0.029) [0.0042]
B. 1983 CPS ( N = 22,803) Unemployed during 1982 0.148 -0.032
(0.028)
(0.042) (0.080) [-0.00031 [ - 0.00661
0.169 (0.07 I ) [0.0052] - 0.024 (0.102) - 0.00031 -0.095 (0.051)
-0.00791
- 0.329 (0.048)
(0.044) [O ,0003 I
-0.039 (0.053)
[ -0.0010] -0.044 (0.069)
[ -0.00061 0.095
(0.031) [0.0086]
0.022 (0.032)
(0.087)
0.219 (0.074) [0.00701 - 0.008 (0.110)
[ -0.0001] 0.007
(0.055) [0 ,00061
[ - 0.00521
-0.234 (0.053)
(0.144) - 0.00561 - 0.273 (0.132) - 0.00561 - 0.065 (0.174) - 0.OOoSl -0.416 (0.093) - 0.02611
- 0.255 (0.068)
[ -0.0061 [ -0.0601 [0.005] [ -0.0441 [ - 0.0461
Nore: Standard errors are reported in parentheses and the partial derivative of the probability of the dependent variable at the mean values of the independent variables is reported in brackets. Each equation also contains the following variables: age and its square, years of schooling completed, and binary indicators of race ( I ) , sex, marital status ( I ) , region (3), occupation ( I I ) , industry (34 for 1973-75 and 37 for 1983), and year (2 in 1973- 75).
286 Steven G. Allen
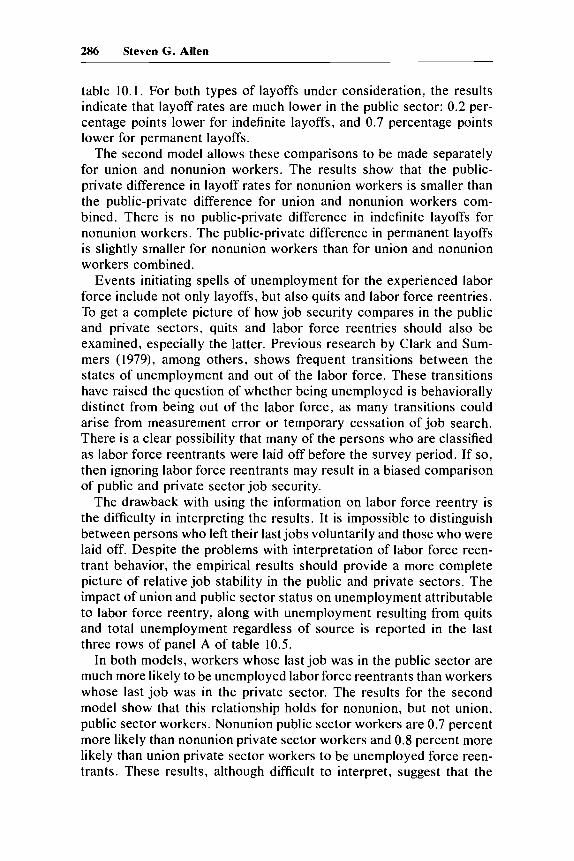
table 10.1. For both types of layoffs under consideration, the results indicate that layoff rates are much lower in the public sector: 0.2 per- centage points lower for indefinite layoffs, and 0.7 percentage points lower for permanent layoffs.
The second model allows these comparisons to be made separately for union and nonunion workers. The results show that the public- private difference in layoff rates for nonunion workers is smaller than the public-private difference for union and nonunion workers com- bined. There is no public-private difference in indefinite layoffs for nonunion workers. The public-private difference in permanent layoffs is slightly smaller for nonunion workers than for union and nonunion workers combined.
Events initiating spells of unemployment for the experienced labor force include not only layoffs, but also quits and labor force reentries. To get a complete picture of how job security compares in the public and private sectors, quits and labor force reentries should also be examined, especially the latter. Previous research by Clark and Sum- mers (1979), among others, shows frequent transitions between the states of unemployment and out of the labor force. These transitions have raised the question of whether being unemployed is behaviorally distinct from being out of the labor force, as many transitions could arise from measurement error or temporary cessation of job search. There is a clear possibility that many of the persons who are classified as labor force reentrants were laid off before the survey period. If so, then ignoring labor force reentrants may result in a biased comparison of public and private sector job security.
The drawback with using the information on labor force reentry is the difficulty in interpreting the results. It is impossible to distinguish between persons who left their last jobs voluntarily and those who were laid off. Despite the problems with interpretation of labor force reen- trant behavior, the empirical results should provide a more complete picture of relative job stability in the public and private sectors. The impact of union and public sector status on unemployment attributable to labor force reentry, along with unemployment resulting from quits and total unemployment regardless of source is reported in the last three rows of panel A of table 10.5.
In both models, workers whose last job was in the public sector are much more likely to be unemployed labor force reentrants than workers whose last job was in the private sector. The results for the second model show that this relationship holds for nonunion, but not union, public sector workers. Nonunion public sector workers are 0.7 percent more likely than nonunion private sector workers and 0.8 percent more likely than union private sector workers to be unemployed force reen- trants. These results, although difficult to interpret, suggest that the
287 Unions and Job Security
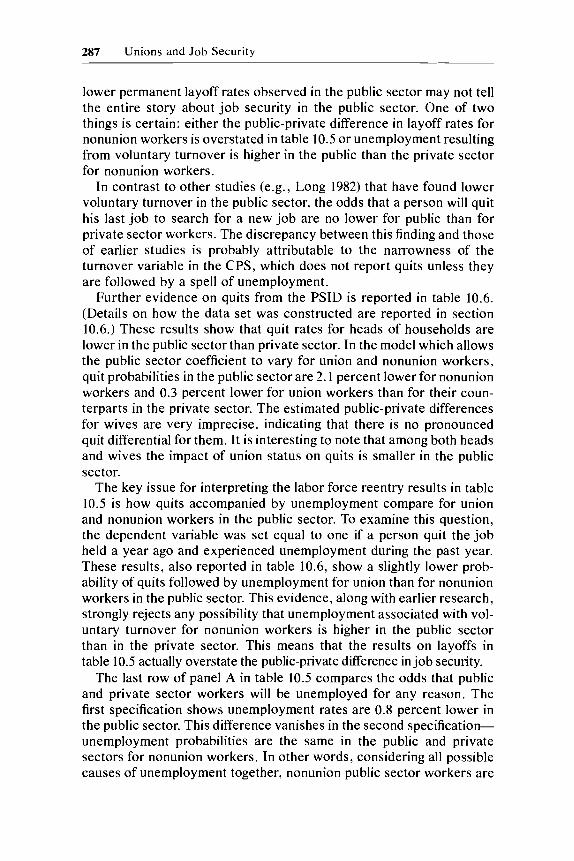
lower permanent layoff rates observed in the public sector may not tell the entire story about job security in the public sector. One of two things is certain: either the public-private difference in layoff rates for nonunion workers is overstated in table 10.5 or unemployment resulting from voluntary turnover is higher in the public than the private sector for nonunion workers.
In contrast to other studies (e.g., Long 1982) that have found lower voluntary turnover in the public sector, the odds that a person will quit his last job to search for a new job are no lower for public than for private sector workers. The discrepancy between this finding and those of earlier studies is probably attributable to the narrowness of the turnover variable in the CPS, which does not report quits unless they are followed by a spell of unemployment.
Further evidence on quits from the PSID is reported in table 10.6. (Details on how the data set was constructed are reported in section 10.6.) These results show that quit rates for heads of households are lower in the public sector than private sector. In the model which allows the public sector coefficient to vary for union and nonunion workers, quit probabilities in the public sector are 2.1 percent lower for nonunion workers and 0.3 percent lower for union workers than for their coun- terparts in the private sector. The estimated public-private differences for wives are very imprecise, indicating that there is no pronounced quit differential for them. It is interesting to note that among both heads and wives the impact of union status on quits is smaller in the public sector.
The key issue for interpreting the labor force reentry results in table 10.5 is how quits accompanied by unemployment compare for union and nonunion workers in the public sector. To examine this question, the dependent variable was set equal to one if a person quit the job held a year ago and experienced unemployment during the past year. These results, also reported in table 10.6, show a slightly lower prob- ability of quits followed by unemployment for union than for nonunion workers in the public sector. This evidence, along with earlier research, strongly rejects any possibility that unemployment associated with vol- untary turnover for nonunion workers is higher in the public sector than in the private sector. This means that the results on layoffs in table 10.5 actually overstate the public-private difference in job security.
The last row of panel A in table 10.5 compares the odds that public and private sector workers will be unemployed for any reason. The first specification shows unemployment rates are 0.8 percent lower in the public sector. This difference vanishes in the second specification- unemployment probabilities are the same in the public and private sectors for nonunion workers. In other words, considering all possible causes of unemployment together, nonunion public sector workers are
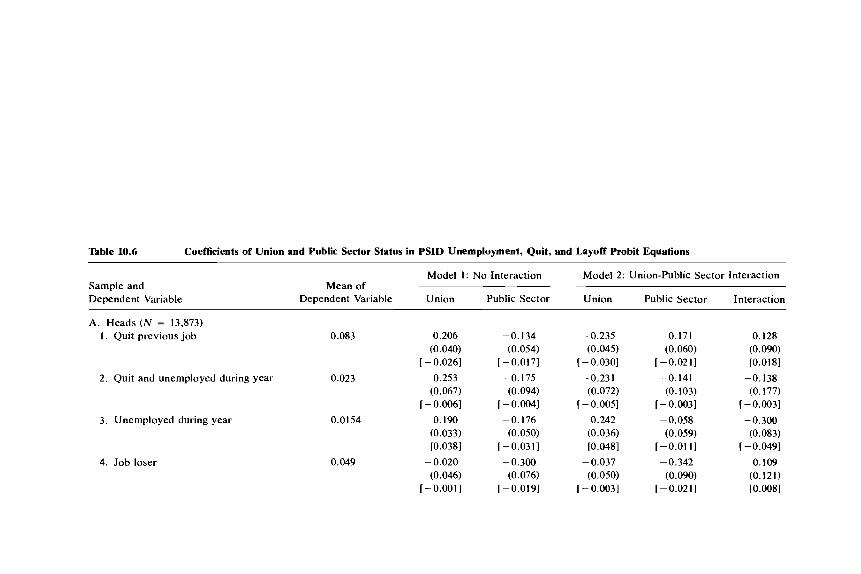
Table 10.6 Coefficients of Union and Public Sector Status in PSID Unemployment, Quit, and Layoff Probit Equations
Sample and Dependent Variable
Model 1: No Interaction Model 2: Union-Public Sector Interaction Mean of
Dependent Variable Union Public Sector Union Public Sector Interaction
A. Heads ( N = 13,873) I . Quit previous job 0.083 -0.206
(0.040) [ - 0.0261
2. Quit and unemployed during year 0.023 -0.253 (0.067)
[ - 0.0061 3. Unemployed during year 0.0154 0.190
(0.033) [0.038]
4. Job loser 0.049 - 0.020 (0.046)
-0.134 (0.054)
[ -0.0171 -0.175 (0.094)
[ - 0.0041 -0.176 (0.050)
[ -0.0311 - 0.300 (0.076)
-0.235 (0.045) - 0.0301 - 0.23 1 (0.072)
0.242 (0.036) [0.048]
(0.050) [-O.oOl] [ - 0.0191 [ - 0.0031
- 0.0051
-0.037
-0.171 (0.060)
[ -0.0211 -0.141 (0.103)
[ - 0.0031 - 0.058 (0.059)
[-O.Oll] - 0.342 (0.090)
[ -0.0211
0.128 (0.090) [0.0181
-0.138 (0.177)
[ - 0.0031 - 0.300 (0.083)
[ - 0.0491 0. I09
(0.121) [0.008]
B. Wives ( N = 3,796) I . Quit previous job 0.127 -0.295
(0.087) [ - 0.0481
2. Quit and unemployed during year 0.022 -0.214 (0.161)
3. Unemployed during year 0. I40 0.149 (0.074) [0.0311
(0.114)
[ - 0.0071
4. Job loser 0.046 - 0.096
- 0.030 (0.082)
[ - 0.0061 -0.203 (0.158)
0.034 (0.083) [0.007]
(0.127)
[ - 0.0071
-0.163
- 0.375 (0.113)
[ - 0.0591 - 0.235 (0.188)
0.294 (0.086) [0.064]
- 0.035 (0.124)
I - 0.0081
- 0.065 (0.088) - 0.0121 -0.215 (0.169)
0. I48 (0.089) [0.030]
(0.135)
- 0.0071
-0.103
[ - 0.0071 [ -0.01 I] [ -0.0021 [ - 0.0071
0.200 (0.173) [0.041] 0.076
(0.352) [0.003]
(0.162) -0.508
[ -0.0761 -0.334 (0.299)
[ - 0.0191
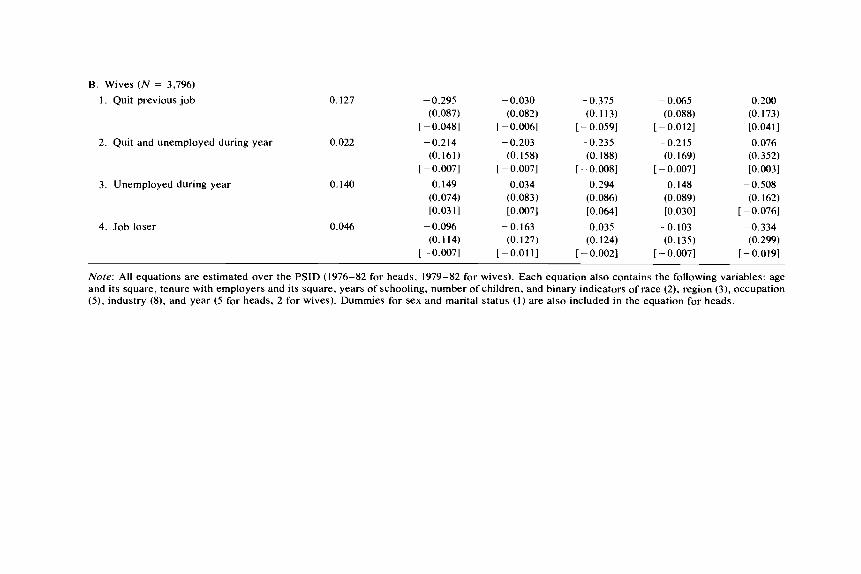
Note: All equations are estimated over the PSID (1976-82 for heads, 1979-82 for wives). Each equation also contains the following variables: age and its square, tenure with employers and its square, years of schooling, number of children, and binary indicators of race (2), region (3), occupation (51, industry (8), and year (5 for heads, 2 for wives). Dummies for sex and marital status ( I ) are also included in the equation for heads.
290 Steven G. Allen
just as likely to be unemployed as nonunion private sector workers. The lower odds of permanent layoffs are offset by the greater odds of being an unemployed labor force reentrant.
10.5.2 The Role of Unions The results from the second specification in table 10.5 can also be
used to compare the impact of unions on job security in the public and private sectors. Whereas union members in the private sector are 0.15 percentage points more likely to be on indefinite layoff than nonunion members, this does not seem to be the case in the public sector. The coefficient implies slightly lower indefinite layoff rates in the public sector for union members, but the standard error is sufficiently large to prevent rejection of the null hypothesis of no union-nonunion difference.
The impact of unionism on permanent layoffs also is completely different in the public and private sectors. In the private sector, union members are just as likely to be laid off permanently as nonunion workers. In the public sector, permanent layoff rates are 0.5 percentage points lower for union than nonunion workers. These results on layoffs imply that public sector unions have been much more successful in promoting job security than their private sector counterparts.
The evidence on unemployment due to quits and labor force reentry as well as the evidence for all types of unemployment combined is consistent with this implication. Union members are less likely to be- come unemployed reentrants in both sectors, but the impact of union- ism is greater in the public sector both in proportional and absolute terms. Surprisingly, there is no union-nonunion difference in quits re- sulting in unemployment in either the private or public sector.
Looking across all types of unemployment, the results in the last row of panel A of table 10.5 show that union members are 0.9 per- centage points more likely than nonunion workers to become unem- ployed in the private sector, but 1.8 percentage points less likely in the public sector. The impact of unions on job security is completely dif- ferent in the public and private sectors. Unions are associated with a higher unemployment risk in private sector jobs, but a lower risk of joblessness in the public sector.
10.5.3 Retrospective Evidence for 1982 Two key limitations of the results from the 1973-75 CPS are that
1 ) during that period employment in the public sector was still growing and 2 ) many union contracts did not contain layoff provisions. Since then, government budgets have been squeezed by legislation to limit taxes and expenditures as well as by a recession more severe than that in 1974-75. This would presumably give unions less political flexibility
291 Unions and Job Security
to maintain public sector payrolls, while at the same time make union members more sensitive to job security issues and in all likelihood increase the share of union contracts containing rules on layoffs. As a result, one would have good reason to question whether the results for 1973-75 are still pertinent today.
These results cannot be replicated for more recent years, because after 1977 the CPS stopped asking unemployed workers about union status at their previous job. One alternative approach is to use the May 1983 CPS, which reports union status for half the sample (instead of a quarter of the sample as in all other surveys since 1981) and matches these records with the March 1983 CPS, which contains retrospective data on unemployment during 1982. At the cost of restricting the sample to employed workers, union-nonunion differences in unemployment during 1982 can be estimated for both the public and private sectors.
Unemployed persons in the May 1983 sample consist of those who either were recalled to their old jobs or were successful in finding new jobs. Those who were still jobless at the time of the survey are omitted from the sample. This should be kept in mind when interpreting the results; they are not directly comparable to those reported from the 1973-75 CPS. The dependent variable is a dummy equal to one if the respondent was unemployed during 1982. The distinctions between union and nonunion as well as private and public workers are based on the job held at the time of the survey. (The models were also esti- mated over a data set in which these distinctions were based on the longest job held in 1982. The results were basically the same and are not reported here.)
With regard to union-nonunion differences, the probit results in panel B of table 10.5 are comparable to those in panel A. The key result of a negative union impact on unemployment probability in the public sector from the 1973-75 CPS continues to hold for the 1982 CPS. Public employees belonging to unions were 4.1 percentage points less likely to have been unemployed in 1982 than nonunion public employees. Union workers are 0.5 percentage points more likely to have been unemployed than nonunion workers in the private sector, but the dif- ference is not statistically significant.
The only finding from the 1973-75 CPS that does not carry over to the more recent sample is that pertaining to public-private differences in unemployment probabilities for nonunion workers. Nonunion public employees were 4.4 percentage points less likely to have been unem- ployed in 1982 than nonunion private employees. This result is most likely attributable to either the restricted sample in the May 1983 CPS or the lagged response of public sector layoffs to downturns in eco- nomic activity documented in table 10.1; it need not be inconsistent with the findings in table 10.5.
292 Steven G . Allen
10.6 Evidence from the Panel Survey of Income Dynamics
The PSID has reported both union status and class of worker on a continuous basis since 1976. The main advantages of exploring this data set are that it spans the period between the two CPS samples and that it can be used to estimate fixed-effects models. A possible dis- advantage is that the PSID sample consists of households that have been continuously tracked for fourteen years, and such households are likely to be less than perfectly representative of the labor force.
Two different indicators of job security are examined: 1) whether the respondent is currently unemployed or was unemployed in the past year, and 2) whether the respondent lost his previous job because he was laid off or fired or because his company closed (job losses for any of these reasons will be referred to as layoffs below). Survey responses to these questions in year t + 1 are regressed on indepen- dent variables for year t . As in the CPS, the sample is restricted to wage and salary workers. When using the PSID, the question always arises as to whether observations from the 1967 Survey of Economic Opportunity (SEO) subsample should be included. In this case the coefficients are relatively insensitive to composition of the sample, so observations from the SEO subsample are included in the results reported below. Split-off households formed during the sample period and persons who were self-employed during any of the sample years are deleted to facilitate data-set management. Separate models are estimated for heads of households (assumed by the PSID to be the male in two-earner households) and wives.
The PSID results for heads in table 10.6 show that, just as in the CPS, the odds of being unemployed are about the same for public and private sector workers not covered by collective bargaining. In the model without any interaction between union and public sector status, union employees have a 3.8 percentage point higher probability of being unemployed; public sector employees, a 3.1 percentage point lower probability. However, this model restricts the impact of unionism to be the same in both the public and private sectors. When this restriction is removed by adding a union-public sector interaction term, there is no longer any significant difference between the odds of being unem- ployed in public and private sector jobs for nonunion workers. Union workers in the private sector are 4.8 percentage points more likely to have been unemployed than nonunion workers, but there is no differ- ence in unemployment probabilities in the public sector between union and nonunion workers.
Wives who are union members working in the private sector are 6.4 percentage points more likely to experience unemployment than non- union workers in that sector. In the public sector, union members are
293 Unions and Job Security
1.2 percentage points less likely to have been unemployed than non- union workers. Among nonunion workers there is once again no sig- nificant public-private difference in unemployment probabilities.
Unionism has little impact on the odds that a person in the PSID will lose his job in either the public or private sector. The union and union-public sector interaction coefficients are both not significantly different from zero, in contrast to the CPS in which the interaction was negative. Household heads working in the public sector are 2.1 percentage points less likely to lose theirjobs regardless of union status, but the odds of job loss for wives are equal in the public and private sectors.
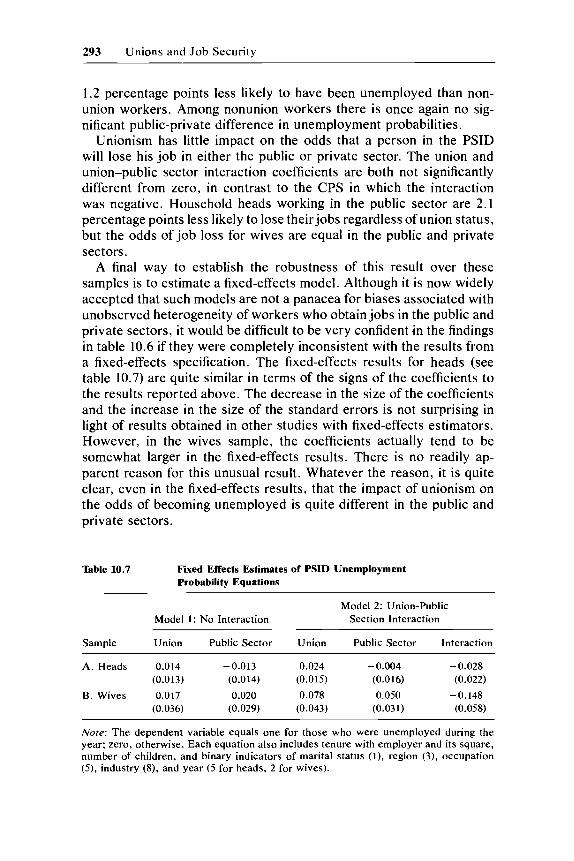
A final way to establish the robustness of this result over these samples is to estimate a fixed-effects model. Although it is now widely accepted that such models are not a panacea for biases associated with unobserved heterogeneity of workers who obtain jobs in the public and private sectors, it would be difficult to be very confident .in the findings in table 10.6 if they were completely inconsistent with the results from a fixed-effects specification. The fixed-effects results for heads (see table 10.7) are quite similar in terms of the signs of the coefficients to the results reported above. The decrease in the size of the coefficients and the increase in the size of the standard errors is not surprising in light of results obtained in other studies with fixed-effects estimators. However, in the wives sample, the coefficients actually tend to be somewhat larger in the fixed-effects results. There is no readily ap- parent reason for this unusual result. Whatever the reason, it is quite clear, even in the fixed-effects results, that the impact of unionism on the odds of becoming unemployed is quite different in the public and private sectors.
Table 10.7 Fixed Effects Estimates of PSID Unemployment Probability Equations
Model 2: Union-Public Section Interaction Model 1: No Interaction
Sample Union Public Sector Union Public Sector Interaction
A. Heads 0.014 -0.013 0.024 -0.004 - 0.028 (0.013) (0.0 14) (0.015) (0.016) (0.022)
(0.036) (0.029) (0.043) (0.031) (0.058) B. Wives 0.017 0.020 0.078 0.050 -0.148
Note: The dependent variable equals one for those who were unemployed during the year: zero, otherwise. Each equation also includes tenure with employer and its square, number of children, and binary indicators of marital status ( I ) , region (3), occupation (3, industry (8). and year (5 for heads, 2 for wives).
294 Steven G . AUen
10.7 Conclusion
The results of this paper show that much of the observed public- private difference in unemployment rates is attributable to the ability of unions to promote job security in the public sector. Despite the much lower observed unemployment probabilities for workers in the public sector, once one controls for differences in worker and job character- istics, the odds of being unemployed are identical in the public and private sectors for nonunion workers in the May 1973-75 CPS and the PSID. Even though public sector jobs are less subject to seasonal and cyclical shocks and their cyclical patterns lag those in the private sector, these factors seem to be exactly offset by the inability to produce for inventory and the labor intensity of the production process in the public sector. Although the May 1983 CPS indicates lower unemployment probabilities for nonunion public sector workers than for nonunion private sector workers, this could very well be attributable to the re- striction of the sample to employed persons or the lag of public sector layoff rates behind those in the private sector. One important impli- cation of this result is that failure to account for differences in job security is not likely to systematically bias the results of public-private pay comparisons.
This paper’s other major conclusion is that the impact of unions on unemployment and permanent layoff probabilities varies substantially between private and government jobs. The odds of being unemployed are much higher under unionism in the private sector, but they tend to be lower for union than nonunion workers in the public sector. Previous studies have attributed the higher layoff rates for union members in the private sector to the greater weight given to the preferences of older workers under unionism, as reflected by the widespread use of layoffs by seniority in downturns, and larger benefits while unemployed (both from UI and supplemental benefit plans). The adjustment process in the public sector operates differently because the political power of public employee unions can be used in many cases to prevent budget cuts, an optimal outcome for both senior and junior employees. When cuts are necessary, the absence of any UI subsidy or supplemental benefits makes layoffs a less attractive option for members of public sector unions than other adjustment mechanisms such as wage moderation.
This paper has also reported new evidence on voluntary turnover in the public sector. The quit rate is lower in the public than the private sector for heads of households, but there is no public-private difference in quits for wives. Unions decrease voluntary turnover in both sectors, but they seem to have a greater impact on turnover in the private sector.
The evidence in table 10.1 suggests that the public-private gap in unemployment and layoff rates has narrowed over time. As Joe Altonji
295 Unions and Job Security
points out in his comments below, this is difficult to reconcile with the findings that unions promote job security in the public sector. Given the growth of public sector unionism, one would expect this gap to have widened. This seeming paradox can be resolved by noting two offsetting factors. First, employment in the public sector has been growing much more slowly than in the private sector since the mid- 1970s. Second, unions have lost ground in the private sector, which should lower unemployment in that sector, other things equal. Each of these would narrow the difference in unemployment rates between the public and private sectors, and combined they could override the im- pact of growing public sector unionism.
References
Allen, Steven G. 1986. Unionism and job security in the public sector. NBER Working Paper no. 2108. Cambridge, Mass.: National Bureau of Economic Research.
Blau, Francine D., and Lawrence M. Kahn. 1983. Unionism, seniority, and turnover. Industrial Relations 22:362-73.
Bureau of National Affairs. 1982a. RIFs, layoffs, and E E O in state govern- ments. Government Employee Relations Report 948: 1 - 13.
-. 1982b. Layoffs, RIFs, and EEO in the public sector. BNA Special Report. Washington, D.C.: Bureau of National Affairs.
Clark, Kim B., and Lawrence H. Summers. 1979. Labor market dynamics and unemployment: A reconsideration. Brookings Papers on Economic Activity 1 : 13-72.
Crawford, Alan. 1983. Having it all: The rise of government unions and the decline of the work ethic. Washington Monthly 14:33-39.
Eberts, Randall W. Forthcoming. Union-negotiated employment rules and teacher quits. Economics of Education Review.
Freeman, Richard B. 1985. How d o public sector wages and employment re- spond to economic conditions? NBER Working Paper no. 1653. Cambridge, Mass.: National Bureau of Economic Research.
-. 1986. Unionism comes to the public sector. Journal of Economic Lit- erature 24:41-86.
Freeman, Richard B., and James L. Medoff. 1984. What do unions do? New York: Basic.
Levine, Charles H., Irene S. Rubin, and George G. Wolohojian. 1981. The politics of retrenchment. Beverly Hills, Calif.: Sage.
Long, James E. 1982. Are government workers overpaid? Alternative evi- dence. Journal of Human Resources 17: 123-31.
Medoff, James L. 1979. Layoffs and alternatives under trade unions in U.S. manufacturing. American Economic Review 69:380-95.
Perry, Charles R. 1979. Teachers bargaining: The experience in nine systems. Industrial and Labor Relations Review 33:3- 17.
Smith, Sharon P. 1977. Equal pay in the public sector: Fact or fantasy? Prince- ton, N.J.: Industrial Relations Section, Princeton University.
296 Steven G. Allen
U.S . Congress, Senate Committee on Finance. 1976. Unemployment compen- sation amendments of 1976: Hearings on H.R. 10210. 94th Congress, 2d sess., 8-9.
U.S . Department of Labor. Bureau of Labor Statistics. 1972. Municipal col- lective bargaining agreements in large cities. BLS Bulletin, no. 1759. Wash- ington, D.C.: Government Printing Office (GPO).
-. 1975. Characteristics of agreements in state and local governments January 1, 1974. BLS Bulletin, no. 1861. Washington, D.C.: GPO
-. 1976. Collective bargaining agreements of police and firefighters. BLS Bulletin, no. 1885. Washington, D.C.: GPO
-. 1976. Collective bargaining agreements for state and county govern- ment employees. BLS Bulletin, no. 1920. Washington, D.C.: GPO
-. 1977. Characteristics of agreements in state and local governments July 1975. BLS Bulletin, no. 1947. Washington, D.C.: GPO
Wilburn, Robert C., and Michael A. Worman. 1980. Overcoming the limits to personnel cut-backs: Lessons learned in Pennsylvania. Public Administra- tion Review 40:609-12.
Comment Joseph G. Altonji
Steven Allen has left few data sets unexplored in this straightforward and thorough empirical study of the effect of unions on layoff rates, quit rates, and unemployment rates of public and private sector work- ers. In discussing the paper, I first comment on why this topic is of interest. I then summarize the empirical analysis and suggest some extensions. In my final comments, I suggest how the main result of the paper-that union workers in the public sector have a lower probability of being on layoff than their nonunion counterparts-might be exam- ined within a broader study of the dynamics of labor demand in the public sector.
Motivation for the Study Historically, workers in public sector jobs have had much lower
layoff and unemployment rates than private sector workers. There is also substantial evidence that in the private sector union workers ex- perience somewhat higher layoff rates than nonunion workers. Fur- thermore, there are important differences in the legal and political environment faced by public and private unions and in the nature of public and private sector employers. Consequently, there are a number of reasons to expect that the effects of unionism on turnover and un- employment incidence is not the same in the public and private sector. Allen is the first to carefully investigate this issue.
Joseph G . Altonji is associate professor of economics, Northwestern University, and faculty research fellow of the National Bureau of Economic Research.
297 Unions and Job Security
There are at least three reasons why this question deserves careful consideration. First, the public sector accounts for about 20 percent of the work force. Changes in labor market structure that alter turnover behavior and unemployment in the public sector may have important effects on the unemployment rate of the economy as a whole.
Second, union effects on unemployment risk are very important in evaluating the returns to union membership for public sector workers. Most previous studies have focused on wage gains or fringe benefits.
Third, layoff behavior, wage flexibility, and hiring policies are among the factors that influence how governments respond to changes in voter preferences and to exogenous shifts in grants and revenue. Do unions alter the dynamic efficiency and the responsiveness of government? Little is known about this question. Indeed, little is known of the dynamic behavior of governments in the production of goods and ser- vices. (See Holtz-Eakin [1986] for some evidence on dynamic adjust- ments in municipal expenditures and references to other studies.)
Methodology and Results The main purpose of the econometric analysis of the paper is to
document union-nonunion differences and public-private differences in turnover and unemployment rather than to explain them, although Al- len provides a good general discussion of how unions might affect layoff rates and unemployment incidence in the public sector and of why public-private sector differences in union effects are likely. Allen begins the empirical analysis by using CPS data files for several years to produce tables summarizing public-private sector differences in the percentage of the experienced labor force on layoff by year, type of layoff, and industry. These show that the percentage of workers on layoff is indeed much higher in the private sector than in the public sector. They also show that the union effect is positive (and strong) in the private sector.
The heart of the paper is a careful multivariate analysis of the effects of unionism on unemployment probabilities in the public and private sectors. Much of the analysis relates the probability of unemployment arising from a given cause to a set of control variables, a dummy variable for union membership, a dummy variable for public sector employment, and the product of the union membership and public sector employment dummies. Separate equations are estimated for the probability of a spell of unemployment arising from a temporary layoff (reported in Allen 1986), indefinite layoff, permanent layoff, labor force reentrance, and a quit. Using the PSID, Allen also estimates equations
I . Ehrenberg and Schwartz (1983).
298 Steven G . Allen
for quits and for permanent layoffs without distinguishing separations with and without unemployment.
The most important control variables used in the analysis are oc- cupation dummies, industry dummies, age, and schooling. When work- ing with the PSID, Allen includes tenure with employer. The use of tenure can be defended but does reduce the comparability of the results across data sets and is likely to lead to biases in the fixed-effects estimates of the unemployment probability equations reported in table 10.7.
Allen estimates the probability of at least one spell of unemployment during 1982 using data obtained from the March 1983 CPS matched to information on union status from the May 1983 CPS. Unfortunately, the union data are available only for workers employed in May. Such workers are likely to have lower unemployment probabilities and stronger labor force attachment than a representative sample. As Allen points out, this makes it difficult to draw inferences about changes over time in the effects of public sector unionism on unemployment behavior.
The main results in the paper and the more detailed evidence in Allen (1986) may be summarized as follows.2
Differences between Union and Nonunion Workers in the Public Sector
Allen’s most important result is that in the public sector union work- ers have lower unemployment probabilities and fewer weeks of un- employment during the year than nonunion workers. The overall negative differential in the unemployment probability results from a substantially smaller probability of being unemployed due to a per- manent layoff as well as a smaller probability of being unemployed as a result of reentering the labor force. I suspect that a partial explanation for the higher unemployment probability associated with reentry ex- perienced by nonunion workers is participation by disadvantaged work- ers in public employment programs that are classified as nonunion. In 1978 CETA accounted for 3.3 percent of total state and local employment .3
Public sector union members have a slightly lower overall quit rate than their nonunion counterparts. This is consistent with a union wage premium in the public sector.
2. Due to space constraints, Allen only reports estimates based on a pooled sample of public and private sector workers. In the working paper version of the study (Allen 1986), he reports separate estimates for public sector and private sector workers. Use of the separate samples permits the effects of the control variables to vary across sectors. These estimates probably provide a more reliable indication of union-nonunion differ- ences in the two sectors, although they are qualitatively similar to those Allen does report here.
3. Ehrenberg and Schwartz (1983). However, at least some of the CETA jobs were regular government jobs reclassified to qualify for CETA funds.
299 Unions and Job Security
Differences between Union and Nonunion Workers in the Private Sector
Results for the 1973-75 CPS indicate that in the private sector union members have somewhat higher unemployment probabilities than non- union workers. The positive unemployment differential appears to be due primarily to differences in the incidence and duration of temporary and indefinite layoffs. The analysis of the probability of a spell of unemployment during the year using the PSID shows that the proba- bility of at least one spell is about 25 percent higher for union workers than for nonunion. However, using the matched March and May 1983 CPS files, Allen obtains a small negative estimate of the union differ- ential in the private sector for weeks of unemployment in 1982 (Allen 1986, table 1 1 ) . It is possible that this finding is an artifact of using a sample of workers who were employed in May of the following year. Overall, Allen’s results suggest that in the private sector union workers have higher unemployment probabilities than nonunion workers.
In the private sector, union workers have lower quit rates.
The Public-Private Differential among Union Workers
Union workers in the public sector have much lower probabilities of being unemployed and only about half as many weeks of unemployment during the year as their private sector counterparts (see Allen 1986). Most of the reduction may be attributed to the fact that few workers are on temporary or indefinite layoff in the public sector as well as to much lower probabilities of being on permanent layoff.
The Public-Private Differential among Nonunion Workers
The evidence on this is mixed. The results of the CPS for 1973-75 and of the PSID indicate that public and private sector nonunion work- ers have similar unemployment rates. The probability of unemployment due to a layoff is lower for public sector workers, but this is offset by a substantially higher probability that a public sector worker will be unemployed following labor force reentrance. I suspect the much higher probability of unemployment following reentrance to the labor force may arise in part because in the mid-1970s the nonunion public sector group may contain a disproportionate number of disadvantaged work- ers who held short-term, nonunion jobs through public employment programs. Furthermore, the results from the matched CPS data from 1983 indicate that the probability of at least one unemployment spell during the year and annual weeks of unemployment are both about 30 percent lower for public sector workers (see Allen 1986), although these results may be sensitive to the fact that they are for workers who were employed in May 1983. My reading of this mixed evidence is somewhat different from Allen’s in that I tentatively conclude that unemployment probabilities are lower for nonunion public sector workers than for
300 Steven G. Allen
nonunion private sector workers. However, the differential clearly is much smaller than the public-private differential among union members.
With the data sources used in the study, the analysis could be im- proved and extended in a number of ways. First, one could use March and May CPS tapes from the mid-1970s to analyze weeks of unem- ployment and the probability of unemployment over the year for a sample of workers who were employed in May of the following year. Using the PSID, one could also analyze unemployment during the year for workers who were employed in March or April of the following year. The results would be more comparable to Allen’s results for the March and May 1983 CPS and could be used to identify changes over time in the effects of public sector unionism. They might also shed light on the discrepancy in the findings based on the 1983 CPS data and the other results.
Second, in analyzing unemployment by cause it would be useful to focus more attention on distinguishing between effects on the incidence of layoffs and quits and the amount of unemployment conditional on a layoff or quit. The probability that a person is unemployed at the time of the CPS survey, due, for example, to an indefinite layoff reflects both the probability of an indefinite layoff and the duration of unem- ployment conditional on a layoff.
Third, careful consideration should be given to the effects of public employment programs, such as CETA, on the estimates of union-non- union and public-private differentials in the 1970s.
Fourth, it would be useful to analyze the effect that growth in public sector unionism during the 1960s and early 1970s has had on the public- private sector differential in turnover rates and unemployment. Figure 10.1 and the tables of descriptive statistics in the paper suggest that the public-private unemployment rate differential has not increased or (as Allen argues) has actually narrowed during this period. The data and discussion in Freeman (1986, 44-45) suggest that the percentage of public sector workers in unions and associations acting like unions increased from about 15 percent in the early 1960s to about 40 percent in the late 1970s, although Freeman emphasizes that problems of data comparability over time and changes in the distinction between asso- ciations and unions make it difficult to provide precise estimates of the growth of public sector unionism. Taken at face value, the estimate of - 1.8 percentage points for the union-nonunion differential in the public sector (see table 10.5, row 5) implies that this increase in public sector union membership would lead to a modest reduction in the unemploy- ment rate of 0.45 percentage points. For comparison, the unemploy- ment probability was typically between 2 and 3 percent in the 1960s and early 1970s.
How does one explain the discrepancy between the cross-section findings and the time-series trends? First, other changes in public and
301 Unions and Job Security
Variability in Demand for Good4 & Services
Output + Varia- through Layoffs,
bility Quits, dnd New Hires ~
302 Steven G . Allen
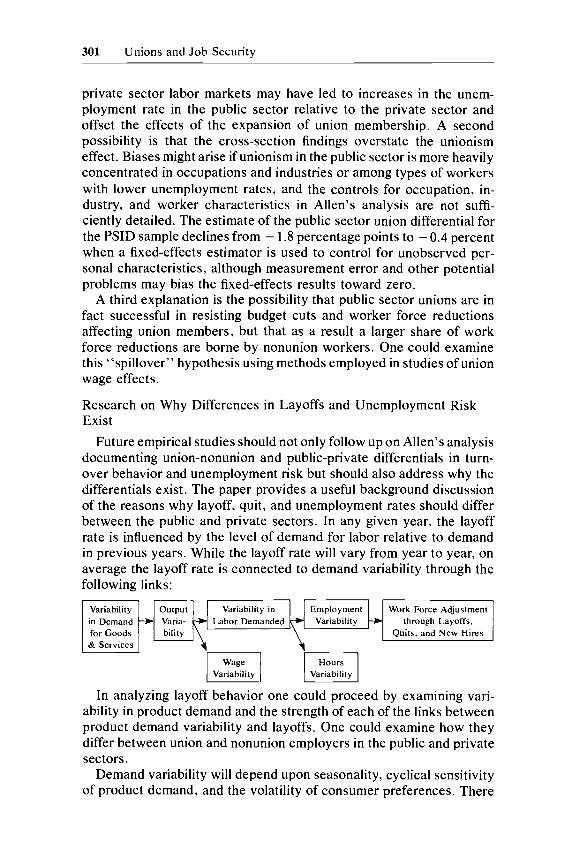
are also likely to be differences in the speed of adjustment of output and employment to changes in demand. There is evidence to suggest that in the public sector the unions have greater ability to stabilize demand than in the private sector. It would be useful to examine and compare the cyclical and seasonal variability of firm expenditures and government expenditures. One could also compare the variability of relative demand shifts within the public sector and within the private sector using techniques similar to those of Lilien (1982). In a study of employment growth by industry and province in Canada (Altonji and Ham 1986), the variability in innovations in government employment in each province was found to be lower than in all other sectors of the economy except services because government employment is less re- sponsive to external and national shocks to the economy and less responsive to shocks to each province. Most of the response of gov- ernment employment growth to these shocks occurs with a lag. We also found that the variance of shocks to employment that are specific to the public sector and common to all provinces are smaller than the variances of shocks that are specific to most other sectors. Freeman (1985) shows that employment in the public sector is less responsive to cyclical fluctuations than employment in the private sector. More work in this area is needed, particularly studies of the variability of expenditures and studies that control for union coverage.
One could examine the other links connecting demand to layoffs. Briefly, one could investigate sectoral differences in the response of man-hours to output or expenditure changes. These are likely to be affected by the degree of wage flexibility.
One could also examine public-private and union-nonunion differ- ences in the extent that the man-hours adjustment is made through hours per week or through employment changes. Work rules concerning hours reductions, overtime provisions, the unemployment insurance system, and the ability of unions to resist work force reductions will influence how man-hours adjustments are made.
Finally, one could examine the response of layoff, quit, and hire rates to a given change in employment. This is likely to be heavily influenced by differences in layoff costs. Higher wage levels will tend to reduce the quit rate and make it necessary to rely more heavily on layoffs. Casual empiricism suggests that the government sector relies more heavily on attrition and hiring freezes to adjust the work force. Civil service rules, the ability of labor to impose political costs on govern- ments that use layoffs, and the predictability of labor demand changes may provide a partial explanation.
In summary, this paper has uncovered some important public-private and union-nonunion differences in turnover behavior and unemploy- ment risk. The institutional background and econometric analysis in the paper are a very good base for future researchers to build upon.
303 Unions and Job Security
References
Allen, S. G. 1986. Unionism and job security in the public sector. NBER Working Paper no. 2108. Cambridge, Mass.: National Bureau of Economic Research.
Altonji, J. G., and J . C . Ham. 1986. Variation in employment growth in Canada: The role of external, national, regional and industrial factors. NBER Working Paper no. 1816. Cambridge, Mass.: National Bureau of Economic Research.
Ehrenberg, R. G., and J. L. Schwartz. 1983. Public sector labor markets. NBER Working Paper no. 1179. Cambridge, Mass.: National Bureau of Eco- nomic Research.
Freeman, R. B. 1986. Unionism comes to the public sector. Journal ofEco- nomic Literature 24(1):41-86.
-. 1985. How d o public sector wages and employment respond to eco- nomic conditions? NBER Working Paper no. 1653. Cambridge, Mass.: Na- tional Bureau of Economic Research.
Holtz-Eakin, D. 1986. Short-run dynamics of municipal budgets. Discussion Paper no. 320. Department of Economics, Columbia University.
Lilien, David. 1982. Sectoral shifts and cyclical unemployment. Journal of Political Economy 90:773-93.

This Page Intentionally Left Blank