Embed Size (px)
Citation preview

`
UNION PACIFIC RAILROAD COMPANY and CONSOLIDATED SUBSIDIARY COMPANIES
Consolidated Financial Statements as of December 31, 2011 and 2010
and for the Three Years Ended December 31, 2011, and Report of Independent Registered Public Accounting Firm
2
UNION PACIFIC RAILROAD COMPANY and CONSOLIDATED SUBSIDIARY COMPANIES
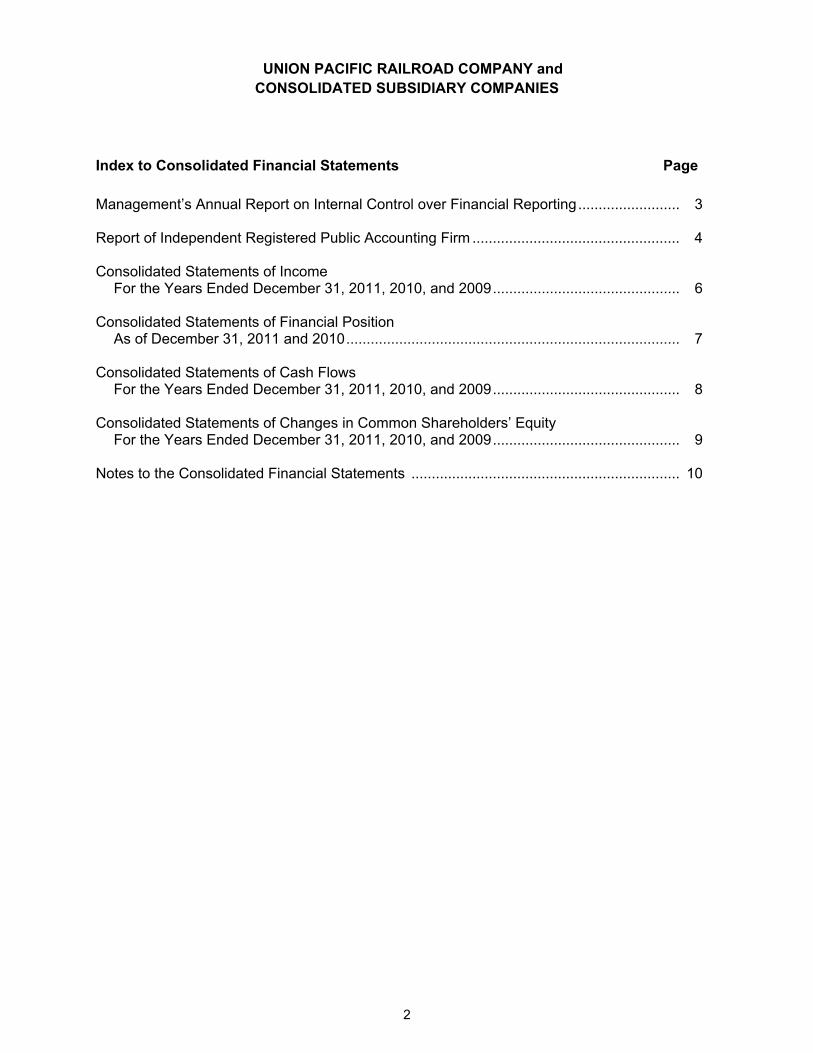
Index to Consolidated Financial Statements Page Management’s Annual Report on Internal Control over Financial Reporting ......................... 3 Report of Independent Registered Public Accounting Firm ................................................... 4 Consolidated Statements of Income For the Years Ended December 31, 2011, 2010, and 2009 .............................................. 6 Consolidated Statements of Financial Position As of December 31, 2011 and 2010 .................................................................................. 7 Consolidated Statements of Cash Flows For the Years Ended December 31, 2011, 2010, and 2009 .............................................. 8 Consolidated Statements of Changes in Common Shareholders’ Equity For the Years Ended December 31, 2011, 2010, and 2009 .............................................. 9 Notes to the Consolidated Financial Statements .................................................................. 10

3
MANAGEMENT’S ANNUAL REPORT ON INTERNAL CONTROL OVER FINANCIAL REPORTING The management of Union Pacific Railroad Company (an indirect wholly owned subsidiary of Union Pacific Corporation) and Consolidated Subsidiary Companies (the Company) is responsible for establishing and maintaining adequate internal control over financial reporting (as defined in Exchange Act Rules 13a-15(f) and 15d-15(f)). The Company’s internal control system was designed to provide reasonable assurance to the Company’s management and Board of Directors regarding the preparation and fair presentation of published financial statements. All internal control systems, no matter how well designed, have inherent limitations. Therefore, even those systems determined to be effective can provide only reasonable assurance with respect to financial statement preparation and presentation. The Company’s management assessed the effectiveness of the Company’s internal control over financial reporting as of December 31, 2011. In making this assessment, it used the criteria set forth by the Committee of Sponsoring Organizations of the Treadway Commission (COSO) in Internal Control – Integrated Framework. Based on our assessment, management believes that, as of December 31, 2011, the Company’s internal control over financial reporting is effective based on those criteria. The Company’s independent registered public accounting firm has issued an attestation report on the effectiveness of the Company’s internal control over financial reporting. This report appears on the next page. February 24, 2012
4
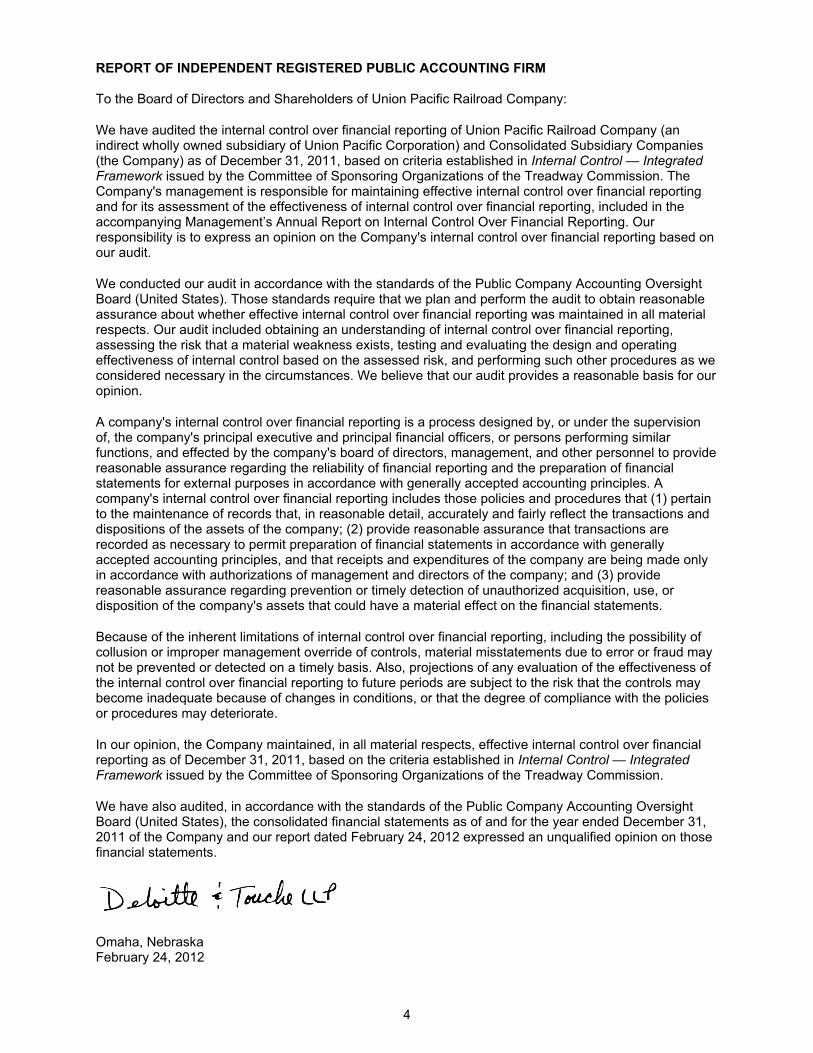
REPORT OF INDEPENDENT REGISTERED PUBLIC ACCOUNTING FIRM
To the Board of Directors and Shareholders of Union Pacific Railroad Company:
We have audited the internal control over financial reporting of Union Pacific Railroad Company (an indirect wholly owned subsidiary of Union Pacific Corporation) and Consolidated Subsidiary Companies (the Company) as of December 31, 2011, based on criteria established in Internal Control — Integrated Framework issued by the Committee of Sponsoring Organizations of the Treadway Commission. The Company's management is responsible for maintaining effective internal control over financial reporting and for its assessment of the effectiveness of internal control over financial reporting, included in the accompanying Management’s Annual Report on Internal Control Over Financial Reporting. Our responsibility is to express an opinion on the Company's internal control over financial reporting based on our audit.
We conducted our audit in accordance with the standards of the Public Company Accounting Oversight Board (United States). Those standards require that we plan and perform the audit to obtain reasonable assurance about whether effective internal control over financial reporting was maintained in all material respects. Our audit included obtaining an understanding of internal control over financial reporting, assessing the risk that a material weakness exists, testing and evaluating the design and operating effectiveness of internal control based on the assessed risk, and performing such other procedures as we considered necessary in the circumstances. We believe that our audit provides a reasonable basis for our opinion.
A company's internal control over financial reporting is a process designed by, or under the supervision of, the company's principal executive and principal financial officers, or persons performing similar functions, and effected by the company's board of directors, management, and other personnel to provide reasonable assurance regarding the reliability of financial reporting and the preparation of financial statements for external purposes in accordance with generally accepted accounting principles. A company's internal control over financial reporting includes those policies and procedures that (1) pertain to the maintenance of records that, in reasonable detail, accurately and fairly reflect the transactions and dispositions of the assets of the company; (2) provide reasonable assurance that transactions are recorded as necessary to permit preparation of financial statements in accordance with generally accepted accounting principles, and that receipts and expenditures of the company are being made only in accordance with authorizations of management and directors of the company; and (3) provide reasonable assurance regarding prevention or timely detection of unauthorized acquisition, use, or disposition of the company's assets that could have a material effect on the financial statements.
Because of the inherent limitations of internal control over financial reporting, including the possibility of collusion or improper management override of controls, material misstatements due to error or fraud may not be prevented or detected on a timely basis. Also, projections of any evaluation of the effectiveness of the internal control over financial reporting to future periods are subject to the risk that the controls may become inadequate because of changes in conditions, or that the degree of compliance with the policies or procedures may deteriorate.
In our opinion, the Company maintained, in all material respects, effective internal control over financial reporting as of December 31, 2011, based on the criteria established in Internal Control — Integrated Framework issued by the Committee of Sponsoring Organizations of the Treadway Commission.
We have also audited, in accordance with the standards of the Public Company Accounting Oversight Board (United States), the consolidated financial statements as of and for the year ended December 31, 2011 of the Company and our report dated February 24, 2012 expressed an unqualified opinion on those financial statements.
Omaha, Nebraska February 24, 2012

5
REPORT OF INDEPENDENT REGISTERED PUBLIC ACCOUNTING FIRM To the Board of Directors and Shareholders of Union Pacific Railroad Company:
We have audited the accompanying consolidated statements of financial position of Union Pacific Railroad Company (an indirect wholly owned subsidiary of Union Pacific Corporation) and Consolidated Subsidiary Companies (the Company) as of December 31, 2011 and 2010, and the related consolidated statements of income, changes in common shareholders’ equity, and cash flows for each of the three years in the period ended December 31, 2011. These financial statements are the responsibility of the Company's management. Our responsibility is to express an opinion on these financial statements based on our audits.
We conducted our audits in accordance with the standards of the Public Company Accounting Oversight Board (United States). Those standards require that we plan and perform the audit to obtain reasonable assurance about whether the financial statements are free of material misstatement. An audit includes examining, on a test basis, evidence supporting the amounts and disclosures in the financial statements. An audit also includes assessing the accounting principles used and significant estimates made by management, as well as evaluating the overall financial statement presentation. We believe that our audits provide a reasonable basis for our opinion.
In our opinion, such consolidated financial statements present fairly, in all material respects, the financial position of Union Pacific Railroad Company and Consolidated Subsidiary Companies as of December 31, 2011 and 2010, and the results of their operations and their cash flows for each of the three years in the period ended December 31, 2011, in conformity with accounting principles generally accepted in the United States of America.
We have also audited, in accordance with the standards of the Public Company Accounting Oversight Board (United States), the Company's internal control over financial reporting as of December 31, 2011, based on the criteria established in Internal Control—Integrated Framework issued by the Committee of Sponsoring Organizations of the Treadway Commission and our report dated February 24, 2012 expressed an unqualified opinion on the Company's internal control over financial reporting.
Omaha, Nebraska February 24, 2012

6
CONSOLIDATED STATEMENTS OF INCOME Union Pacific Railroad Company and Consolidated Subsidiary Companies
Millions, for the Years Ended December 31, 2011 2010 2009 Operating revenues: Freight revenues $ 18,508 $ 16,069 $ 13,373 Other revenues 1,021 865 744
Total operating revenues 19,529 16,934 14,117
Operating expenses: Compensation and benefits 4,625 4,253 4,015 Fuel 3,581 2,486 1,763 Purchased services and materials 1,984 1,811 1,627 Depreciation 1,617 1,487 1,427 Equipment and other rents 1,165 1,140 1,178 Other 839 778 729
Total operating expenses 13,811 11,955 10,739
Operating income 5,718 4,979 3,378 Other income (Note 6) 236 101 192 Interest expense (437) (459) (415)
Income before income taxes 5,517 4,621 3,155 Income taxes (Note 7) (2,070) (1,807) (1,146)
Net income $ 3,447 $ 2,814 $ 2,009
The accompanying notes are an integral part of these Consolidated Financial Statements.

7
CONSOLIDATED STATEMENTS OF FINANCIAL POSITION Union Pacific Railroad Company and Consolidated Subsidiary Companies
Millions, as of December 31, 2011 2010 Assets Current assets: Cash and cash equivalents $ 359 $ 368 Accounts receivable, net (Note 10) 1,342 1,116 Materials and supplies 614 534 Current deferred income taxes (Note 7) 294 243 Other current assets 164 326
Total current assets 2,773 2,587
Investments 1,129 1,099 Net properties (Note 11) 39,925 38,241 Other assets 204 214
Total assets $ 44,031 $ 42,141
Liabilities and Common Shareholders' Equity Current liabilities: Accounts payable and other current liabilities (Note 12) $ 2,696 $ 2,323 Third-party debt due within one year (Note 15) 209 229
Total current liabilities 2,905 2,552
Intercompany borrowings from UPC (Note 15) 945 2,608 Third-party debt due after one year (Note 15) 2,015 2,075 Deferred income taxes (Note 7) 12,303 11,549 Other long-term liabilities 2,186 1,865 Commitments and contingencies (Notes 17 and 18)
Total liabilities 20,354 20,649
Common shareholders' equity: Common shares, $10.00 par value, 9,200 authorized; 4,465 outstanding - 1 - Class A shares, $10.00 par value, 800 authorized; 388 outstanding - 1 - Paid-in-surplus 4,782 4,782 Retained earnings 19,949 17,444 Accumulated other comprehensive loss (Note 9) (1,054) (734)
Total common shareholders' equity 23,677 21,492
Total liabilities and common shareholders' equity $ 44,031 $ 42,141
The accompanying notes are an integral part of these Consolidated Financial Statements.
8
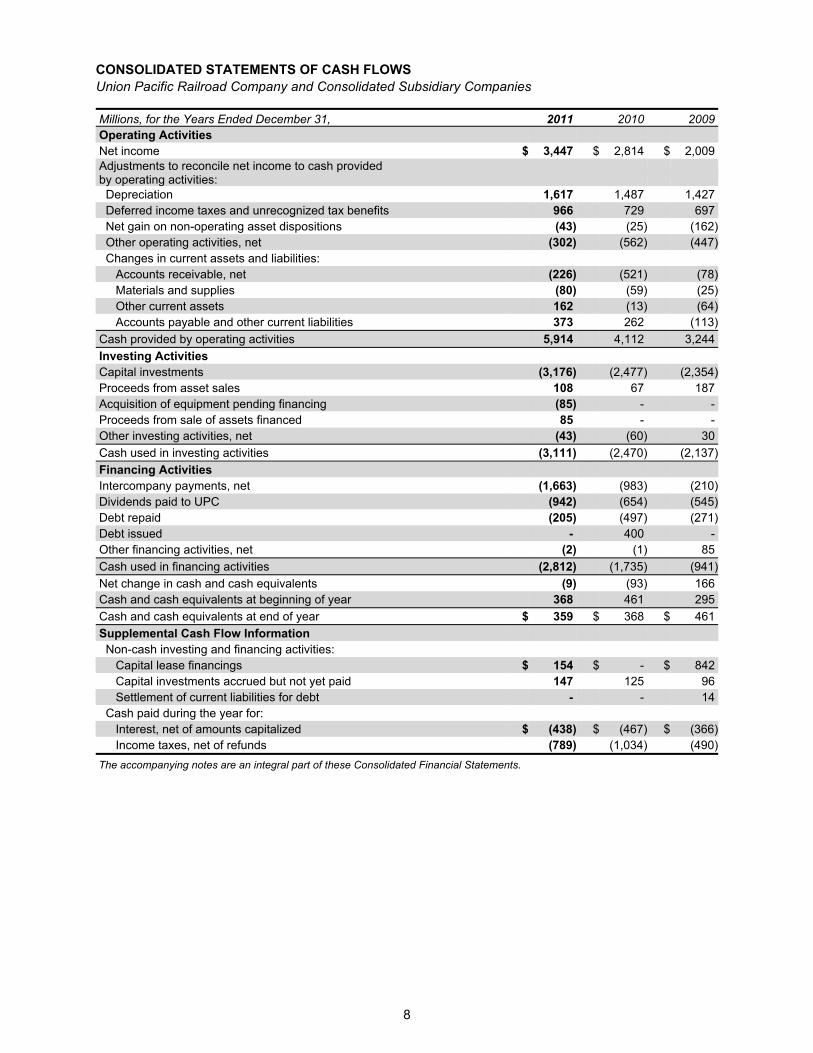
CONSOLIDATED STATEMENTS OF CASH FLOWS Union Pacific Railroad Company and Consolidated Subsidiary Companies
Millions, for the Years Ended December 31, 2011 2010 2009 Operating Activities Net income $ 3,447 $ 2,814 $ 2,009 Adjustments to reconcile net income to cash provided by operating activities:
Depreciation 1,617 1,487 1,427 Deferred income taxes and unrecognized tax benefits 966 729 697 Net gain on non-operating asset dispositions (43) (25) (162) Other operating activities, net (302) (562) (447) Changes in current assets and liabilities: Accounts receivable, net (226) (521) (78) Materials and supplies (80) (59) (25) Other current assets 162 (13) (64) Accounts payable and other current liabilities 373 262 (113)
Cash provided by operating activities 5,914 4,112 3,244
Investing Activities Capital investments (3,176) (2,477) (2,354) Proceeds from asset sales 108 67 187 Acquisition of equipment pending financing (85) - - Proceeds from sale of assets financed 85 - - Other investing activities, net (43) (60) 30
Cash used in investing activities (3,111) (2,470) (2,137)
Financing Activities Intercompany payments, net (1,663) (983) (210) Dividends paid to UPC (942) (654) (545) Debt repaid (205) (497) (271) Debt issued - 400 - Other financing activities, net (2) (1) 85
Cash used in financing activities (2,812) (1,735) (941)
Net change in cash and cash equivalents (9) (93) 166 Cash and cash equivalents at beginning of year 368 461 295
Cash and cash equivalents at end of year $ 359 $ 368 $ 461
Supplemental Cash Flow Information Non-cash investing and financing activities: Capital lease financings $ 154 $ - $ 842 Capital investments accrued but not yet paid 147 125 96 Settlement of current liabilities for debt - - 14 Cash paid during the year for: Interest, net of amounts capitalized $ (438) $ (467) $ (366) Income taxes, net of refunds (789) (1,034) (490)
The accompanying notes are an integral part of these Consolidated Financial Statements.

9
CONSOLIDATED STATEMENTS OF CHANGES IN COMMON SHAREHOLDERS' EQUITY Union Pacific Railroad Company and Consolidated Subsidiary Companies
Millions Common
SharesClass AShares
Common Shares
Paid-in-Surplus
Retained Earnings
AOCI [a] Total
Balance at January 1, 2009 4,465 388 $ - $ 4,782 $ 13,820 $ (704) $ 17,898
Comprehensive income: Net income - - 2,009 - 2,009 Other comp. income - - - 50 50
Total comp. income (Note 9) 2,059
Cash dividends declared - - - - (545) - (545)
Balance at December 31, 2009 4,465 388 $ - $ 4,782 $ 15,284 $ (654) $ 19,412
Comprehensive income: Net income - - 2,814 - 2,814 Other comp. loss - - - (80) (80)
Total comp. income (Note 9) 2,734
Cash dividends declared - - - - (654) - (654)
Balance at December 31, 2010 4,465 388 $ - $ 4,782 $ 17,444 $ (734) $ 21,492
Comprehensive income: Net income - - 3,447 - 3,447 Other comp. loss - - - (320) (320) Total comp. income (Note 9) 3,127
Cash dividends declared - - - - (942) - (942)
Balance at December 31, 2011 4,465 388 $ - $ 4,782 $ 19,949 $ (1,054) $ 23,677
[a] AOCI = Accumulated Other Comprehensive Income/(Loss) (Note 9)
The accompanying notes are an integral part of these Consolidated Financial Statements.

10
NOTES TO THE CONSOLIDATED FINANCIAL STATEMENTS Union Pacific Railroad Company and Consolidated Subsidiary Companies
For purposes of this report, unless the context otherwise requires, all references herein to the “Company”, “we”, “us”, and “our” mean Union Pacific Railroad Company and Consolidated Subsidiaries. Union Pacific Railroad Company, together with our wholly-owned and majority-owned subsidiaries, is an indirect wholly-owned subsidiary of Union Pacific Corporation, herein “the Corporation” or “UPC”. 1. Nature of Operations Operations and Segmentation – We are a Class I railroad that operates in the U.S. Our network includes 31,898 route miles, linking Pacific Coast and Gulf Coast ports with the Midwest and eastern U.S. gateways and providing several corridors to key Mexican gateways. We own 26,027 miles and operate on the remainder pursuant to trackage rights or leases. We serve the western two-thirds of the country and maintain coordinated schedules with other rail carriers for the handling of freight to and from the Atlantic Coast, the Pacific Coast, the Southeast, the Southwest, Canada, and Mexico. Export and import traffic is moved through Gulf Coast and Pacific Coast ports and across the Mexican and Canadian borders. We have one reportable operating segment. Although revenues are analyzed by commodity group, we analyze the net financial results as one segment due to the integrated nature of our rail network. The following table provides revenue by commodity group: Millions 2011 2010 2009 Agricultural $ 3,324 $ 3,018 $ 2,666 Automotive 1,510 1,271 854 Chemicals 2,815 2,425 2,102 Energy 4,084 3,489 3,118 Industrial Products 3,166 2,639 2,147 Intermodal 3,609 3,227 2,486
Total freight revenues $ 18,508 $ 16,069 $ 13,373 Other revenues 1,021 865 744
Total operating revenues $ 19,529 $ 16,934 $ 14,117
Although our revenues are principally derived from customers domiciled in the U.S., the ultimate points of origination or destination for some products transported by us are outside the U.S.
Basis of Presentation – The Consolidated Financial Statements are presented in accordance with accounting principles generally accepted in the U.S. (GAAP) as codified in the Financial Accounting Standards Board (FASB) Accounting Standards Codification (ASC).
Subsequent Events – We evaluated the effects of all subsequent events through February 24, 2012, the report issuance date. 2. Significant Accounting Policies Principles of Consolidation – The Consolidated Financial Statements include the accounts of Union Pacific Railroad Company and all of its subsidiaries. Investments in affiliated companies (20% to 50% owned) are accounted for using the equity method of accounting. All intercompany transactions are eliminated. We currently have no less than majority-owned investments that require consolidation under variable interest entity requirements. Cash and Cash Equivalents – Cash equivalents consist of investments with original maturities of three months or less. Accounts Receivable – Accounts receivable includes receivables reduced by an allowance for doubtful accounts. The allowance is based upon historical losses, credit worthiness of customers, and current economic conditions. Receivables not expected to be collected in one year and the associated allowances are classified as other assets in our Consolidated Statements of Financial Position.

11
Investments – Investments represent our investments in affiliated companies (20% to 50% owned) that are accounted for under the equity method of accounting and investments in companies (less than 20% owned) accounted for under the cost method of accounting. Materials and Supplies – Materials and supplies are carried at the lower of average cost or market. Property and Depreciation – Properties and equipment are carried at cost and are depreciated on a straight-line basis over their estimated service lives, which are measured in years, except for rail in high-density traffic corridors (i.e., all rail lines except for those subject to abandonment, yard and switching tracks, and electronic yards), for which lives are measured in millions of gross tons per mile of track. We use the group method of depreciation in which all items with similar characteristics, use, and expected lives are grouped together in asset classes, and are depreciated using composite depreciation rates. The group method of depreciation treats each asset class as a pool of resources, not as singular items. We determine the estimated service lives of depreciable railroad assets by means of depreciation studies. Under the group method of depreciation, no gain or loss is recognized when depreciable property is retired or replaced in the ordinary course of business. Impairment of Long-lived Assets – We review long-lived assets, including identifiable intangibles, for impairment when events or changes in circumstances indicate that the carrying amount of an asset may not be recoverable. If impairment indicators are present and the estimated future undiscounted cash flows are less than the carrying value of the long-lived assets, the carrying value is reduced to the estimated fair value as measured by the discounted cash flows. Revenue Recognition – We recognize freight revenues as freight moves from origin to destination. The allocation of revenue between reporting periods is based on the relative transit time in each reporting period with expenses recognized as incurred. Other revenues, which include revenues earned by our subsidiaries, revenues from our commuter rail operations, and accessorial revenue, are recognized as service is performed or contractual obligations are met. Customer incentives, which are primarily provided for shipping a specified cumulative volume or shipping to/from specific locations, are recorded as a reduction to operating revenues based on actual or projected future customer shipments. Translation of Foreign Currency – Our portion of the assets and liabilities related to foreign investments are translated into U.S. dollars at the exchange rates in effect at the balance sheet date. Revenue and expenses are translated at the average rates of exchange prevailing during the year. Unrealized gains or losses are reflected within common shareholders’ equity as accumulated other comprehensive income or loss. Fair Value Measurements – We use a fair value hierarchy that prioritizes the inputs to valuation techniques used to measure fair value into three broad levels. The level in the fair value hierarchy within which the fair value measurement in its entirety falls is determined based on the lowest level input that is significant to the fair value measurement in its entirety. These levels include: Level 1: Quoted market prices in active markets for identical assets or liabilities. Level 2: Observable market-based inputs or unobservable inputs that are corroborated by market data. Level 3: Unobservable inputs that are not corroborated by market data. We have applied fair value measurements to our pension plan assets. Stock-Based Compensation – We participate in the Corporation’s stock-based incentive programs. The Corporation has several stock-based compensation plans under which our employees receive stock options, nonvested retention shares, and nonvested stock units. We refer to the nonvested shares and stock units collectively as “retention awards”. The Corporation has elected to issue treasury shares to cover option exercises and stock unit vestings, while new shares are issued when retention shares are granted. The Corporation measures and recognizes compensation expense for all stock-based awards made to employees. We reimburse the Corporation for the portion of expense associated with our employees. Compensation expense is based on the calculated fair value of the awards as measured at the grant date and is expensed ratably over the service period of the awards (generally the vesting period). The fair value of retention awards is the closing stock price on the date of grant, while the fair value of stock options is determined by using the Black-Scholes option pricing model.
12
Income Taxes – We account for income taxes by recording taxes payable or refundable for the current year and deferred tax assets and liabilities for the expected future tax consequences of events that have been recognized in our financial statements or tax returns. These expected future tax consequences are measured based on current tax law; the effects of future tax legislation are not anticipated. Future tax legislation, such as a change in the corporate tax rate, could have a material impact on our financial condition, results of operations, or liquidity. When appropriate, we record a valuation allowance against deferred tax assets to reflect that these tax assets may not be realized. In determining whether a valuation allowance is appropriate, we consider whether it is more likely than not that all or some portion of our deferred tax assets will not be realized, based on management’s judgments using available evidence for purposes of estimating whether future taxable income will be sufficient to realize a deferred tax asset. We recognize tax benefits that are more likely than not to be sustained upon examination by tax authorities. The amount recognized is measured as the largest amount of benefit that is greater than 50 percent likely to be realized upon settlement. A liability for “unrecognized tax benefits” is recorded for any tax benefits claimed in our tax returns that do not meet these recognition and measurement standards. Pension and Postretirement Benefits – We incur certain employment-related expenses associated with pensions and postretirement health benefits. In order to measure the expense associated with these benefits, we must make various assumptions including discount rates used to value certain liabilities, expected return on plan assets used to fund these expenses, compensation increases, employee turnover rates, anticipated mortality rates, and expected future health care costs. The assumptions used by us are based on our historical experience as well as current facts and circumstances. We use an actuarial analysis to measure the expense and liability associated with these benefits. Personal Injury – The cost of injuries to employees and others on our property is charged to expense based on estimates of the ultimate cost and number of incidents each year. We use an actuarial analysis to measure the expense and liability. Our personal injury liability is discounted to present value using applicable U.S. Treasury rates. Legal fees and incidental costs are expensed as incurred. Asbestos – We estimate a liability for asserted and unasserted asbestos-related claims based on an assessment of the number and value of those claims. We use a statistical analysis to assist us in properly measuring our potential liability. Our liability for asbestos-related claims is not discounted to present value due to the uncertainty surrounding the timing of future payments. Legal fees and incidental costs are expensed as incurred. Environmental – When environmental issues have been identified with respect to property currently or formerly owned, leased, or otherwise used in the conduct of our business, we and our consultants perform environmental assessments on such property. We expense the cost of the assessments as incurred. We accrue the cost of remediation where our obligation is probable and such costs can be reasonably estimated. We do not discount our environmental liabilities when the timing of the anticipated cash payments is not fixed or readily determinable. Legal fees and incidental costs are expensed as incurred. Use of Estimates – Our Consolidated Financial Statements include estimates and assumptions regarding certain assets, liabilities, revenue, and expenses and the disclosure of certain contingent assets and liabilities. Actual future results may differ from such estimates. 3. Recently Issued Accounting Pronouncements In June 2011, the FASB issued Accounting Standards Update No. 2011-05, Comprehensive Income (Topic 220): Presentation of Comprehensive Income (ASU 2011-05). ASU 2011-05 will require companies to present the components of net income and other comprehensive income either as one continuous statement or as two consecutive statements. It eliminates the option to present components of other comprehensive income as part of the statement of changes in stockholders' equity. The standard does not change the items which must be reported in other comprehensive income, how such items are measured or when they must be reclassified to net income. This standard is effective for interim and annual periods beginning after December 15, 2012. Because this ASU impacts presentation only, it will have no effect on our financial condition, results of operations or cash flows.

13
4. Stock Options and Other Stock Plans We participate in the Corporation’s stock incentive programs. The Union Pacific Corporation 2001 Stock Incentive Plan (2001 Plan) was approved by the shareholders in April 2001. The 2001 Plan reserved 24,000,000 shares of UPC common stock for issuance to eligible employees of the Corporation and its subsidiaries in the form of non-qualified options, incentive stock options, retention shares, stock units, and incentive bonus awards. As of December 31, 2011, 427,424 options were outstanding for our participants under the 2001 Plan. The Corporation no longer grants any stock options or other stock or unit awards under this plan. The Union Pacific Corporation 2004 Stock Incentive Plan (2004 Plan) was approved by shareholders in April 2004. The 2004 Plan reserved 42,000,000 shares of UPC common stock for issuance, plus any shares subject to awards made under the 2001 Plan and the 1993 Plan that were outstanding on April 16, 2004, and became available for regrant pursuant to the terms of the 2004 Plan. Under the 2004 Plan, non-qualified options, stock appreciation rights, retention shares, stock units, and incentive bonus awards may be granted to eligible employees of the Corporation and its subsidiaries. As of December 31, 2011, 3,355,806 options and 2,281,658 retention shares and stock units were outstanding for our participants under the 2004 Plan. Pursuant to the above plans 31,681,243; 32,211,191; and 32,840,822 shares of the Corporation’s common stock were authorized and available for grant at December 31, 2011, 2010, and 2009, respectively. Stock-Based Compensation – The Corporation has several stock-based compensation plans under which employees receive stock options, nonvested retention shares, and nonvested stock units. We refer to the nonvested shares and stock units collectively as “retention awards”. New shares are issued by UPC when retention shares are granted. Information regarding stock-based compensation appears in the table below: Millions 2011 2010 2009 Stock-based compensation, before tax: Stock options $ 11 $ 11 $ 12 Retention awards 49 42 32
Total stock-based compensation, before tax $ 60 $ 53 $ 44
Stock Options – The fair value of UPC’s stock option awards is estimated using the Black-Scholes option pricing model. The table below shows the annual weighted-average assumptions used for valuation purposes: Weighted-Average Assumptions 2011 2010 2009 Risk-free interest rate 2.3% 2.4% 1.9% Dividend yield 1.6% 1.8% 2.3% Expected life (years) 5.3 5.4 5.1 Volatility 35.9% 35.2% 31.3%
Weighted-average grant-date fair value of options granted $ 28.45 $ 18.26 $ 11.33
The risk-free rate is based on the U.S. Treasury yield curve in effect at the time of grant; the dividend yield is calculated as the ratio of dividends paid per share of common stock to the stock price on the date of grant; the expected life is based on historical and expected exercise behavior; and volatility is based on the historical volatility of UPC’s stock price over the expected life of the option. Stock options are granted at the closing price on the date of grant, have ten-year contractual terms, and vest no later than three years from the date of grant. None of the stock options outstanding at December 31, 2011 are subject to performance or market-based vesting conditions.
14
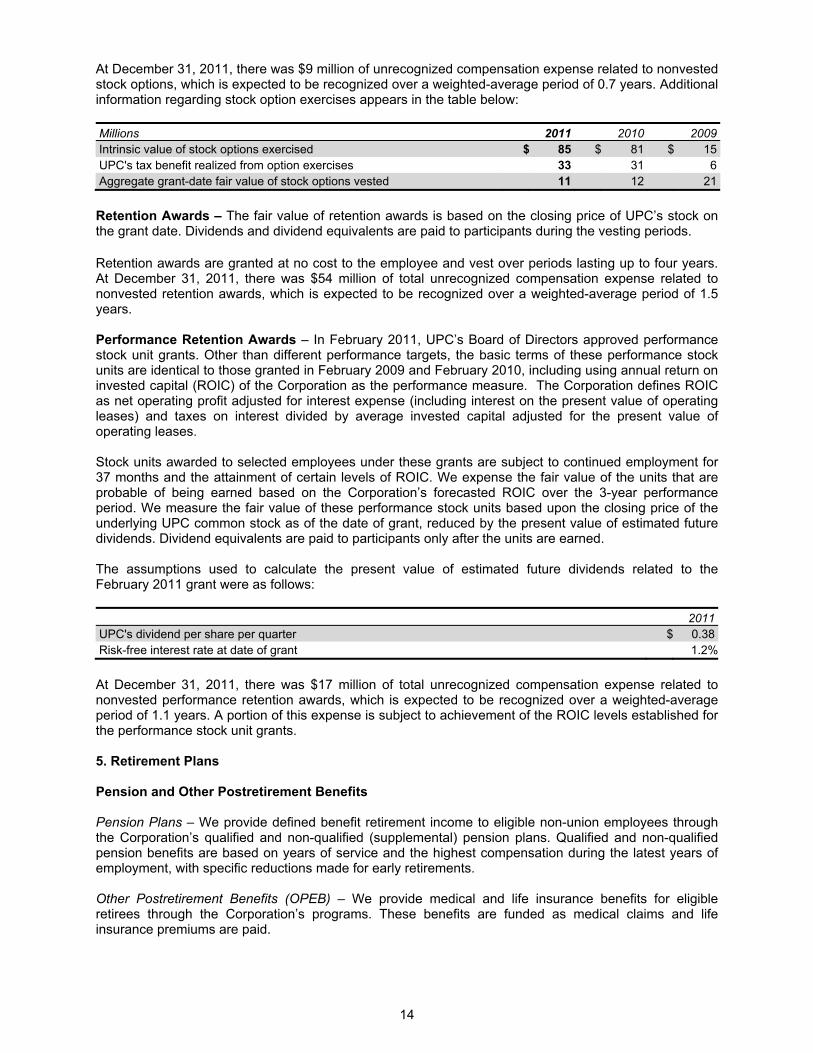
At December 31, 2011, there was $9 million of unrecognized compensation expense related to nonvested stock options, which is expected to be recognized over a weighted-average period of 0.7 years. Additional information regarding stock option exercises appears in the table below: Millions 2011 2010 2009 Intrinsic value of stock options exercised $ 85 $ 81 $ 15 UPC's tax benefit realized from option exercises 33 31 6 Aggregate grant-date fair value of stock options vested 11 12 21
Retention Awards – The fair value of retention awards is based on the closing price of UPC’s stock on the grant date. Dividends and dividend equivalents are paid to participants during the vesting periods. Retention awards are granted at no cost to the employee and vest over periods lasting up to four years. At December 31, 2011, there was $54 million of total unrecognized compensation expense related to nonvested retention awards, which is expected to be recognized over a weighted-average period of 1.5 years. Performance Retention Awards – In February 2011, UPC’s Board of Directors approved performance stock unit grants. Other than different performance targets, the basic terms of these performance stock units are identical to those granted in February 2009 and February 2010, including using annual return on invested capital (ROIC) of the Corporation as the performance measure. The Corporation defines ROIC as net operating profit adjusted for interest expense (including interest on the present value of operating leases) and taxes on interest divided by average invested capital adjusted for the present value of operating leases. Stock units awarded to selected employees under these grants are subject to continued employment for 37 months and the attainment of certain levels of ROIC. We expense the fair value of the units that are probable of being earned based on the Corporation’s forecasted ROIC over the 3-year performance period. We measure the fair value of these performance stock units based upon the closing price of the underlying UPC common stock as of the date of grant, reduced by the present value of estimated future dividends. Dividend equivalents are paid to participants only after the units are earned. The assumptions used to calculate the present value of estimated future dividends related to the February 2011 grant were as follows: 2011 UPC's dividend per share per quarter $ 0.38 Risk-free interest rate at date of grant 1.2%
At December 31, 2011, there was $17 million of total unrecognized compensation expense related to nonvested performance retention awards, which is expected to be recognized over a weighted-average period of 1.1 years. A portion of this expense is subject to achievement of the ROIC levels established for the performance stock unit grants. 5. Retirement Plans Pension and Other Postretirement Benefits Pension Plans – We provide defined benefit retirement income to eligible non-union employees through the Corporation’s qualified and non-qualified (supplemental) pension plans. Qualified and non-qualified pension benefits are based on years of service and the highest compensation during the latest years of employment, with specific reductions made for early retirements. Other Postretirement Benefits (OPEB) – We provide medical and life insurance benefits for eligible retirees through the Corporation’s programs. These benefits are funded as medical claims and life insurance premiums are paid.

15
Plan Amendment Effective January 1, 2010, Medicare-eligible retirees who are enrolled in the Union Pacific Retiree Medical Program received a contribution to a Health Reimbursement Account, which can be used to pay eligible out-of-pocket medical expenses. Funded Status We are required by GAAP to separately recognize the overfunded or underfunded status of our pension and OPEB plans as an asset or liability. The funded status represents the difference between the projected benefit obligation (PBO) and the fair value of the plan assets. Our non-qualified (supplemental) pension plan is unfunded by design. The PBO of the pension plans is the present value of benefits earned to date by plan participants, including the effect of assumed future compensation increases. The PBO of the OPEB plan is equal to the accumulated benefit obligation, as the present value of the OPEB liabilities is not affected by compensation increases. Plan assets are measured at fair value. We use a December 31 measurement date for plan assets and obligations for all our retirement plans. Changes in our PBO and plan assets were as follows for the years ended December 31: Funded Status Pension OPEB
Millions 2011 2010 2011 2010 Projected Benefit Obligation Projected benefit obligation at beginning of year $ 2,759 $ 2,448 $ 318 $ 314 Service cost 40 34 2 2 Interest cost 145 143 15 16 Plan amendments - - 10 (6) Actuarial loss 377 281 15 16 Gross benefits paid (156) (147) (24) (24)
Projected benefit obligation at end of year $ 3,165 $ 2,759 $ 336 $ 318
Plan Assets Fair value of plan assets at beginning of year $ 2,404 $ 2,044 $ - $ - Actual return on plan assets 42 294 - - Voluntary funded pension plan contributions 200 200 - - Non-qualified plan benefit contributions 15 13 24 24 Gross benefits paid (156) (147) (24) (24)
Fair value of plan assets at end of year $ 2,505 $ 2,404 $ - $ -
Funded status at end of year $ (660) $ (355) $ (336) $ (318)
Amounts recognized in the statement of financial position as of December 31, 2011 and 2010 consist of: Pension OPEB
Millions 2011 2010 2011 2010 Noncurrent assets $ - $ 1 $ - $ - Current liabilities (15) (15) (26) (27) Noncurrent liabilities (645) (341) (310) (291)
Net amounts recognized at end of year $ (660) $ (355) $ (336) $ (318)

16
Pre-tax amounts recognized in accumulated other comprehensive income/(loss) as of December 31, 2011 and 2010 consist of: 2011 2010
Millions Pension OPEB Total Pension OPEB Total Prior service (cost)/credit $ (1) $ 63 $ 62 $ (3) $ 106 $ 103 Net actuarial loss (1,503) (146) (1,649) (1,059) (142) (1,201)
Total $ (1,504) $ (83) $ (1,587) $ (1,062) $ (36) $ (1,098)
Other pre-tax changes recognized in other comprehensive income during 2011, 2010 and 2009 were as follows: Pension OPEB
Millions 2011 2010 2009 2011 2010 2009 Prior service cost/(credit) $ - $ - $ - $ 10 $ (6) $ (78) Net actuarial (gain)/loss 515 165 (51) 14 16 (21) Amortization of: Prior service cost/(credit) (2) (3) (5) 34 45 44 Actuarial loss (71) (49) (30) (11) (13) (12)
Total $ 442 $ 113 $ (86) $ 47 $ 42 $ (67)
Amounts included in accumulated other comprehensive income expected to be amortized into net periodic cost (benefit) during 2012: Millions Pension OPEB Total Prior service cost/(benefit) $ 1 $ (17) $ (16) Net actuarial loss 104 12 116
Total $ 105 $ (5) $ 100
Underfunded Accumulated Benefit Obligation – The accumulated benefit obligation (ABO) is the present value of benefits earned to date, assuming no future compensation growth. The underfunded accumulated benefit obligation represents the difference between the ABO and the fair value of plan assets. At December 31, 2011 and 2010, the non-qualified (supplemental) plan ABO was $284 million and $257 million, respectively. The PBO, ABO, and fair value of plan assets for pension plans with accumulated benefit obligations in excess of the fair value of the plan assets were as follows for the years ended December 31: Underfunded Accumulated Benefit Obligation Millions 2011 2010
Projected benefit obligation $ 3,165 $ 2,741
Accumulated benefit obligation $ (3,050) $ (2,663) Fair value of plan assets 2,505 2,385
Underfunded accumulated benefit obligation $ (545) $ (278)
The ABO for all defined benefit pension plans was $3.0 billion and $2.7 billion at December 31, 2011 and 2010, respectively.

17
Assumptions – The weighted-average actuarial assumptions used to determine benefit obligations at December 31: Pension OPEB
Percentages 2011 2010 2011 2010 Discount rate 4.54% 5.35% 4.36% 5.01% Compensation increase 4.60% 3.36% N/A N/A Health care cost trend rate (employees under 65) N/A N/A 6.91% 7.07% Ultimate health care cost trend rate N/A N/A 4.50% 4.50% Year ultimate trend rate reached N/A N/A 2028 2028
Expense Both pension and OPEB expense are determined based upon the annual service cost of benefits (the actuarial cost of benefits earned during a period) and the interest cost on those liabilities, less the expected return on plan assets. The expected long-term rate of return on plan assets is applied to a calculated value of plan assets that recognizes changes in fair value over a five-year period. This practice is intended to reduce year-to-year volatility in pension expense, but it can have the effect of delaying the recognition of differences between actual returns on assets and expected returns based on long-term rate of return assumptions. Differences in actual experience in relation to assumptions are not recognized in net income immediately, but are deferred and, if necessary, amortized as pension or OPEB expense. The components of our net periodic pension and OPEB cost/(benefit) were as follows for the years ended December 31: Pension OPEB
Millions 2011 2010 2009 2011 2010 2009 Net Periodic Benefit Cost: Service cost $ 40 $ 34 $ 38 $ 2 $ 2 $ 2 Interest cost 145 143 140 15 16 18 Expected return on plan assets (180) (178) (159) - - - Amortization of: Prior service cost/(credit) 2 3 5 (34) (45) (44) Actuarial loss 71 49 30 11 13 12
Net periodic benefit cost/(benefit) $ 78 $ 51 $ 54 $ (6) $ (14) $ (12)
Assumptions – The weighted-average actuarial assumptions used to determine expense were as follows for the years ended December 31: Pension OPEB
Percentages 2011 2010 2009 2011 2010 2009 Discount rate 5.35% 5.90% 6.25% 5.01% 5.55% 6.25% Expected return on plan assets 7.50% 8.00% 8.00% N/A N/A N/A Compensation increase 4.48% 3.45% 3.50% N/A N/A N/A
Health care cost trend rate (employees under 65) N/A N/A N/A 7.07% 7.24% 7.50%
Health care cost trend rate (employees over 65) N/A N/A N/A N/A N/A 9.10% Ultimate health care cost trend rate N/A N/A N/A 4.50% 4.50% 4.50% Year ultimate trend reached N/A N/A N/A 2028 2028 2028
The discount rate was based on a yield curve of high quality corporate bonds with cash flows matching our plans’ expected benefit payments. The expected return on plan assets is based on our asset allocation mix and our historical return, taking into account current and expected market conditions. The actual return on pension plan assets, net of fees, was approximately 2% in 2011, 14% in 2010, and 23% in 2009. Assumed health care cost trend rates have a significant effect on the expense and liabilities reported for health care plans. The assumed health care cost trend rate is based on historical rates and expected market conditions. The 2012 assumed health care cost trend rate for employees under 65 is 6.91%. It is

18
assumed the rate will decrease gradually to an ultimate rate of 4.5% in 2028 and will remain at that level. A one-percentage point change in the assumed health care cost trend rates would have the following effects on OPEB:
Millions One % pt.
IncreaseOne % pt. Decrease
Effect on total service and interest cost components $ 1 $ (1) Effect on accumulated benefit obligation 14 (12)
Cash Contributions The following table details UPC’s cash contributions for the qualified pension plans and the benefit payments for the non-qualified (supplemental) pension and OPEB plans: Pension
Millions Qualified Non-qualified OPEB 2010 $ 200 13 24 2011 200 15 24
UPC’s policy with respect to funding the qualified plans is to fund at least the minimum required by law and not more than the maximum amount deductible for tax purposes. All contributions made to the qualified pension plans in 2011 were voluntary and were made with cash generated from operations. The non-qualified pension and OPEB plans are not funded and are not subject to any minimum regulatory funding requirements. Benefit payments for each year represent supplemental pension payments and claims paid for medical and life insurance. We anticipate our 2012 supplemental pension and OPEB payments will be made from cash generated from operations. Benefit Payments The following table details expected benefit payments for the years 2012 through 2021: Millions Pension OPEB 2012 $ 158 $ 26 2013 161 26 2014 166 26 2015 171 26 2016 176 26 Years 2017 - 2021 957 119
Asset Allocation Strategy UPC’s pension plan asset allocation at December 31, 2011 and 2010, and target allocation for 2012, are as follows:
Target Allocation 2012
Percentage of Plan Assets December 31,
2011 2010 Equity securities 47% to 63% 58% 60% Debt securities 30% to 40% 32 31 Real estate 2% to 8% 5 4 Commodities 4% to 6% 5 5
Total 100% 100%
The investment strategy for pension plan assets is to maintain a broadly diversified portfolio designed to achieve our target average long-term rate of return of 7.5%. While we believe we can achieve a long-term average rate of return of 7.5%, we cannot be certain that the portfolio will perform to our expectations. Assets are strategically allocated among equity, debt, and other investments in order to achieve a

19
diversification level that reduces fluctuations in investment returns. Asset allocation target ranges for equity, debt, and other portfolios are evaluated at least every three years with the assistance of an independent external consulting firm. Actual asset allocations are monitored monthly, and rebalancing actions are executed at least quarterly, if needed. The pension plan investments are held in a Master Trust. The majority of pension plan assets are invested in equity securities because equity portfolios have historically provided higher returns than debt and other asset classes over extended time horizons and are expected to do so in the future. Correspondingly, equity investments also entail greater risks than other investments. Equity risks are balanced by investing a significant portion of the plans’ assets in high quality debt securities. The average credit rating of the debt portfolio exceeded A+ as of December 31, 2011 and 2010. The debt portfolio is also broadly diversified and invested primarily in U.S. Treasury, mortgage, and corporate securities. The weighted-average maturity of the debt portfolio was 12 years at both December 31, 2011 and 2010. The investment of pension plan assets in securities issued by the Corporation or us is specifically prohibited by the plan for both the equity and debt portfolios, other than through index fund holdings. Fair Value Measurements
The pension plan assets are valued at fair value. The following is a description of the valuation methodologies used for the investments measured at fair value, including the general classification of such instruments pursuant to the valuation hierarchy. Temporary Cash Investments – These investments consist of U.S. dollars and foreign currencies held in master trust accounts at The Northern Trust Company. Foreign currencies held are reported in terms of U.S. dollars based on currency exchange rates readily available in active markets. These temporary cash investments are classified as Level 1 investments.
Registered Investment Companies – Registered Investment Companies are real estate investments, non-U.S. stock investments, and bond investments registered with the Securities and Exchange Commission. The real estate investments and non-U.S. stock investments are traded actively on public exchanges. The share prices for these investments are published at the close of each business day. Holdings of real estate investments and non-U.S. stock investments are classified as Level 1 investments. The bond investments are not traded publicly, but the underlying assets (stocks and bonds) held in these funds are traded on active markets and the prices for these assets are readily observable. Holdings in bond investments are classified as Level 2 investments.
Federal Government Securities – Federal Government Securities consist of bills, notes, bonds, and other fixed income securities issued directly by the U.S. Treasury or by government-sponsored enterprises. These assets are valued using a bid evaluation process with bid data provided by independent pricing sources. Federal Government Securities are classified as Level 2 investments.
Bonds and Debentures – Bonds and debentures consist of fixed income securities issued by U.S. and non-U.S. corporations as well as state and local governments. These assets are valued using a bid evaluation process with bid data provided by independent pricing sources. Corporate, state, and municipal bonds and debentures are classified as Level 2 investments.
Corporate Stock – This investment category consists of common and preferred stock issued by U.S. and non-U.S. corporations. Most common shares are traded actively on exchanges and price quotes for these shares are readily available. Common stock is classified as a Level 1 investment. Preferred shares included in this category are valued using a bid evaluation process with bid data provided by independent pricing sources. Preferred stock is classified as a Level 2 investment. Venture Capital and Buyout Partnerships – This investment category is comprised of interests in limited partnerships that invest in privately-held companies. Due to the private nature of the partnership investments, pricing inputs are not readily observable. Asset valuations are developed by the general partners that manage the partnerships. These valuations are based on the application of public market multiples to private company cash flows, market transactions that provide valuation information for comparable companies, and other methods. Holdings of limited partnership interests are classified as Level 3 investments.

20
Real Estate Partnerships and Funds – Most of the real estate investments are partnership interests similar to those described in the Venture Capital and Buyout Partnerships category. This category also includes real estate investments held in less commonly used structures such as private real estate investment trusts and pooled separate accounts. Valuations for the holdings in this category are not based on readily observable inputs and are primarily derived from property appraisals. Interests in private real estate partnerships, investment funds and pooled separate accounts are classified as Level 3 investments. Common Trust and Other Funds – Common trust funds are comprised of shares or units in commingled funds that are not publicly traded. The underlying assets in these funds (U.S. stock funds, non-U.S. stock funds, commodity funds, and short term investment funds) are publicly traded on exchanges and price quotes for the assets held by these funds are readily available. Holdings of common trust funds are classified as Level 2 investments. This category also includes an investment in a limited liability company that invests in publicly-traded convertible securities. The limited liability company investment is a fund that invests in both long and short positions in convertible securities, stocks, and fixed income securities. The underlying securities held by the fund are traded actively on exchanges and price quotes for these investments are readily available. Interest in the limited liability company is classified as a Level 2 investment. Other Investments – This category includes several miscellaneous assets such as commodity hedge fund investments. These investments have valuations that are based on observable inputs and are classified as Level 2 investments. As of December 31, 2011, the pension plan assets measured at fair value on a recurring basis were as follows: Quoted Prices Significant in Active Other Significant Markets for Observable Unobservable Identical Inputs Inputs Inputs Millions (Level 1) (Level 2) (Level 3) Total Plan assets: Temporary cash investments $ 22 $ - $ - $ 22 Registered investment companies 8 280 - 288 U.S. government securities - 155 - 155 Corporate bonds and debentures - 343 - 343 Corporate stock 547 8 - 555 Venture capital and buyout partnerships - - 184 184 Real estate partnerships and funds - - 126 126 Common trust and other funds - 815 - 815 Other investments - 29 - 29
Total plan assets at fair value $ 577 $ 1,630 $ 310 2,517
Other assets [a] (12)
Total plan assets $ 2,505
[a] Other assets include accrued receivables and pending broker settlements.

21
As of December 31, 2010, the pension plan assets measured at fair value on a recurring basis were as follows: Quoted Prices Significant in Active Other Significant Markets for Observable Unobservable Identical Inputs Inputs Inputs Millions (Level 1) (Level 2) (Level 3) Total Plan assets: Temporary cash investments $ 23 $ - $ - $ 23 Registered investment companies 9 259 - 268 U.S. government securities - 142 - 142 Corporate bonds and debentures - 311 - 311 Corporate stock 573 7 - 580 Venture capital and buyout partnerships - - 169 169 Real estate partnerships and funds - - 99 99 Common trust and other funds - 776 - 776 Other investments - 29 - 29
Total plan assets at fair value $ 605 $ 1,524 $ 268 2,397
Other assets [a] 7
Total plan assets $ 2,404
[a] Other assets include accrued receivables and pending broker settlements.
For the years ended December 31, 2011 and 2010, there were no significant transfers in or out of Levels 1, 2, or 3. The following table presents a reconciliation of the beginning and ending balances of the fair value measurements using significant unobservable inputs (Level 3 investments) during 2011: Venture Capital Real Estate and Buyout Partnerships Millions Partnerships and Funds Total Beginning balance - January 1, 2011 $ 169 $ 99 $ 268 Realized gain/(loss) 8 (1) 7 Unrealized gain 13 16 29 Purchases 22 27 49 Sales (28) (15) (43)
Ending balance - December 31, 2011 $ 184 $ 126 $ 310
The following table presents a reconciliation of the beginning and ending balances of the fair value measurements using significant unobservable inputs (Level 3 investments) during 2010: Venture Capital Real Estate and Buyout Partnerships Millions Partnerships and Funds Total Beginning balance - January 1, 2010 $ 142 $ 78 $ 220 Realized gain 3 1 4 Unrealized gain 21 10 31 Purchases 18 18 36 Sales (15) (8) (23)
Ending balance - December 31, 2010 $ 169 $ 99 $ 268

22
Other Retirement Programs 401(k)/Thrift Plan – The Corporation provides a defined contribution plan (401(k)/thrift plan) to eligible non-union employees. We make matching contributions the thrift plan of 50 cents for each dollar contributed by employees up to the first six percent of compensation contributed. Our plan contributions were $13 million in 2011, $13 million in 2010 and $13 million in 2009. Railroad Retirement System – All Railroad employees are covered by the Railroad Retirement System (the System). Contributions made to the System are expensed as incurred and amounted to approximately $599 million in 2011, $565 million in 2010, and $561 million in 2009. Collective Bargaining Agreements – Under collective bargaining agreements, we participate in multi-employer benefit plans that provide certain postretirement health care and life insurance benefits for eligible union employees. Premiums paid under these plans are expensed as incurred and amounted to $66 million in 2011, $60 million in 2010, and $48 million in 2009. 6. Other Income Other income included the following for the years ended December 31: Millions 2011 2010 2009 Interest income $ 124 $ 32 $ 3 Rental income 79 83 73 Net gain on non-operating asset dispositions 43 25 162 Receivable securitization fees - - (9) Non-operating environmental costs and other (10) (39) (37)
Total $ 236 $ 101 $ 192
In June of 2009, we completed a $118 million sale of land to the Regional Transportation District (RTD) in Colorado, resulting in a $116 million pre-tax gain. The agreement with the RTD involved a 33-mile industrial lead track in Boulder, Colorado. 7. Income Taxes We are included in the consolidated income tax return of UPC. The consolidated income tax liability of UPC is allocated among the parent and its subsidiaries on the basis of the separate contributions to the consolidated income tax liability, with benefits of tax losses and credits utilized in consolidation allocated to the companies generating such losses and credits. Components of income tax expense were as follows for the years ended December 31: Millions 2011 2010 2009 Current tax expense: Federal $ 954 $ 948 $ 397 State 150 131 52
Total current tax expense 1,104 1,079 449
Deferred tax expense: Federal 839 601 648 State 62 103 27
Total deferred tax expense 901 704 675
Unrecognized tax benefits: Federal 54 25 23 State 11 (1) (1)
Total unrecognized tax benefits expense/(benefits) 65 24 22
Total income tax expense $ 2,070 $ 1,807 $ 1,146

23
For the years ended December 31, reconciliations between statutory and effective tax rates are as follows: Tax Rate Percentages 2011 2010 2009 Federal statutory tax rate 35.0 % 35.0 % 35.0 % State statutory rates, net of federal benefits 3.1 3.1 3.2 Deferred tax adjustments (0.5) 1.6 (0.7) Tax credits (0.5) (0.7) (0.8) Other 0.4 0.1 (0.4)
Effective tax rate 37.5 % 39.1 % 36.3 %
During 2010, our effective tax rate increased to 39.1% as a result of a one-time re-allocation of deferred taxes between the Corporation and us, as well as a change in traffic patterns that impacted our apportionment of income between states for income tax purposes. In February of 2011, Arizona enacted legislation that will decrease the state’s corporate tax rate. This reduced our deferred tax expense by $14 million in the first quarter of 2011. In February of 2009, California enacted legislation that changed how we determine the amount of income subject to California tax. This change reduced our 2009 deferred tax expense by $14 million. Deferred tax assets and liabilities are recorded for the expected future tax consequences of events that are reported in different periods for financial reporting and income tax purposes. The majority of our deferred tax assets relate to deductions that already have been claimed for financial reporting purposes but not for tax purposes. The majority of our deferred tax liabilities relate to differences between the tax bases and financial reporting amounts of our land and depreciable property, due to accelerated tax depreciation (including bonus depreciation), revaluation of assets in purchase accounting transactions, and differences in capitalization methods. Deferred income tax (liabilities)/assets were comprised of the following at December 31: Millions 2011 2010 Deferred income tax liabilities: Property $ (13,323) $ (12,587) Other (206) (178)
Total deferred income tax liabilities (13,529) (12,765)
Deferred income tax assets: Accrued casualty costs 259 300 Debt and leases 427 489 Retiree benefits 342 223 Credits 197 197 Other 295 250
Total deferred income tax asset $ 1,520 $ 1,459
Net deferred income tax liability $ (12,009) $ (11,306)
Current portion of deferred taxes $ 294 $ 243
Non-current portion of deferred taxes (12,303) (11,549)
Net deferred income tax liability $ (12,009) $ (11,306)
When appropriate, we record a valuation allowance against deferred tax assets to reflect that these tax assets may not be realized. In determining whether a valuation allowance is appropriate, we consider whether it is more likely than not that all or some portion of our deferred tax assets will not be realized based on management’s judgments using available evidence for purposes of estimating whether future taxable income will be sufficient to realize a deferred tax asset. In 2011 and 2010, there were no valuation allowances.

24
Tax benefits are recognized only for tax positions that are more likely than not to be sustained upon examination by tax authorities. The amount recognized is measured as the largest amount of benefit that is greater than 50 percent likely to be realized upon settlement. Unrecognized tax benefits are tax benefits claimed in our tax returns that do not meet these recognition and measurement standards. A reconciliation of changes in unrecognized tax benefits liabilities/(assets) from the beginning to the end of the reporting period is as follows: Millions 2011 2010 2009 Unrecognized tax benefits at January 1 $ 204 $ 179 $ 160 Increases for positions taken in current year 7 38 18 Increases for positions taken in prior years 78 9 50 Decreases for positions taken in prior years (31) (21) (27) Payments to and settlements with taxing authorities - (3) (4) Increases/(decreases) for interest and penalties 12 4 (13) Lapse of statutes of limitations (2) (2) (5)
Unrecognized tax benefits at December 31 $ 268 $ 204 $ 179
We recognize interest and penalties as part of income tax expense. Total accrued liabilities for interest and penalties were $37 million and $25 million at December 31, 2011 and 2010, respectively. Total interest and penalties recognized as part of income tax expense (benefit) were $12 million for 2011, $4 million for 2010, and $(10) million for 2009. Internal Revenue Service (IRS) examinations have been completed and settled for all years prior to 1999, and the statute of limitations bars any additional tax assessments. Interest calculations may remain open for years prior to 1999. In the second quarter of 2011, the IRS completed its examination and issued a notice of deficiency for tax years 2007 and 2008. The IRS has now completed its examinations and issued notices of deficiency for tax years 1999 through 2008. UPC disagrees with many of their proposed adjustments, and is at IRS Appeals for these years. Additionally, several state tax authorities are examining the Corporation’s unitary state income tax returns for years 2003 through 2008. In the third quarter of 2011, UPC reached an agreement in principle with the IRS to resolve all of the issues related to tax years 1999 through 2004, except for calculations of interest. UPC anticipates signing a closing agreement with the IRS within the next 12 months. Once formalized, this agreement should result in an immaterial reduction of income tax expense. We expect our unrecognized tax benefits to decrease significantly in the next 12 months. Of the $268 million balance at December 31, 2011, $123 million is classified as current in the Consolidated Statement of Financial Position, in anticipation of a settlement of the 1999-2004 tax years, as well as a reasonable possibility that some state tax disputes will be resolved in 2012. The portion of our unrecognized tax benefits that relates to permanent changes in tax and interest would reduce our effective tax rate, if recognized. The remaining unrecognized tax benefits relate to tax positions for which only the timing of the benefit is uncertain. Recognition of the tax benefits with uncertain timing would reduce our effective tax rate only through a reduction of accrued interest and penalties. The unrecognized tax benefits that would reduce our effective tax rate are as follows: Millions 2011 2010 2009 Unrecognized tax benefits that would reduce the effective tax rate $ 105 $ 94 $ 92 Unrecognized tax benefits that would not reduce the effective tax rate 163 110 87
Total unrecognized tax benefits $ 268 $ 204 $ 179
8. Capital Stock and Dividend Restrictions Our Board of Directors has restricted the availability of retained earnings for payment of dividends by $131 million. This represents (a) the amount by which the estimated fair value of our investment in certain subsidiaries, as determined by our Board of Directors, exceeded the net book value of such investment that was transferred to the Corporation by means of a dividend in June 1971 ($110 million) and (b) the

25
amount by which the fair market value exceeded the book value of certain investment securities that were transferred to the Corporation by means of a dividend in November 1972 ($21 million). Our capital structure consists of Class A Stock, Common Stock, and Mandatorily Redeemable Preference Shares (Series A). The Class A Stock is entitled to a cash dividend whenever a dividend is declared on the Common Stock, in an amount which equals 8 percent of the sum of the dividends on both the Class A Stock and the Common Stock. All of our Common Stock and our Class A Stock, which constitutes all of the voting capital stock, is owned by the Corporation or a wholly-owned subsidiary of the Corporation, and all of the Mandatorily Redeemable Preference Shares, which are non-voting stock, are owned by the Federal Railroad Administration. Accordingly, there is no market for our capital stock. The number of shares shown in the Statements of Changes in Common Shareholders’ Equity in the Consolidated Financial Statements, excludes 2,665 shares of Common Stock and 232 shares of Class A Stock owned by Southern Pacific Rail Corporation, whose results are included in the Consolidated Financial Statements. 9. Comprehensive Income/(Loss) Comprehensive income/(loss) was as follows: Millions 2011 2010 2009
Net income $ 3,447 $ 2,814 $ 2,009
Other comprehensive income/(loss):
Defined benefit plans (301) (88) 44
Foreign currency translation (20) 7 6 Derivatives 1 1 -
Total other comprehensive income/(loss) [a] (320) (80) 50
Total comprehensive income $ 3,127 $ 2,734 $ 2,059
[a] Net of deferred taxes of $199 million, $57 million, and $(101) million during 2011, 2010, and 2009, respectively.
The after-tax components of accumulated other comprehensive loss were as follows: Dec. 31, Dec. 31, Millions 2011 2010 Defined benefit plans $ (1,004) $ (703) Foreign currency translation (48) (28) Derivatives (2) (3)
Total $ (1,054) $ (734)
10. Accounts Receivable Accounts receivable includes freight and other receivables reduced by an allowance for doubtful accounts. The allowance is based upon historical losses, credit worthiness of customers, and current economic conditions. At December 31, 2011 and 2010, our accounts receivable were reduced by $9 million and $5 million, respectively. Receivables not expected to be collected in one year and the associated allowances are classified as other assets in our Consolidated Statements of Financial Position. At December 31, 2011 and 2010, receivables classified as other assets were reduced by allowances of $41 million and $51 million, respectively.

26
Receivables Securitization Facility – On January 1, 2010, we adopted Accounting Standards Update No. 2009-16, Accounting for Transfers of Financial Assets (ASU 2009-16). ASU 2009-16 limits the circumstances in which transferred financial assets can be derecognized and requires enhanced disclosures regarding transfers of financial assets and a transferor’s continuing involvement with transferred financial assets. As a result, we no longer account for the value of the outstanding undivided interest held by investors under our receivables securitization facility as a sale. In addition, transfers of receivables occurring on or after January 1, 2010, are reflected as debt issued in our Consolidated Statements of Cash Flows and recognized as debt due after one year in our Consolidated Statements of Financial Position. Under the receivables securitization facility, we sell most of its accounts receivable to Union Pacific Receivables, Inc. (UPRI), a bankruptcy-remote subsidiary. UPRI may subsequently transfer, without recourse on a 364-day revolving basis, an undivided interest in eligible accounts receivable to investors. The total capacity to transfer undivided interests to investors under the facility was $600 million at December 31, 2011 and 2010, respectively. The value of the outstanding undivided interest held by investors under the facility was $100 million at both December 31, 2011 and 2010. The value of the undivided interest held by investors was supported by $1.1 billion and $960 million of accounts receivable at December 31, 2011 and 2010, respectively. At December 31, 2011 and 2010, the value of the interest retained by UPRI was $1.1 billion and $960 million, respectively. This retained interest is included in accounts receivable, net in our Consolidated Statements of Financial Position. The value of the outstanding undivided interest held by investors could fluctuate based upon the availability of eligible receivables and is directly affected by changing business volumes and credit risks, including default and dilution. If default or dilution ratios increase one percent, the value of the outstanding undivided interest held by investors would not change as of December 31, 2011. Should UPC’s credit rating fall below investment grade, the value of the outstanding undivided interest held by investors would be reduced, and, in certain cases, the investors would have the right to discontinue the facility. We collected approximately $18.8 billion and $16.3 billion of receivables during the years ended December 31, 2011 and 2010, respectively. UPRI used certain of these proceeds to purchase new receivables under the facility. The costs of the receivables securitization facility include interest, which will vary based on prevailing commercial paper rates, program fees paid to banks, commercial paper issuing costs, and fees for unused commitment availability. The costs of the receivables securitization facility are included in interest expense and were $4 million and $6 million for 2011 and 2010, respectively. Prior to adoption of the new accounting standard, the costs of the receivables securitization facility were included in other income and were $9 million for 2009. The investors have no recourse to our other assets, except for customary warranty and indemnity claims. Our creditors do not have recourse to the assets of UPRI. In August 2011, the receivables securitization facility was renewed for an additional 364-day period at comparable terms and conditions.

27
11. Properties The following tables list the major categories of property and equipment, as well as the weighted-average composite depreciation rate for each category: Millions, Except Percentages Accumulated Net Book Depreciation As of December 31, 2011 Cost Depreciation Value Rate for 2011
Land $ 5,095 $ N/A $ 5,095 N/A
Road: Rail and other track material [a] 12,461 4,592 7,869 3.3% Ties 7,987 2,028 5,959 2.9% Ballast 4,178 1,008 3,170 3.0% Other [b] 14,118 2,502 11,616 2.6%
Total road 38,744 10,130 28,614 2.9%
Equipment: Locomotives 6,502 3,003 3,499 5.7% Freight cars 1,957 1,061 896 3.5% Work equipment and other 529 57 472 6.5%
Total equipment 8,988 4,121 4,867 5.3%
Technology and other 597 252 345 12.4% Construction in progress 1,004 - 1,004 N/A
Total $ 54,428 $ 14,503 $ 39,925 N/A
Millions, Except Percentages Accumulated Net Book Depreciation As of December 31, 2010 Cost Depreciation Value Rate for 2010
Land $ 4,981 $ N/A $ 4,981 N/A
Road: Rail and other track material [a] 11,992 4,458 7,534 3.1% Ties 7,631 1,858 5,773 2.8% Ballast 4,011 944 3,067 3.0% Other [b] 13,634 2,376 11,258 2.5%
Total road 37,268 9,636 27,632 2.8%
Equipment: Locomotives 6,136 2,699 3,437 5.6% Freight cars 1,886 1,040 846 3.6% Work equipment and other 305 39 266 4.0%
Total equipment 8,327 3,778 4,549 5.1%
Technology and other 551 236 315 13.5% Construction in progress 764 - 764 N/A
Total $ 51,891 $ 13,650 $ 38,241 N/A
[a] Includes a weighted-average composite depreciation rate for rail in high-density traffic corridors as discussed below.
[b] Other includes grading, bridges and tunnels, signals, buildings, and other road assets.
Property and Depreciation – Our railroad operations are highly capital intensive, and our large base of homogeneous, network-type assets turns over on a continuous basis. Each year we develop a capital program for the replacement of assets and for the acquisition or construction of assets that enable us to enhance our operations or provide new service offerings to customers. Assets purchased or constructed throughout the year are capitalized if they meet applicable minimum units of property criteria. Properties and equipment are carried at cost and are depreciated on a straight-line basis over their estimated service lives, which are measured in years, except for rail in high-density traffic corridors (i.e., all rail lines except for those subject to abandonment, yard and switching tracks, and electronic yards) for which lives are measured in millions of gross tons per mile of track. We use the group method of depreciation in

28
which all items with similar characteristics, use, and expected lives are grouped together in asset classes, and are depreciated using composite depreciation rates. The group method of depreciation treats each asset class as a pool of resources, not as singular items. We currently have more than 60 depreciable asset classes, and we may increase or decrease the number of asset classes due to changes in technology, asset strategies, or other factors. We determine the estimated service lives of depreciable railroad assets by means of depreciation studies. We perform depreciation studies at least every three years for equipment and every six years for track assets (i.e., rail and other track material, ties, and ballast) and other road property. Our depreciation studies take into account the following factors:
Statistical analysis of historical patterns of use and retirements of each of our asset classes; Evaluation of any expected changes in current operations and the outlook for continued use of
the assets; Evaluation of technological advances and changes to maintenance practices; and Expected salvage to be received upon retirement.
For rail in high-density traffic corridors, we measure estimated service lives in millions of gross tons per mile of track. It has been our experience that the lives of rail in high-density traffic corridors are closely correlated to usage (i.e., the amount of weight carried over the rail). The service lives also vary based on rail weight, rail condition (e.g., new or secondhand), and rail type (e.g., straight or curve). Our depreciation studies for rail in high density traffic corridors consider each of these factors in determining the estimated service lives. For rail in high-density traffic corridors, we calculate depreciation rates annually by dividing the number of gross ton-miles carried over the rail (i.e., the weight of loaded and empty freight cars, locomotives and maintenance of way equipment transported over the rail) by the estimated service lives of the rail measured in millions of gross tons per mile. For all other depreciable assets, we compute depreciation based on the estimated service lives of our assets as determined from the analysis of our depreciation studies. Changes in the estimated service lives of our assets and their related depreciation rates are implemented prospectively. Under group depreciation, the historical cost (net of salvage) of depreciable property that is retired or replaced in the ordinary course of business is charged to accumulated depreciation and no gain or loss is recognized. The historical cost of certain track assets is estimated using (i) inflation indices published by the Bureau of Labor Statistics and (ii) the estimated useful lives of the assets as determined by our depreciation studies. The indices were selected because they closely correlate with the major costs of the properties comprising the applicable track asset classes. Because of the number of estimates inherent in the depreciation and retirement processes and because it is impossible to precisely estimate each of these variables until a group of property is completely retired, we continually monitor the estimated service lives of our assets and the accumulated depreciation associated with each asset class to ensure our depreciation rates are appropriate. In addition, we determine if the recorded amount of accumulated depreciation is deficient (or in excess) of the amount indicated by our depreciation studies. Any deficiency (or excess) is amortized as a component of depreciation expense over the remaining service lives of the applicable classes of assets. For retirements of depreciable railroad properties that do not occur in the normal course of business, a gain or loss may be recognized if the retirement meets each of the following three conditions: (i) is unusual, (ii) is material in amount, and (iii) varies significantly from the retirement profile identified through our depreciation studies. A gain or loss is recognized in other income when we sell land or dispose of assets that are not part of our railroad operations. When we purchase an asset, we capitalize all costs necessary to make the asset ready for its intended use. However, many of our assets are self-constructed. A large portion of our capital expenditures is for replacement of existing track assets and other road properties, which is typically performed by our employees, and for track line expansion and other capacity projects. Costs that are directly attributable to capital projects (including overhead costs) are capitalized. Direct costs that are capitalized as part of self-constructed assets include material, labor, and work equipment. Indirect costs are capitalized if they clearly relate to the construction of the asset.
General and administrative expenditures are expensed as incurred. Normal repairs and maintenance, including rail grinding, are also expensed as incurred, while costs incurred that extend the useful life of an asset, improve the safety of our operations or improve operating efficiency are capitalized. These costs

29
are allocated using appropriate statistical bases. Total expense for repairs and maintenance incurred was $2.2 billion for 2011, $2.0 billion for 2010, and $1.9 billion for 2009. Assets held under capital leases are recorded at the lower of the net present value of the minimum lease payments or the fair value of the leased asset at the inception of the lease. Amortization expense is computed using the straight-line method over the shorter of the estimated useful lives of the assets or the period of the related lease. 12. Accounts Payable and Other Current Liabilities Dec. 31, Dec. 31, Millions 2011 2010 Accounts payable $ 814 $ 669 Income and other taxes 615 406 Accrued wages and vacation 361 355 Accrued casualty costs 196 261 Equipment rents payable 90 86 Interest payable 59 59 Other 561 487
Total accounts payable and other current liabilities $ 2,696 $ 2,323
13. Transactions with Affiliates At December 31, 2011, we had a $132 million working capital deficit. At December 31, 2010, we had a $35 million working capital surplus. Our working capital relates to UPC’s management of our cash position. As part of UPC’s cash management activities, we advance excess cash (cash available after satisfying all of our obligations and paying dividends to UPC) to UPC. We declare and pay dividends to UPC that typically approximate the dividends UPC declares to its shareholders; however, there is no formal requirement to do so. The dividend declaration between us and UPC is determined solely by our Board of Directors. To the extent we require additional cash for use in our operations, UPC makes such funds available to us for borrowing. We treat these transactions as intercompany borrowings in the Consolidated Statements of Financial Position. The majority of our intercompany borrowings from UPC relate to the acquisitions of the Chicago and North Western Transportation Company and Southern Pacific Rail Corporation that were funded by UPC on our behalf. We assumed these acquisition costs in the form of intercompany borrowings from UPC. In December of 2008, UPC established a borrowing limit based on our borrowing capacity and UPC implemented a market based interest rate. Currently, the annual rate is 4.6%. The annual rate was 4.7% from July 2010 through June 2011, 6.4% from July 2009 through June 2010, and 5.8% from December 2008 through June 2009. Interest accrues quarterly and is payable on demand. We do not expect to be required by UPC to pay back the intercompany borrowings within the next 12 months. Intercompany borrowings are unsecured and rank equally with all of our other unsecured indebtedness. Pursuant to a services agreement, UPC provides us with various services, including strategic planning, legal, treasury, accounting, auditing, insurance, human resources, and corporate affairs. We pay our share of the costs as determined by an independent review. Billings for these services were $70 million, $71 million, and $53 million for the years ended December 31, 2011, 2010, and 2009, respectively. 14. Financial Instruments Strategy and Risk – We may use derivative financial instruments in limited instances for other than trading purposes to assist in managing our overall exposure to fluctuations in interest rates and fuel prices. We are not a party to leveraged derivatives and, by policy, do not use derivative financial instruments for speculative purposes. Derivative financial instruments qualifying for hedge accounting must maintain a specified level of effectiveness between the hedging instrument and the item being hedged, both at inception and throughout the hedged period. We formally document the nature and relationships between the hedging instruments and hedged items at inception, as well as our risk-management objectives, strategies for undertaking the various hedge transactions, and method of assessing hedge effectiveness. Changes in the fair market value of derivative financial instruments that

30
do not qualify for hedge accounting are charged to earnings. We may use swaps, collars, futures, and/or forward contracts to mitigate the risk of adverse movements in interest rates and fuel prices; however, the use of these derivative financial instruments may limit future benefits from favorable interest rate and fuel price movements. Market and Credit Risk – We address market risk related to derivative financial instruments by selecting instruments with value fluctuations that highly correlate with the underlying hedged item. We manage credit risk related to derivative financial instruments, which is minimal, by requiring high credit standards for counterparties and periodic settlements. At December 31, 2011 and 2010, we were not required to provide collateral, nor had we received collateral, relating to our hedging activities. Determination of Fair Value – We determine the fair values of our derivative financial instrument positions based upon current fair values as quoted by recognized dealers or the present value of expected future cash flows. Interest Rate Cash Flow Hedges – We report changes in the fair value of cash flow hedges in accumulated other comprehensive loss until the hedged item affects earnings. At December 31, 2011 and 2010, we recorded reductions of $2 million and $3 million, respectively, as an accumulated other comprehensive loss that is being amortized on a straight-line basis through September 30, 2014. As of December 31, 2011 and 2010, we had no interest rate cash flow hedges outstanding. Fair Value of Financial Instruments – The fair value of our short- and long-term debt was estimated using quoted market prices, where available, or current borrowing rates. At December 31, 2011, the fair value of total debt was $2.7 billion, approximately $490 million more than the carrying value. At December 31, 2010, the fair value of total debt was $2.6 billion, approximately $344 million more than the carrying value. At December 31, 2011 and 2010, approximately $163 million and $164 million, respectively, of fixed-rate debt securities contained call provisions that allow us to retire the debt instruments prior to final maturity, with the payment of fixed call premiums, or in certain cases, at par. The fair value of our cash equivalents approximates their carrying value due to the short-term maturities of these instruments. 15. Debt Total debt as of December 31, 2011 and 2010, net of interest rate swaps designated as fair value hedges, is summarized below: Millions 2011 2010 Capitalized leases, 4.0% to 9.3% due through 2028 $ 1,874 $ 1,909 Intercompany borrowings from UPC, 4.6% 945 2,608 Equipment obligations, 6.2% to 8.1% due through 2031 147 183 Notes and debentures, 3.0% to 5.0% due through 2054 111 112 Receivables securitization facility (Note 10) 100 100 Mortgage bonds, 4.8% due through 2030 58 58 Tax-exempt financings, 5.0% due through 2014 19 23 Unamortized discount (85) (81)
Total debt 3,169 4,912
Less: current portion (209) (229)
Total long-term debt $ 2,960 $ 4,683

31
Debt Maturities – The following table presents aggregate debt maturities as of December 31, 2011, excluding market value adjustments: Millions 2012 $ 309 2013 186 2014 199 2015 217 2016 206 Thereafter 1,107
Total debt $ 2,224
As of both December 31, 2011 and December 31, 2010, we have reclassified as long-term debt approximately $100 million of debt due within one year that we intend to refinance. This reclassification reflects our ability and intent to refinance any short-term borrowings and certain current maturities of long-term debt on a long-term basis. Mortgaged Properties – Equipment with a carrying value of approximately $2.9 billion and $3.2 billion at December 31, 2011 and 2010, respectively, served as collateral for capital leases and other types of equipment obligations in accordance with the secured financing arrangements utilized to acquire such railroad equipment. As a result of the merger of Missouri Pacific Railroad Company (MPRR) with and into the Company on January 1, 1997, and pursuant to the underlying indentures for the MPRR mortgage bonds, we must maintain the same value of assets after the merger in order to comply with the security requirements of the mortgage bonds. As of the merger date, the value of the MPRR assets that secured the mortgage bonds was approximately $6.0 billion. In accordance with the terms of the indentures, this collateral value must be maintained during the entire term of the mortgage bonds irrespective of the outstanding balance of such bonds. Bonds and Debentures – We have certain debt instruments that contain provisions that limit the payment of interest, require sinking fund installments, and impose certain restrictions in the event that all interest is not paid based upon available income levels. Some of these debt instruments also contain provisions that may impose restrictions on our ability to declare dividends on certain classes of capital stock. (See further discussion of dividend restrictions in Note 8). Receivables Securitization Facility – As of December 31, 2011 and 2010, we have recorded $100 million as secured debt under our receivables securitization facility. (See further discussion of our receivables securitization facility in Note 10). 16. Variable Interest Entities We have entered into various lease transactions in which the structure of the leases contain variable interest entities (VIEs). These VIEs were created solely for the purpose of doing lease transactions (principally involving railroad equipment and facilities, including our headquarters building) and have no other activities, assets or liabilities outside of the lease transactions. Within these lease arrangements, we have the right to purchase some or all of the assets at fixed prices. Depending on market conditions, fixed-price purchase options available in the leases could potentially provide benefits to us; however, these benefits are not expected to be significant. We maintain and operate the assets based on contractual obligations within the lease arrangements, which set specific guidelines consistent within the railroad industry. As such, we have no control over activities that could materially impact the fair value of the leased assets. We do not hold the power to direct the activities of the VIEs and, therefore, do not control the ongoing activities that have a significant impact on the economic performance of the VIEs. Additionally, we do not have the obligation to absorb losses of the VIEs or the right to receive benefits of the VIEs that could potentially be significant to the VIEs.

32
We are not considered to be the primary beneficiary and do not consolidate these VIEs because our actions and decisions do not have the most significant effect on the VIE’s performance and our fixed-price purchase price options are not considered to be potentially significant to the VIE’s. The future minimum lease payments associated with the VIE leases totaled $3.9 billion as of December 31, 2011. 17. Leases We lease certain locomotives, freight cars, and other property. The Consolidated Statement of Financial Position as of December 31, 2011 and 2010 included $2,458 million, net of $915 million of accumulated depreciation, and $2,520 million, net of $901 million of accumulated depreciation, respectively, for properties held under capital leases. A charge to income resulting from the depreciation for assets held under capital leases is included within depreciation expense in our Consolidated Statements of Income. Future minimum lease payments for operating and capital leases with initial or remaining non-cancelable lease terms in excess of one year as of December 31, 2011, were as follows:
Millions Operating
LeasesCapital Leases
2012 $ 523 $ 297 2013 488 269 2014 414 276 2015 371 276 2016 346 262 Later years 2,380 1,179
Total minimum lease payments $ 4,522 $ 2,559
Amount representing interest N/A (685)
Present value of minimum lease payments N/A $ 1,874
The majority of capital lease payments relate to locomotives. Rent expense for operating leases with terms exceeding one month was $635 million in 2011, $622 million in 2010, and $684 million in 2009. When cash rental payments are not made on a straight-line basis, we recognize variable rental expense on a straight-line basis over the lease term. Contingent rentals and sub-rentals are not significant. 18. Commitments and Contingencies Asserted and Unasserted Claims – Various claims and lawsuits are pending against us and certain of our subsidiaries. We cannot fully determine the effect of all asserted and unasserted claims on our consolidated results of operations, financial condition, or liquidity; however, to the extent possible, where asserted and unasserted claims are considered probable and where such claims can be reasonably estimated, we have recorded a liability. We do not expect that any known lawsuits, claims, environmental costs, commitments, contingent liabilities, or guarantees will have a material adverse effect on our consolidated results of operations, financial condition, or liquidity after taking into account liabilities and insurance recoveries previously recorded for these matters. Personal Injury – The cost of personal injuries to employees and others related to our activities is charged to expense based on estimates of the ultimate cost and number of incidents each year. We use an actuarial analysis to measure the expense and liability, including unasserted claims. The Federal Employers’ Liability Act (FELA) governs compensation for work-related accidents. Under FELA, damages are assessed based on a finding of fault through litigation or out-of-court settlements. We offer a comprehensive variety of services and rehabilitation programs for employees who are injured at work. Our personal injury liability is discounted to present value using applicable U.S. Treasury rates. Approximately 89% of the recorded liability related to asserted claims, and approximately 11% related to unasserted claims at December 31, 2011. Because of the uncertainty surrounding the ultimate outcome of personal injury claims, it is reasonably possible that future costs to settle these claims may range from approximately $368 million to $404 million. We record an accrual at the low end of the range as no amount of loss is more probable than any other. Estimates can vary over time due to evolving trends in litigation.

33
Our personal injury liability activity was as follows: Millions 2011 2010 2009 Beginning balance $ 425 $ 544 $ 620 Current year accruals 118 155 174 Changes in estimates for prior years (71) (101) (95) Payments (105) (173) (155)
Ending balance at December 31 $ 367 $ 425 $ 544
Current portion, ending balance at December 31 $ 103 $ 139 $ 157
Asbestos – We are a defendant in a number of lawsuits in which current and former employees and other parties allege exposure to asbestos. We assess our potential liability using a statistical analysis of resolution costs for asbestos-related claims. This liability is updated annually and excludes future defense and processing costs. The liability for resolving both asserted and unasserted claims was based on the following assumptions:
The ratio of future claims by alleged disease would be consistent with historical averages adjusted for inflation.
The number of claims filed against us will decline each year. The average settlement values for asserted and unasserted claims will be equivalent to historical
averages. The percentage of claims dismissed in the future will be equivalent to historical averages.
Our liability for asbestos-related claims is not discounted to present value due to the uncertainty surrounding the timing of future payments. Approximately 21% of the recorded liability related to asserted claims and approximately 79% related to unasserted claims at December 31, 2011. Because of the uncertainty surrounding the ultimate outcome of asbestos-related claims, it is reasonably possible that future costs to settle these claims may range from approximately $147 million to $159 million. We record an accrual at the low end of the range as no amount of loss is more probable than any other. In conjunction with the liability update performed in 2010, we also reassessed estimated insurance recoveries. We have recognized an asset for estimated insurance recoveries at December 31, 2011 and 2010. Our asbestos-related liability activity was as follows: Millions 2011 2010 2009 Beginning balance $ 162 $ 174 $ 213 Accruals/(credits) (5) (1) (25) Payments (10) (11) (14)
Ending balance at December 31 $ 147 $ 162 $ 174
Current portion, ending balance at December 31 $ 8 $ 12 $ 13
We have insurance coverage for a portion of the costs incurred to resolve asbestos-related claims, and we have recognized an asset for estimated insurance recoveries at December 31, 2011 and 2010. We believe that our estimates of liability for asbestos-related claims and insurance recoveries are reasonable and probable. The amounts recorded for asbestos-related liabilities and related insurance recoveries were based on currently known facts. However, future events, such as the number of new claims filed each year, average settlement costs, and insurance coverage issues, could cause the actual costs and insurance recoveries to be higher or lower than the projected amounts. Estimates also may vary in the future if strategies, activities, and outcomes of asbestos litigation materially change; federal and state laws governing asbestos litigation increase or decrease the probability or amount of compensation of claimants; and there are material changes with respect to payments made to claimants by other defendants.

34
Environmental Costs – We are subject to federal, state, and local environmental laws and regulations. We have identified 285 sites at which we are or may be liable for remediation costs associated with alleged contamination or for violations of environmental requirements. This includes 32 sites that are the subject of actions taken by the U.S. government, 17 of which are currently on the Superfund National Priorities List. Certain federal legislation imposes joint and several liability for the remediation of identified sites; consequently, our ultimate environmental liability may include costs relating to activities of other parties, in addition to costs relating to our own activities at each site. When we identify an environmental issue with respect to property owned, leased, or otherwise used in our business, we perform, with assistance of our consultants, environmental assessments on the property. We expense the cost of the assessments as incurred. We accrue the cost of remediation where our obligation is probable and such costs can be reasonably estimated. We do not discount our environmental liabilities when the timing of the anticipated cash payments is not fixed or readily determinable. At December 31, 2011, less than 1% of our environmental liability was discounted at 2.0%, while approximately 5% of our environmental liability was discounted at 2.8% at December 31, 2010. Our environmental liability activity was as follows: Millions 2011 [a] 2010 2009 Beginning balance $ 213 $ 217 $ 209 Accruals 29 57 49 Payments (70) (61) (41)
Ending balance at December 31 $ 172 $ 213 $ 217
Current portion, ending balance at December 31 $ 50 $ 74 $ 82
[a] Payments include $25 million to resolve the Omaha Lead Site liability.
The environmental liability includes future costs for remediation and restoration of sites, as well as ongoing monitoring costs, but excludes any anticipated recoveries from third parties. Cost estimates are based on information available for each site, financial viability of other potentially responsible parties, and existing technology, laws, and regulations. The ultimate liability for remediation is difficult to determine because of the number of potentially responsible parties, site-specific cost sharing arrangements with other potentially responsible parties, the degree of contamination by various wastes, the scarcity and quality of volumetric data related to many of the sites, and the speculative nature of remediation costs. Estimates of liability may vary over time due to changes in federal, state, and local laws governing environmental remediation. Current obligations are not expected to have a material adverse effect on our consolidated results of operations, financial condition, or liquidity. Guarantees – At December 31, 2011, we were contingently liable for $317 million in guarantees. We have recorded a liability of $3 million for the fair value of these obligations as of December 31, 2011 and 2010. We entered into these contingent guarantees in the normal course of business, and they include guaranteed obligations related to our headquarters building, equipment financings, and affiliated operations. The final guarantee expires in 2022. We are not aware of any existing event of default that would require us to satisfy these guarantees. We do not expect that these guarantees will have a material adverse effect on our consolidated financial condition, results of operations, or liquidity. Indemnities – Our maximum potential exposure under indemnification arrangements, including certain tax indemnifications, can range from a specified dollar amount to an unlimited amount, depending on the nature of the transactions and the agreements. Due to uncertainty as to whether claims will be made or how they will be resolved, we cannot reasonably determine the probability of an adverse claim or reasonably estimate any adverse liability or the total maximum exposure under these indemnification arrangements. We do not have any reason to believe that we will be required to make any material payments under these indemnity provisions. Gain Contingency – UPRR and Santa Fe Pacific Pipelines (SFPP, a subsidiary of Kinder Morgan Energy Partners, L.P.) currently are engaged in a proceeding to resolve the fair market rent payable to UPRR under a 10-year agreement commencing on January 1, 2004 for pipeline easements on UPRR rights-of-way (Union Pacific Railroad Company vs. Santa Fe Pacific Pipelines, Inc., SFPP, L.P., Kinder Morgan Operating L.P. “D” Kinder Morgan G.P., Inc., et al., Superior Court of the State of California for the County of Los Angeles, filed July 28, 2004). In February 2007, a trial began to resolve this issue, and,

35
on September 28, 2011, the judge issued a tentative Statement of Decision, which concluded that SFPP may owe back rent to UPRR for the years 2004 through 2011. SFPP has filed objections to the Statement of Decision. UPRR filed a motion for an entry of judgment, which is scheduled for hearing on or about February 3, 2012, along with post-judgment motions on interest and attorneys fees. A favorable final judgment may materially affect our results of operations in the period of any monetary recoveries; however, due to the uncertainty regarding the amount and timing of any recovery, we consider this a gain contingency and no amounts are reflected in the Consolidated Financial Statements as of December 31, 2011.