Embed Size (px)
Citation preview
UNION PACIFIC CORPORATIONOCTOBER 24, 2013Alex Johansson, Dan Kleeman & Qianwen Wu
Agenda
Introduction Macroeconomic Outlook Industry Overview Company Overview Earnings Report Financial Analysis Valuation Recommendation
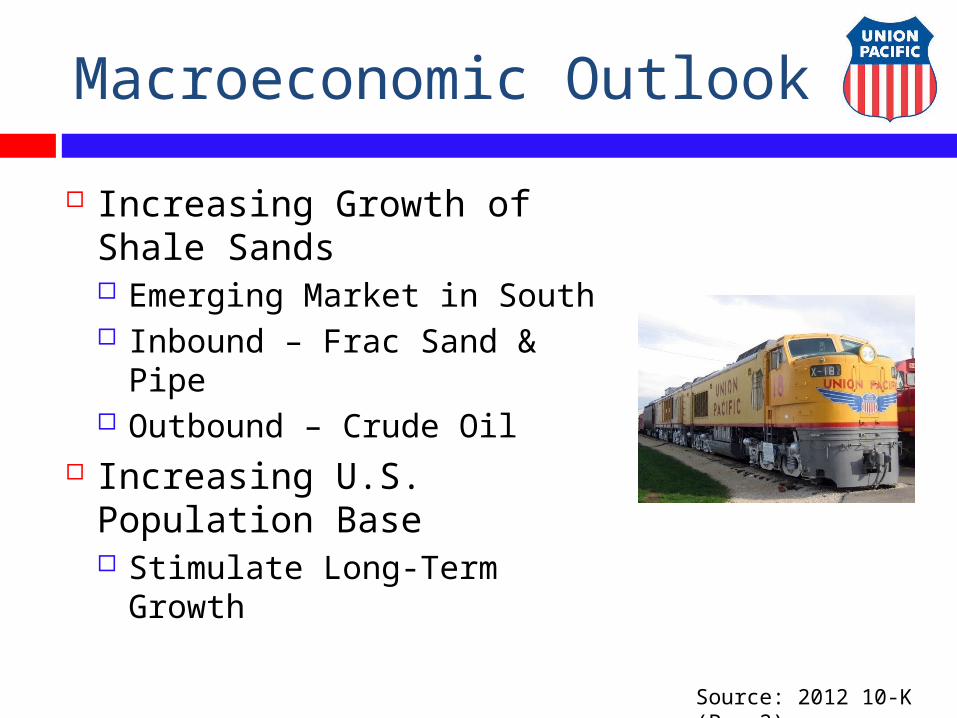
Macroeconomic Outlook
Increasing Growth of Shale Sands Emerging Market in South Inbound – Frac Sand &
Pipe Outbound – Crude Oil
Increasing U.S. Population Base Stimulate Long-Term
Growth
Source: 2012 10-K (Pg. 2)
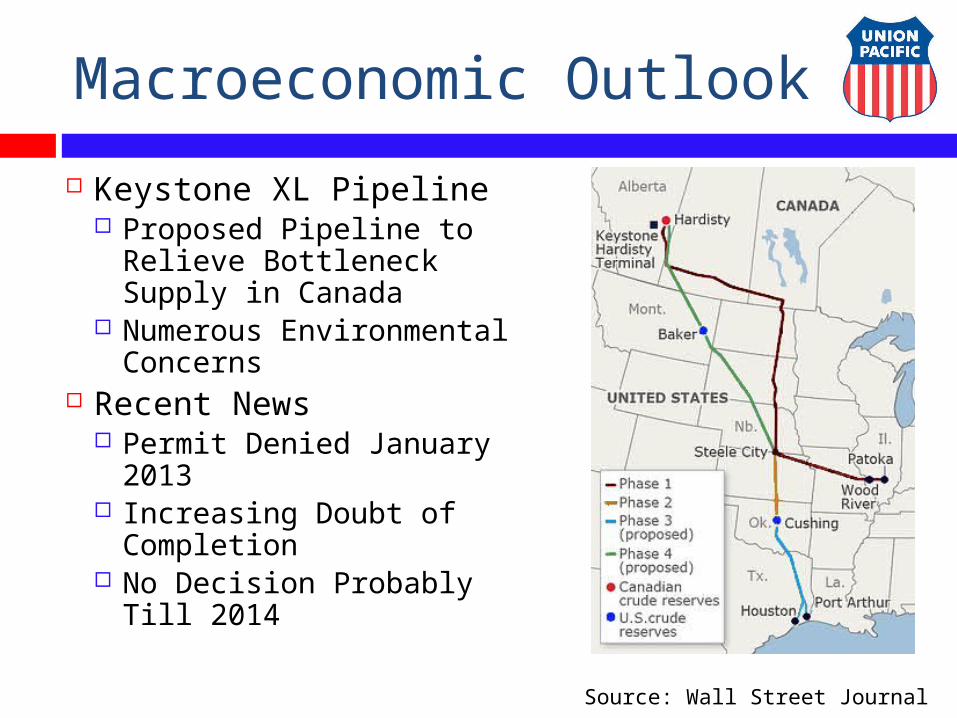
Macroeconomic Outlook
Keystone XL Pipeline Proposed Pipeline to
Relieve Bottleneck Supply in Canada
Numerous Environmental Concerns
Recent News Permit Denied January
2013 Increasing Doubt of
Completion No Decision Probably Till
2014
Source: Wall Street Journal
Macroeconomic Outlook
Industry Catalysts Automotive
Largest Automotive Carrier West of the Mississippi
Chemical – Shale Commodity Group Emerging Market – Offsets Decreased Coal
GrowthCoal
Coal Made Up 20% of 2012 Revenues Decreased Growth Domestically – EPA &
President Obama Proposals Indirect Growth Relationship w/Natural Gas Prices Decreased Growth In Imports To China We Proposed Minimal Growth In Our Model
Source: Wall Street Journal, 2012 10-K (Pg. 5 &23)
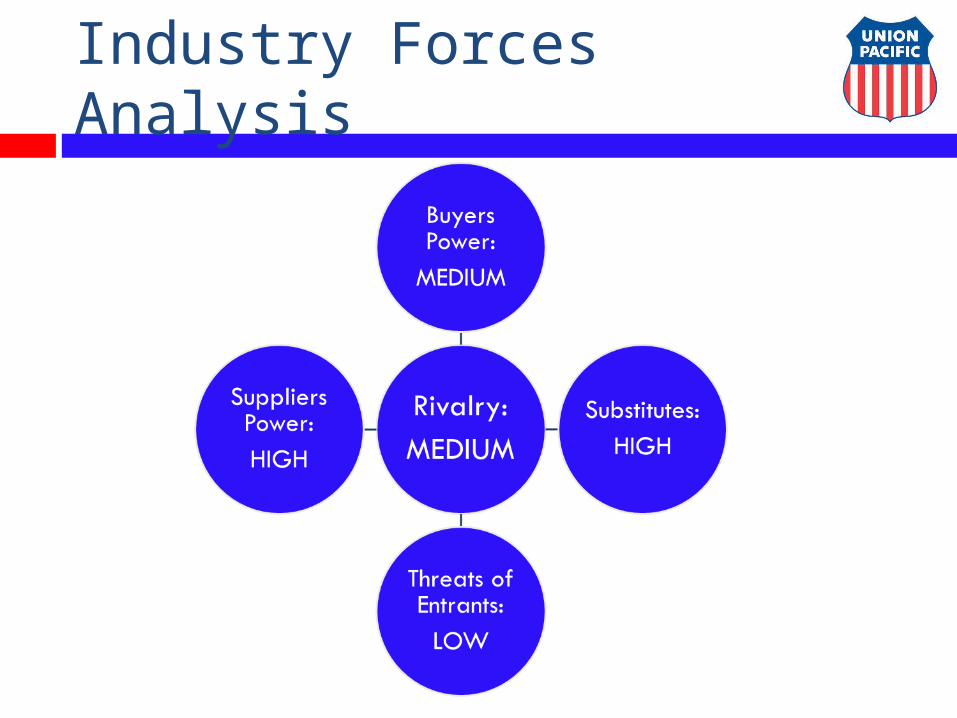
Industry Forces Analysis
Industry Forces Analysis
Threat of Substitutes: High Other Alternatives Include Transportation Via:
River Barge, Trucking & Pipeline (Keystone XL)
Bargaining Power of Buyers: Medium Few Competitors Many Alternatives
Threat of New Entrants: Low Very Capital Intensive High Barriers of
Entrance Geographic specificity
Industry Forces Analysis
Bargaining Power of Suppliers: High Very Little Pricing Power Over Fuel Few Suppliers of Trains and Rail Supplies
Switching Cost May Be High
Rivalry among Competitors: Medium Limited Amount of Competitors Specific to Service & Geographic Region
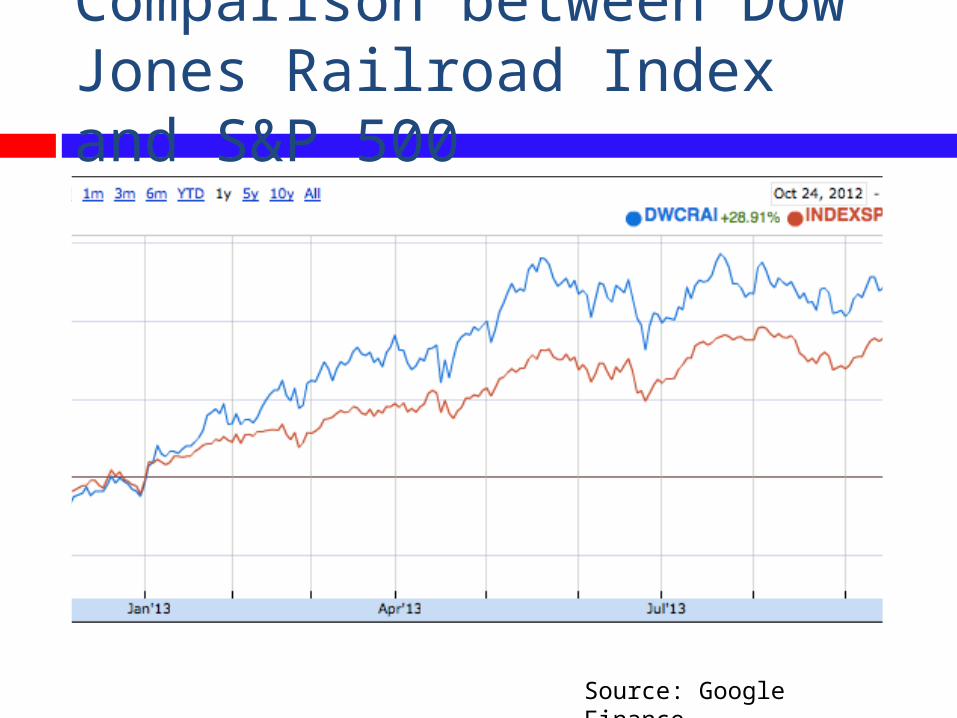
Comparison between Dow Jones Railroad Index and S&P 500
Source: Google Finance
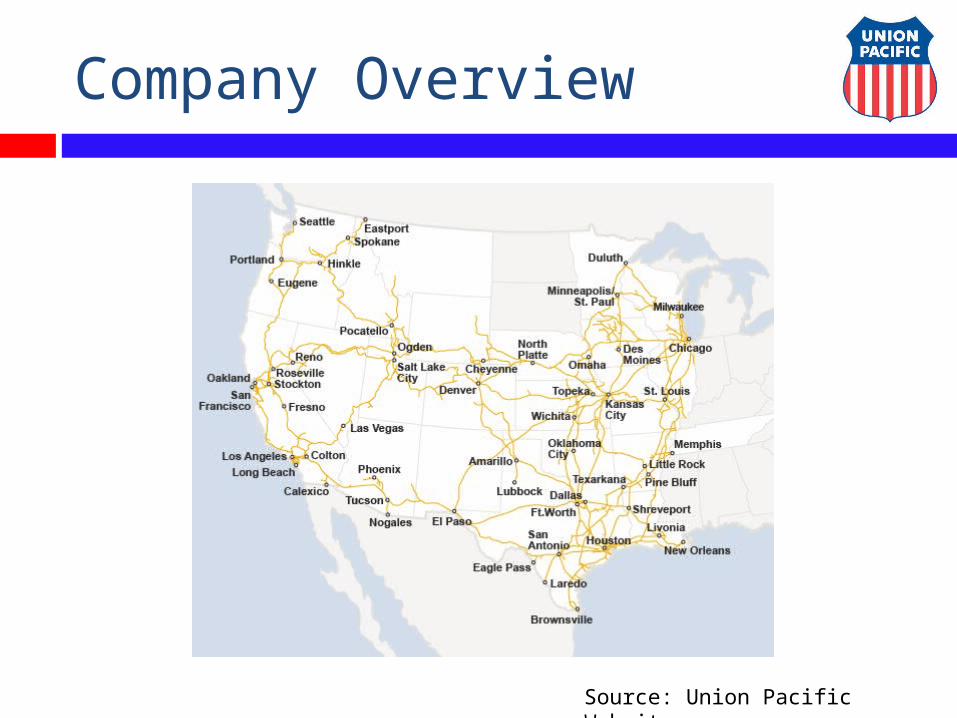
Company Overview
Source: Union Pacific Website
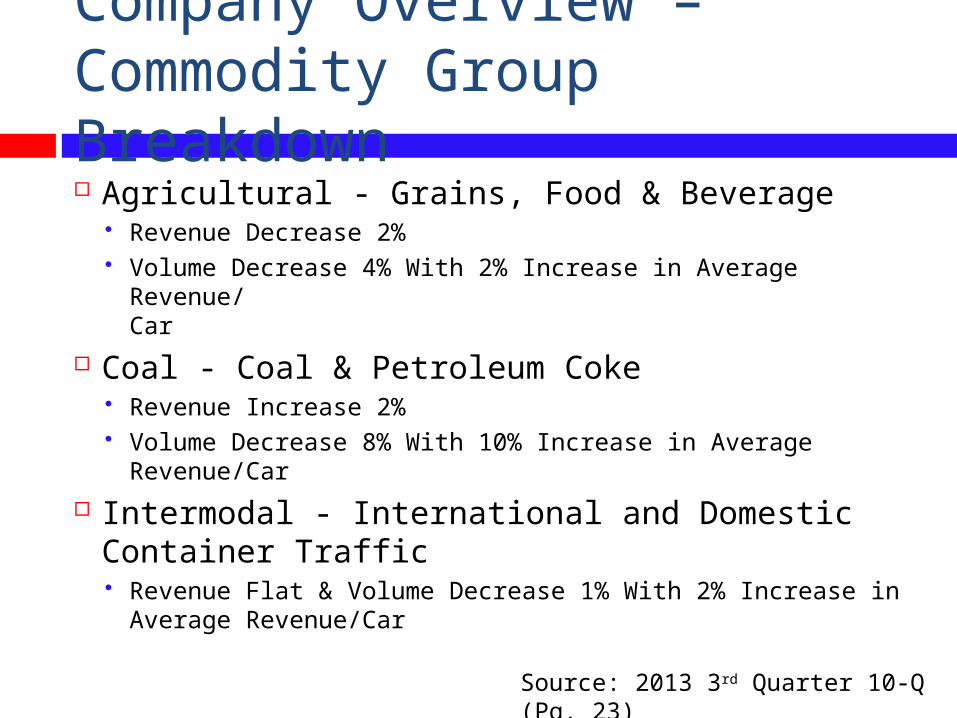
Company Overview – Commodity Group Breakdown Agricultural - Grains, Food & Beverage
Revenue Decrease 2% Volume Decrease 4% With 2% Increase in Average Revenue/
Car
Coal - Coal & Petroleum Coke Revenue Increase 2% Volume Decrease 8% With 10% Increase in Average
Revenue/Car
Intermodal - International and Domestic Container Traffic Revenue Flat & Volume Decrease 1% With 2% Increase in
Average Revenue/Car
Source: 2013 3rd Quarter 10-Q (Pg. 23)
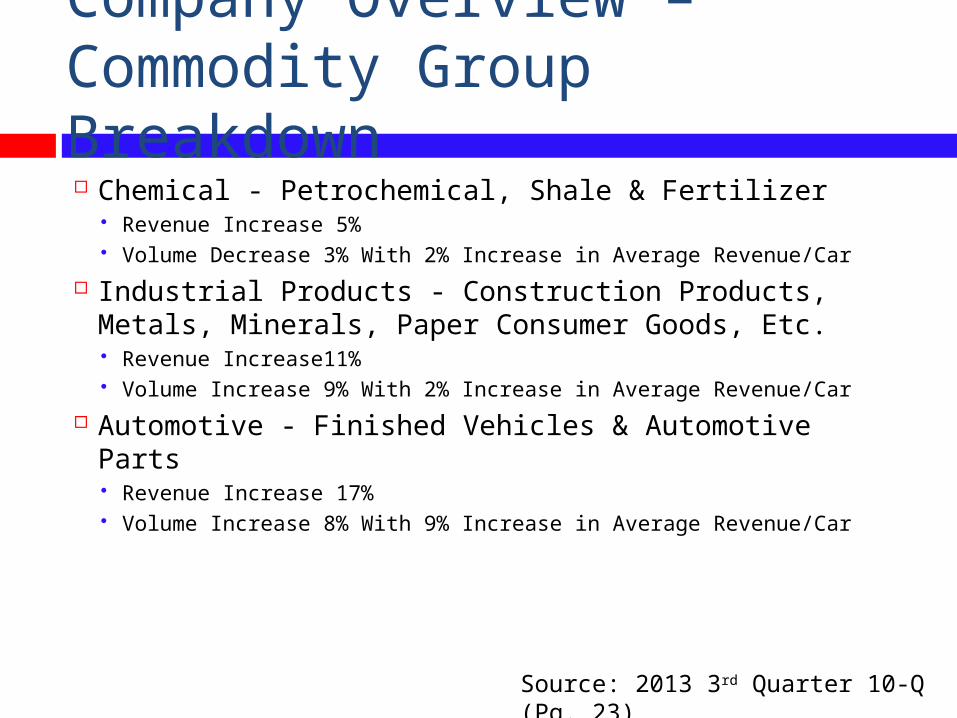
Company Overview – Commodity Group Breakdown Chemical - Petrochemical, Shale & Fertilizer
Revenue Increase 5% Volume Decrease 3% With 2% Increase in Average Revenue/Car
Industrial Products - Construction Products, Metals, Minerals, Paper Consumer Goods, Etc. Revenue Increase11% Volume Increase 9% With 2% Increase in Average Revenue/Car
Automotive - Finished Vehicles & Automotive Parts Revenue Increase 17% Volume Increase 8% With 9% Increase in Average Revenue/Car
Source: 2013 3rd Quarter 10-Q (Pg. 23)

Company Overview – Revenue Breakdown 9 Months Ended September 2013
% of Revenue 2013
% of Revenue 2012
Agricultural 15% 17%
Automotive 10% 9%
Chemicals 17% 16%
Coal 19% 20%
Industrial Products
19% 18%
Intermodal 20% 20%
Source: 2012 10-K (Pg. 5), 2013 10-Q (Pg. 8)
Business Risk Analysis
Source: Union Pacific 2012 10-K (Pg. 6 & 11)
Seasonality Agricultural Product (Harvesting Seasons) and
Intermodal (Peaks During 4th Quarter Holiday Season) Competition
Other Railroads, Motor Carriers, Ship and Barge Operators and XL Keystone Pipeline
Fluctuation of Fuel Cost Minimal Pricing Power - Fuel Surcharge vs. Busines
Key Suppliers 2 Suppliers For Horsepower Locomotive & Rail
Purchases
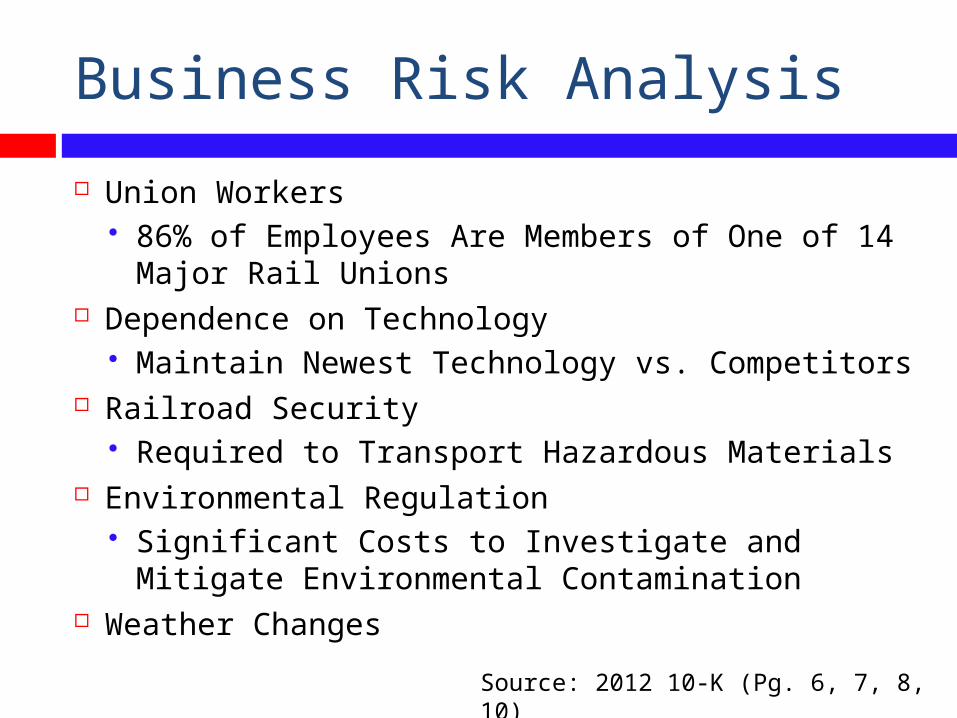
Business Risk Analysis
Union Workers 86% of Employees Are Members of One of 14
Major Rail Unions Dependence on Technology
Maintain Newest Technology vs. Competitors Railroad Security
Required to Transport Hazardous Materials Environmental Regulation
Significant Costs to Investigate and Mitigate Environmental Contamination
Weather ChangesSource: 2012 10-K (Pg. 6, 7, 8, 10)
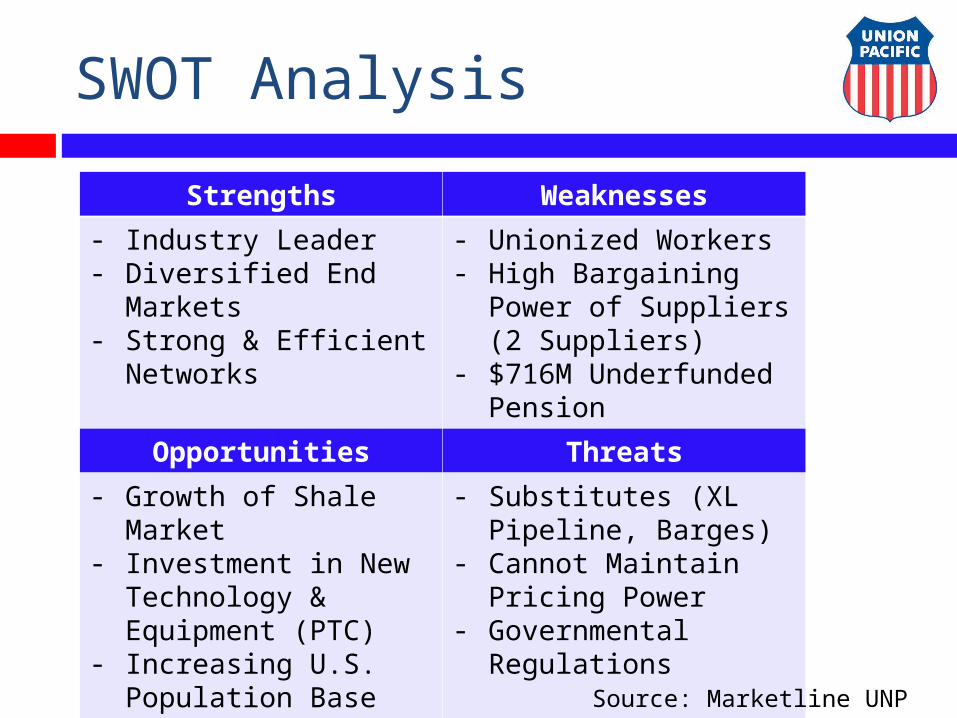
SWOT Analysis
Strengths Weaknesses
- Industry Leader- Diversified End
Markets- Strong & Efficient
Networks
- Unionized Workers- High Bargaining
Power of Suppliers (2 Suppliers)
- $716M Underfunded Pension
Opportunities Threats
- Growth of Shale Market
- Investment in New Technology & Equipment (PTC)
- Increasing U.S. Population Base (Long-Term)
- Substitutes (XL Pipeline, Barges)
- Cannot Maintain Pricing Power
- Governmental Regulations
Source: Marketline UNP Report
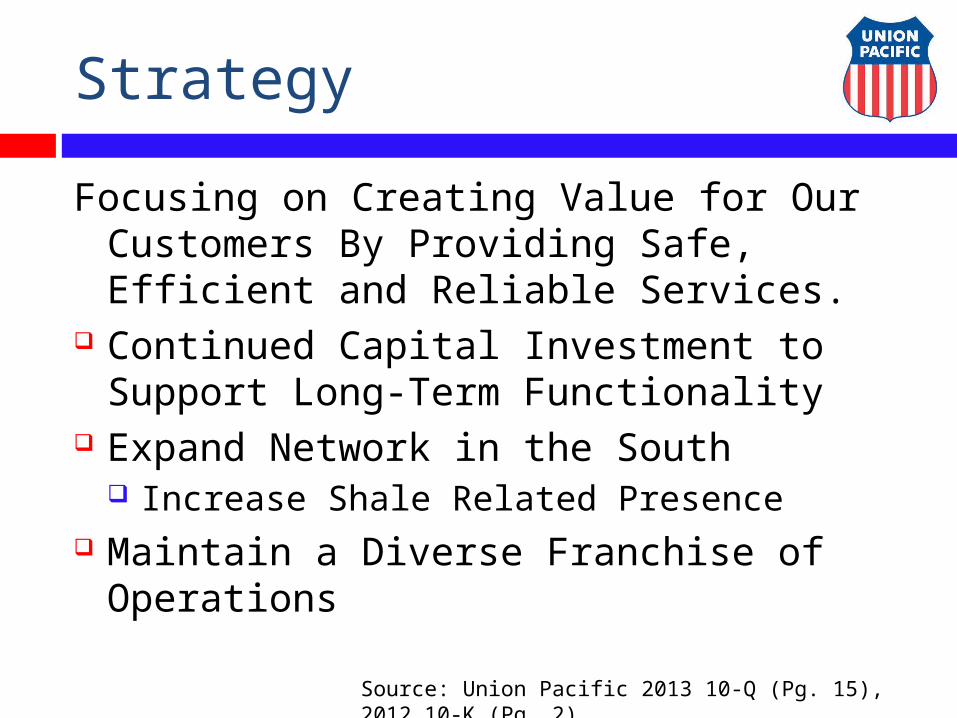
Strategy
Focusing on Creating Value for Our Customers By Providing Safe, Efficient and Reliable Services.
Continued Capital Investment to Support Long-Term Functionality
Expand Network in the South Increase Shale Related Presence
Maintain a Diverse Franchise of Operations
Source: Union Pacific 2013 10-Q (Pg. 15), 2012 10-K (Pg. 2)
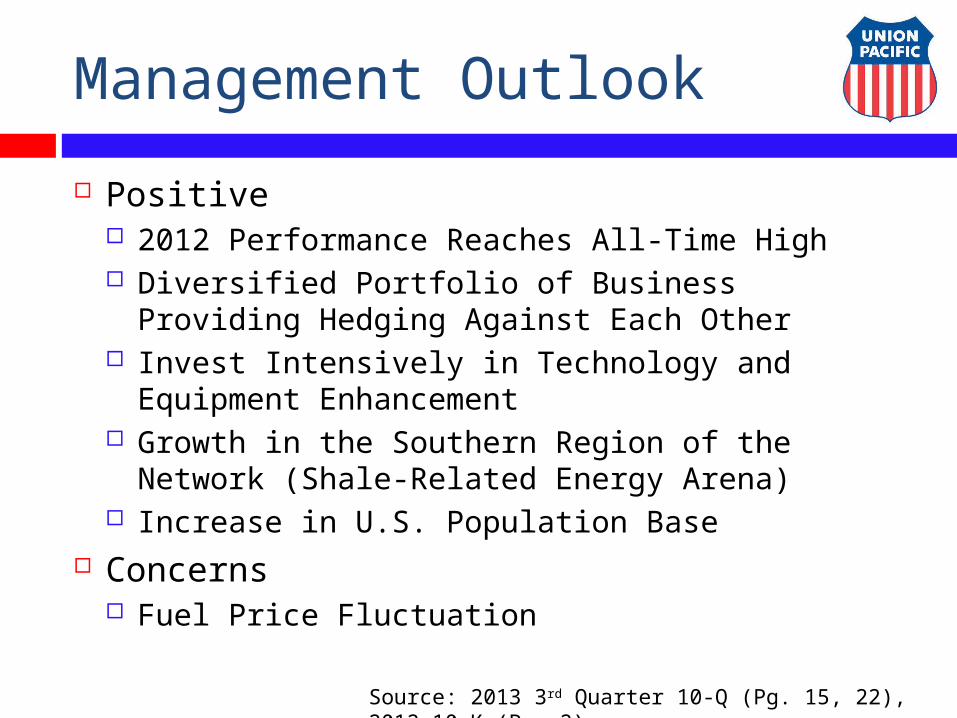
Management Outlook
Positive 2012 Performance Reaches All-Time High Diversified Portfolio of Business Providing
Hedging Against Each Other Invest Intensively in Technology and Equipment
Enhancement Growth in the Southern Region of the Network
(Shale-Related Energy Arena) Increase in U.S. Population Base
Concerns Fuel Price Fluctuation
Source: 2013 3rd Quarter 10-Q (Pg. 15, 22), 2012 10-K (Pg. 2)
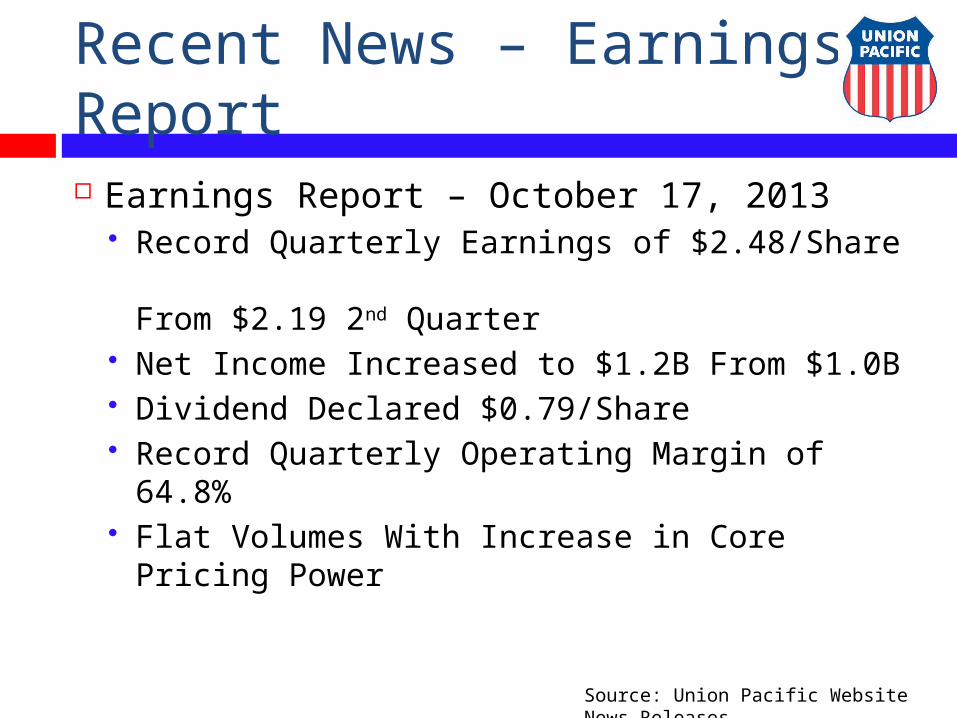
Recent News – Earnings Report Earnings Report – October 17, 2013
Record Quarterly Earnings of $2.48/Share From $2.19 2nd Quarter
Net Income Increased to $1.2B From $1.0B Dividend Declared $0.79/Share Record Quarterly Operating Margin of
64.8% Flat Volumes With Increase in Core Pricing
Power
Source: Union Pacific Website News Releases
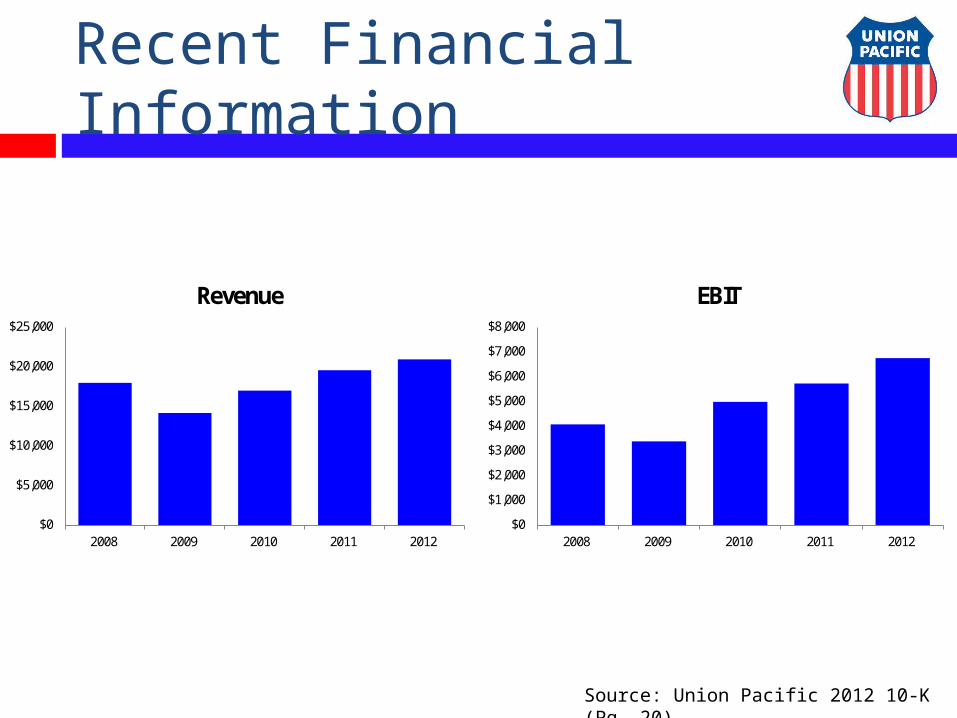
Recent Financial Information
Source: Union Pacific 2012 10-K (Pg. 20)
$0
$5,000
$10,000
$15,000
$20,000
$25,000
2008 2009 2010 2011 2012
Revenue
$0
$1,000
$2,000
$3,000
$4,000
$5,000
$6,000
$7,000
$8,000
2008 2009 2010 2011 2012
EBIT
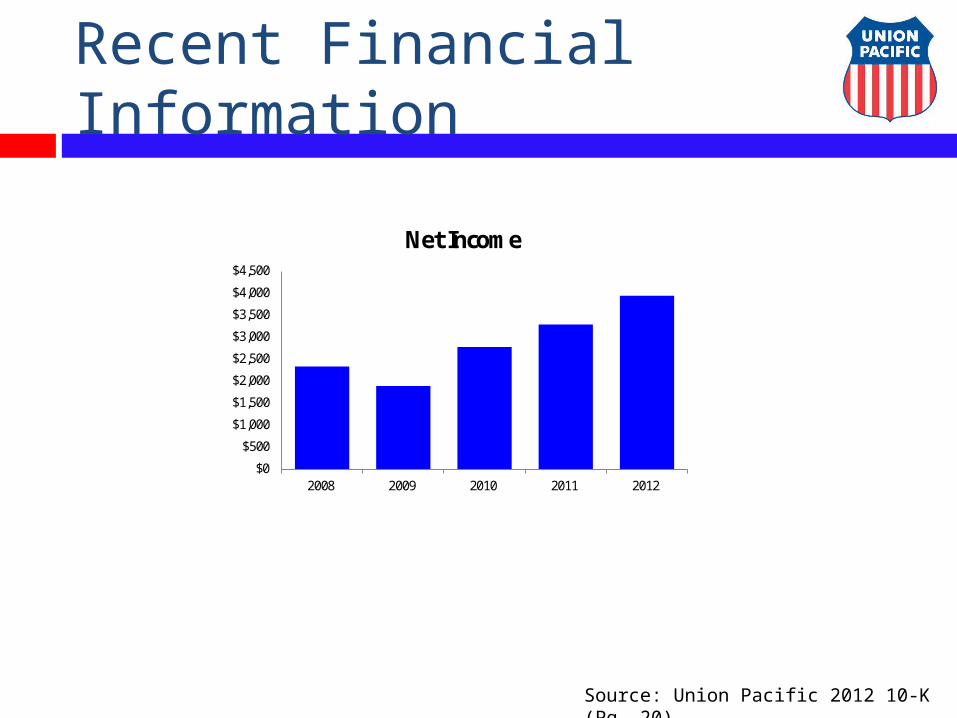
Recent Financial Information
$0
$500
$1,000
$1,500
$2,000
$2,500
$3,000
$3,500
$4,000
$4,500
2008 2009 2010 2011 2012
Net Income
Source: Union Pacific 2012 10-K (Pg. 20)
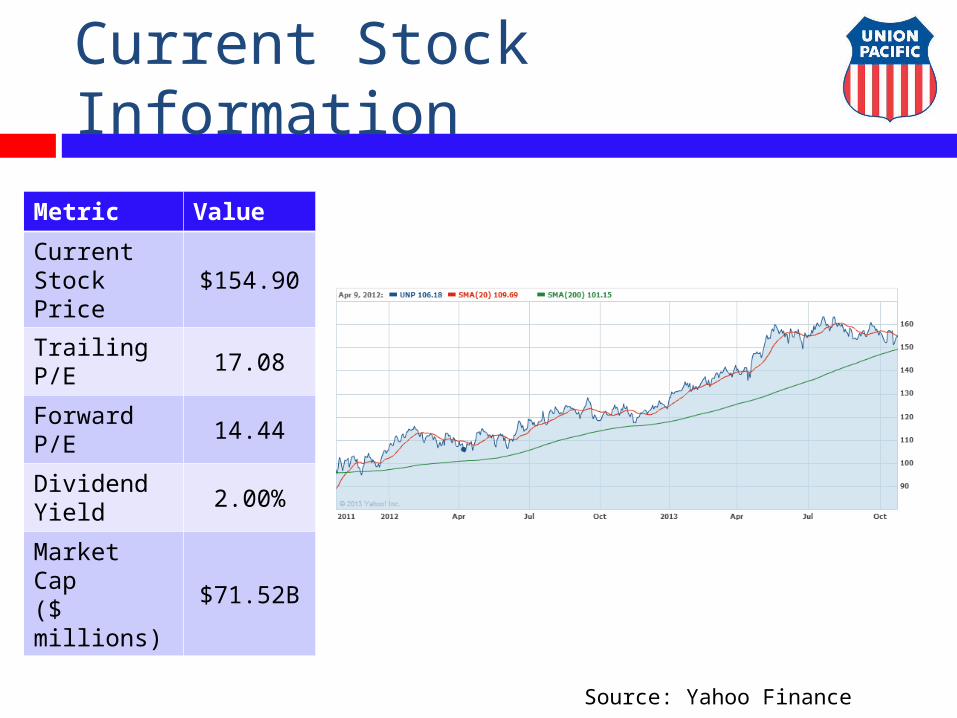
Current Stock Information
Source: Yahoo Finance
Metric Value
Current Stock Price $154.90
Trailing P/E17.08
Forward P/E 14.44
Dividend Yield 2.00%
Market Cap($ millions) $71.52B
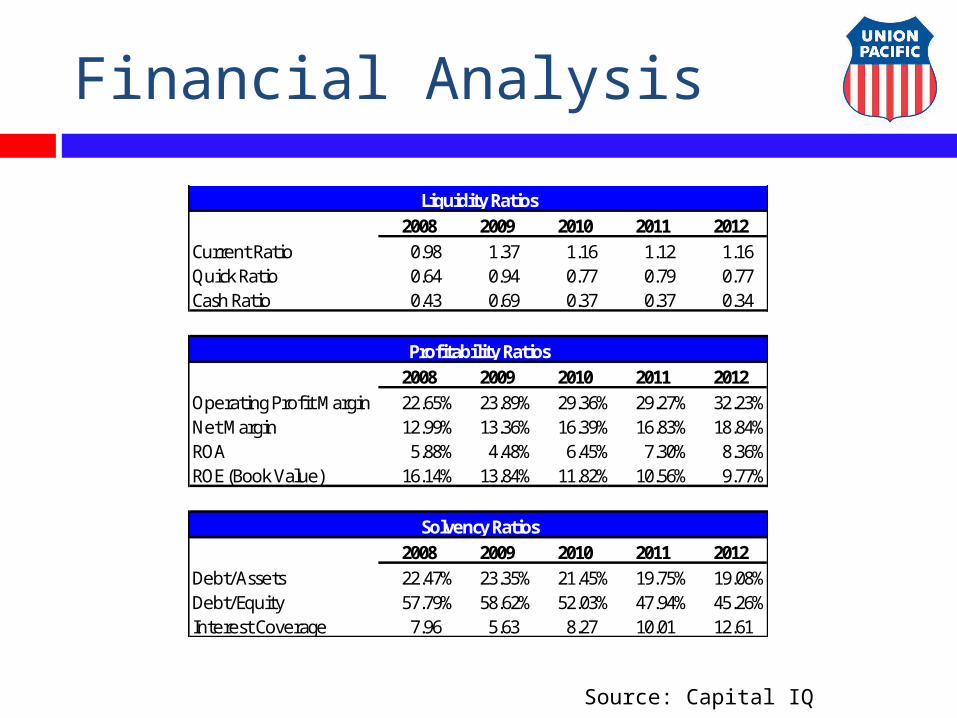
Financial Analysis
2008 2009 2010 2011 2012Current Ratio 0.98 1.37 1.16 1.12 1.16Quick Ratio 0.64 0.94 0.77 0.79 0.77Cash Ratio 0.43 0.69 0.37 0.37 0.34
2008 2009 2010 2011 2012Operating Profit Margin 22.65% 23.89% 29.36% 29.27% 32.23%Net Margin 12.99% 13.36% 16.39% 16.83% 18.84%ROA 5.88% 4.48% 6.45% 7.30% 8.36%ROE (Book Value) 16.14% 13.84% 11.82% 10.56% 9.77%
2008 2009 2010 2011 2012Debt/Assets 22.47% 23.35% 21.45% 19.75% 19.08%Debt/Equity 57.79% 58.62% 52.03% 47.94% 45.26%Interest Coverage 7.96 5.63 8.27 10.01 12.61
Profitability Ratios
Solvency Ratios
Liquidity Ratios
Source: Capital IQ
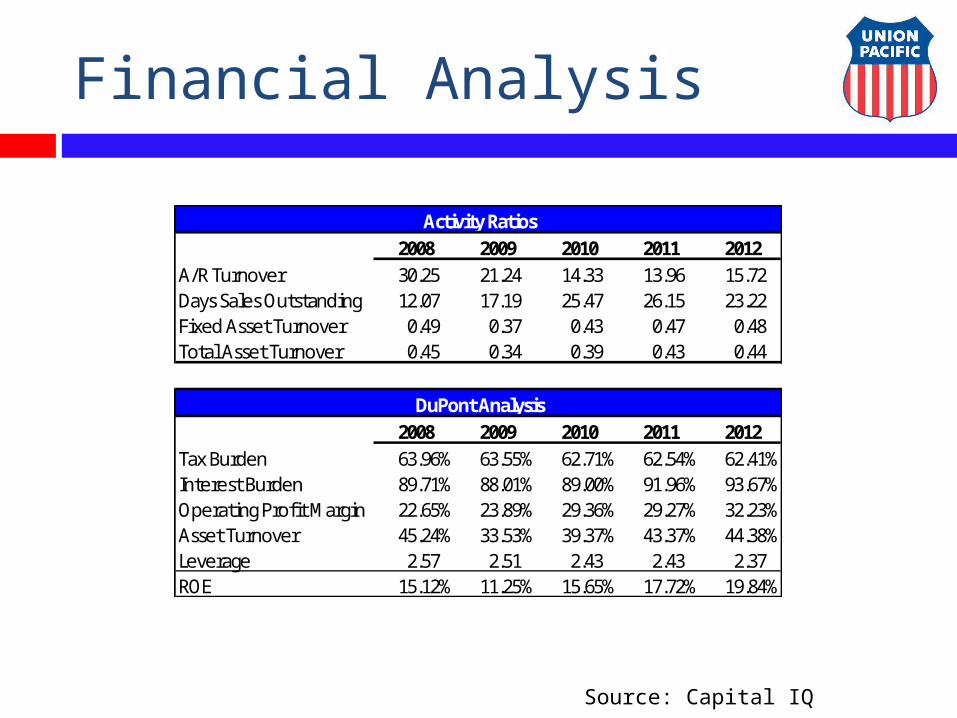
Financial Analysis
2008 2009 2010 2011 2012A/R Turnover 30.25 21.24 14.33 13.96 15.72Days Sales Outstanding 12.07 17.19 25.47 26.15 23.22Fixed Asset Turnover 0.49 0.37 0.43 0.47 0.48Total Asset Turnover 0.45 0.34 0.39 0.43 0.44
2008 2009 2010 2011 2012Tax Burden 63.96% 63.55% 62.71% 62.54% 62.41%Interest Burden 89.71% 88.01% 89.00% 91.96% 93.67%Operating Profit Margin 22.65% 23.89% 29.36% 29.27% 32.23%Asset Turnover 45.24% 33.53% 39.37% 43.37% 44.38%Leverage 2.57 2.51 2.43 2.43 2.37ROE 15.12% 11.25% 15.65% 17.72% 19.84%
Activity Ratios
DuPont Analysis
Source: Capital IQ
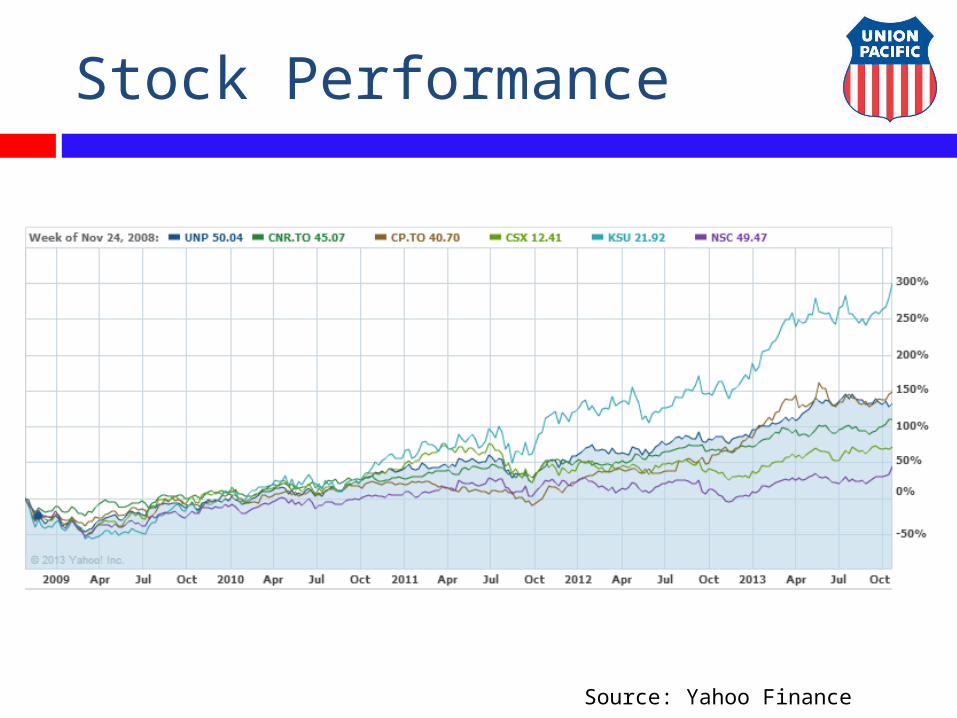
Stock Performance
Source: Yahoo Finance
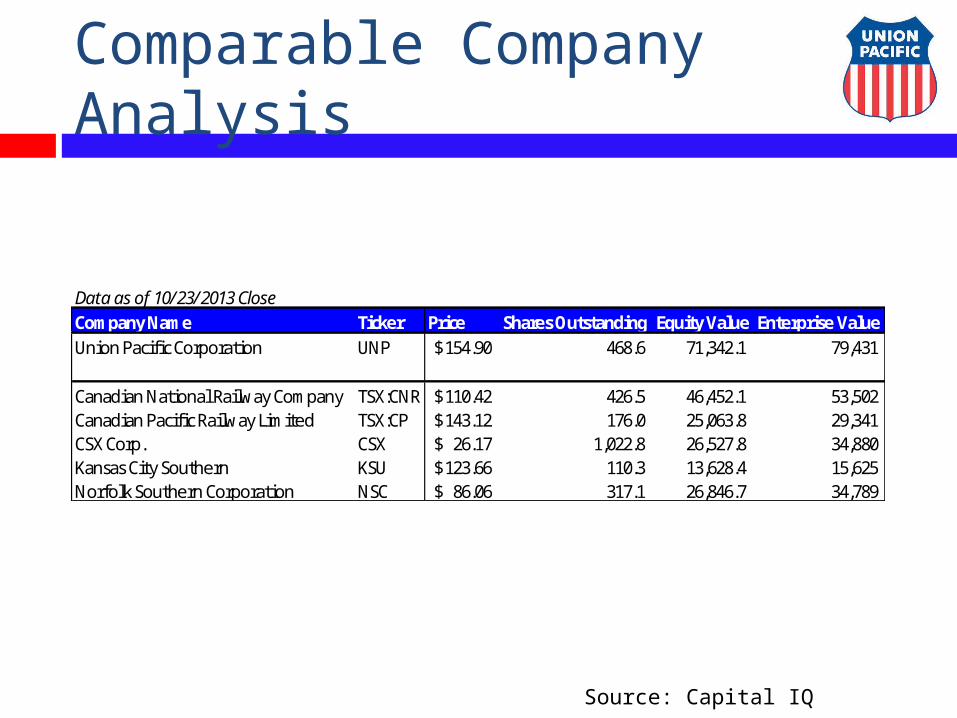
Comparable Company Analysis
Source: Capital IQ
Data as of 10/23/2013 CloseCompany Name Ticker Price Shares Outstanding Equity Value Enterprise ValueUnion Pacific Corporation UNP 154.90$ 468.6 71,342.1 79,431
Canadian National Railway Company TSX:CNR 110.42$ 426.5 46,452.1 53,502 Canadian Pacific Railway Limited TSX:CP 143.12$ 176.0 25,063.8 29,341 CSX Corp. CSX 26.17$ 1,022.8 26,527.8 34,880 Kansas City Southern KSU 123.66$ 110.3 13,628.4 15,625 Norfolk Southern Corporation NSC 86.06$ 317.1 26,846.7 34,789
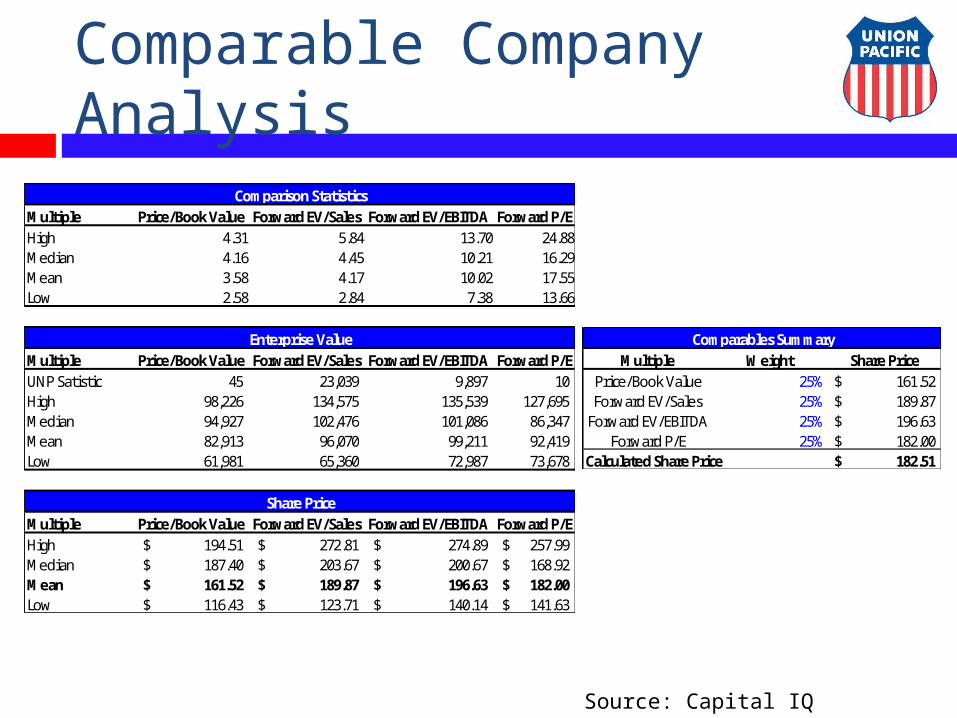
Comparable Company Analysis
Source: Capital IQ
Multiple Price/Book Value Forward EV/Sales Forward EV/EBITDA Forward P/EHigh 4.31 5.84 13.70 24.88Median 4.16 4.45 10.21 16.29Mean 3.58 4.17 10.02 17.55Low 2.58 2.84 7.38 13.66
Multiple Price/Book Value Forward EV/Sales Forward EV/EBITDA Forward P/EUNP Satistic 45 23,039 9,897 10 High 98,226 134,575 135,539 127,695 Median 94,927 102,476 101,086 86,347 Mean 82,913 96,070 99,211 92,419 Low 61,981 65,360 72,987 73,678
Multiple Price/Book Value Forward EV/Sales Forward EV/EBITDA Forward P/EHigh 194.51$ 272.81$ 274.89$ 257.99$ Median 187.40$ 203.67$ 200.67$ 168.92$ Mean 161.52$ 189.87$ 196.63$ 182.00$ Low 116.43$ 123.71$ 140.14$ 141.63$
Comparison Statistics
Enterprise Value
Share Price
Multiple Weight Share PricePrice/Book Value 25% 161.52$ Forward EV/Sales 25% 189.87$
Forward EV/EBITDA 25% 196.63$ Forward P/E 25% 182.00$
Calculated Share Price 182.51$
Comparables Summary
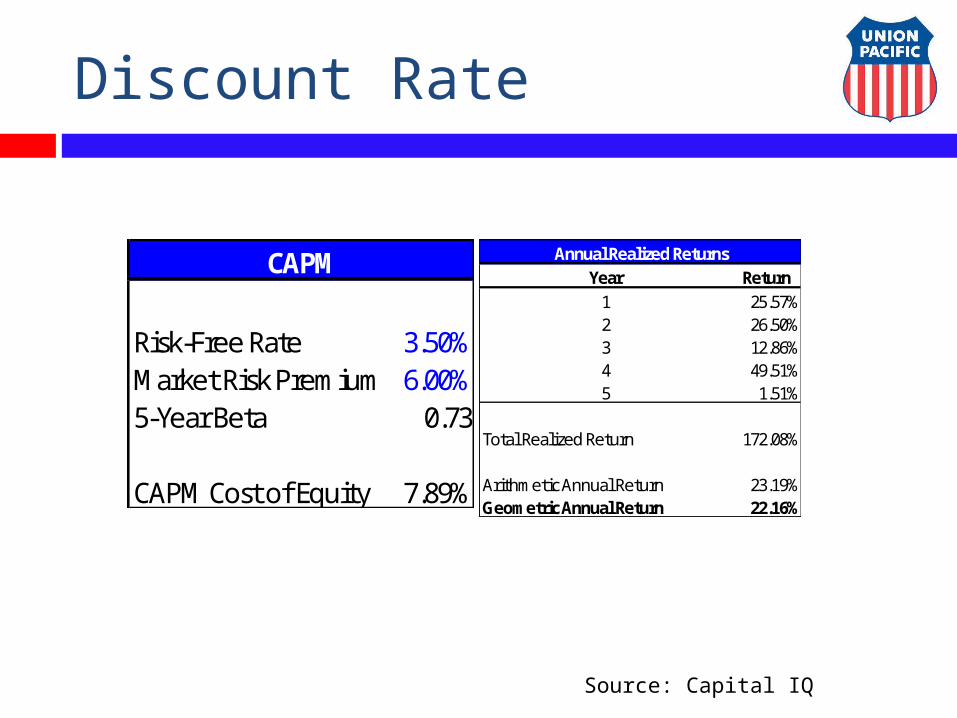
Discount Rate
Year Return1 25.57%2 26.50%3 12.86%4 49.51%5 1.51%
Total Realized Return 172.08%
Arithmetic Annual Return 23.19%Geometric Annual Return 22.16%
Annual Realized Returns
Risk-Free Rate 3.50%Market Risk Premium 6.00%5-Year Beta 0.73
CAPM Cost of Equity 7.89%
CAPM
Source: Capital IQ
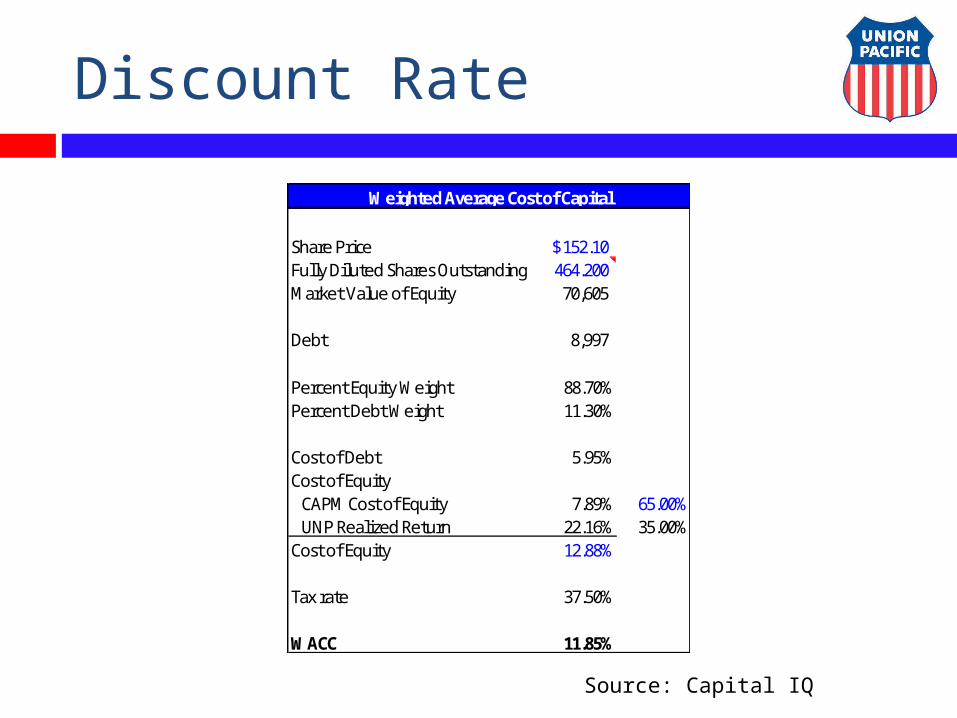
Discount Rate
Share Price 152.10$ Fully Diluted Shares Outstanding 464.200 Market Value of Equity 70,605
Debt 8,997
Percent Equity Weight 88.70%Percent Debt Weight 11.30%
Cost of Debt 5.95%Cost of Equity
CAPM Cost of Equity 7.89% 65.00%UNP Realized Return 22.16% 35.00%
Cost of Equity 12.88%
Tax rate 37.50%
WACC 11.85%
Weighted Average Cost of Capital
Source: Capital IQ
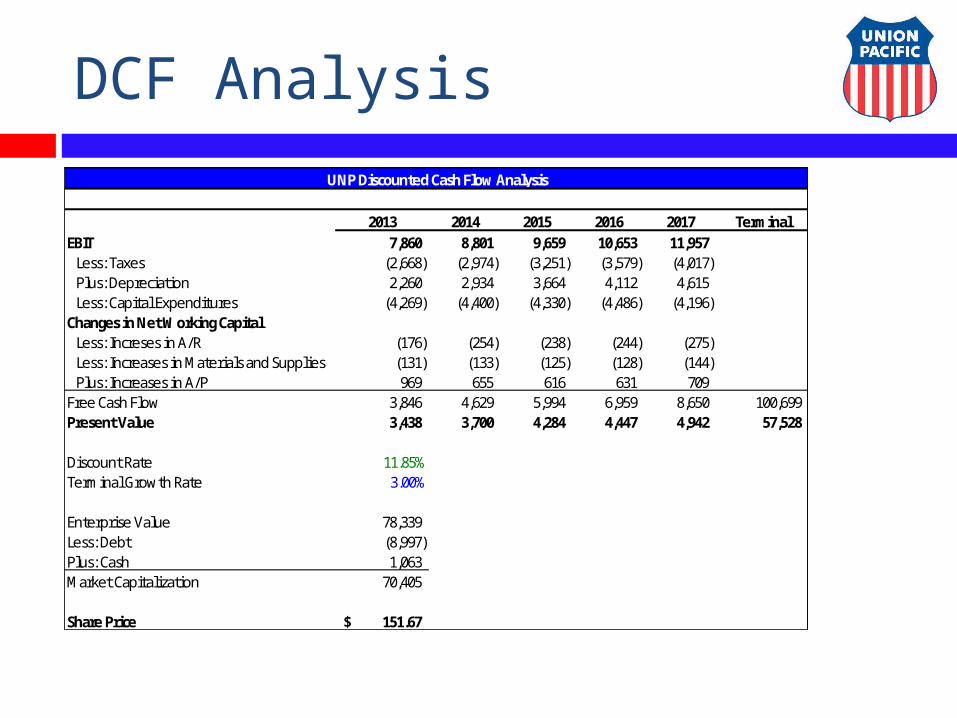
DCF Analysis
2013 2014 2015 2016 2017 TerminalEBIT 7,860 8,801 9,659 10,653 11,957
Less: Taxes (2,668) (2,974) (3,251) (3,579) (4,017) Plus: Depreciation 2,260 2,934 3,664 4,112 4,615 Less: Capital Expenditures (4,269) (4,400) (4,330) (4,486) (4,196)
Changes in Net Working CapitalLess: Increses in A/R (176) (254) (238) (244) (275) Less: Increases in Materials and Supplies (131) (133) (125) (128) (144) Plus: Increases in A/P 969 655 616 631 709
Free Cash Flow 3,846 4,629 5,994 6,959 8,650 100,699 Present Value 3,438 3,700 4,284 4,447 4,942 57,528
Discount Rate 11.85%Terminal Growth Rate 3.00%
Enterprise Value 78,339 Less: Debt (8,997) Plus: Cash 1,063 Market Capitalization 70,405
Share Price 151.67$
UNP Discounted Cash Flow Analysis
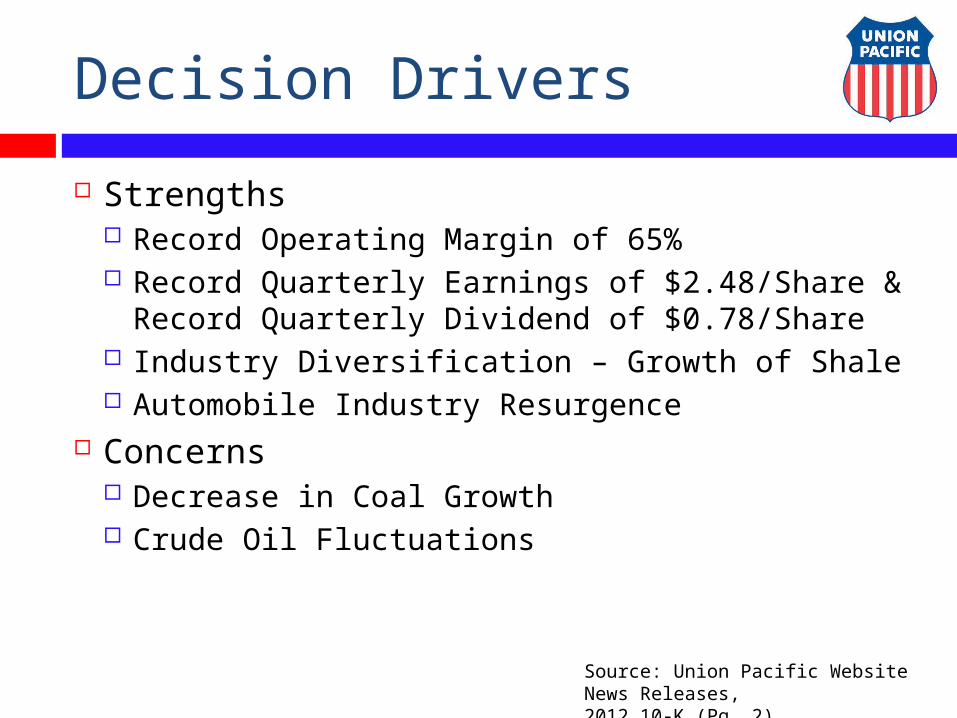
Decision Drivers
Strengths Record Operating Margin of 65% Record Quarterly Earnings of $2.48/Share &
Record Quarterly Dividend of $0.78/Share Industry Diversification – Growth of Shale Automobile Industry Resurgence
Concerns Decrease in Coal Growth Crude Oil Fluctuations
Source: Union Pacific Website News Releases,2012 10-K (Pg. 2)
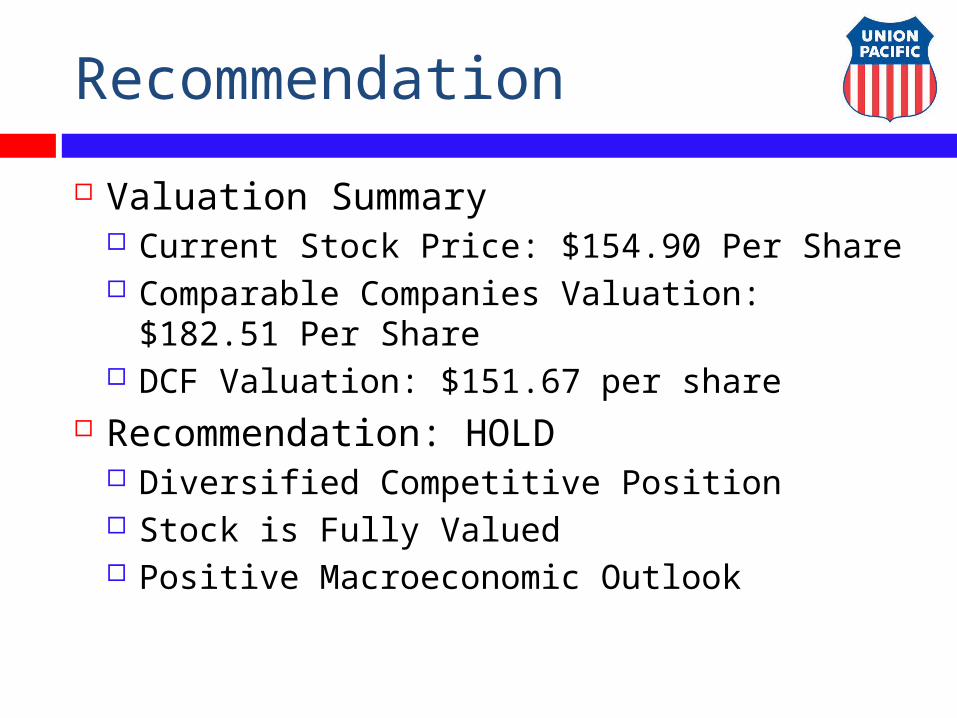
Recommendation
Valuation Summary Current Stock Price: $154.90 Per Share Comparable Companies Valuation: $182.51
Per Share DCF Valuation: $151.67 per share
Recommendation: HOLD Diversified Competitive Position Stock is Fully Valued Positive Macroeconomic Outlook
Questions?