Embed Size (px)
Citation preview
Copyright © 2017
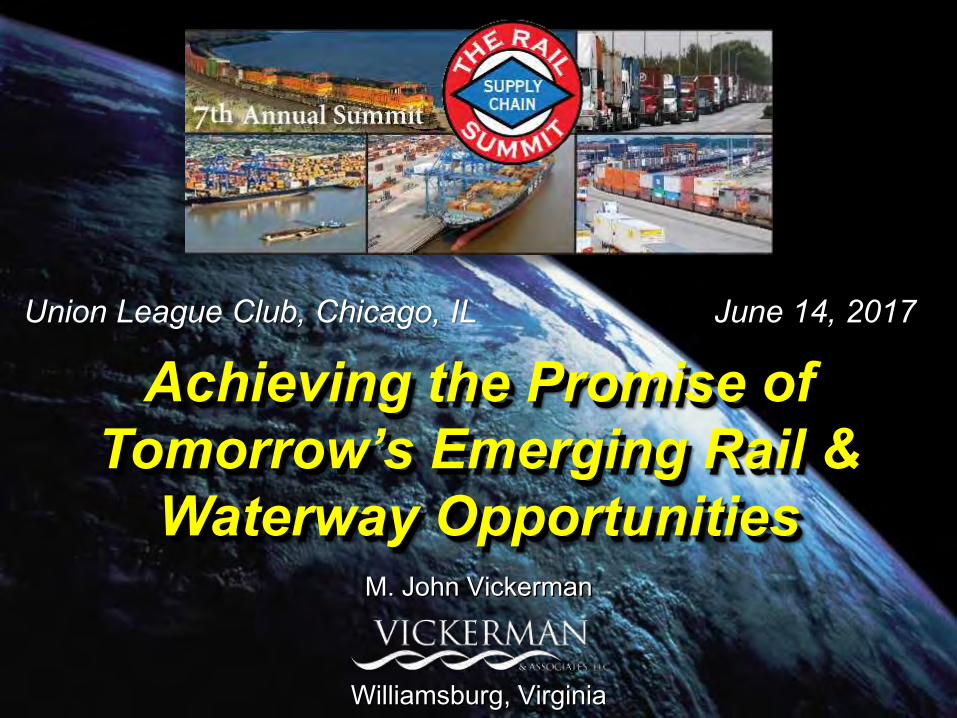
M. John Vickerman
Williamsburg, Virginia
Union League Club, Chicago, IL June 14, 2017
Achieving the Promise of Tomorrow’s Emerging Rail &
Waterway Opportunities

Copyright © 2017
Vessel Cargo Handling Circa 1955

Copyright © 2017
Cargo Handling Circa 2010

Copyright © 2017
US Navy Fast Frigate Circa 2045

Copyright © 2017
What We Know Today... Will Surely
Be Different Tomorrow!

Copyright © 2017
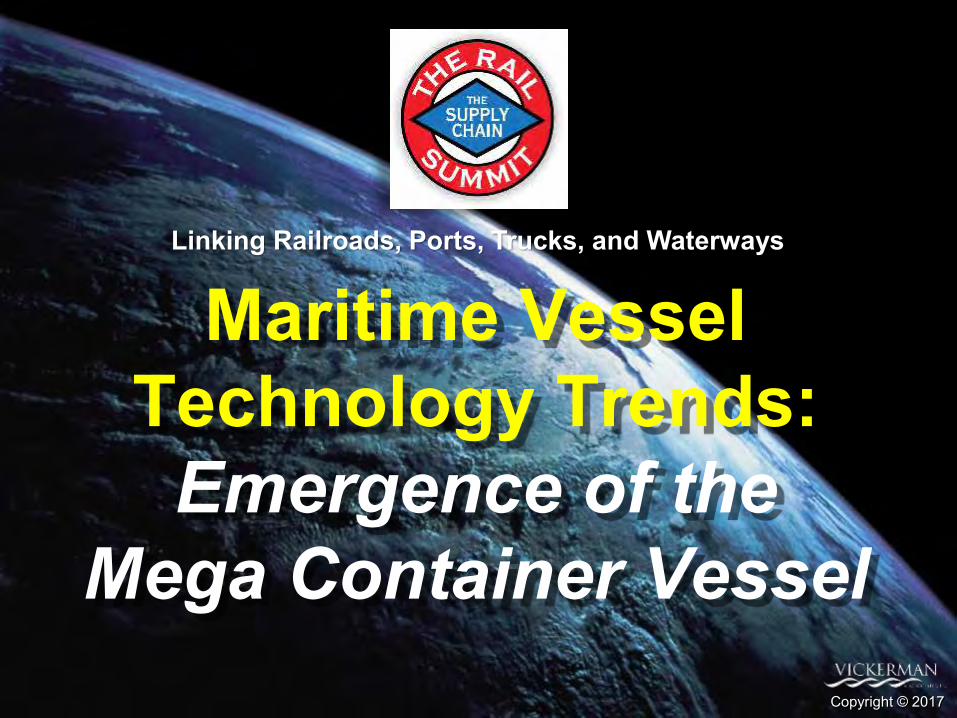
Linking Railroads, Ports, Trucks, and Waterways
Since my last presentation at the 2016 Rail Summit a year ago,
Three Major Events have changed the US Marine/Inland Waterway/Rail Industry:
✓The US Arrival of the Mega Container Ships
✓High Speed & Capacity Inland Waterway Vessels
✓The US Midwest Freight Battleground Matures
Copyright © 2017
Maritime Vessel Technology Trends:
Emergence of theMega Container Vessel
Copyright © 2017
Linking Railroads, Ports, Trucks, and Waterways

Copyright © 2017
Largest Container Ship Yet to Call on the Port of Virginia – May 8, 2017
COSCO Development Container Ship – 13, 092 TEUs

Copyright © 2017
May 8, 2017 Largest Container Vessel to Call at the Port of Virginia
Containership COSCO DEVELOPMENT at 1,200 feet long and 158 feet wide, It is 100-plus feet longer that the U.S. Navy’s newest aircraft carrier the Gerald R. Ford
COSCO Development Container Ship – 13, 092 TEUs

Copyright © 2017
Relative Size of the Mega Container Vessel
COSCO Develop
COSCO DEVELOPMENTLargest Ship to Call
Along the East Coast

Copyright © 2017
40 Years of Container Ship Size Growth (TEU Capacity)
Source: HIS Maritime & Trade Historical Vessel and Orderbook Data
NEO PANAMAX As of June 2016
OLD PANAMAX Up to June 2016
MEGA CONTAINER SHIPCirca 2020

Copyright © 2017Source: Allianz Global Corporate & Specialty - Data: Container-Transportation.com
50 Years of Container Vessel Evolutionary Growth
Neo-Panamax: 12,600 TEUs
Old Panamax:4,800 TEUs
Near Term Mega Vessel: 22,000 TEUs

Copyright © 2017
Maersk’s 18,000 TEU - Wide Body - Shallow Draft Container Ship

Copyright © 2017
The Biggest Ship Ever in San Francisco BayCMA CGM Benjamin Franklin
1,300 ft. LOA , 177 ft. beam, 18,000 TEUs
Source: CMA CGM, The SF Chronicle

Copyright © 2017
The Biggest Ship Ever in San Francisco BayCMA CGM Benjamin Franklin
1,300 ft. LOA , 177 ft. beam, 18,000 TEUs
Source: CMA CGM, The SF Chronicle

Copyright © 2017
Largest Container Vessel to Call in North America:( December 26, 2015 APMT POLA - CMA CGM Benjamin Franklin
1,300 ft. LOA and 177 ft. beam, 18,000 TEUs)
The massive Benjamin Franklin was turned in 56 hours of operations, averaging 29.1 lifts per crane, per hour, averaging total 200 container moves against the vessel each hour, for a total of 11,200 lifts..

Copyright © 2017
2015: Maersk Planning Orders up to 10 New 20,000 TEU Ships ($1.5 Billion Order),
Evergreen, Seaspan and United Arab Shipping Company (UASC) are also looking at 20,000 TEUs
2017: Ultra-Large 20.000 TEUs Container Ships

Copyright © 2017
South Korea’s Samsung Heavy Industries:OOCL Mega Ships 21,100 TEU to be delivered November 2017
Six ordered at 21,100 TEU, total cost of US$950 million. The contract also includes options for six additional units.

Copyright © 2017
A 20,000 TEU Mega-Container Vessel Can Produce High Intermodal Rail
Volumes For One Weekly Vessel Call)
Assuming a 75% Intermodal Rail Split
Double Stacked Trains
EXPORTEXPORT
26.8
Vessel Capacity Vessel Capacity 20,000 TEU
(11,784 Units)
10,000 TEU Vessel
IMPORTIMPORT
Double Stacked Trains26.8

Copyright © 2017
Containership Orders – Country of Build(Orders Since January 2010)
Source: Alphaliner Newsletter Volume 2011 Issue 21
92%

Copyright © 2017Copyright © 2017
Linking Railroads, Ports, Trucks, and Waterways
What Are The Future Mega Ship Possibilities
for the Lower Mississippi River?

Copyright © 2017
Historical Rules Are Changing on the Lower Mississippi River

Copyright © 2017
Mississippi River Deepening: Southwest Pass to Baton Rouge (50 to 55 foot depths are possible in the Future)
Mississippi River Ship ChannelGulf to Baton Rouge, LA - General Reevaluation ReportTable D-32 Project Results
48 Foot River Depth 50 Foot River Depth
Project authorized to 55 feet - full channel. Smaller but positive BCR at 55 feet depth.

Copyright © 2017
Can Mega Container Vessels Physically Call in the
Lower Mississippi River Region?

Copyright © 2017
Maersk’s Triple E Container Ship1.5 times the Size of the NEW Panama CanalWide Body Shallow Draft 18,000 TEU Vessel
(Same Design Draft of the 8,000 TEU Susan Maersk)
(Design Draft of 14.5 Meters = 47.57 feet)

Copyright © 2017
The World’s Largest Container Ships On the Mississippi River
Source: OECD/ITF
Mississippi River Container Vessel Size
10,000 TEUs
13,000 TEUs NEO PANAMAX VESSEL - NEAR FUTURE13,000 TEUs
20,000 TEUsBEYOND NEO PANAMAX VESSEL –MEDIUM FUTURE

Copyright © 2017
Largest Container Vessel to Call in the Lower Mississippi River was 8,000 TEUs with a
Controlling Vessel Draft at 45 ft.
With a Controlling Depths at 50 ft. - 52 ft. the Largest Container Vessel Could Easily Reach 20,000
TEUs in the Lower Mississippi River

Copyright © 2017
It Is Not Inconceivable that by 2025 the Lower Mississippi Design Vessel May Well be a
20,000 TEU Container Ship

Copyright © 2017
Emerging New Inland Waterway Vessel
Technology Copyright © 2017
Linking Railroads, Ports, Trucks, and Waterways

Copyright © 2017Source: USDOT Maritime Administration MARAD
“Deck” Barge Loaded with Containers
“Hopper” Barge Loaded with Containers

Copyright © 2017
Proposed Domestic AMH/Short Sea Container Services
Proposed New England Marine Highway Project's articulated tug barge short sea container service connecting New York City and Portland, Maine - 900 TEUs
Proposed MARAD ATB Ro/Con – HEC Design - 886 TEUs, Design Draft 14.1 ft. – 14 Knots

Copyright © 2017
A “State of the Art” Hull Design to Ensure Optimal Speed in All River Conditions Utilizing LNG as Main Propulsion Fuel
American Patriot Holdings, LLC (APH) Prototype Container Vessel

Copyright © 2017
American Patriot Container Transport, LLC. (APCT) Vessel Fleet Characteristics
LOA Feet Beam Feet TEU Capacity Vessel Drafts
592 100 1824 9.0 ft. 9.6 ft., & 10.0 ft.
772 100 2392 9.0 ft. 9.6 ft., & 10.0 ft.
952 100 2960 9.0 ft. 9.6 ft., & 10.0 ft.
1042 100 3244 9.0 ft. 9.6 ft., & 10.0 ft.

Copyright © 2017
American Patriot Holdings, LLC (APH) Prototype Container Vessel
A “State of the Art” Hull Design to Ensure Optimal Speed in All River Conditions Utilizing LNG as Main Propulsion Fuel
coupled with the Patented Z-Wake Bow Design.

Copyright © 2017
Inland Waterway VesselTransfer to Ocean Container Transport
Are the Cargo & Quantity Viable?
200 - 900 TEUs
1824 TEUsto
3244 TEUs
Commercially Viable
Copyright © 2017
The US Midwest & The Mississippi River Are the New Intermodal Freight
Battle Ground Copyright © 2017
Linking Railroads, Ports, Trucks, and Waterways

Copyright © 2017
New State of Marine & Intermodal Competition
Source: NW Seaport Alliance Strategic Business Plan, May 6, 2015
Mississippi River

Copyright © 2017
New Container Port Battleground Region(Representing 15% of the US GDP)
Source: Boston Consulting Group & C. H. Robinson
Copyright © 2017
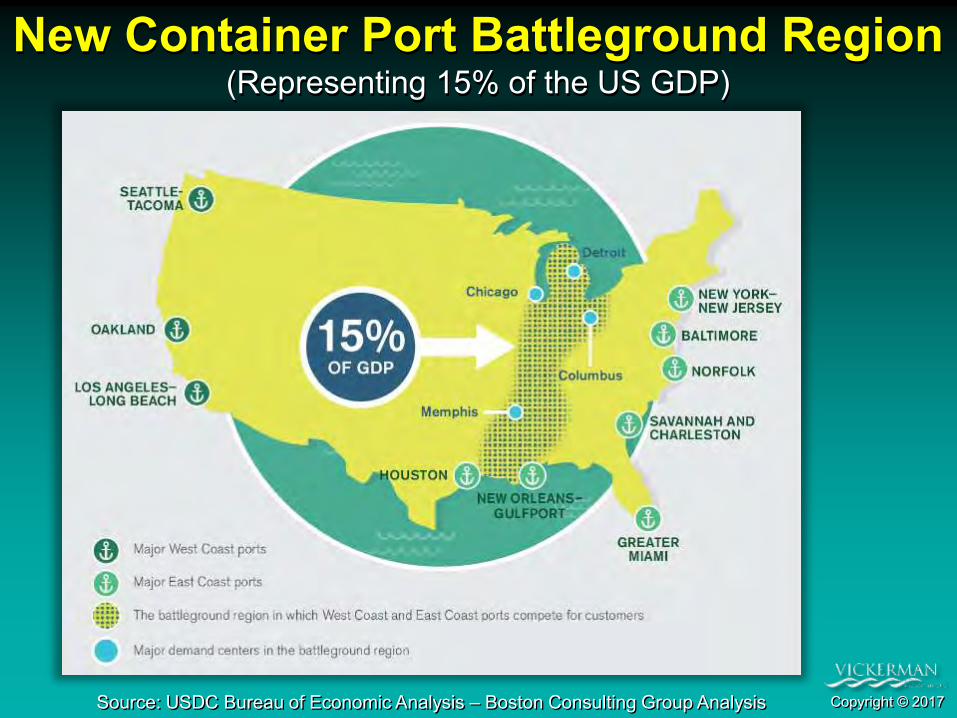
New Container Port Battleground Region(Representing 15% of the US GDP)
Source: USDC Bureau of Economic Analysis – Boston Consulting Group Analysis

Copyright © 2017
North American Cropland Intensity (Acres of Cropland as a percent of Land Area)
Battleground Region

Copyright © 2017
(1) 50 to 60 percent of total U.S. Corn exports (2) 30 to 45 percent of the total U.S. Soybean exports
The Lower Mississippi River Carries:

Copyright © 2017
Dramatic US Market Penetration after 2017 Panama Canal Economies of Scale with permit
deeper market penetration into the US
The Midwest & the Mississippi River Valley Could be the Real
Beneficiaries!
Source: ACP Expansion Project – Rodolfo Sabonge AAPA January 24, 2013

Copyright © 2017
Source: Potential Effects of the Panama Canal Expansion on the Texas Transportation System, Texas DOT, Cambridge Systematics
Dramatic US Market Penetration Is Coming Panama Canal Economies of Scale with permit
deeper market penetration into the US
East/Gulf Coast Cost Advantage
West Coast Cost Advantage
Cost Advantage Area West of the MS River
The Panama Canal will prove to be a strong contender for Asian trade serving not only the US East Coast, but ALL of the Gulf and
the Most of the Midwest by 2020

Copyright © 2017
2017 - 2020 Regional Competitive Inland Port & Distribution Center MS River Region
Distribution Center for Imports & Exports

Copyright © 2017
The Evolution of Today’s Global Shipping Lanes
Copyright © 2017
Linking Railroads, Ports, Trucks, and Waterways

Copyright © 2017
The Maritime Silk Road Replaced the Overland Silk Road as the Primary Trading Route Across Eurasia After the Tang Dynasties (618 to 907)

Copyright © 2017
The Marine Silk Road was a Precursor to:
Today’s modern supply chain logistics, distribution and shipping transportation networks

Copyright © 2017
The World’s Primary Shipping Route:The Marine Silk Road

Copyright © 2017
90% of Global Trade is Carried Out by Shipping
The Majority of Today’s Ocean Trade is Conducted on the Marine Silk Road

Copyright © 2017
Maersk’s Global Trading Routes Today

Copyright © 2017
Indian Ocean Electric Blue Shipping Lane Trails From the Marine Silk Road

Copyright © 2017
The World’s Largest Ports Are Connected Via The Marine Silk Road Where are the Biggest Ports?

Copyright © 2017
On Earth, There Are More People Living Inside This Circle Than Outside the CircleThe World’s Largest Ports Are Connected
Via The Marine Silk Road
Copyright © 2017
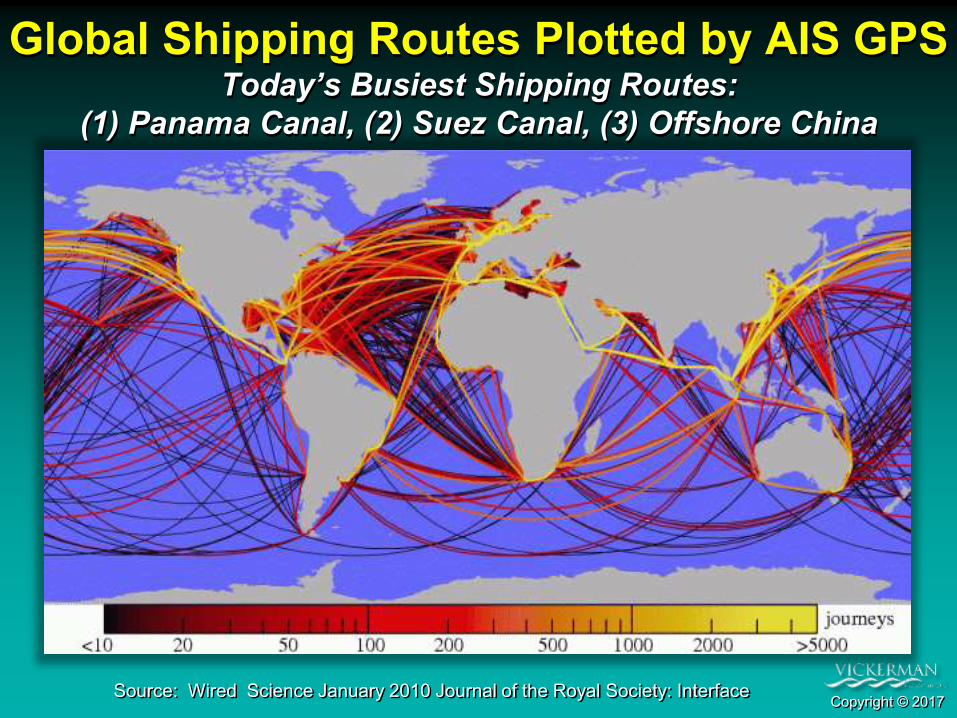
Global Shipping Routes Plotted by AIS GPSToday’s Busiest Shipping Routes:
(1) Panama Canal, (2) Suez Canal, (3) Offshore China
Source: Wired Science January 2010 Journal of the Royal Society: Interface

Copyright © 2017
InternationalExternal Industry
Pressures Driving Today’s Logistics
Copyright © 2016
Linking Railroads, Ports, Trucks, and Waterways

Copyright © 2017
More than 98% of everything we consume, wear, eat, drive and construct
is brought to us via ships through the North American port system.

Copyright © 2017
Growth in GDP and World Trade
Source: Oxford Economics 2013
World trade will grow by 73% in the next 15 years. With merchandise trade volumes in 2025 hitting $43.6 trillion compared to today’s $27.2 trillion

Copyright © 2017
World Trade’s Share of the Economy Grows Again
Source: IHS Global Insight – World Trade Service

Copyright © 2017
What Determines Today’s Logistics
Trade Flows?Copyright © 2016
Linking Railroads, Ports, Trucks, and Waterways

Copyright © 2017
Who Owns & Controls Today’s Cargo?
• The “Shipper” or “Beneficial Cargo Owner” (BCO)
• BCO = Importer of record, the entity that physically takes possession of cargo at destination and does not act as a third party in the movement of such goods
• The person or company who is usually the supplier or owner of commodities shipped.

Copyright © 2017
Key Success Factor:Cargo Will Flow “Downhill” to the
“Lowest Cost - Best Service Levels” (Total Logistics Costs From Origin to Destination)
Above All Be MARKET DRIVEN

Copyright © 2017
Poll of the Top 1000 “Blue Chip” Multinational Shipper Priorities
38%Competitive Freight Rate
43%Schedule
Reliability & Consistency
12%Transit Time
& Speed

Copyright © 2017
Today’s Logistics Truth:
“The customer wants more and is willing to pay
less for it.”

Copyright © 2017
Functional Classification of Global Maritime Cargoes
All Maritime Cargo
General Cargo Bulk Cargo
All Maritime Cargo
General Cargo Bulk Cargo
Containers, Lift On/Lift Off (Lo/Lo), Roll On/Roll Off (Ro/Ro)
Lumber, Paper, Steel, Autos
Grain, Sand & Gravel, Scrap Metal, Coal/Coke, Clinker, Fertilizer
Grain, Sand & Gravel, Scrap Metal, Coal/Coke, Clinker, Fertilizer
LNG, Petroleum, Molasses, Chemicals, Vegetable Oil
LNG, Petroleum, Molasses, Chemicals, Vegetable Oil
Containers, Lift On/Lift Off (Lo/Lo), Roll On/Roll Off (Ro/Ro)
Lumber, Paper, Steel, Autos
Sacks, Cartons, Crates, Drums, Pallets, Bags
Sacks, Cartons, Crates, Drums, Pallets, Bags
Break Bulk Neo-Bulk Containerized Liquid Bulk Dry BulkBreak Bulk Neo-Bulk Containerized Liquid Bulk Dry Bulk

Copyright © 2017
20 ft
8 ft. to 9.5 ft
1 TEU = One 20 ft. ISO Container1 FEU = 2 TEUs = One 40 ft. Container
TEU
The TEU (Twenty Foot Equivalent Unit) “The Port & Container Shipping
Unit of Measure”

Copyright © 2017
How Much Can a Single Container Hold? (Example 40 ft. Container)
= = $48,195@ 1,890Cases
$25.50/Case
=432,000Packs
@ $4.00/Pack = $1,728,000
Example Value $
=315
20” TVs@ =$299/TV $94,185
=
10,000Pairs @ =$30/pair $300,000

Copyright © 2017
International Maritime Cargo Demand
TrendsCopyright © 2016
Linking Railroads, Ports, Trucks, and Waterways

Copyright © 2017
Historical Global Container Market Demand (Millions of TEUs)
Source: Drewry Shipping Consultants
North American Growth Lags Other Global Regions
2009 Recession

Copyright © 2017
2025 World Container Port Market Demand(Millions of TEUs)
Source: Drewry Shipping Consultants October 2011
260% Increase
2009 Recession

Copyright © 2017Source: IMF - Forecast by TD Economics, December 2009
A Turning Point in Global Economic HistoryThe Advanced Economies Will Decline From 2/3 share of the Global
Economy to a 1/3 Global Share. The Global Economy Will See Higher Average Pace of Growth in the Future…
Emerging Markets(BRIC Countries)
Advanced Markets(NAFTA Countries)

Copyright © 2017
Southeast Asian Manufacturing Centroid Shift
Current Inbound US Cargo Flow
U.S. IntermodalRail Flow
Eastbound: All Water FlowEastbound: US Intermodal Rail Flow
Western Centroid Shift Expanded AsianPanama Canal
2016 Flows
Copyright © 2015

Copyright © 2017
Southeast Asian Manufacturing Centroid Shift
Current Inbound US Cargo Flow
U.S. Intermodal Rail FlowU.S. Intermodal Rail Flow
WesternCentroidShift
WesternCentroidShift
Westbound All Water/Suez FlowWestbound All Water/Suez FlowWestbound Intermodal U.S. FlowWestbound Intermodal U.S. Flow
With Manufacturing Centroid Shifts Into Vietnam and/or India, The North American East Coast will See Dramatically More Westbound Suez Traffic
Copyright © 2015

Copyright © 2017
Suez Canal’s $8.5 Billion Expansion Plan(A New $4 Billion 45-mile-long parallel channel and Global Logistics Park)
3 Daily Convoys:
2 Northern Convoys 1 Southern Convoy

Copyright © 2017
New 45-mile-long parallel channel cutting waiting times to transit by 3 hrs. from 11 hrs.
The Suez Canal’s $8.5 Billion Expansion of the Canal
Completed September 2015

Copyright © 2017
Dredging 180 Million Cubic Meters(35-kilometers-long and 24-meters-deep)
Shipping Route in Less than One Year

Copyright © 2017
Egyptian Jet Fighter Escort Selfie(Taken with the New Expanded Suez Canal in the Background)
Source: Photo Courtesy of MIRASCO, August 2015

Copyright © 2017
The Number of Ships Able to Navigate the Suez Canal Simultaneously Has Increased
from 23 to 97, Thus Doubling the Suez Canal Capacity by 2023

Copyright © 2017
The Growing AsianImport Trade
ChallengeCopyright © 2016
Linking Railroads, Ports, Trucks, and Waterways

Copyright © 2017
Container Transhipment World Records
Of the 10 busiest ports in the world, Nine are in Asia, of the top 10, Six
are on the Chinese mainland
The Port of Shanghai is No. 1, and The Port of Singapore is No.2
These Two Ports are Larger Than All North American Ports Combined

Copyright © 2017
China-US: Twin Engines of the World
2015 Population:US: 325 million China: 1,400 million
(1/5 World – 19%)
The number of Chinese children in elementary school is equivalent to the total US population.

Copyright © 2017
Shanghai International Shipping CenterYangshan Deep Port & Logistics Park
54 New Berths
New Logistics Park
New Port City
20 Mile New Port Access Bridge Constructed in 3 yrs
Copyright © 2017
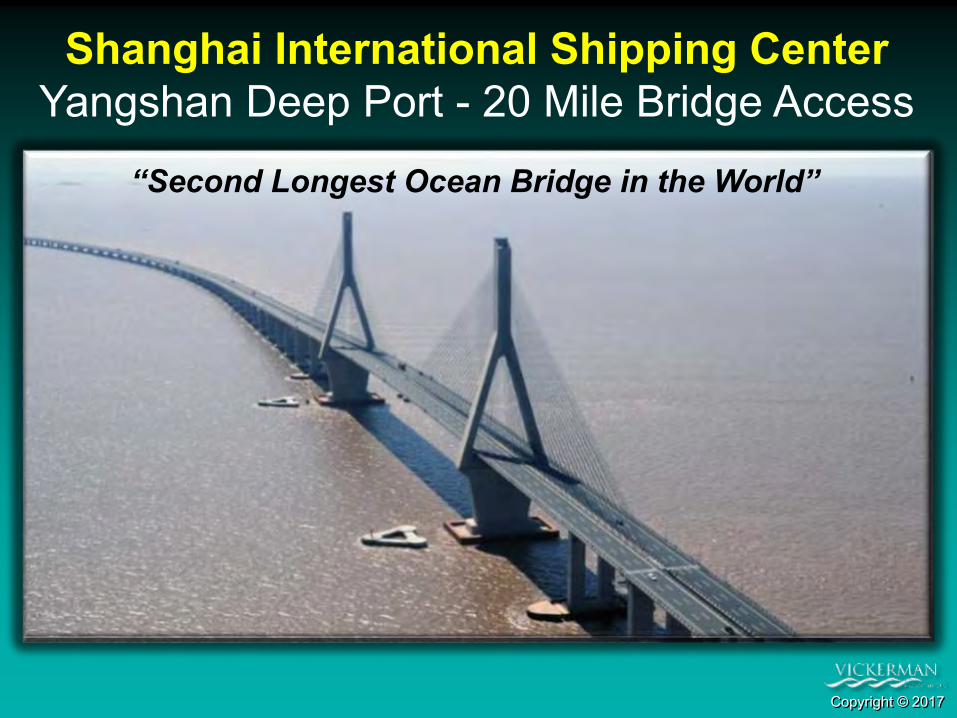
Shanghai International Shipping CenterYangshan Deep Port - 20 Mile Bridge Access
“Second Longest Ocean Bridge in the World”

Copyright © 2017
Shanghai Yangshan Deep-Water HarbourYangshan Deep Port – 54 Berths East China Sea

Copyright © 2017
Shanghai International Shipping CenterYangshan Deep Port & Logistics Park
Shanghai Port Set a 2011 Record by Handling over 30 million TEUs

Copyright © 2017
Panama Canal Expansion:
New Capacity Copyright © 2016
Linking Railroads, Ports, Trucks, and Waterways

Copyright © 2017
Panama Canal Expansion Project Inauguration on June 26, 2016.
The first ceremony will begin on the Atlantic side at the new Agura Clara Locks, followed by the new Cocoli Locks on the Pacific side

Copyright © 2017
Panama Canal Route

Copyright © 2017
Panama Canal Historical Tonnage Traffic
Source: ACP Data

Copyright © 2017
The Panama Canal Circa 1914

Copyright © 2017
Panama Canal Today

Copyright © 2017
Expansion of the Panama Canal: Circa 2016

Copyright © 2017
Panama Canal Third Lane Expansion
New Lane
Existing Lanes

Copyright © 2017
Panama Canal Third Lane Expansion

Copyright © 2017
Panama Canal Third Lane ExpansionWater-Saving Basin Reservoir System

Copyright © 2017
Panama Canal Third Lane ExpansionSliding Caisson System

Copyright © 2017
A $5.25 Billion Investment in a 3rd Set of Locks Equating to 16% of Panama’s National GDP
Source: ACP Expansion Project, Circle of Blue January 27, 2015

Copyright © 2017
Panama Canal Third Lane Expansion Capabilities
Source: ACP Expansion Project
2011:4,800 TEU 2014-2015:
12,600 TEU

Copyright © 2017
Panama Canal Third Lane Expansion Capabilities
Source: ACP Expansion Project, Circle of Blue January 27, 2015
Neo-Panamax: 12,600 TEUs
Old Panamax:4,800 TEUs

Copyright © 2017Source: A.P. Moeller-Maersk, Panama Canal Authority
The Recent Mega Container Vessels are Too Large for the New Panama Canal Third Lane Expansion

Copyright © 2017
Panama Canal Vessel Deployments Will Determine New US Logistics Patterns
The Distance to New Orleans and Savannah Via the Panama Canal is Identical… But Each Port Has Very Different Access to the US Heartland.
A Competitive & Robust Landside Access to the Gateway Port’s Inland Market will be a Key
Success Factor!

Copyright © 2017
Emerging New Caribbean
Transhipment Center(Large Ship to Feeder Vessel Transfer)
Copyright © 2017
Linking Railroads, Ports, Trucks, and Waterways

Copyright © 2017
Panama Ports Annual Transhipment Growth“The Singapore of Latin America”
Proposed New Port Projects Would Double
the Total in 5 Years

Copyright © 2017
Panama Ports Container Transhipment Growth
6.8 Million TEUs – 18.5 % Growth Rate

Copyright © 2017
The Panama Canal Expansion Will Move the Caribbean Transhipment Center Point to Panama
Copyright © 2017
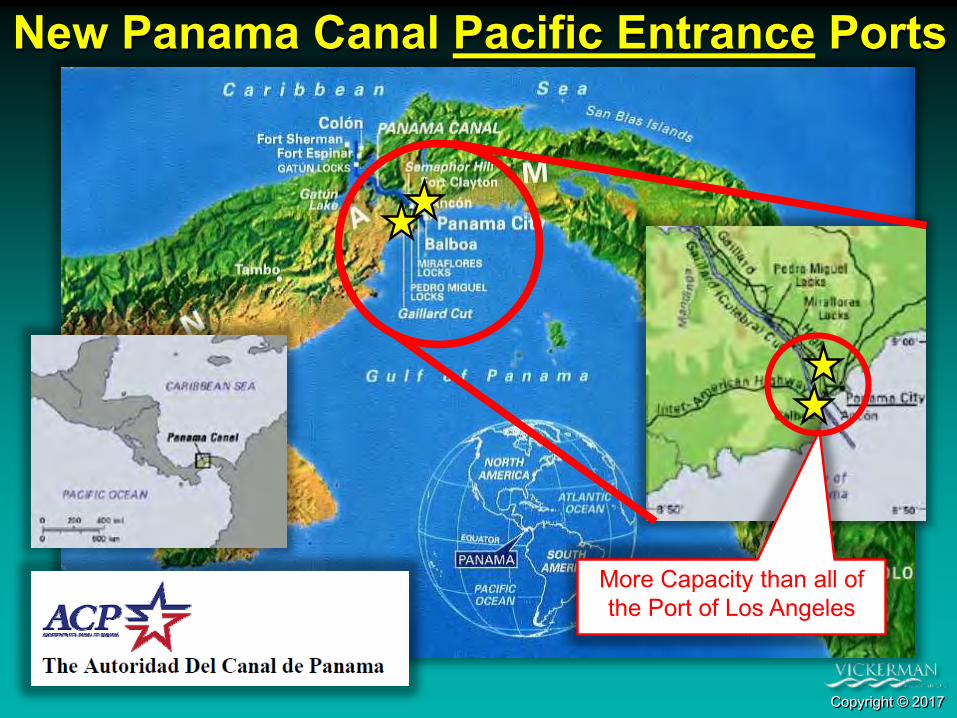
New Panama Canal Pacific Entrance Ports
More Capacity than all of the Port of Los Angeles

Copyright © 2017
New Panama Canal Atlantic Entrance Port
More Capacity than all of the Port of Houston

Copyright © 2017
North American Vessel Transshipment:(Globally Transshipment accounts between 25 and 50%
of all container volumes – In the US it’s < 15%)
Induced Transshipment/Feeder Ship Operations
Transhipment Hub Port
Mother Ship
Feeder Ship
Feeder Ship

Copyright © 2017
ASCE 2017 Report Card for America’s
Infrastructure
Ports: C+Inland Waterways: D
Roads: D
$4.6
Cost to Improve
Failure to Act: It Costs Each US Family $3,400 per year

Copyright © 2017
International Gross Fixed Capital Formation as a Percent of GDP
(US is 32nd in the World - Below OECD Nations)
Organization for Economic Co-operation and Development (OECD)

Copyright © 2017
Thank You
Linking Railroads, Ports, Trucks, and Waterways
Copyright © 2016