Embed Size (px)
Citation preview
Union Effects on Health Insurance Provision
and Coverage in the United States
Thomas C. Buchmueller*John DiNardo**
Robert G. Valletta***
December 1999
Abstract
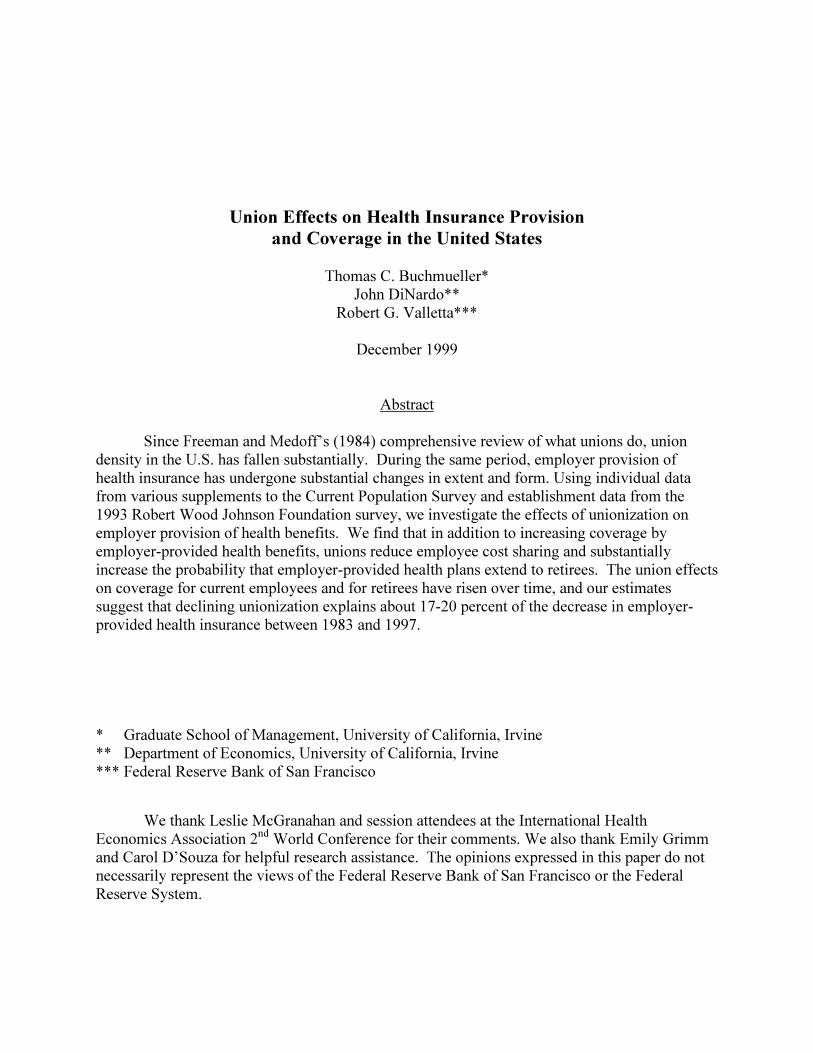
Since Freeman and Medoff’s (1984) comprehensive review of what unions do, uniondensity in the U.S. has fallen substantially. During the same period, employer provision ofhealth insurance has undergone substantial changes in extent and form. Using individual datafrom various supplements to the Current Population Survey and establishment data from the1993 Robert Wood Johnson Foundation survey, we investigate the effects of unionization onemployer provision of health benefits. We find that in addition to increasing coverage byemployer-provided health benefits, unions reduce employee cost sharing and substantiallyincrease the probability that employer-provided health plans extend to retirees. The union effectson coverage for current employees and for retirees have risen over time, and our estimatessuggest that declining unionization explains about 17-20 percent of the decrease in employer-provided health insurance between 1983 and 1997.
* Graduate School of Management, University of California, Irvine** Department of Economics, University of California, Irvine*** Federal Reserve Bank of San Francisco
We thank Leslie McGranahan and session attendees at the International HealthEconomics Association 2nd World Conference for their comments. We also thank Emily Grimmand Carol D’Souza for helpful research assistance. The opinions expressed in this paper do notnecessarily represent the views of the Federal Reserve Bank of San Francisco or the FederalReserve System.
Union Effects on Health Insurance Provision
and Coverage in the United States
I. Introduction
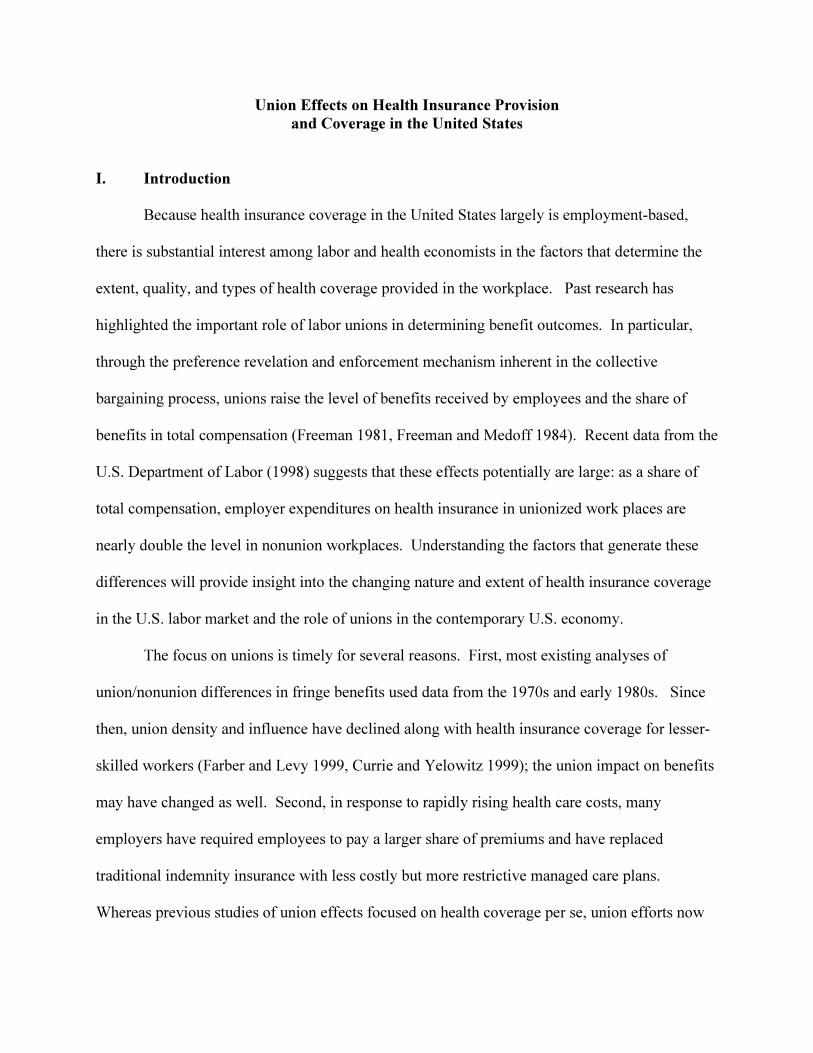
Because health insurance coverage in the United States largely is employment-based,
there is substantial interest among labor and health economists in the factors that determine the
extent, quality, and types of health coverage provided in the workplace. Past research has
highlighted the important role of labor unions in determining benefit outcomes. In particular,
through the preference revelation and enforcement mechanism inherent in the collective
bargaining process, unions raise the level of benefits received by employees and the share of
benefits in total compensation (Freeman 1981, Freeman and Medoff 1984). Recent data from the
U.S. Department of Labor (1998) suggests that these effects potentially are large: as a share of
total compensation, employer expenditures on health insurance in unionized work places are
nearly double the level in nonunion workplaces. Understanding the factors that generate these
differences will provide insight into the changing nature and extent of health insurance coverage
in the U.S. labor market and the role of unions in the contemporary U.S. economy.
The focus on unions is timely for several reasons. First, most existing analyses of
union/nonunion differences in fringe benefits used data from the 1970s and early 1980s. Since
then, union density and influence have declined along with health insurance coverage for lesser-
skilled workers (Farber and Levy 1999, Currie and Yelowitz 1999); the union impact on benefits
may have changed as well. Second, in response to rapidly rising health care costs, many
employers have required employees to pay a larger share of premiums and have replaced
traditional indemnity insurance with less costly but more restrictive managed care plans.
Whereas previous studies of union effects focused on health coverage per se, union efforts now
2
may be increasingly oriented towards influencing plan quality and resisting higher employee
contributions.
To examine the role of unions in the provision of employer-based health insurance in the
United States, we use individual survey data from several supplements to the Current Population
Survey (CPS) and establishment data from a survey conducted in 1993 by the Robert Wood
Johnson Foundation (RWJF). The individual data enable us to decompose employment-based
insurance coverage and changes therein into portions attributable to insurance offers by
employers, individual employee eligibility, and employee acceptance of offered insurance
(takeup). We find that union workers are more likely than nonunion workers to receive health
benefits, and the difference mainly is explained by higher probabilities of insurance offers and
higher takeup rates for union workers. Although the union effect on offers is limited to workers
in small establishments, union effects on takeup operate within small and large establishments
alike.
Two likely explanations for higher takeup rates among union workers are smaller
required contributions to health plan financing and higher plan quality. Results from the RWJF
data indicate that establishments employing union workers are more generous than nonunion
establishments with respect to monthly premium contributions. Differences in plan benefits are
somewhat less pronounced. Among indemnity and preferred provider organization (PPO) plans,
those offered by union establishments tend to have lower deductibles. However, we find no
difference in patient cost-sharing between HMOs offered by union and nonunion establishments.
The CPS and RWJF data sets also provide information on the prevalence and financing of
retiree health coverage. While less research has been conducted on this benefit than on standard
employee health benefits, the growing size of retirement cohorts, rising incidence of job loss
3
among older, senior workers (Neumark, Polsky, and Hansen 1999, Valletta 1999), and declining
incidence of retiree coverage (Loprest 1998; U.S. GAO 1997b, 1998) makes retiree health
insurance an increasingly important policy issue. The collective-voice view of union behavior
suggests that unions have an especially important role to play in the provision of such benefits.
In particular, the union voting and bargaining process is likely to produce outcomes that reflect
the preferences and needs of older workers who constitute the union’s core constituency, rather
than younger marginal workers on whom the firm focuses its recruiting efforts. Consistent with
this reasoning, we find larger effects of unionization on the provision of retiree health benefits
than on the provision of standard health benefits.
In the next section, we discuss union effects on fringe benefit outcomes, changes in the
market for health insurance provision, and their implications for our empirical work. Section III
describes our CPS and RWJ data and presents basic tabulations. In Section IV, we present
results from regression analyses of health insurance outcomes; these regressions control for
worker and establishment characteristics that are likely to differ between union and nonunion
workplaces. Section V summarizes the results and discusses their implications.
II. Union Effects and the Market for Health Insurance
Union Effects on Health Insurance Provision
The role of US trade unions in obtaining health and welfare benefits for their members
dates to the 18th century. Indeed, according to Munts (1967), many early union organizations
were established for the provision of such benefits and only later became engaged in bargaining
with employers over wages. Roughly a century ago, Beatrice and Sidney Webb wrote of British
unions that “the prospect of securing support in sickness or unemployment [was] a greater
4
inducement [for young men] to join the union…than the less obvious advantages to be gained by
the trade combination” (Webb and Webb, 1897). Around that time, Samuel Gompers and others
in the US advocated the expansion of union benefit plans because they benefited workers directly
and helped unions maintain membership during economic downturns (Munts 1967). Despite this
tradition, however, it was not until the late 1940s, with the Taft-Hartley Act and the Inland Steel
Case, that health and welfare benefits became the subject of collective bargaining.
Early economic studies of fringe benefits (Rice 1964; Lester 1967) noted the likely
importance of unions in increasing benefits, but due to data limitations did not investigate union
effects in detail. The most comprehensive analysis of the effect of unionization on non-wage
benefits is the work of Richard Freeman and James Medoff (summarized in their 1984 book).
Freeman and Medoff noted that in nonunion workplaces, where entry and exit are the primary
adjustment mechanisms, employment and compensation outcomes are determined primarily by
the preferences of “marginal” workers, who tend to be young, mobile, and have little invested in
the firm. This adjustment mechanism ignores the preferences of less mobile workers, who are
older and often have substantial firm-specific investments. By contrast, in a unionized
environment the preferences of such inframarginal workers are explicitly taken into account,
through union voting and political processes that give voice to a wider set of workers than those
at the margin. The resulting bargained outcomes reflect the preferences of workers who are
more representative of the complete bargaining unit—along dimensions such as age and
seniority—than are the marginal workers.1
1 The simplest statement of this view posits union bargaining based on the preferences of the
median union member. As discussed by Farber (1986), however, the conditions necessary for unionobjective functions to represent the preferences of the median member are unlikely to hold in typicalbargaining situations. Budd (1992) argues that the wage compression and standardization policiespursued by unions in the U.S. and other countries are consistent with a “Rawlsian” objective function,which focuses on the utility of the least well-off member.
5
Freeman and Medoff termed this process of preference revelation and expression
“collective voice.” In addition to effectively replacing expression of opinion by individual
workers, which may be perilous to their employment status, collective voice is important due to
the public goods nature of some employment conditions. Features of the employment
relationship such as health insurance, occupational safety, and procedures for layoffs and work
sharing involve public goods elements and therefore will not be adequately provided for if left to
standard market adjustment mechanisms.2,3
Due to collective voice and other factors, union effects on the provision of health
insurance are likely to be large. First, one key effect of unions is to raise the level of
compensation; unless union members place no value on improvements in their health plan, the
union bargaining effect on total compensation will raise the coverage and quality of employer
health plans. Second, the inframarginal workers empowered by the collective voice mechanism
are more likely than marginal workers to be older, to have dependents, and to face salient health
and retirement issues. They will likely have stronger preferences concerning the availability and
quality of their health insurance coverage while employed. In addition, older workers are likely
to place especially strong weight on employer provision of retiree health benefits.
Unions may increase expenditures on health benefits and alter their form through other
channels as well. Attractive health benefit packages are a highly visible and readily understood
benefit, and as such may be especially attractive to union leaders, who need the approval of
2 In one of the few direct tests of the collective voice and median voter hypotheses, Kahn (1990)
examined occupational safety outcomes for unionized industries and concluded that the preferences of themost senior and the most junior workers mattered most.
3 Goldstein and Pauly (1976) also pointed out the public good nature of fringe benefits, focusingspecifically on health insurance. Like Freeman and Medoff, they assumed that unions choosecompensation packages based on the preferences of the median worker within a firm, whereas thedecisions of nonunion employers are made to satisfy marginal workers.
6
union members in order to stay in power.4 Moreover, if the union helps to administer a health
insurance program across multiple work sites, the resulting economies of scale in plan provision
may provide the basis for expansion of coverage and improvements in plan quality or choice
characteristics.
Existing empirical results broadly support this view of union effects on employer-
provided health insurance. Using data from the 1970s, Freeman and Medoff (1984) found that
unionization substantially raised the probability workers were covered by employer-provided
health plans. Woodbury and Bettinger (1991) used CPS data from 1979 and 1988 to investigate
changes in fringe benefit coverage during the 1980s. According to their decomposition analysis,
declining union membership was the most important measured factor explaining the decline in
employer-provided health insurance over that period. Their results also suggest that as unions
were declining in membership, their impact on benefit outcomes also was waning: the marginal
effect of union membership on health insurance coverage fell by 28 percent between 1979 and
1988. Even and McPherson (1991) also found that the impact of unionization on insurance
coverage fell during the 1980s. Since neither of these studies distinguished between employer
offers and employee takeup of coverage, the exact reasons for this decline are unclear.
Freeman and Medoff also analyzed data on employer expenditures for life health, and
accident insurance combined, and found that the unionization effect on expenditures is larger
than the unionization effect on incidence.5 Assuming it does not simply reflect greater
4 Mabry (1973, p. 98) summarized the view that fringe benefits serve the interests of union
leaders as follows: “The administration of [fringe benefit] programs requires a bureaucracy which tends tostrengthen the rationale of union existence, membership dependency, and, hence, organizationalsurvival.”
5 The results discussed in Freeman and Medoff (1984) are based on simple linear regressions.However, Freeman (1981) subjected his data to additional tests that accounted for establishment-specificeffects and spillovers to nonunion employees. His results largely are consistent with those from the lesscomplex analyses discussed in their 1984 book.
7
inefficiency in fringe provision, the larger union effect on expenditures than on incidence
suggests that improvements in plan quality are an important feature of union effects. Despite the
potential effects of unionization on specific features of employer-provided health plans, little
analysis of these effects has been conducted, perhaps due to data scarcity. Based on unadjusted
comparisons from the 1981 National Medical Care Expenditure Survey, Freeman and Medoff
found that health plans in union establishments provide more flexibility in regard to obtaining a
second opinion, and that the proportion of health insurance premiums paid by employers was 14
percent higher in union settings. Similarly, using establishment data from the year 1971,
Goldstein and Pauly (1976) found that conditional on a set of establishment characteristics,
unionization significantly raises the probability that employees offer noncontributory health
plans; this was one of the key predictions of their model of union effects on benefit provision.
Changes in Health Insurance Markets
An updating of union effects on health insurance is especially important given the
changes in health insurance markets—in the workplace and more generally—that have occurred
over the past decade or so. Employers have responded to the rising cost of health care in several
ways affecting both the number of workers with any insurance and the nature of the coverage
held by insured workers. One response has been to increase the amount that employees are
required to contribute directly for insurance in addition to implicit payments in the form of
foregone wages (GAO 1997a; Gabel 1999). Higher employee contributions have been shown to
reduce the percentage of workers who accept health insurance offered by their employers
(Chernew et al. 1997; Shore-Sheppard et al. 1999). Several studies indicate that a decline in
takeup among workers who are offered health benefits is the primary reason private insurance
8
coverage has fallen over the past decade or so (Cooper and Schone 1997; Rice et al. 1997; Farber
and Levy 1999).
Another health care development that is pertinent to understanding the role of unions in
financing health care is a dramatic decline in retiree health benefits over the past 10 to 15 years.6
Loprest (1998) reports tabulations from BLS surveys indicating that the percentage of workers in
medium and large firms that could continue their health insurance into retirement declined from
75 percent in 1985 to 46 percent a decade later. Other survey data also show a large decline in
retiree health benefits (GAO 1997b, 1998). Early retirees who are not yet eligible for Medicare
are especially affected by this development. Individually-purchased insurance can be quite
expensive for this group, and despite recent insurance market reforms persons with serious health
conditions may be unable to obtain such coverage at all.7
III. Data
To examine the role of unions in the provision of employer-based health insurance in the
United States, we use individual and establishment survey data. Our individual data come from
several special supplements to the Current Population Survey (CPS): the Benefits Supplements
conducted in May 1983, May 1988, and April 1993, a supplement regarding retiree health
benefits conducted in August 1988, and the Contingent Work Supplements conducted in
February 1995 and February 1997. In the 1983 Benefits Supplement survey, respondents were
asked about receipt of employer-provided insurance. Beginning with the 1988 Benefits
6 In addition to rising health care costs, a major factor influencing this trend is a 1990 ruling by
the Financial Accounting Standards Board (FAS 106) requiring employers to report anticipated retireehealth care costs as liabilities on their balance sheets.
7 The Health Insurance Portability and Accountability Act (HIPAA) of 1997 prohibits insurersfrom denying individually-purchased coverage to persons leaving employer-sponsored group plans.
9
Supplement, respondents also were asked about employer insurance offers and individual
eligibility.8 The 1993 Benefits Supplement included the widest range of health insurance
questions, including ones about retiree health benefits and a limited set of health plan
characteristics. This additional information is not available in the other Benefits Supplements or
in the Contingent Work Supplements. One additional drawback of the Contingent Work
Supplement data is the absence of information on establishment or firm size, which is an
important determinant of both union status and health coverage. For all analyses discussed
below, we restricted our CPS samples to employed individuals aged 20-64 at the time of the
survey, and we excluded self-employed individuals and government workers.9
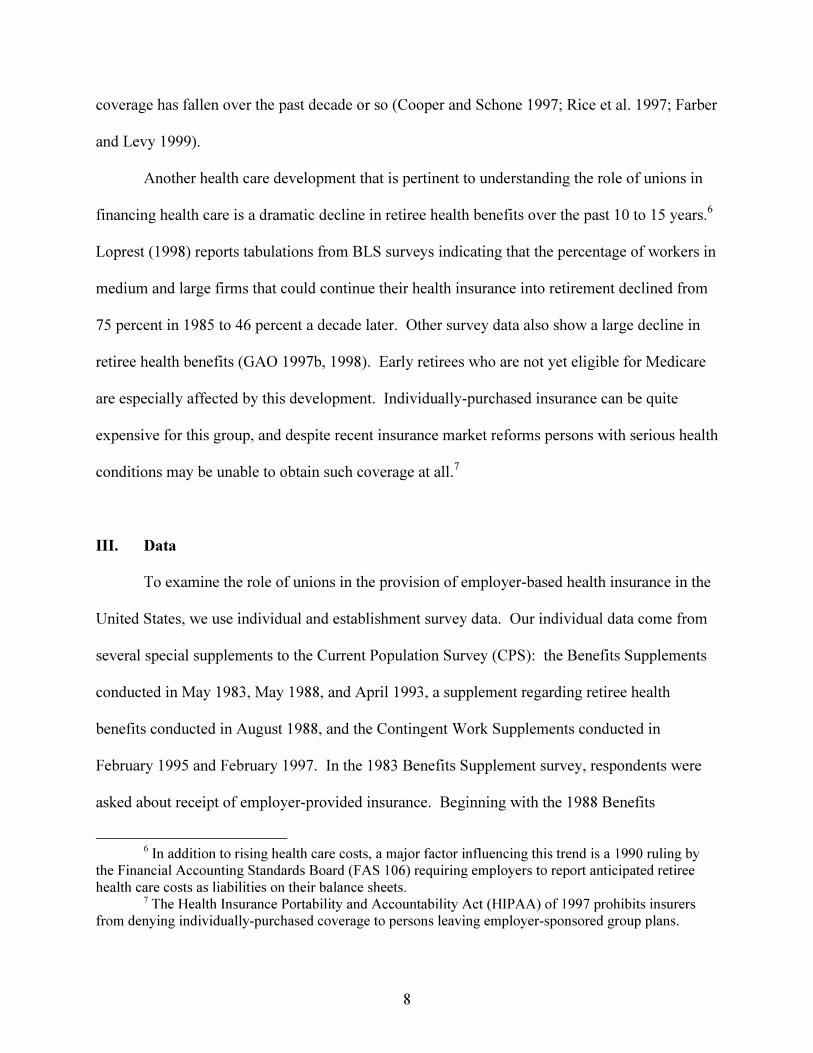
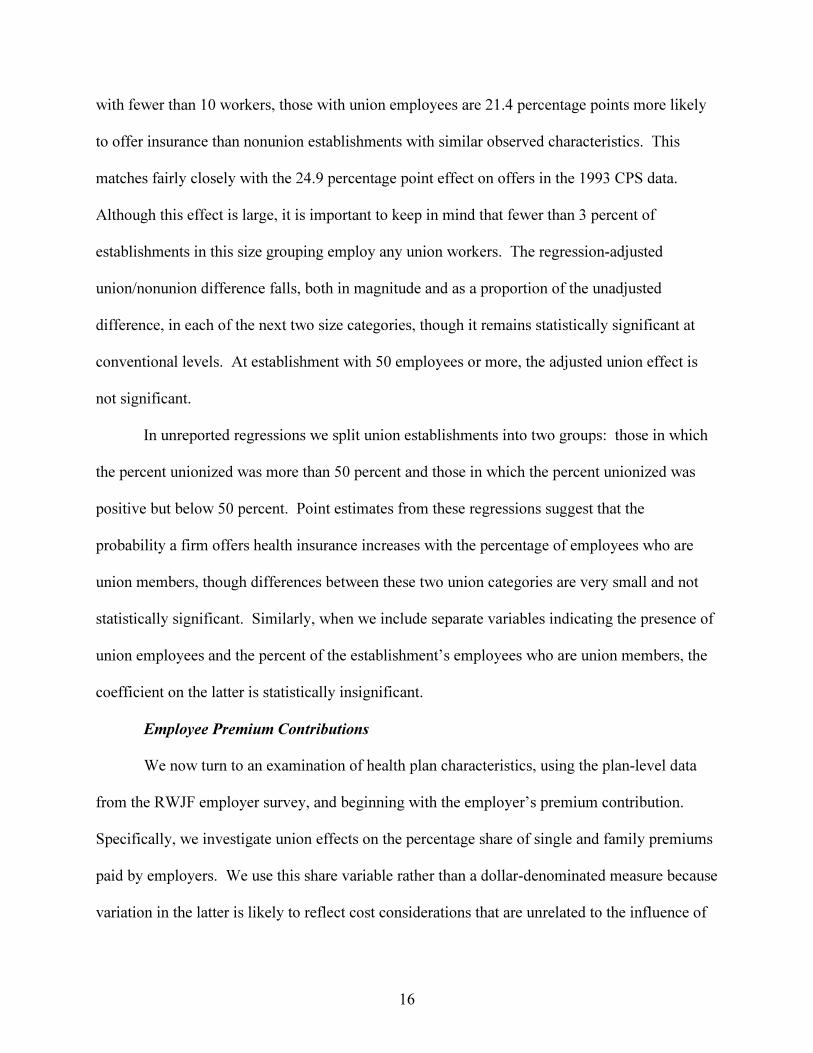
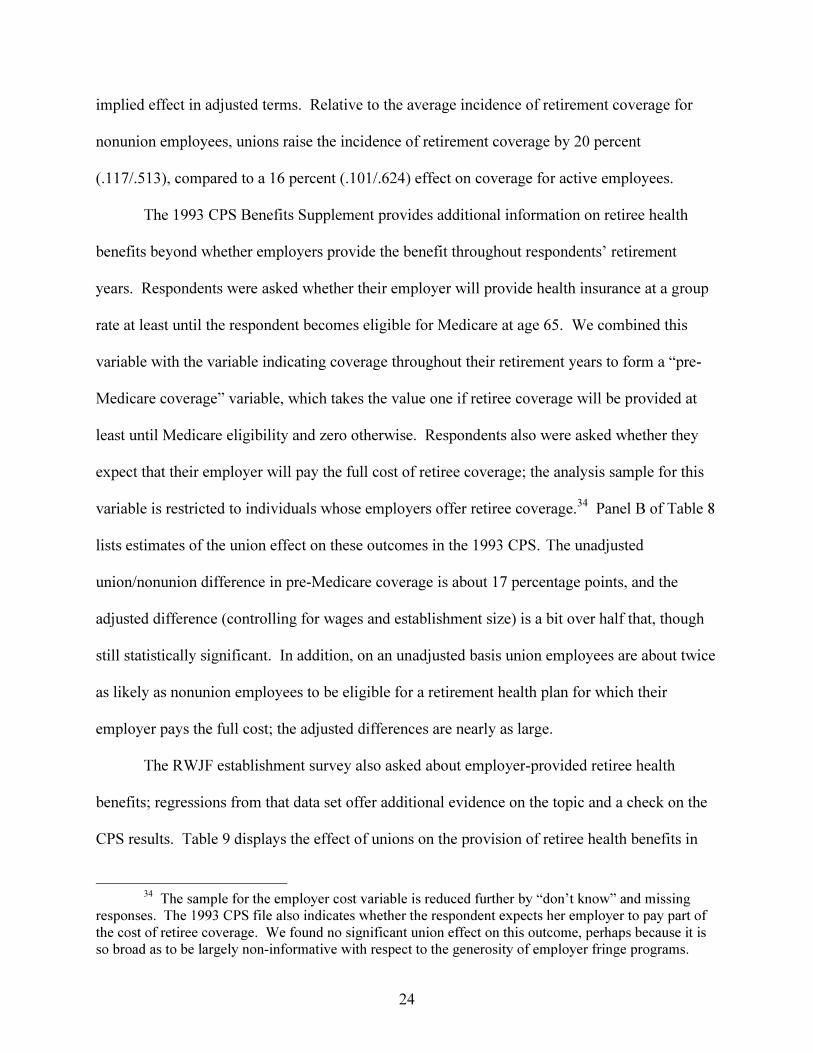
Table 1 presents tabulations that indicate the distribution of unionization and employer-
provided health insurance by establishment size (where available) in each CPS sample. The
figures show that coverage by employer-provided health insurance plans declined by about 8
percentage points between 1983 and 1997; most of the decline occurred between 1988 and 1993,
and it leveled off after 1993.10 Union membership density declined by about 9 percentage points
between 1983 and 1997. Table 1 also documents the well-known positive relationship between
However, since HIPAA does not regulate the premiums, it does not ensure the availability of affordablecoverage for early retirees with costly health conditions.
8 Currie and Yelowitz (1999) noted that the ordering and wording of the health insurancequestions differs between the Benefits Supplements and the Contingent Work Supplements. Although thismay affect comparisons over time, Currie and Yelowitz also noted that the trends evident in these data setsare similar to those evident for the same time period in the Survey of Income and Program Participation, inwhich the insurance questions did not change.
9 The Contingent Work Supplement samples used in our analyses are smaller than the full samplefrom the monthly CPS because the questions regarding union status and earnings are posed only to thoserespondents that will be rotating out of the sample at the end of that month (one quarter of the sample). Inthe Benefits Supplement data, the BLS matched information on earnings and union status from the MayCPS survey, so we are not constrained to use only the outgoing rotation group observations; however, theBenefits Supplements were administered to only one-half of the monthly CPS sample.
10 Our figures are largely consistent with those presented by Farber and Levy (1999, Table 2),except our coverage rates in 1995 and 1997 are about 2 percentage points lower.
10
establishment size and union membership, which we account for in analyses using the Benefits
Supplements.11
We also use establishment data from a telephone survey conducted in 1993 by the Robert
Wood Johnson Foundation (RWJF). These data provide a means for validating and reinforcing
results from the CPS data, and also provide substantial independent detail on health plan
characteristics. The RWJF sample was drawn from ten states: Colorado, Florida, Minnesota,
New Mexico, New York, North Dakota, Oklahoma, Oregon, Vermont and Washington.
Although the sample is designed to be representative of employers in these states rather than the
nation as a whole, aggregate economic and health insurance statistics for this group are fairly
comparable to those for the nation as a whole (Cantor et al. 1995).
The full RWJF sample consists of 22,347 private establishments. We exclude from our
analysis 493 observations (2.2 percent of the full sample) for which information on the union
status of the firm’s employees is missing.12 The RWJF survey also provides detailed information
on all the health plans offered by each employer, and some of our analysis is done at the plan
level. Our health plan sample contains observations on a total of 20,218 plans offered by 14,737
private establishments for which union status could be determined.13
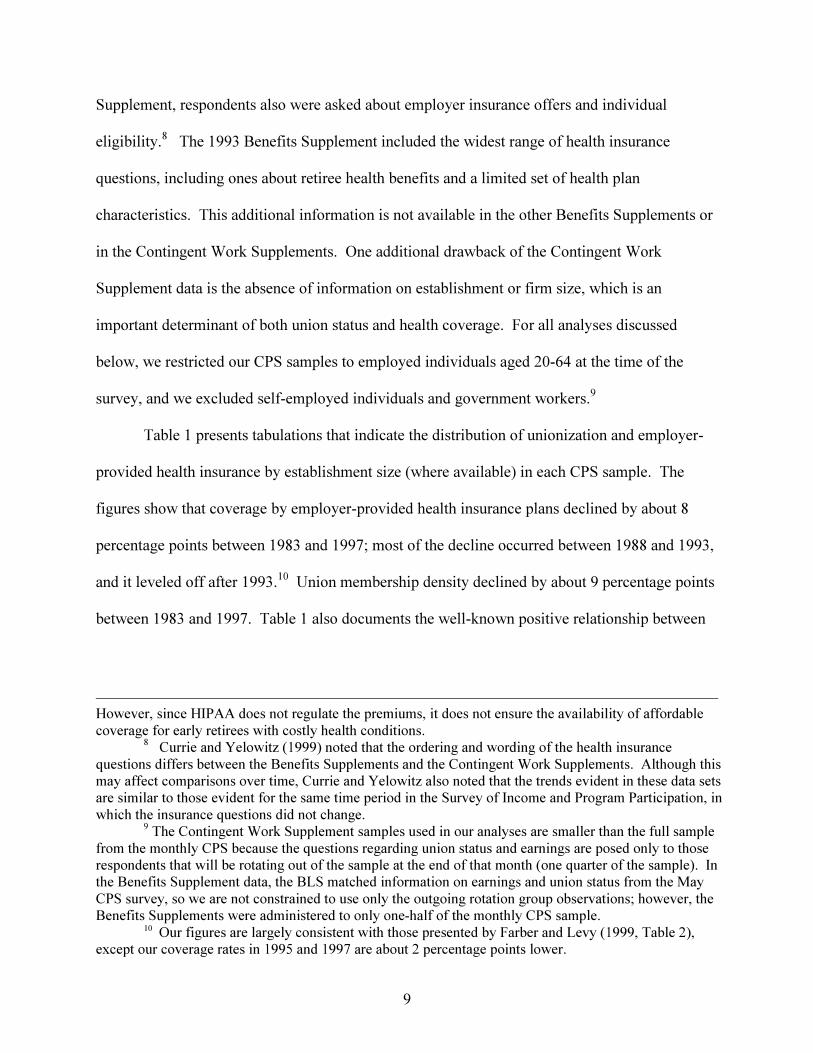
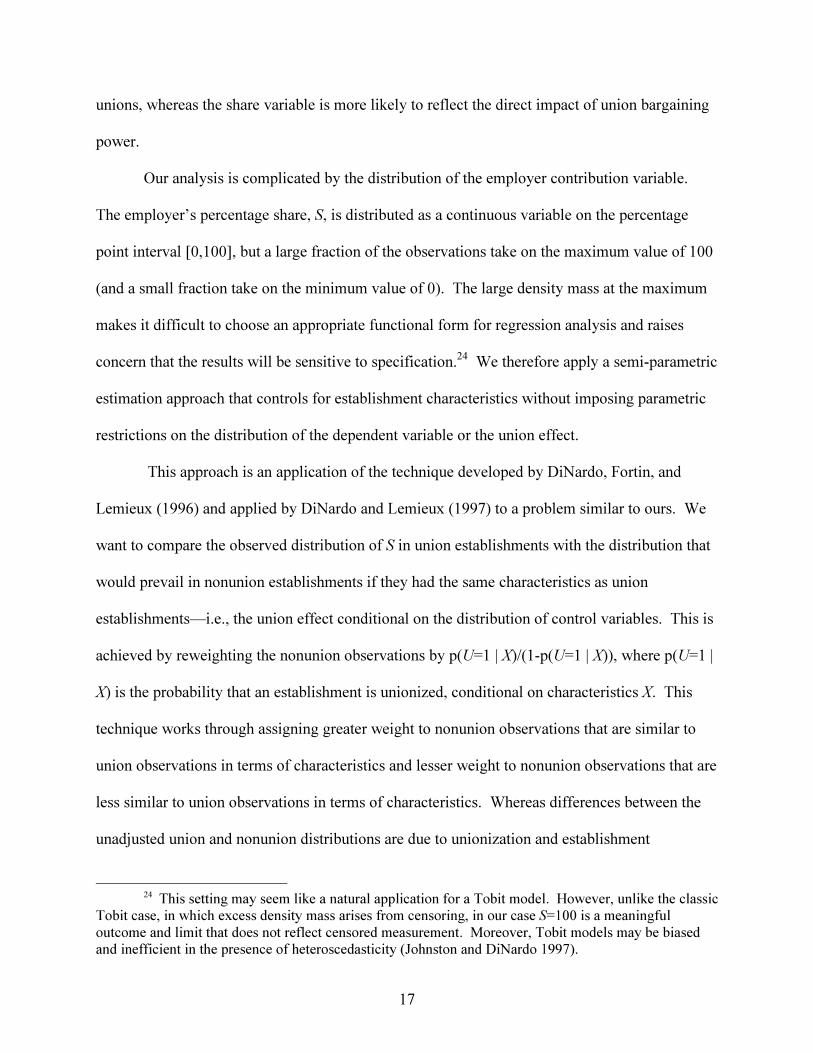
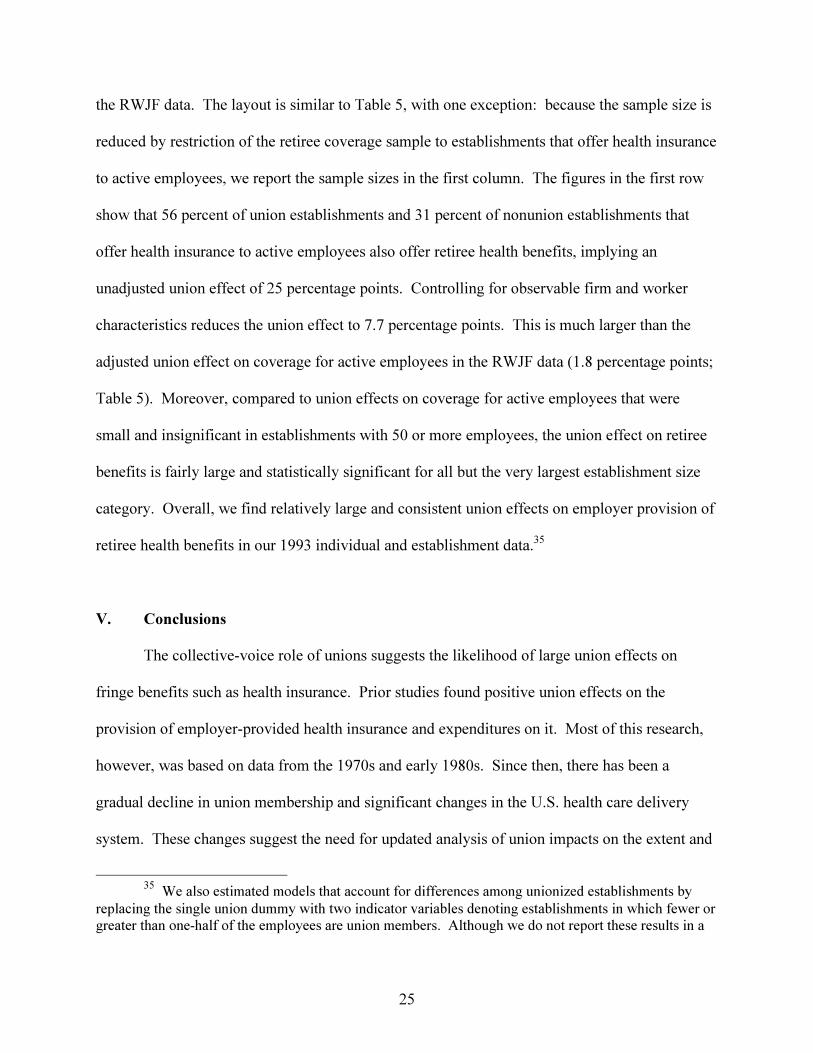
Tables 2 presents sample sizes and summary statistics on union status for the
establishment portion of the RWJF data. Survey respondents were asked what percent of the
11 Prior studies (Bramley, Wunnava and Robinson 1989; Wunnava and Ewing 1999) have found
that the effect of unions on benefits is strongest for employees of smaller firms.12 Firms with missing data on the union question tend to be larger than average (the mean number
of employees is 90.5, compared to 54.4 for firms with valid union information) and, conditional on size,more likely to offer insurance.
13 We lose 1003 health plan observations (4.7 percent of the total sample) due to missing data onunion status.
11
firm’s employees were union members.14 In much of our analysis we compare establishments
with any union employees (hereafter union establishments) with those employing no union
workers (nonunion establishments). As shown in the first row of the table, union establishments
constitute 6.5 percent of the unweighted sample and 20.9 percent of the employee-weighted
sample.15 In some analyses we divide the union establishments into two groups based on the
percentage of employees who are union members, using 50 percent as the cut-off point. The
figures in the table show that union establishments are split fairly evenly between these two
categories. Similar to the individual data, the figures show that union membership is quite
uncommon among employees of small establishments—fewer than 3 percent of firms with less
than 10 workers employ any union members—and increases steadily with establishment size.
Roughly one third of the establishments in the largest size category (250 or more employees)
have some union employees.
Ideally, in estimating the effect of unions on plan characteristics, we would like to
distinguish between effects operating within as well as across establishments. Unfortunately,
this is not possible since there is ambiguity in the data as to which types of workers are eligible
for which plans.16 Therefore, our plan-level analysis represents a comparison of plans offered by
14 The survey was administered to the person at each establishment most knowledgeable about
health benefits and firm and worker characteristics.15 The unionization rates in Table 2 are not directly comparable to the rates calculated using the
CPS data. The employee-weighted mean for the “percent union” variable is, however. For the fullsample it equals 10.2 percent, which is slightly less than the rate of 12.5 percent in the April 1993 CPSBenefit Supplement.
16 Two survey questions elicit broad information on within-establishment differences.Establishments that provide insurance and employ some union workers were asked if nonunion workerswere eligible for health benefits. A valid response is available for 65 percent of the relevant (unweighted)observations. Of this group, 94 percent answered that nonunion workers were eligible for benefits. Theserespondents were then asked whether there were differences in the health benefits offered to union andnonunion employees. Slightly less than half (48 percent) reported that there were differences. The surveyprovides no information on the exact nature of these differences.
12
union and nonunion establishments, controlling for employee and firm characteristics that vary at
the establishment level.17
IV. Results
Health Insurance for Active Employees
Table 3 lists union/nonunion differences in health insurance offers and receipt, estimated
using our CPS data.18 We provide the same decomposition as used by Farber and Levy (1999).
For years besides 1983, we are able to identify whether an individual’s employer offers health
insurance to any of its employees (“employer offers”), whether that employee is eligible for
coverage (“eligible”), and whether the employee chooses to accept coverage (“takeup”);
eligibility is defined conditional on employer offers, and takeup is defined conditional on offers
and eligibility. The coverage rate is the product of these three components:
Pr(covered)=Pr(employer offer)•Pr(eligible | offered)•Pr(takeup | offered, eligible).
In the table, we list the union and nonunion means for each outcome (e.g., the percentage
of individuals whose employer offers insurance), the unadjusted difference between the union
and nonunion means, and several adjusted estimates of the union/nonunion difference (the
“union effect”). The adjusted differences in the fourth column are the coefficients on a union
membership dummy variable from linear probability models that also include various individual
characteristics and industry dummies, as listed at the bottom of the table.19 The adjusted
union/nonunion differential from these regressions combines the effect of unionization on total
17 The data set provides information on whether each plan covers union employees. Since over
90 percent of establishments in the survey have no union employees, this variable is highly correlatedwith an indicator for whether the firm employs any union workers; the two variables yield similar results.
18 The results for 1995 are similar to those for 1997 and therefore are omitted.
13
compensation with an effect that relates to the union effect on the share of compensation
received in the form of health insurance. If we observed each worker’s total compensation, we
could separate these two effects. Data on total compensation is not available, but we observe
each worker’s cash wage. For the regression results reported in the fifth column, we added
ln(hourly wage).20 Regressions reported in the final column include 5 establishment size
dummies as explanatory variables (firm size information is unavailable in the 1997 data).
In the third column of Table 3, the unadjusted union/nonunion differences in health
insurance receipt range from 22 percentage points in 1988 and 1997 to 27 percentage points in
1983. In years for which we are able to perform our decomposition, differences in the
probability that employers offer insurance make a consistently large contribution to the
union/nonunion difference in coverage. When we control for individual characteristics and
industry in the fourth column, the union effects on all components of the decomposition are
reduced somewhat.
The inclusion of the hourly wage in the fifth column reduces the union effect, suggesting
that the effect estimated in the fourth column is due in part to the greater total compensation
received by union workers. Controlling for firm size (column six) further reduces the
union/nonunion gap.21 Although we are unable to control for establishment size in the 1997
data, the pattern over time in the union effect on outcomes is similar in columns five and six.
19 For all regressions with dichotomous dependent variables reported in this paper, we verified
that estimation of probits produces results that are similar to those from the linear probability model; weuse the latter for ease of interpretation.
20 The coefficients on the wage variable reflect two opposing forces: a compensating differentialeffect that produces a negative relationship between wages and fringe benefits, and an unobservedheterogeneity or productivity component that produces a positive relationship. The significant positivecoefficient on the wage that we obtain in most specifications suggests that the heterogeneity effectdominates. The important role of heterogeneity in this context is consistent with the simulation resultspresented by Hwang, Reed, and Hubbard (1992).
14
The union effect on offers and coverage rose between 1988 and 1993 and then remained
approximately constant or fell a bit. Most interesting is the sharply rising union effect on takeup
between 1988 and 1997. By 1997, the union effect on takeup was a bit larger than the union
effect on employer offers. This is consistent with the view that in addition to bargaining for
employer provision of health plans, unions bargain over various aspects of health plan quality,
and that the attractiveness of union plans relative to nonunion plans increased between 1988 and
1997.
Recall from Table 1 that between 1983 and 1997 health insurance coverage and union
membership among private sector workers fell by 8 and 9 percentage points, respectively. Based
on the results presented in Table 3, we can estimate what fraction of the decline in insurance
coverage is explained by the decline in unionization. Holding constant employee characteristics
other than wages, the decline in union membership explains 20 percent of the decline in
insurance coverage.22 When we also control for wages, the change in the union variable
accounts for 17 percent of the change in health insurance coverage between 1983 and 1997.
Table 4 presents additional regressions for the 1988 and 1993 CPS samples in which the
union effect is allowed to vary by establishment size.23 These results show that pooling workers
from all establishment sizes obscures large union effects for employees of smaller firms and
large changes over time in several of the outcomes. In both 1988 and 1993, the union effect on
21 When we reversed the order of inclusion for the wage variable and establishment size
dummies, we found in general that the inclusion of establishment size makes a larger marginalcontribution to the reduction in the union effect than does inclusion of the wage.
22 This intertemporal decomposition is done by comparing the actual change in insurancecoverage with the change that would have occurred if union membership had remained at 1983 levels.The counterfactual coverage rate is calculated using the regression coefficients and control variablemeans from the 1997 analysis and the 1983 sample mean for the union variable.
23Results for each year are based on a single regression in which we fully interact the union andestablishment size dummies. Standard errors for the union effects by size category are obtained through atransformation of the relevant F-test statistic.
15
insurance offers generally is restricted to establishments with fewer than 25 employees (with the
exception of a small but statistically significant effect for establishments with 50 to 99
employees in 1993). Among workers in the smallest size category, the effect on offers increased
considerably, from 15.8 percentage points in 1988 to 24.9 percentage points in 1993. As a result
of this change and smaller increases in eligibility and takeup, the union/nonunion difference in
insurance coverage among workers in the smallest establishment size category more than
doubled between 1988 and 1993.
In contrast to the results for offers, differences between union and nonunion workers in
takeup are not limited to the smallest firms. In the 1988 sample, the union effect on takeup is
between 4.5 and 5.0 percentage points for the first four size categories (up to 99 employees) and
a smaller but significant effect of 2.6 percentage points for workers in establishments with 100 to
249 employees. With one exception (the 50 to 99 category), the union effect on takeup increased
between 1988 and 1993. In 1993, the union effect on takeup was significant for all size
categories. As a result of these effects on takeup, we find that as of 1993 union workers in
establishments of all sizes were more likely to have employer-provided health insurance than
were nonunion workers.
Analysis of the RWJF establishment data provides further information regarding the
effect of unions on employer provision of health insurance. Table 5 compares health insurance
offer rates for union and nonunion establishments for the full RWJF sample and the sample
broken down by establishment size, using the same size categories used for the CPS samples in
Table 4. The results from the two data sets are quite similar. As in the individual data, the
establishment-level results indicate that the effect of unions on health insurance offers is most
pronounced for small establishments and essentially zero for large ones. Among establishments
16
with fewer than 10 workers, those with union employees are 21.4 percentage points more likely
to offer insurance than nonunion establishments with similar observed characteristics. This
matches fairly closely with the 24.9 percentage point effect on offers in the 1993 CPS data.
Although this effect is large, it is important to keep in mind that fewer than 3 percent of
establishments in this size grouping employ any union workers. The regression-adjusted
union/nonunion difference falls, both in magnitude and as a proportion of the unadjusted
difference, in each of the next two size categories, though it remains statistically significant at
conventional levels. At establishment with 50 employees or more, the adjusted union effect is
not significant.
In unreported regressions we split union establishments into two groups: those in which
the percent unionized was more than 50 percent and those in which the percent unionized was
positive but below 50 percent. Point estimates from these regressions suggest that the
probability a firm offers health insurance increases with the percentage of employees who are
union members, though differences between these two union categories are very small and not
statistically significant. Similarly, when we include separate variables indicating the presence of
union employees and the percent of the establishment’s employees who are union members, the
coefficient on the latter is statistically insignificant.
Employee Premium Contributions
We now turn to an examination of health plan characteristics, using the plan-level data
from the RWJF employer survey, and beginning with the employer’s premium contribution.
Specifically, we investigate union effects on the percentage share of single and family premiums
paid by employers. We use this share variable rather than a dollar-denominated measure because
variation in the latter is likely to reflect cost considerations that are unrelated to the influence of
17
unions, whereas the share variable is more likely to reflect the direct impact of union bargaining
power.
Our analysis is complicated by the distribution of the employer contribution variable.
The employer’s percentage share, S, is distributed as a continuous variable on the percentage
point interval [0,100], but a large fraction of the observations take on the maximum value of 100
(and a small fraction take on the minimum value of 0). The large density mass at the maximum
makes it difficult to choose an appropriate functional form for regression analysis and raises
concern that the results will be sensitive to specification.24 We therefore apply a semi-parametric
estimation approach that controls for establishment characteristics without imposing parametric
restrictions on the distribution of the dependent variable or the union effect.
This approach is an application of the technique developed by DiNardo, Fortin, and
Lemieux (1996) and applied by DiNardo and Lemieux (1997) to a problem similar to ours. We
want to compare the observed distribution of S in union establishments with the distribution that
would prevail in nonunion establishments if they had the same characteristics as union
establishments—i.e., the union effect conditional on the distribution of control variables. This is
achieved by reweighting the nonunion observations by p(U=1 | X)/(1-p(U=1 | X)), where p(U=1 |
X) is the probability that an establishment is unionized, conditional on characteristics X. This
technique works through assigning greater weight to nonunion observations that are similar to
union observations in terms of characteristics and lesser weight to nonunion observations that are
less similar to union observations in terms of characteristics. Whereas differences between the
unadjusted union and nonunion distributions are due to unionization and establishment
24 This setting may seem like a natural application for a Tobit model. However, unlike the classic
Tobit case, in which excess density mass arises from censoring, in our case S=100 is a meaningfuloutcome and limit that does not reflect censored measurement. Moreover, Tobit models may be biasedand inefficient in the presence of heteroscedasticity (Johnston and DiNardo 1997).
18
characteristics, differences between the unadjusted union distribution and the adjusted nonunion
distribution are due to unionization only. This approach is analogous to a Oaxaca (1973)
decomposition, except that our approach imposes no parametric restrictions on the relationship
between unionization and the outcome variable S. The conditional probabilities p(U=1 | X) can
be estimated through various means. We use a logit specification to obtain the appropriate fitted
probabilities. The vector of control variables X is the same set of control variables that was used
for analysis of union effects on employer offers (Table 5).
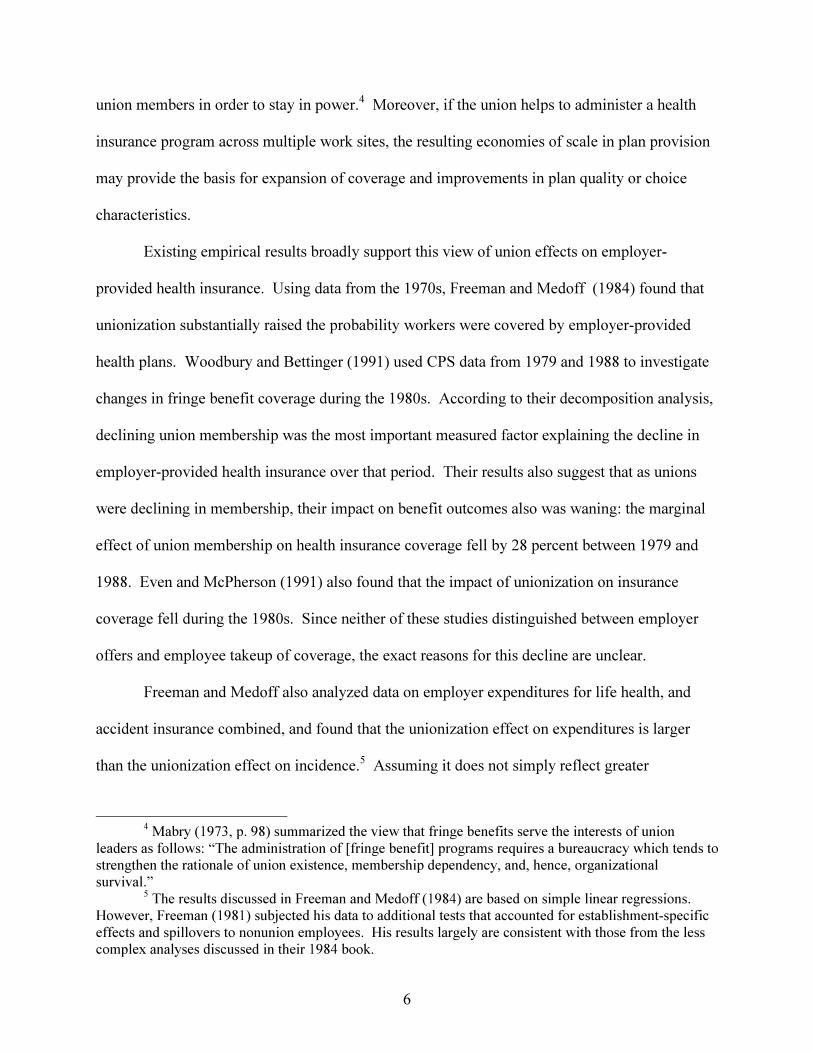
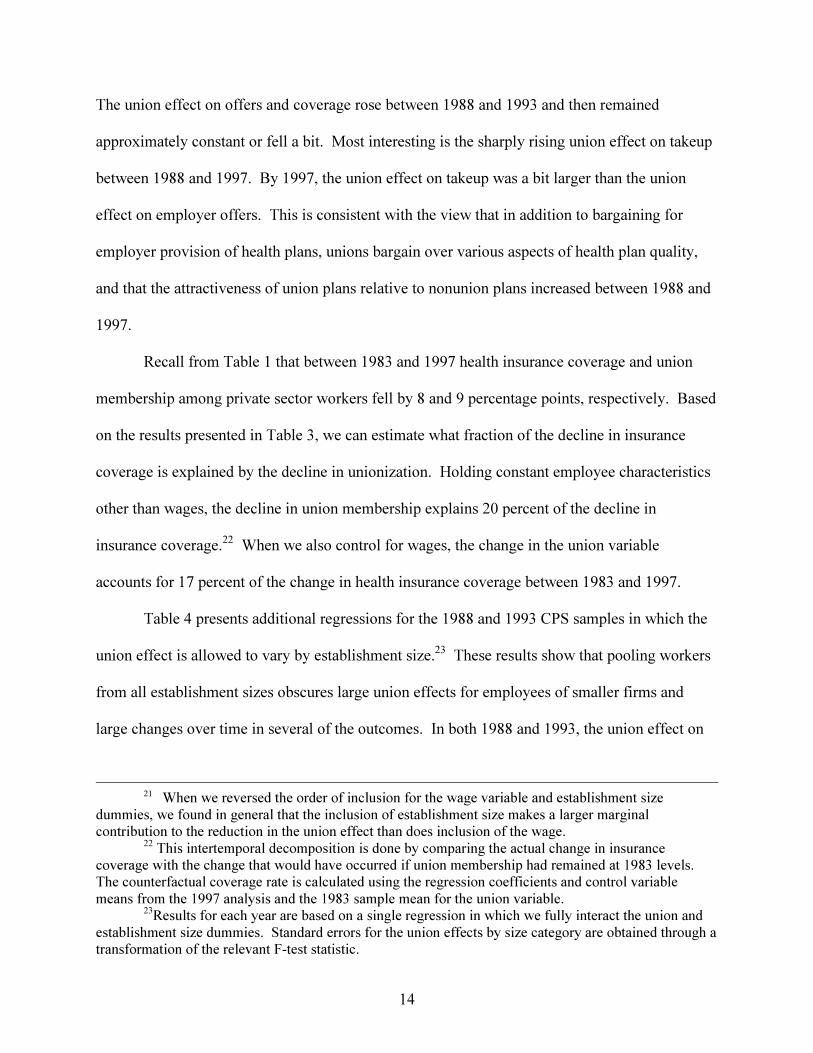
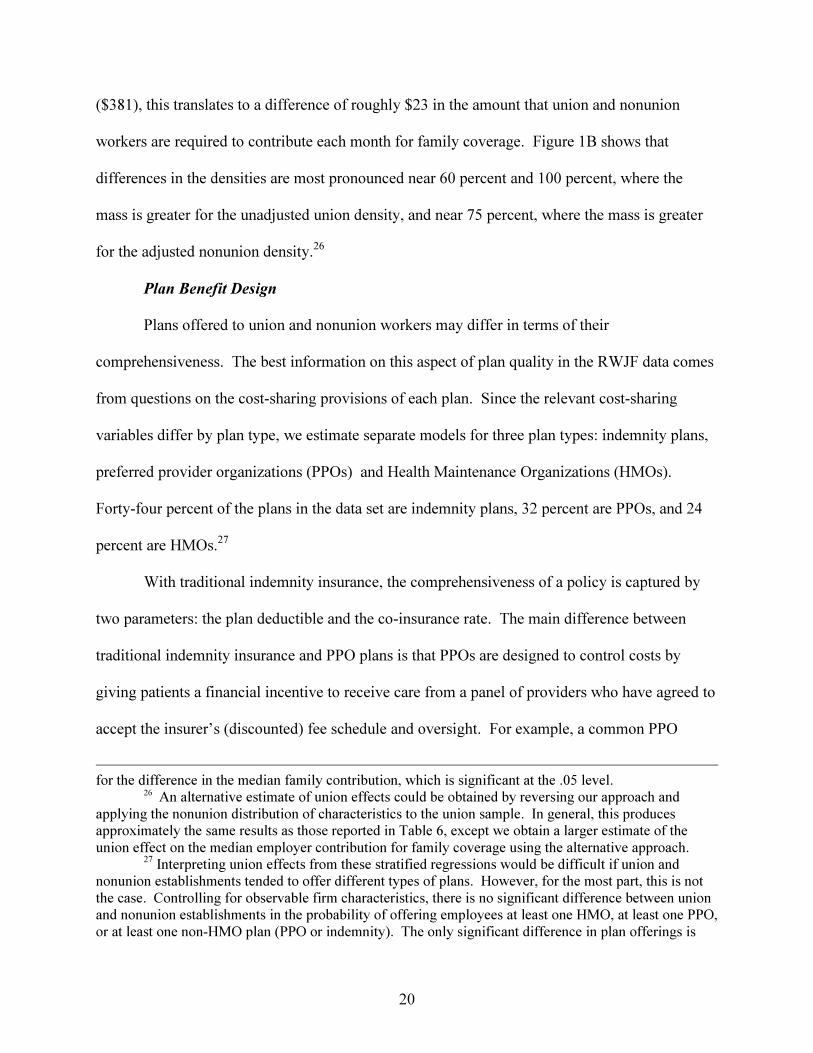
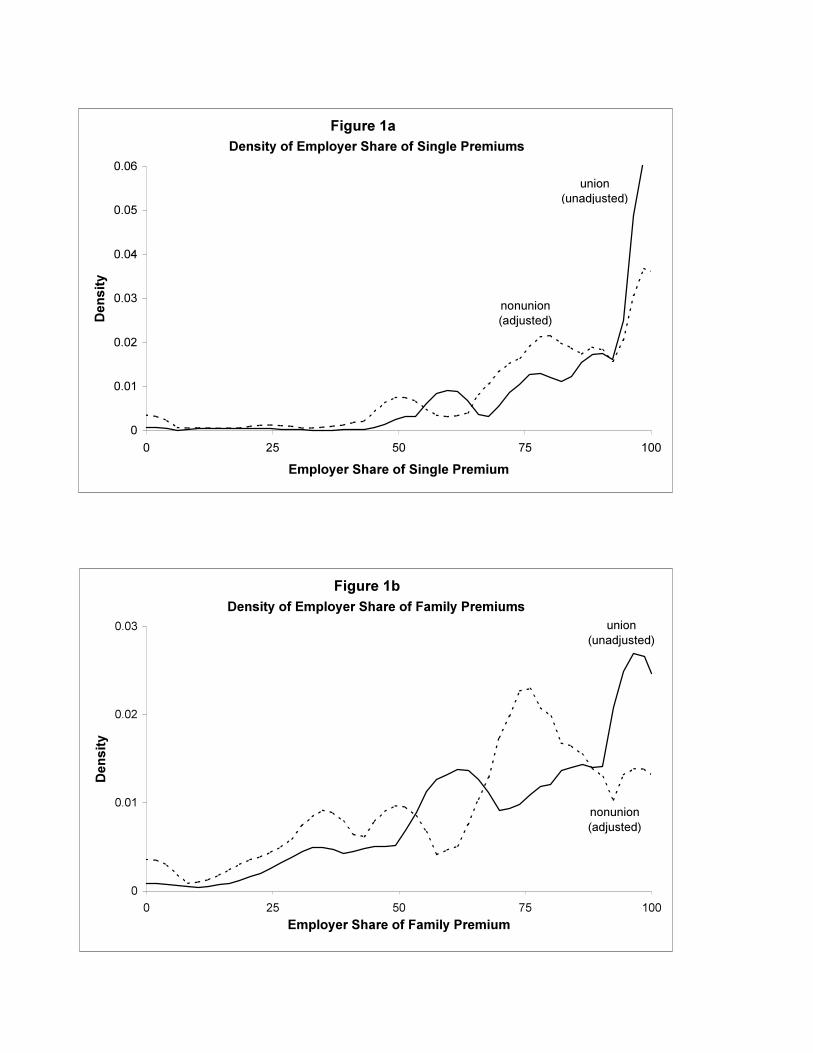
The results of this analysis are reported in Table 6 and Figure 1. The top panel of Table 6
presents results for union effects on employers’ share of single coverage premiums. The table
lists results for the unadjusted union and nonunion distributions of S and the nonunion
distribution adjusted for differences in establishment characteristics. The results reported include
the mean and median of S along with the percentage of employers that pay full cost (S=100).
Consistent with previous studies using data from the 1970s (Goldstein and Pauly 1976; Freeman
and Medoff 1984), the results indicate strong effects of unionization on the generosity of
employer premium contributions. On an unadjusted basis, plans offered by union establishments
are 12 percentage points more likely to be fully financed by employers (49.4 percent vs. 37.4
percent), and the mean and median employer share both are noticeably larger in unionized
establishments.
Controlling for establishment characteristics increases the size of the union/nonunion
differential in employer contributions for single coverage. Conditional on establishment
characteristics, plans offered by union establishments are about 20 percentage points more likely
19
to be fully financed by employers (49.4 percent vs. 29.6 percent).25 The difference in the median
value of S between plans offered by union and nonunion establishments is 13 points (98 vs. 85).
Because of the way S is truncated, the mean difference is somewhat smaller (8.6 percentage
points). To put these differences in perspective, the median and mean premiums for single
coverage in the RWJF data set are $148 and $157 per month, respectively. Thus, the 13
percentage point difference in the median values of S implies that union workers pay roughly
$20 less per month for single coverage than nonunion employees; the difference of 8.6
percentage points in the means of S implies a difference of about $13. These differences are
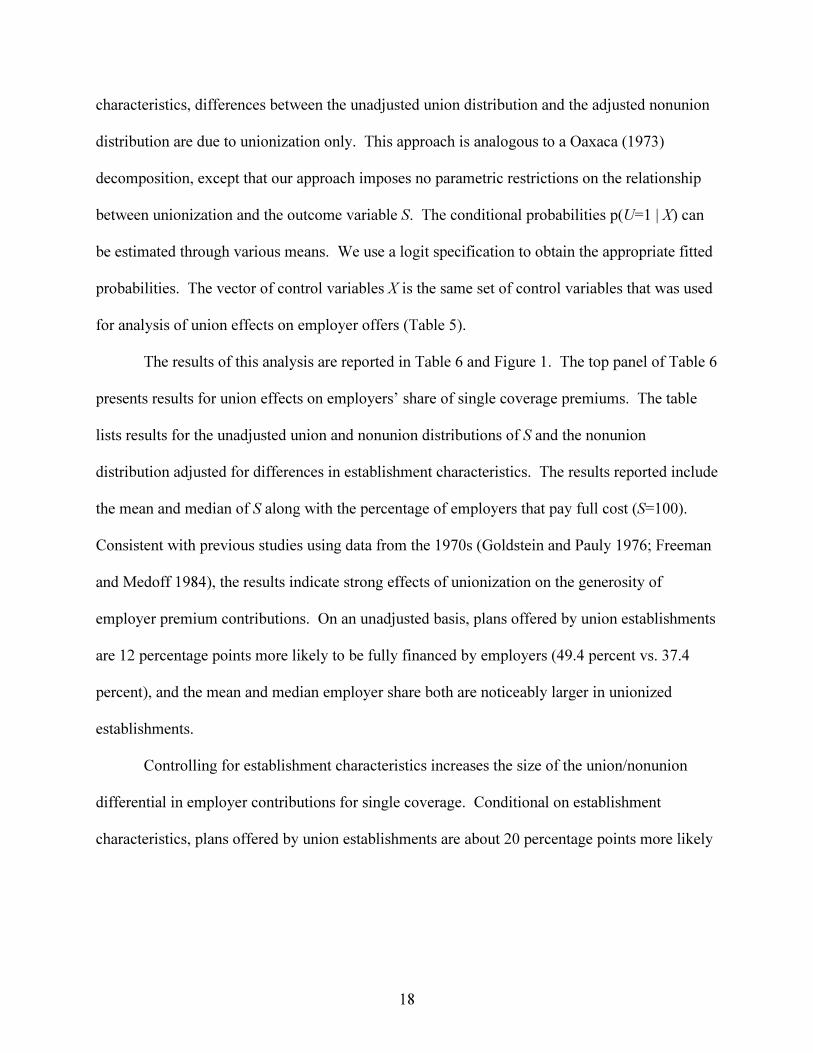
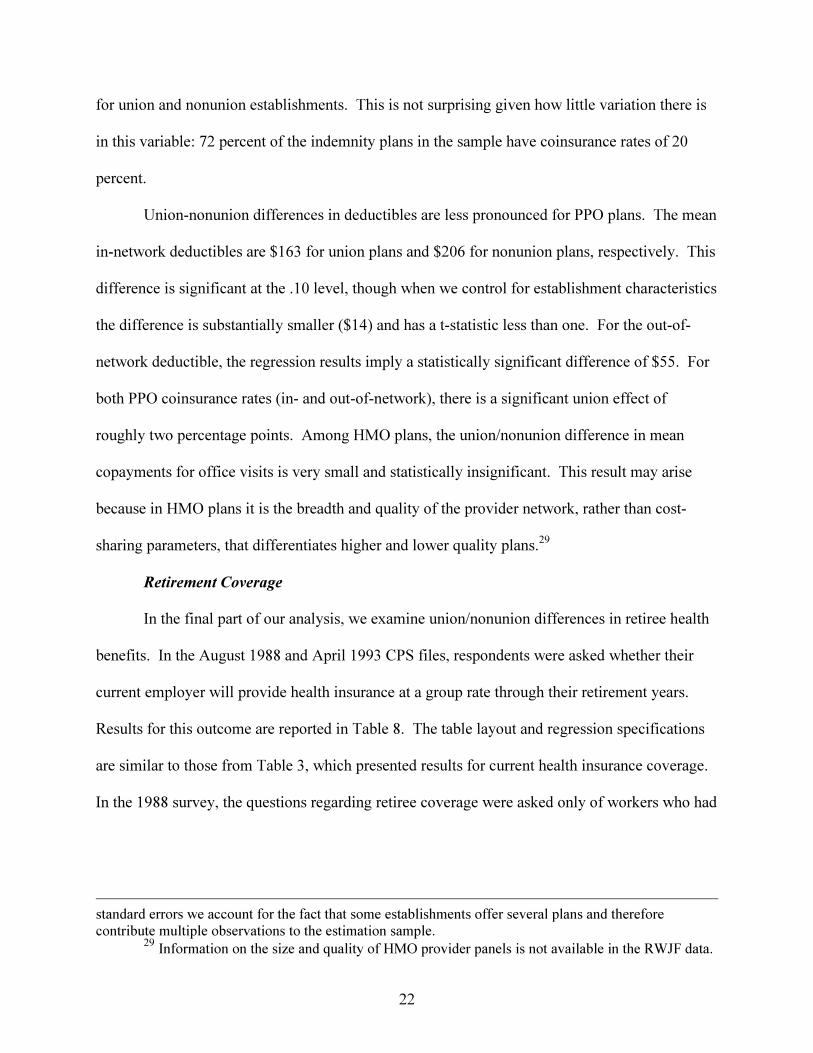
visually displayed in Figure 1A, where we plot the actual distribution of the employer’s share of
premiums for single coverage for plans offered by union establishments and the distribution for
nonunion plans adjusted for establishment characteristics. The biggest difference between the
two densities is near employer contributions of 75-80 percent, where the mass is greater for the
adjusted nonunion density, and 100 percent, where the mass is greater for the union density;
union/nonunion differences at lower values of S are less pronounced.
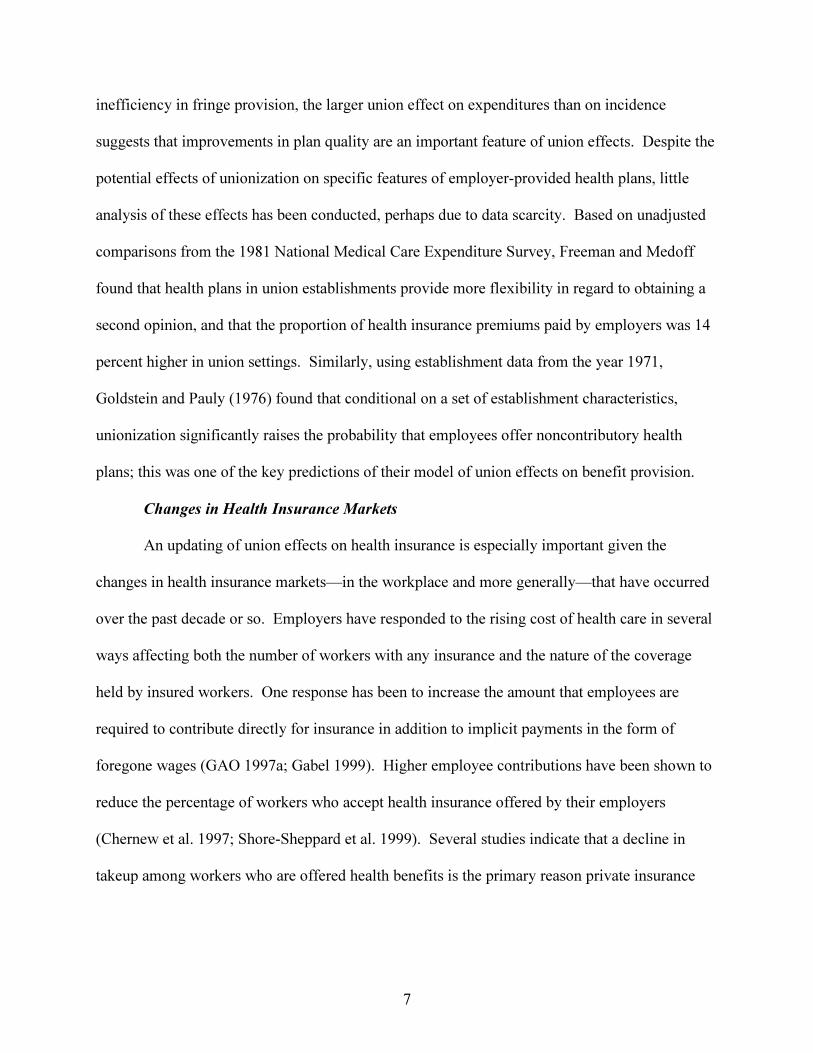
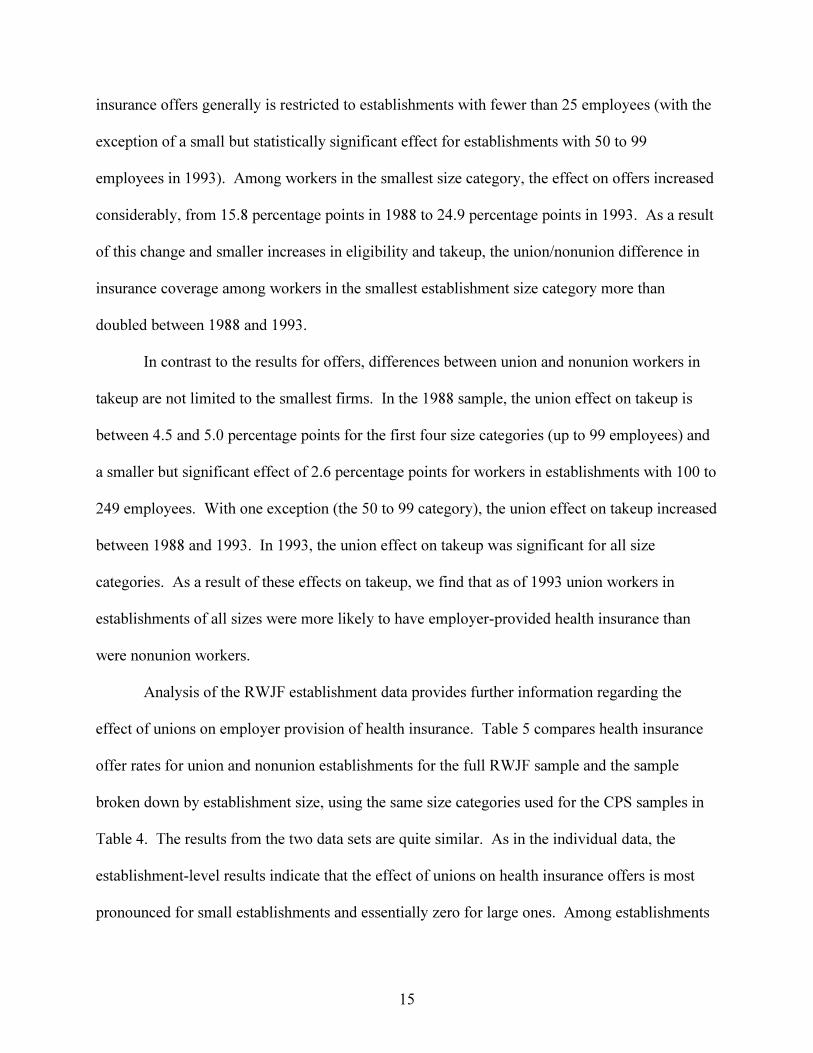
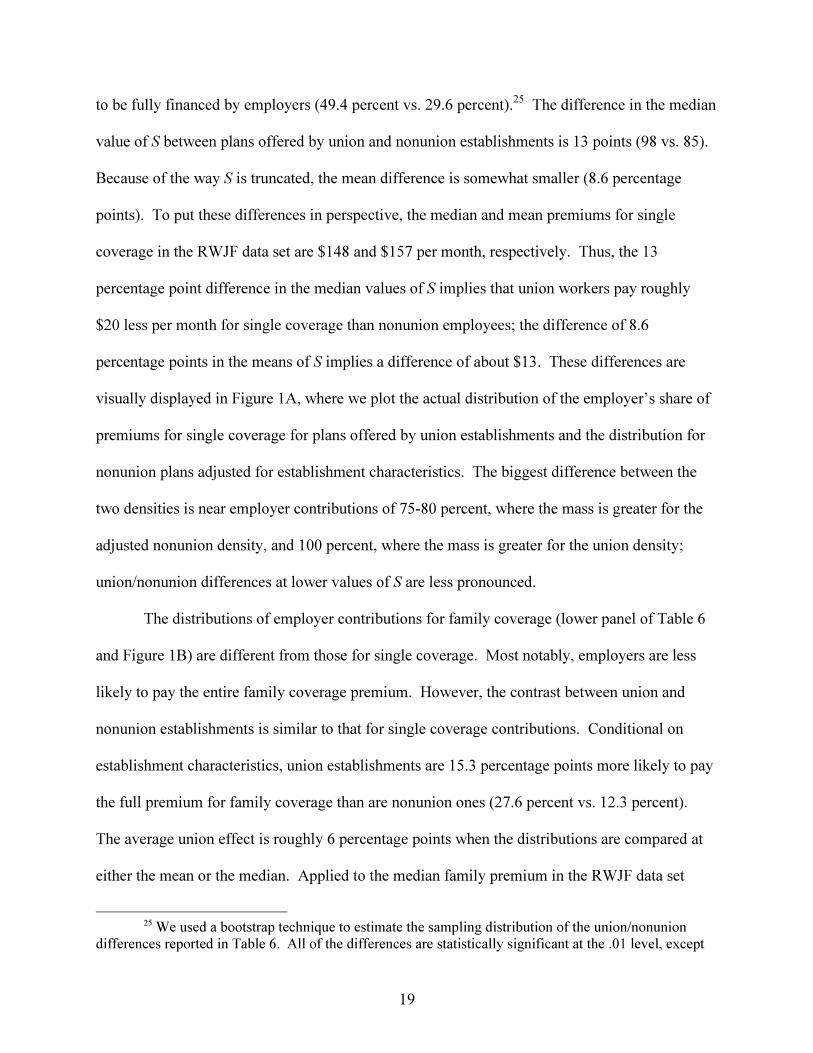
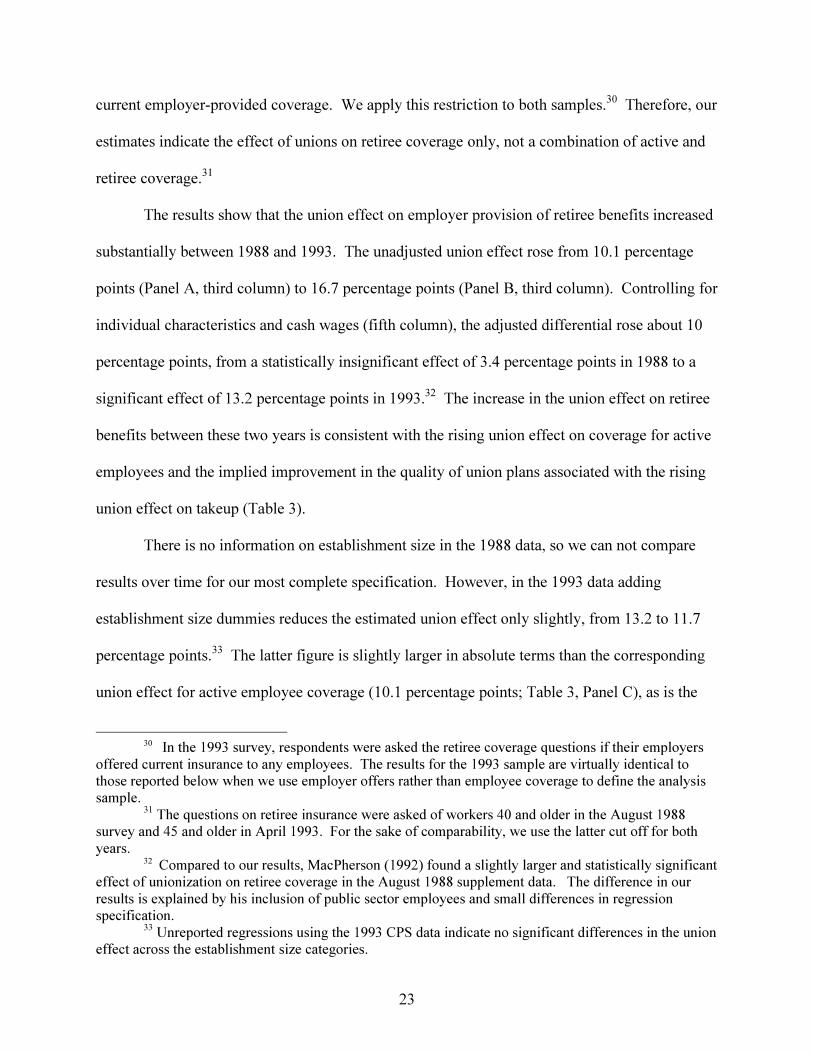
The distributions of employer contributions for family coverage (lower panel of Table 6
and Figure 1B) are different from those for single coverage. Most notably, employers are less
likely to pay the entire family coverage premium. However, the contrast between union and
nonunion establishments is similar to that for single coverage contributions. Conditional on
establishment characteristics, union establishments are 15.3 percentage points more likely to pay
the full premium for family coverage than are nonunion ones (27.6 percent vs. 12.3 percent).
The average union effect is roughly 6 percentage points when the distributions are compared at
either the mean or the median. Applied to the median family premium in the RWJF data set
25 We used a bootstrap technique to estimate the sampling distribution of the union/nonunion
differences reported in Table 6. All of the differences are statistically significant at the .01 level, except
20
($381), this translates to a difference of roughly $23 in the amount that union and nonunion
workers are required to contribute each month for family coverage. Figure 1B shows that
differences in the densities are most pronounced near 60 percent and 100 percent, where the
mass is greater for the unadjusted union density, and near 75 percent, where the mass is greater
for the adjusted nonunion density.26
Plan Benefit Design
Plans offered to union and nonunion workers may differ in terms of their
comprehensiveness. The best information on this aspect of plan quality in the RWJF data comes
from questions on the cost-sharing provisions of each plan. Since the relevant cost-sharing
variables differ by plan type, we estimate separate models for three plan types: indemnity plans,
preferred provider organizations (PPOs) and Health Maintenance Organizations (HMOs).
Forty-four percent of the plans in the data set are indemnity plans, 32 percent are PPOs, and 24
percent are HMOs.27
With traditional indemnity insurance, the comprehensiveness of a policy is captured by
two parameters: the plan deductible and the co-insurance rate. The main difference between
traditional indemnity insurance and PPO plans is that PPOs are designed to control costs by
giving patients a financial incentive to receive care from a panel of providers who have agreed to
accept the insurer’s (discounted) fee schedule and oversight. For example, a common PPO
for the difference in the median family contribution, which is significant at the .05 level.26 An alternative estimate of union effects could be obtained by reversing our approach and
applying the nonunion distribution of characteristics to the union sample. In general, this producesapproximately the same results as those reported in Table 6, except we obtain a larger estimate of theunion effect on the median employer contribution for family coverage using the alternative approach.
27 Interpreting union effects from these stratified regressions would be difficult if union andnonunion establishments tended to offer different types of plans. However, for the most part, this is notthe case. Controlling for observable firm characteristics, there is no significant difference between unionand nonunion establishments in the probability of offering employees at least one HMO, at least one PPO,or at least one non-HMO plan (PPO or indemnity). The only significant difference in plan offerings is
21
design might require patients who receive their care in the network and who have met their
deductible to pay 10 percent of the cost, whereas those seeing “out-of-network” providers will
have to pay 30 percent (after the deductible). Thus, for PPOs we examine union/nonunion
differences in deductibles and coinsurance rates for both in- and out-of-network care. HMOs
require less cost-sharing by patients than PPOs or traditional indemnity plans but place greater
restrictions on which providers they can see. In the typical HMO, patients face no deductible
and are charged a fixed dollar amount (usually between $5 and $25) per physician visit. We use
the office visit copayment as the cost-sharing outcome for HMO plans.
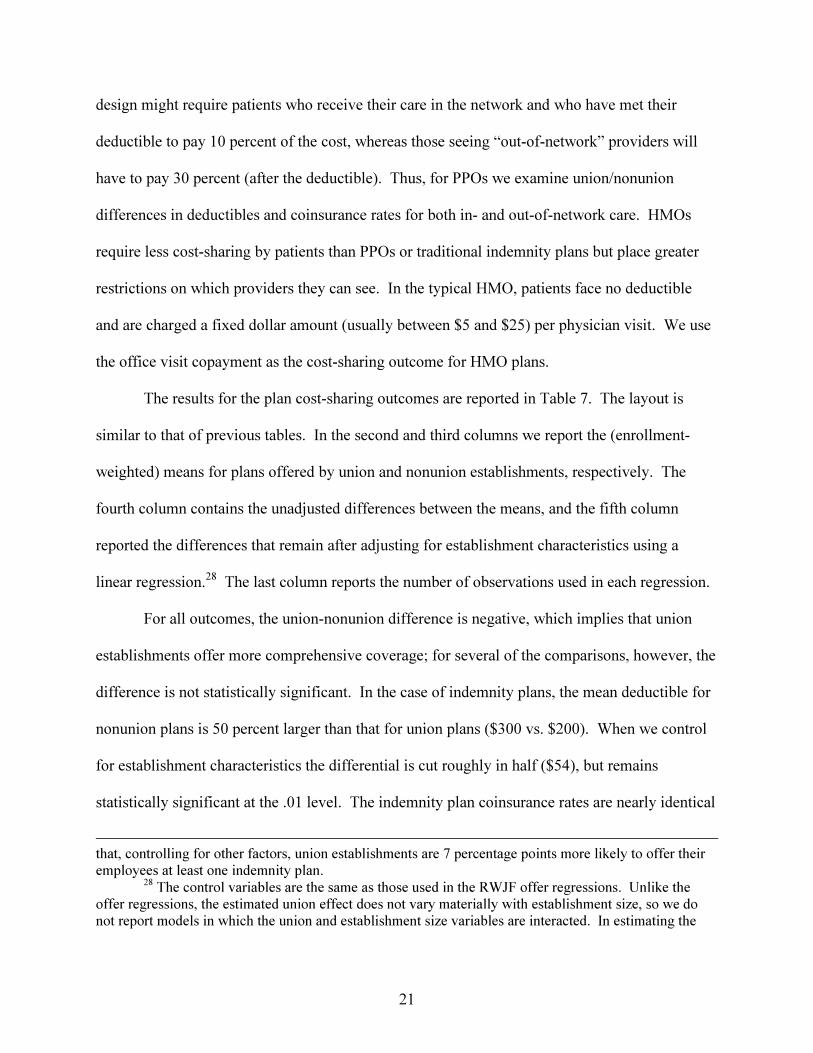
The results for the plan cost-sharing outcomes are reported in Table 7. The layout is
similar to that of previous tables. In the second and third columns we report the (enrollment-
weighted) means for plans offered by union and nonunion establishments, respectively. The
fourth column contains the unadjusted differences between the means, and the fifth column
reported the differences that remain after adjusting for establishment characteristics using a
linear regression.28 The last column reports the number of observations used in each regression.
For all outcomes, the union-nonunion difference is negative, which implies that union
establishments offer more comprehensive coverage; for several of the comparisons, however, the
difference is not statistically significant. In the case of indemnity plans, the mean deductible for
nonunion plans is 50 percent larger than that for union plans ($300 vs. $200). When we control
for establishment characteristics the differential is cut roughly in half ($54), but remains
statistically significant at the .01 level. The indemnity plan coinsurance rates are nearly identical
that, controlling for other factors, union establishments are 7 percentage points more likely to offer theiremployees at least one indemnity plan.
28 The control variables are the same as those used in the RWJF offer regressions. Unlike theoffer regressions, the estimated union effect does not vary materially with establishment size, so we donot report models in which the union and establishment size variables are interacted. In estimating the
22
for union and nonunion establishments. This is not surprising given how little variation there is
in this variable: 72 percent of the indemnity plans in the sample have coinsurance rates of 20
percent.
Union-nonunion differences in deductibles are less pronounced for PPO plans. The mean
in-network deductibles are $163 for union plans and $206 for nonunion plans, respectively. This
difference is significant at the .10 level, though when we control for establishment characteristics
the difference is substantially smaller ($14) and has a t-statistic less than one. For the out-of-
network deductible, the regression results imply a statistically significant difference of $55. For
both PPO coinsurance rates (in- and out-of-network), there is a significant union effect of
roughly two percentage points. Among HMO plans, the union/nonunion difference in mean
copayments for office visits is very small and statistically insignificant. This result may arise
because in HMO plans it is the breadth and quality of the provider network, rather than cost-
sharing parameters, that differentiates higher and lower quality plans.29
Retirement Coverage
In the final part of our analysis, we examine union/nonunion differences in retiree health
benefits. In the August 1988 and April 1993 CPS files, respondents were asked whether their
current employer will provide health insurance at a group rate through their retirement years.
Results for this outcome are reported in Table 8. The table layout and regression specifications
are similar to those from Table 3, which presented results for current health insurance coverage.
In the 1988 survey, the questions regarding retiree coverage were asked only of workers who had
standard errors we account for the fact that some establishments offer several plans and thereforecontribute multiple observations to the estimation sample.
29 Information on the size and quality of HMO provider panels is not available in the RWJF data.
23
current employer-provided coverage. We apply this restriction to both samples.30 Therefore, our
estimates indicate the effect of unions on retiree coverage only, not a combination of active and
retiree coverage.31
The results show that the union effect on employer provision of retiree benefits increased
substantially between 1988 and 1993. The unadjusted union effect rose from 10.1 percentage
points (Panel A, third column) to 16.7 percentage points (Panel B, third column). Controlling for
individual characteristics and cash wages (fifth column), the adjusted differential rose about 10
percentage points, from a statistically insignificant effect of 3.4 percentage points in 1988 to a
significant effect of 13.2 percentage points in 1993.32 The increase in the union effect on retiree
benefits between these two years is consistent with the rising union effect on coverage for active
employees and the implied improvement in the quality of union plans associated with the rising
union effect on takeup (Table 3).
There is no information on establishment size in the 1988 data, so we can not compare
results over time for our most complete specification. However, in the 1993 data adding
establishment size dummies reduces the estimated union effect only slightly, from 13.2 to 11.7
percentage points.33 The latter figure is slightly larger in absolute terms than the corresponding
union effect for active employee coverage (10.1 percentage points; Table 3, Panel C), as is the
30 In the 1993 survey, respondents were asked the retiree coverage questions if their employers
offered current insurance to any employees. The results for the 1993 sample are virtually identical tothose reported below when we use employer offers rather than employee coverage to define the analysissample.
31 The questions on retiree insurance were asked of workers 40 and older in the August 1988survey and 45 and older in April 1993. For the sake of comparability, we use the latter cut off for bothyears.
32 Compared to our results, MacPherson (1992) found a slightly larger and statistically significanteffect of unionization on retiree coverage in the August 1988 supplement data. The difference in ourresults is explained by his inclusion of public sector employees and small differences in regressionspecification.
33 Unreported regressions using the 1993 CPS data indicate no significant differences in the unioneffect across the establishment size categories.
24
implied effect in adjusted terms. Relative to the average incidence of retirement coverage for
nonunion employees, unions raise the incidence of retirement coverage by 20 percent
(.117/.513), compared to a 16 percent (.101/.624) effect on coverage for active employees.
The 1993 CPS Benefits Supplement provides additional information on retiree health
benefits beyond whether employers provide the benefit throughout respondents’ retirement
years. Respondents were asked whether their employer will provide health insurance at a group
rate at least until the respondent becomes eligible for Medicare at age 65. We combined this
variable with the variable indicating coverage throughout their retirement years to form a “pre-
Medicare coverage” variable, which takes the value one if retiree coverage will be provided at
least until Medicare eligibility and zero otherwise. Respondents also were asked whether they
expect that their employer will pay the full cost of retiree coverage; the analysis sample for this
variable is restricted to individuals whose employers offer retiree coverage.34 Panel B of Table 8
lists estimates of the union effect on these outcomes in the 1993 CPS. The unadjusted
union/nonunion difference in pre-Medicare coverage is about 17 percentage points, and the
adjusted difference (controlling for wages and establishment size) is a bit over half that, though
still statistically significant. In addition, on an unadjusted basis union employees are about twice
as likely as nonunion employees to be eligible for a retirement health plan for which their
employer pays the full cost; the adjusted differences are nearly as large.
The RWJF establishment survey also asked about employer-provided retiree health
benefits; regressions from that data set offer additional evidence on the topic and a check on the
CPS results. Table 9 displays the effect of unions on the provision of retiree health benefits in
34 The sample for the employer cost variable is reduced further by “don’t know” and missing
responses. The 1993 CPS file also indicates whether the respondent expects her employer to pay part ofthe cost of retiree coverage. We found no significant union effect on this outcome, perhaps because it isso broad as to be largely non-informative with respect to the generosity of employer fringe programs.
25
the RWJF data. The layout is similar to Table 5, with one exception: because the sample size is
reduced by restriction of the retiree coverage sample to establishments that offer health insurance
to active employees, we report the sample sizes in the first column. The figures in the first row
show that 56 percent of union establishments and 31 percent of nonunion establishments that
offer health insurance to active employees also offer retiree health benefits, implying an
unadjusted union effect of 25 percentage points. Controlling for observable firm and worker
characteristics reduces the union effect to 7.7 percentage points. This is much larger than the
adjusted union effect on coverage for active employees in the RWJF data (1.8 percentage points;
Table 5). Moreover, compared to union effects on coverage for active employees that were
small and insignificant in establishments with 50 or more employees, the union effect on retiree
benefits is fairly large and statistically significant for all but the very largest establishment size
category. Overall, we find relatively large and consistent union effects on employer provision of
retiree health benefits in our 1993 individual and establishment data.35
V. Conclusions
The collective-voice role of unions suggests the likelihood of large union effects on
fringe benefits such as health insurance. Prior studies found positive union effects on the
provision of employer-provided health insurance and expenditures on it. Most of this research,
however, was based on data from the 1970s and early 1980s. Since then, there has been a
gradual decline in union membership and significant changes in the U.S. health care delivery
system. These changes suggest the need for updated analysis of union impacts on the extent and
35
We also estimated models that account for differences among unionized establishments by
replacing the single union dummy with two indicator variables denoting establishments in which fewer orgreater than one-half of the employees are union members. Although we do not report these results in a
26
form of employer-provided health insurance, using data that are recent and also enable analysis
of outcomes beyond whether or not workers have insurance coverage.
In this paper we used individual and establishment data to estimate union effects on
employer-provided insurance for active employees and retirees. Using the individual data we
decomposed the effect of union membership on health insurance coverage into effects on
intermediate outcomes that determine coverage: employer offers, individual employee eligibility,
and employee takeup. We found that union effects on these outcomes vary by establishment
size. In very small firms unions appear to focus on getting employers to provide any insurance at
all. For workers in firms with fewer than 25 employees, we found large and significant union
effects on employer offers of insurance. This effect, which increased between 1988 and 1993, is
the most important factor explaining the large difference in insurance coverage between union
and nonunion workers in very small firms.
In contrast, provision of health insurance is essentially universal among firms with more
than 100 employees, and offer rates are quite high among firms with 50 to 99 workers. Thus, in
larger firms union efforts with respect to health insurance will focus on how much employees are
required to pay for their coverage. Using the RWJF establishment data, we found that
unionization substantially reduces workers’ required premium payments in all plan types and
workers’ required cost-sharing payments in indemnity and PPO plans. These results on
employee cost sharing are consistent with our finding from the CPS of a significant positive
effect of union membership on the probability that workers accept (takeup) insurance offered by
their employers. The union takeup effect holds for all establishment size categories, and it
table, we found that the union effect on retiree health coverage is significantly larger in majority-unionestablishments than it is in minority-union establishments.

27
became more pronounced between 1988 and 1997, at the same time that the market for health
insurance was being transformed.
Both the CPS and RWJF data also enable examination of the determinants of post-
retirement health insurance coverage. Consistent with the “collective-voice” hypothesis, which
predicts that unions will respond more to the preferences of older workers, we find larger union
effects on retiree coverage than on coverage for current employees, especially in our RWJF
establishment data. In the CPS data, the union effect on the probability that employers pay the
full cost of retiree coverage is particularly large. The union effect on retiree coverage grew
substantially between 1988 and 1993, at the same time that the union effect on coverage for
current employees was growing. Moreover, while union effects on active employee coverage are
limited to small firms (since nearly all firms with more than 50 employees offer insurance), our
RWJF results indicate that unions raise access to retiree health benefits in firms of all sizes.
These results are quantitatively important and have implications for the changing
provision of health insurance for workers and retirees. Our estimates suggest that declining
unionization explains about 17-20 percent of the decrease in employer-provided health insurance
among private sector employees during the period 1983-97. This is comparable to the
contribution of declining unionization to the rise in male earnings inequality during the 1980s
(Fortin and Lemieux 1997). The union effect on retiree coverage is even larger than the effect on
current coverage, and declining unionization is likely to explain an even larger share of declining
retiree benefits. The associated decline in health insurance for the elderly suggests that public
resources for elderly care may become increasingly strained as current and future generations of
workers retire, unless expansion of collective bargaining or other means are used to encourage
private provision of retiree health benefits.
28
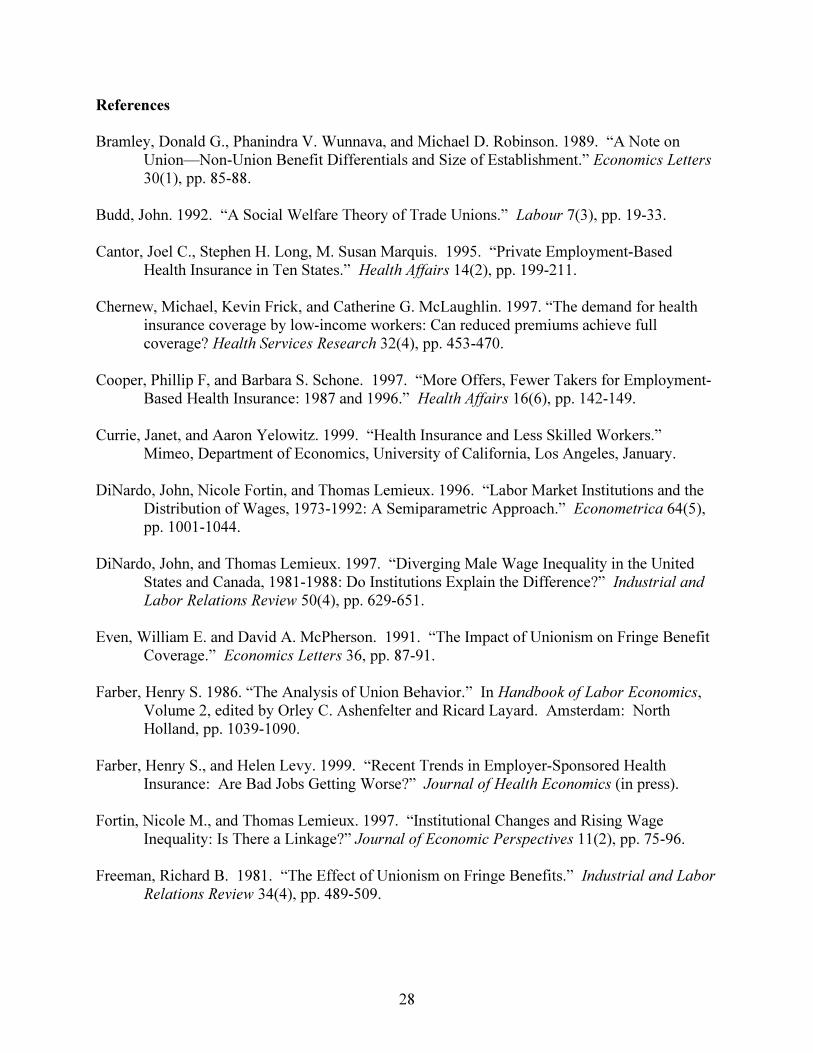
References
Bramley, Donald G., Phanindra V. Wunnava, and Michael D. Robinson. 1989. “A Note onUnion—Non-Union Benefit Differentials and Size of Establishment.” Economics Letters
30(1), pp. 85-88.
Budd, John. 1992. “A Social Welfare Theory of Trade Unions.” Labour 7(3), pp. 19-33.
Cantor, Joel C., Stephen H. Long, M. Susan Marquis. 1995. “Private Employment-BasedHealth Insurance in Ten States.” Health Affairs 14(2), pp. 199-211.
Chernew, Michael, Kevin Frick, and Catherine G. McLaughlin. 1997. “The demand for healthinsurance coverage by low-income workers: Can reduced premiums achieve fullcoverage? Health Services Research 32(4), pp. 453-470.
Cooper, Phillip F, and Barbara S. Schone. 1997. “More Offers, Fewer Takers for Employment-Based Health Insurance: 1987 and 1996.” Health Affairs 16(6), pp. 142-149.
Currie, Janet, and Aaron Yelowitz. 1999. “Health Insurance and Less Skilled Workers.”Mimeo, Department of Economics, University of California, Los Angeles, January.
DiNardo, John, Nicole Fortin, and Thomas Lemieux. 1996. “Labor Market Institutions and theDistribution of Wages, 1973-1992: A Semiparametric Approach.” Econometrica 64(5),pp. 1001-1044.
DiNardo, John, and Thomas Lemieux. 1997. “Diverging Male Wage Inequality in the UnitedStates and Canada, 1981-1988: Do Institutions Explain the Difference?” Industrial and
Labor Relations Review 50(4), pp. 629-651.
Even, William E. and David A. McPherson. 1991. “The Impact of Unionism on Fringe BenefitCoverage.” Economics Letters 36, pp. 87-91.
Farber, Henry S. 1986. “The Analysis of Union Behavior.” In Handbook of Labor Economics,Volume 2, edited by Orley C. Ashenfelter and Ricard Layard. Amsterdam: NorthHolland, pp. 1039-1090.
Farber, Henry S., and Helen Levy. 1999. “Recent Trends in Employer-Sponsored HealthInsurance: Are Bad Jobs Getting Worse?” Journal of Health Economics (in press).
Fortin, Nicole M., and Thomas Lemieux. 1997. “Institutional Changes and Rising WageInequality: Is There a Linkage?” Journal of Economic Perspectives 11(2), pp. 75-96.
Freeman, Richard B. 1981. “The Effect of Unionism on Fringe Benefits.” Industrial and Labor
Relations Review 34(4), pp. 489-509.
29
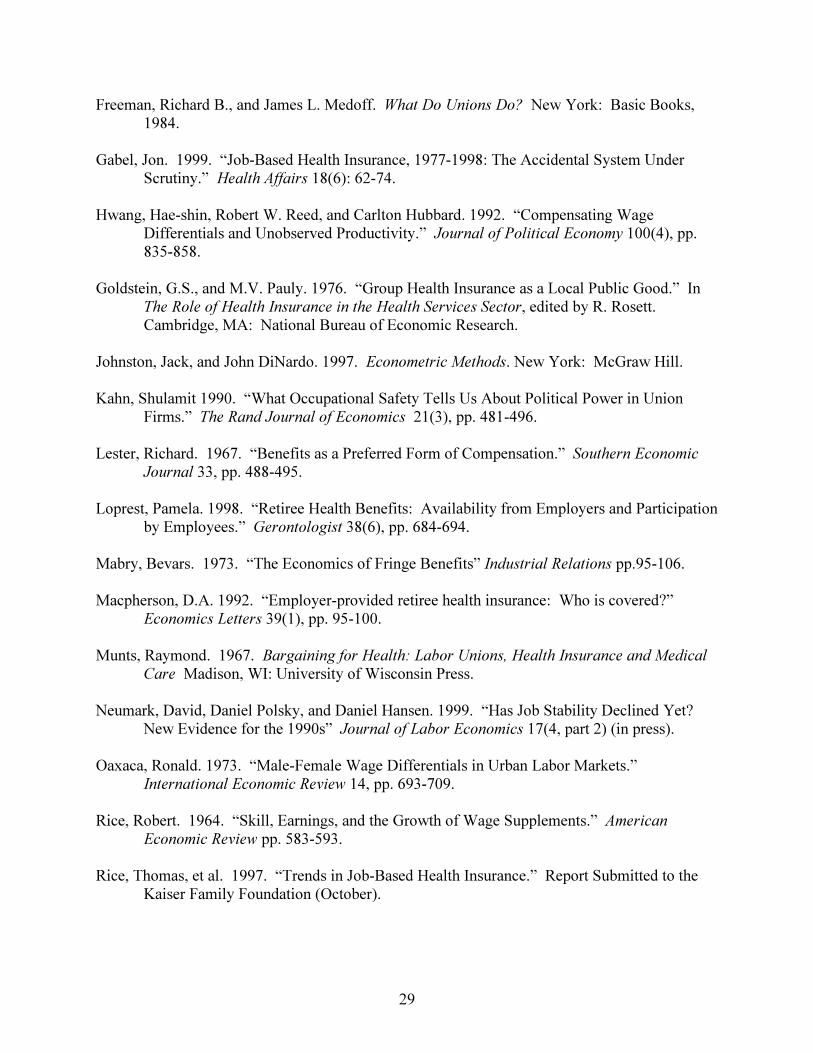
Freeman, Richard B., and James L. Medoff. What Do Unions Do? New York: Basic Books,1984.
Gabel, Jon. 1999. “Job-Based Health Insurance, 1977-1998: The Accidental System UnderScrutiny.” Health Affairs 18(6): 62-74.
Hwang, Hae-shin, Robert W. Reed, and Carlton Hubbard. 1992. “Compensating WageDifferentials and Unobserved Productivity.” Journal of Political Economy 100(4), pp.835-858.
Goldstein, G.S., and M.V. Pauly. 1976. “Group Health Insurance as a Local Public Good.” InThe Role of Health Insurance in the Health Services Sector, edited by R. Rosett.Cambridge, MA: National Bureau of Economic Research.
Johnston, Jack, and John DiNardo. 1997. Econometric Methods. New York: McGraw Hill.
Kahn, Shulamit 1990. “What Occupational Safety Tells Us About Political Power in UnionFirms.” The Rand Journal of Economics 21(3), pp. 481-496.
Lester, Richard. 1967. “Benefits as a Preferred Form of Compensation.” Southern Economic
Journal 33, pp. 488-495.
Loprest, Pamela. 1998. “Retiree Health Benefits: Availability from Employers and Participationby Employees.” Gerontologist 38(6), pp. 684-694.
Mabry, Bevars. 1973. “The Economics of Fringe Benefits” Industrial Relations pp.95-106.
Macpherson, D.A. 1992. “Employer-provided retiree health insurance: Who is covered?”Economics Letters 39(1), pp. 95-100.
Munts, Raymond. 1967. Bargaining for Health: Labor Unions, Health Insurance and Medical
Care Madison, WI: University of Wisconsin Press.
Neumark, David, Daniel Polsky, and Daniel Hansen. 1999. “Has Job Stability Declined Yet?New Evidence for the 1990s” Journal of Labor Economics 17(4, part 2) (in press).
Oaxaca, Ronald. 1973. “Male-Female Wage Differentials in Urban Labor Markets.”International Economic Review 14, pp. 693-709.
Rice, Robert. 1964. “Skill, Earnings, and the Growth of Wage Supplements.” American
Economic Review pp. 583-593.
Rice, Thomas, et al. 1997. “Trends in Job-Based Health Insurance.” Report Submitted to theKaiser Family Foundation (October).
30
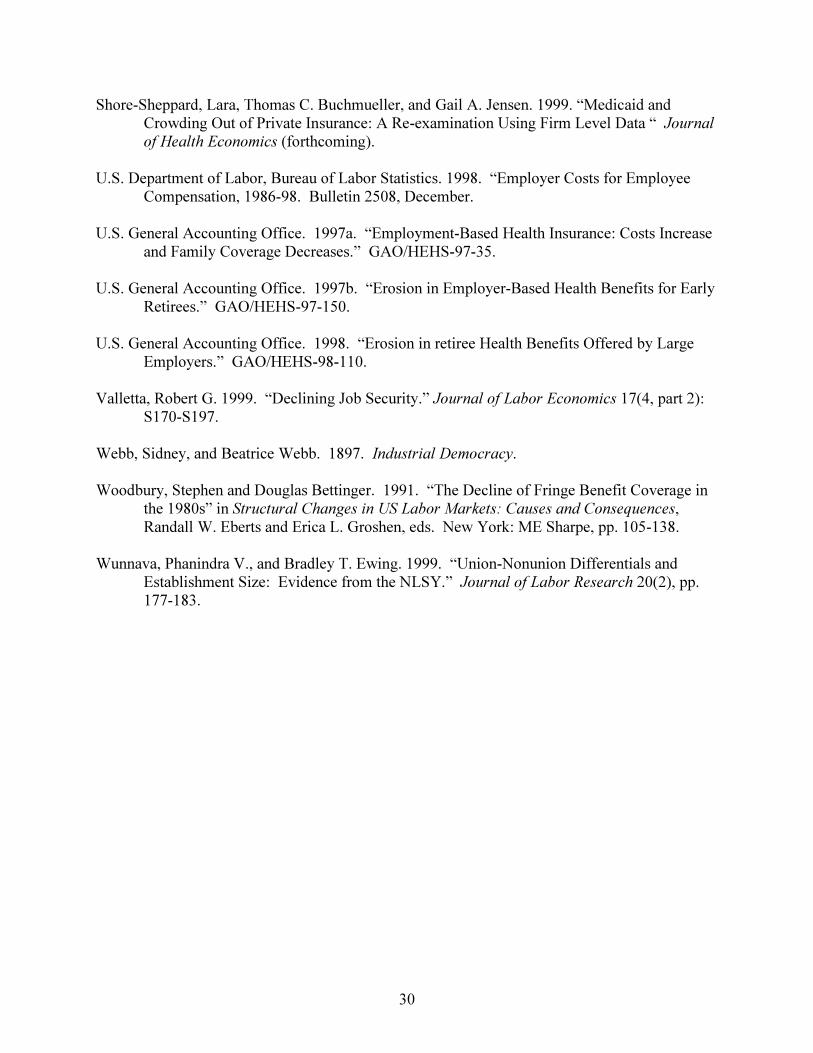
Shore-Sheppard, Lara, Thomas C. Buchmueller, and Gail A. Jensen. 1999. “Medicaid andCrowding Out of Private Insurance: A Re-examination Using Firm Level Data “ Journal
of Health Economics (forthcoming).
U.S. Department of Labor, Bureau of Labor Statistics. 1998. “Employer Costs for EmployeeCompensation, 1986-98. Bulletin 2508, December.
U.S. General Accounting Office. 1997a. “Employment-Based Health Insurance: Costs Increaseand Family Coverage Decreases.” GAO/HEHS-97-35.
U.S. General Accounting Office. 1997b. “Erosion in Employer-Based Health Benefits for EarlyRetirees.” GAO/HEHS-97-150.
U.S. General Accounting Office. 1998. “Erosion in retiree Health Benefits Offered by LargeEmployers.” GAO/HEHS-98-110.
Valletta, Robert G. 1999. “Declining Job Security.” Journal of Labor Economics 17(4, part 2):S170-S197.
Webb, Sidney, and Beatrice Webb. 1897. Industrial Democracy.
Woodbury, Stephen and Douglas Bettinger. 1991. “The Decline of Fringe Benefit Coverage inthe 1980s” in Structural Changes in US Labor Markets: Causes and Consequences,Randall W. Eberts and Erica L. Groshen, eds. New York: ME Sharpe, pp. 105-138.
Wunnava, Phanindra V., and Bradley T. Ewing. 1999. “Union-Nonunion Differentials andEstablishment Size: Evidence from the NLSY.” Journal of Labor Research 20(2), pp.177-183.
Density of Employer Share of Single Premiums
0
0.01
0.02
0.03
0.04
0.05
0.06
0 25 50 75 100
Employer Share of Single Premium
Density
Figure 1a
union
(unadjusted)
nonunion
(adjusted)
Density of Employer Share of Family Premiums
0
0.01
0.02
0.03
0 25 50 75 100
Employer Share of Family Premium
Density
Figure 1b
union
(unadjusted)
nonunion
(adjusted)
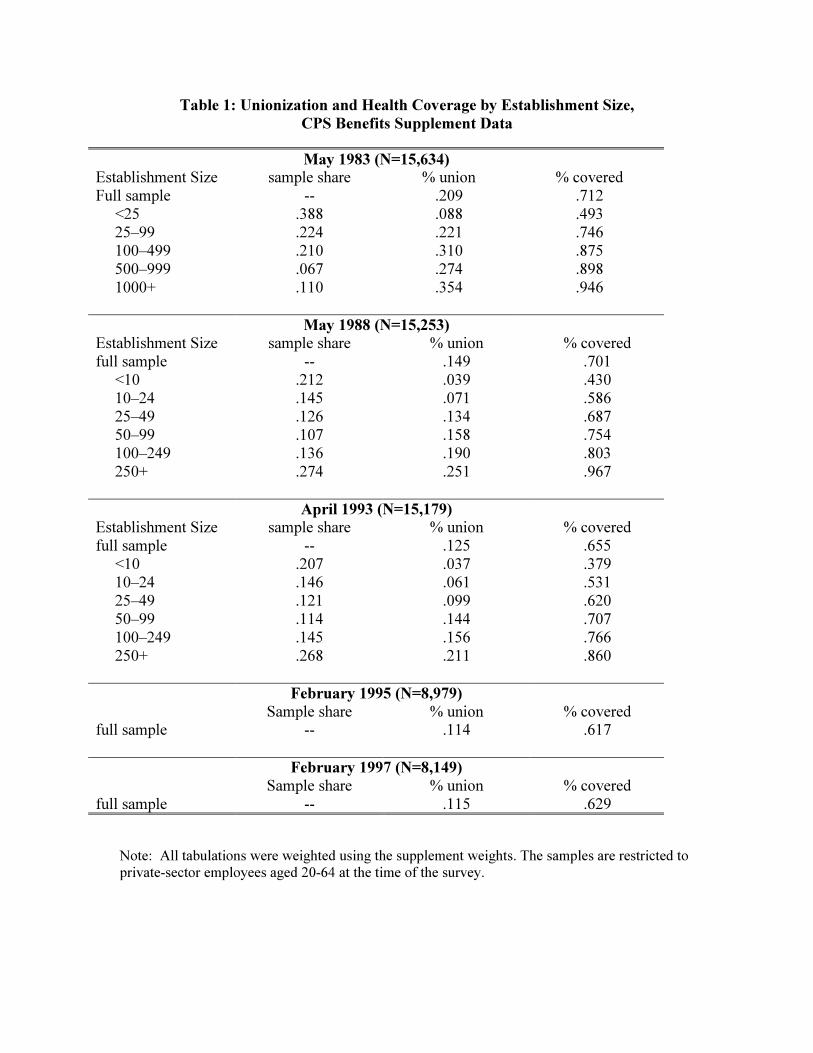
Table 1: Unionization and Health Coverage by Establishment Size,
CPS Benefits Supplement Data
May 1983 (N=15,634)
Establishment Size sample share % union % coveredFull sample -- .209 .712
<25 .388 .088 .49325–99 .224 .221 .746100–499 .210 .310 .875500–999 .067 .274 .8981000+ .110 .354 .946
May 1988 (N=15,253)
Establishment Size sample share % union % coveredfull sample -- .149 .701
<10 .212 .039 .43010–24 .145 .071 .58625–49 .126 .134 .68750–99 .107 .158 .754100–249 .136 .190 .803250+ .274 .251 .967
April 1993 (N=15,179)
Establishment Size sample share % union % coveredfull sample -- .125 .655
<10 .207 .037 .37910–24 .146 .061 .53125–49 .121 .099 .62050–99 .114 .144 .707100–249 .145 .156 .766250+ .268 .211 .860
February 1995 (N=8,979)
Sample share % union % coveredfull sample -- .114 .617
February 1997 (N=8,149)
Sample share % union % coveredfull sample -- .115 .629
Note: All tabulations were weighted using the supplement weights. The samples are restricted toprivate-sector employees aged 20-64 at the time of the survey.
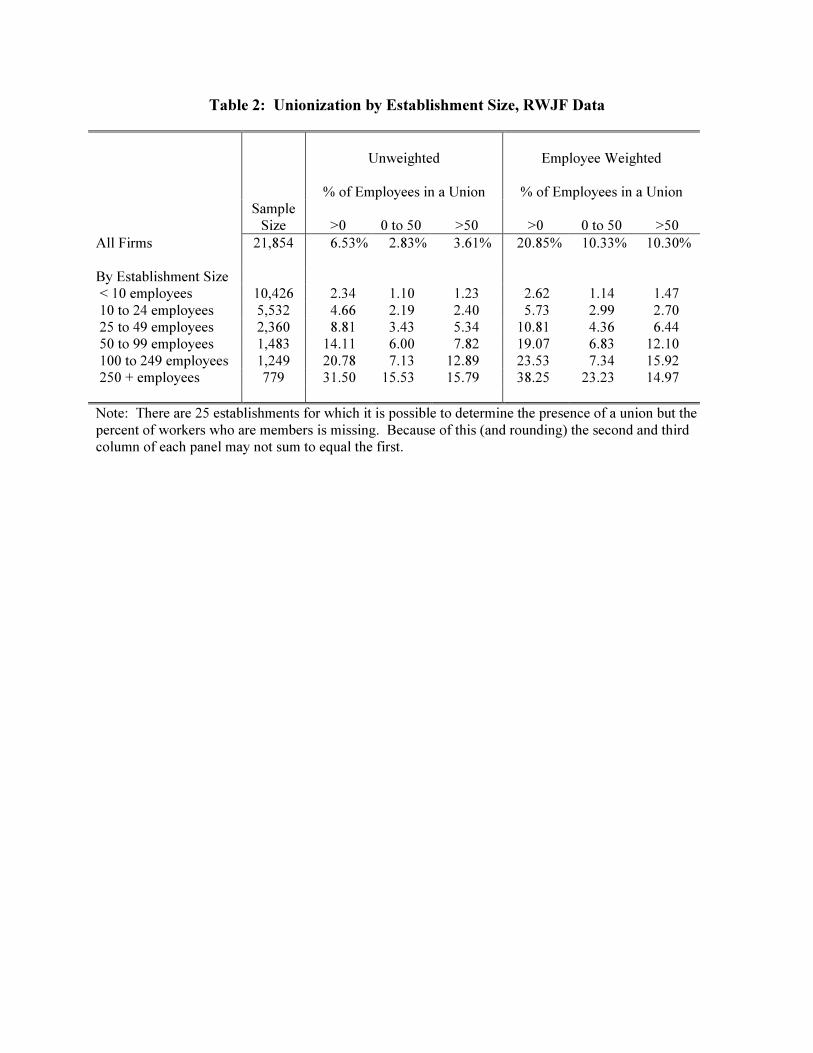
Table 2: Unionization by Establishment Size, RWJF Data
Unweighted Employee Weighted
% of Employees in a Union % of Employees in a UnionSample
Size >0 0 to 50 >50 >0 0 to 50 >50
All Firms 21,854 6.53% 2.83% 3.61% 20.85% 10.33% 10.30%
By Establishment Size < 10 employees 10,426 2.34 1.10 1.23 2.62 1.14 1.47 10 to 24 employees 5,532 4.66 2.19 2.40 5.73 2.99 2.70 25 to 49 employees 2,360 8.81 3.43 5.34 10.81 4.36 6.44 50 to 99 employees 1,483 14.11 6.00 7.82 19.07 6.83 12.10 100 to 249 employees 1,249 20.78 7.13 12.89 23.53 7.34 15.92 250 + employees 779 31.50 15.53 15.79 38.25 23.23 14.97
Note: There are 25 establishments for which it is possible to determine the presence of a union but thepercent of workers who are members is missing. Because of this (and rounding) the second and thirdcolumn of each panel may not sum to equal the first.
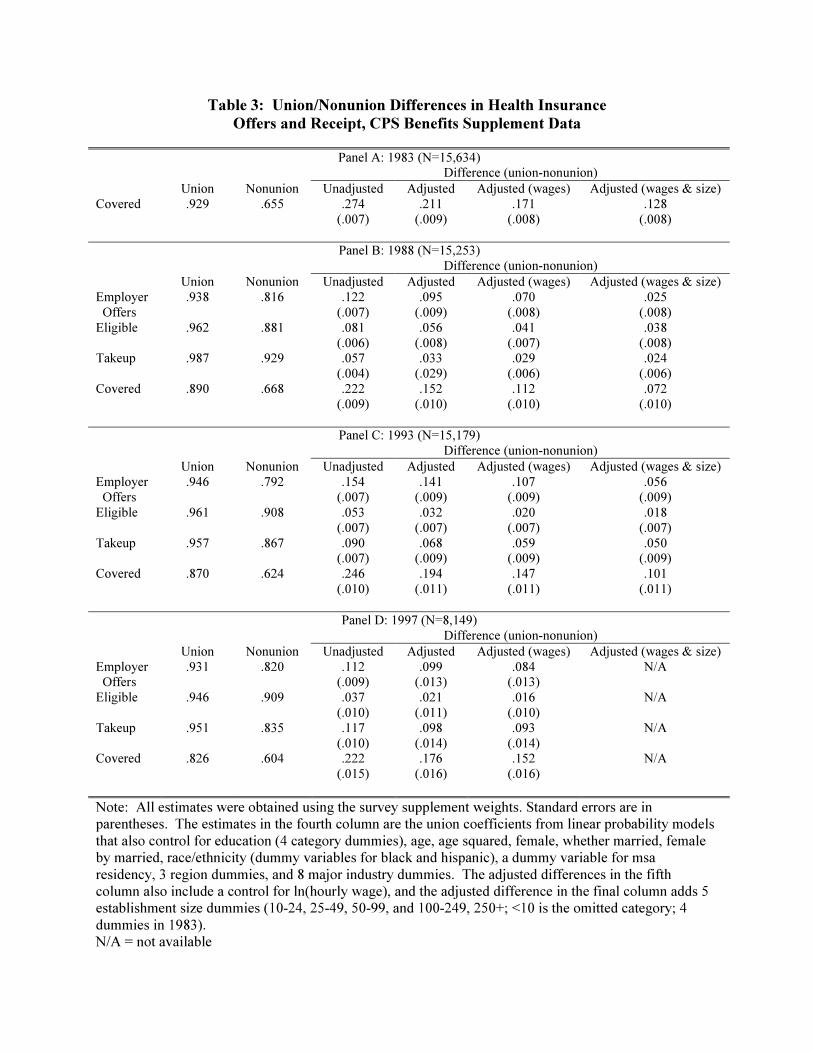
Table 3: Union/Nonunion Differences in Health Insurance
Offers and Receipt, CPS Benefits Supplement Data
Panel A: 1983 (N=15,634)Difference (union-nonunion)
Union Nonunion Unadjusted Adjusted Adjusted (wages) Adjusted (wages & size)
Covered .929 .655 .274
(.007)
.211
(.009)
.171
(.008)
.128
(.008)
Panel B: 1988 (N=15,253)
Difference (union-nonunion)
Union Nonunion Unadjusted Adjusted Adjusted (wages) Adjusted (wages & size)
Employer
Offers
.938 .816 .122
(.007)
.095
(.009)
.070
(.008)
.025
(.008)
Eligible .962 .881 .081
(.006)
.056
(.008)
.041
(.007)
.038
(.008)Takeup .987 .929 .057
(.004)
.033
(.029)
.029
(.006)
.024
(.006)
Covered .890 .668 .222
(.009)
.152
(.010)
.112
(.010)
.072
(.010)
Panel C: 1993 (N=15,179)
Difference (union-nonunion)
Union Nonunion Unadjusted Adjusted Adjusted (wages) Adjusted (wages & size)
Employer
Offers
.946 .792 .154
(.007)
.141
(.009)
.107
(.009)
.056
(.009)
Eligible .961 .908 .053
(.007)
.032
(.007)
.020
(.007)
.018
(.007)
Takeup .957 .867 .090(.007)
.068(.009)
.059(.009)
.050(.009)
Covered .870 .624 .246
(.010)
.194
(.011)
.147
(.011)
.101
(.011)
Panel D: 1997 (N=8,149)
Difference (union-nonunion)
Union Nonunion Unadjusted Adjusted Adjusted (wages) Adjusted (wages & size)
Employer Offers
.931 .820 .112(.009)
.099(.013)
.084(.013)
N/A
Eligible .946 .909 .037
(.010)
.021
(.011)
.016
(.010)
N/A
Takeup .951 .835 .117
(.010)
.098
(.014)
.093
(.014)
N/A
Covered .826 .604 .222
(.015)
.176
(.016)
.152
(.016)
N/A
Note: All estimates were obtained using the survey supplement weights. Standard errors are inparentheses. The estimates in the fourth column are the union coefficients from linear probability modelsthat also control for education (4 category dummies), age, age squared, female, whether married, femaleby married, race/ethnicity (dummy variables for black and hispanic), a dummy variable for msaresidency, 3 region dummies, and 8 major industry dummies. The adjusted differences in the fifthcolumn also include a control for ln(hourly wage), and the adjusted difference in the final column adds 5establishment size dummies (10-24, 25-49, 50-99, and 100-249, 250+; <10 is the omitted category; 4dummies in 1983).N/A = not available
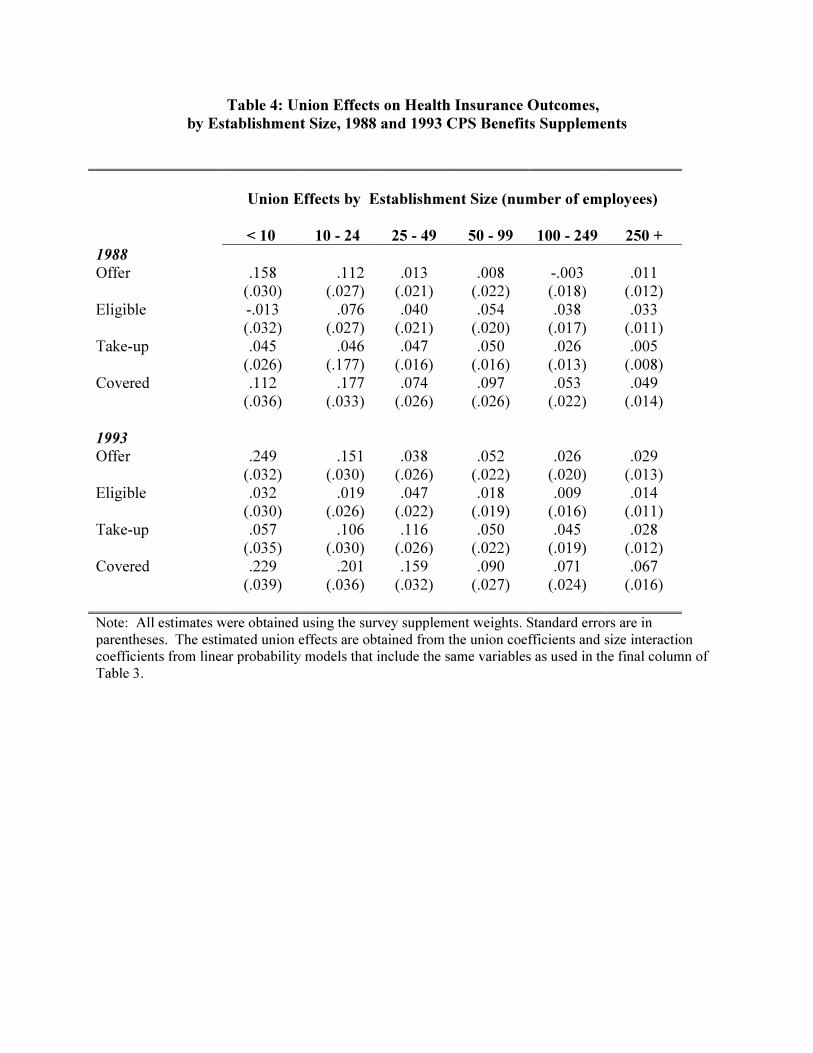
Table 4: Union Effects on Health Insurance Outcomes,
by Establishment Size, 1988 and 1993 CPS Benefits Supplements
Union Effects by Establishment Size (number of employees)
< 10 10 - 24 25 - 49 50 - 99 100 - 249 250 +
1988
Offer .158(.030)
.112(.027)
.013(.021)
.008(.022)
-.003(.018)
.011(.012)
Eligible -.013(.032)
.076(.027)
.040(.021)
.054(.020)
.038(.017)
.033(.011)
Take-up .045(.026)
.046(.177)
.047(.016)
.050(.016)
.026(.013)
.005(.008)
Covered .112(.036)
.177(.033)
.074(.026)
.097(.026)
.053(.022)
.049(.014)
1993
Offer .249(.032)
.151(.030)
.038(.026)
.052(.022)
.026(.020)
.029(.013)
Eligible .032(.030)
.019(.026)
.047(.022)
.018(.019)
.009(.016)
.014(.011)
Take-up .057(.035)
.106(.030)
.116(.026)
.050(.022)
.045(.019)
.028(.012)
Covered .229(.039)
.201(.036)
.159(.032)
.090(.027)
.071(.024)
.067(.016)
Note: All estimates were obtained using the survey supplement weights. Standard errors are inparentheses. The estimated union effects are obtained from the union coefficients and size interactioncoefficients from linear probability models that include the same variables as used in the final column ofTable 3.
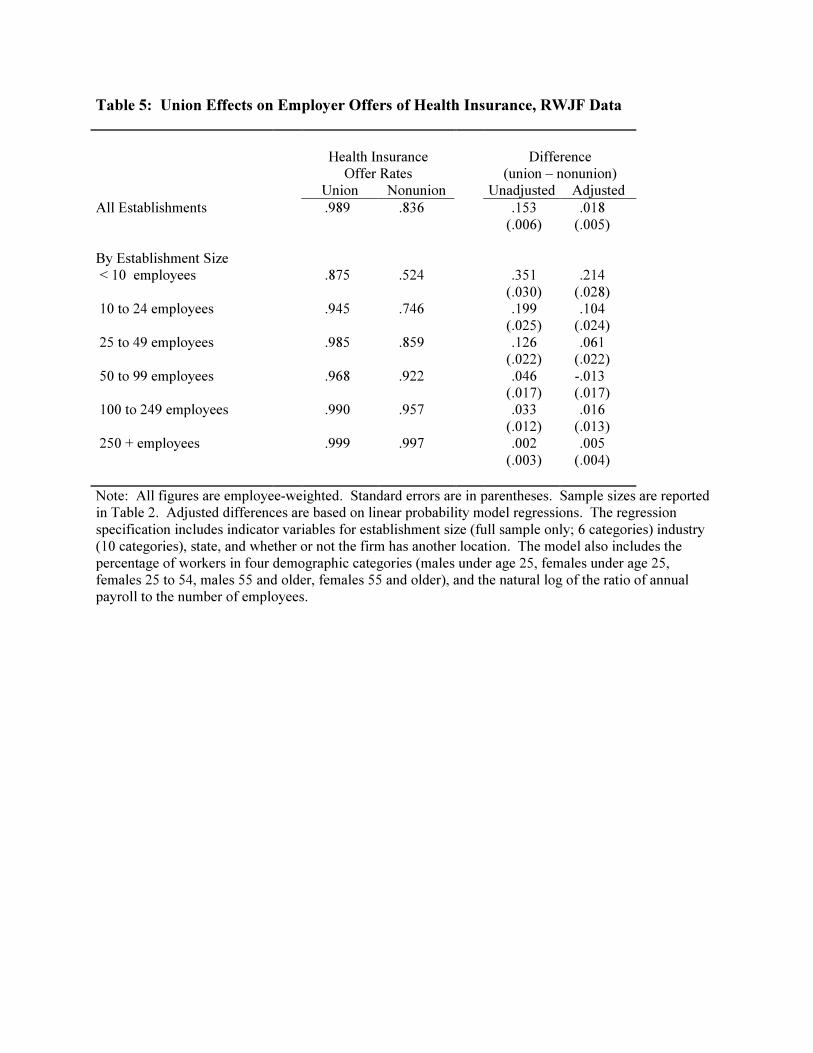
Table 5: Union Effects on Employer Offers of Health Insurance, RWJF Data
Health InsuranceOffer Rates
Difference(union – nonunion)
Union Nonunion Unadjusted Adjusted
All Establishments .989 .836 .153(.006)
.018(.005)
By Establishment Size < 10 employees .875 .524 .351
(.030).214
(.028) 10 to 24 employees .945 .746 .199
(.025).104
(.024) 25 to 49 employees .985 .859 .126
(.022).061
(.022) 50 to 99 employees .968 .922 .046
(.017)-.013(.017)
100 to 249 employees .990 .957 .033(.012)
.016(.013)
250 + employees .999 .997 .002(.003)
.005(.004)
Note: All figures are employee-weighted. Standard errors are in parentheses. Sample sizes are reportedin Table 2. Adjusted differences are based on linear probability model regressions. The regressionspecification includes indicator variables for establishment size (full sample only; 6 categories) industry(10 categories), state, and whether or not the firm has another location. The model also includes thepercentage of workers in four demographic categories (males under age 25, females under age 25,females 25 to 54, males 55 and older, females 55 and older), and the natural log of the ratio of annualpayroll to the number of employees.
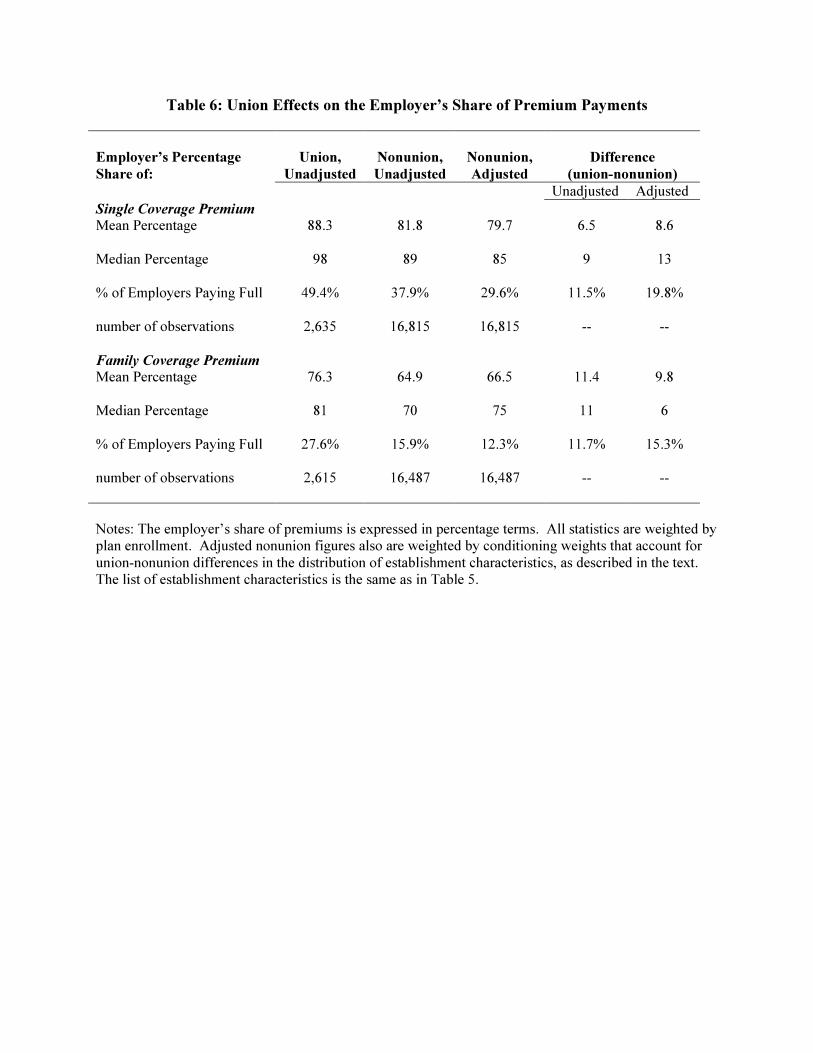
Table 6: Union Effects on the Employer’s Share of Premium Payments
Employer’s Percentage
Share of:
Union,
Unadjusted
Nonunion,
Unadjusted
Nonunion,
Adjusted
Difference
(union-nonunion)
Unadjusted Adjusted
Single Coverage Premium
Mean Percentage 88.3 81.8 79.7 6.5 8.6
Median Percentage 98 89 85 9 13
% of Employers Paying Full 49.4% 37.9% 29.6% 11.5% 19.8%
number of observations 2,635 16,815 16,815 -- --
Family Coverage Premium
Mean Percentage 76.3 64.9 66.5 11.4 9.8
Median Percentage 81 70 75 11 6
% of Employers Paying Full 27.6% 15.9% 12.3% 11.7% 15.3%
number of observations 2,615 16,487 16,487 -- --
Notes: The employer’s share of premiums is expressed in percentage terms. All statistics are weighted byplan enrollment. Adjusted nonunion figures also are weighted by conditioning weights that account forunion-nonunion differences in the distribution of establishment characteristics, as described in the text.The list of establishment characteristics is the same as in Table 5.
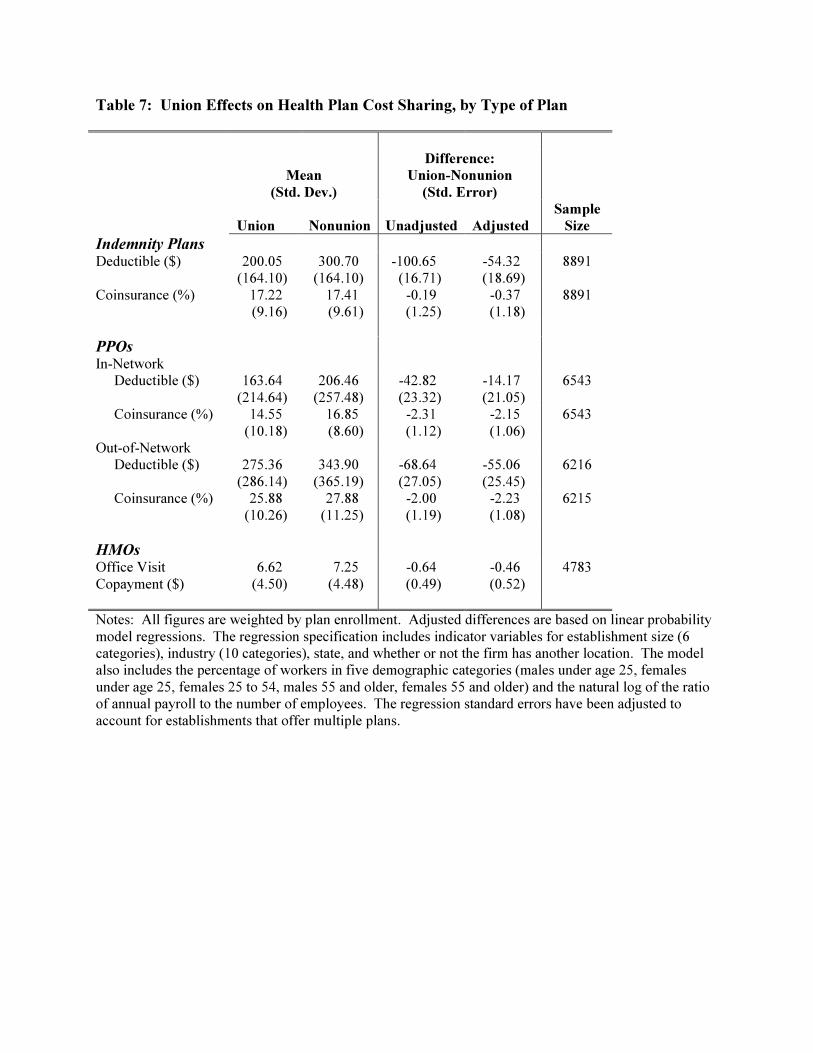
Table 7: Union Effects on Health Plan Cost Sharing, by Type of Plan
Mean
(Std. Dev.)
Difference:
Union-Nonunion
(Std. Error)
Union Nonunion Unadjusted Adjusted
Sample
Size
Indemnity PlansDeductible ($) 200.05
(164.10)300.70
(164.10)-100.65(16.71)
-54.32(18.69)
8891
Coinsurance (%) 17.22(9.16)
17.41(9.61)
-0.19(1.25)
-0.37(1.18)
8891
PPOsIn-Network Deductible ($) 163.64
(214.64)206.46
(257.48)-42.82(23.32)
-14.17(21.05)
6543
Coinsurance (%) 14.55(10.18)
16.85(8.60)
-2.31(1.12)
-2.15(1.06)
6543
Out-of-Network Deductible ($) 275.36
(286.14)343.90
(365.19)-68.64(27.05)
-55.06(25.45)
6216
Coinsurance (%) 25.88(10.26)
27.88(11.25)
-2.00(1.19)
-2.23(1.08)
6215
HMOsOffice VisitCopayment ($)
6.62(4.50)
7.25(4.48)
-0.64(0.49)
-0.46(0.52)
4783
Notes: All figures are weighted by plan enrollment. Adjusted differences are based on linear probabilitymodel regressions. The regression specification includes indicator variables for establishment size (6categories), industry (10 categories), state, and whether or not the firm has another location. The modelalso includes the percentage of workers in five demographic categories (males under age 25, femalesunder age 25, females 25 to 54, males 55 and older, females 55 and older) and the natural log of the ratioof annual payroll to the number of employees. The regression standard errors have been adjusted toaccount for establishments that offer multiple plans.
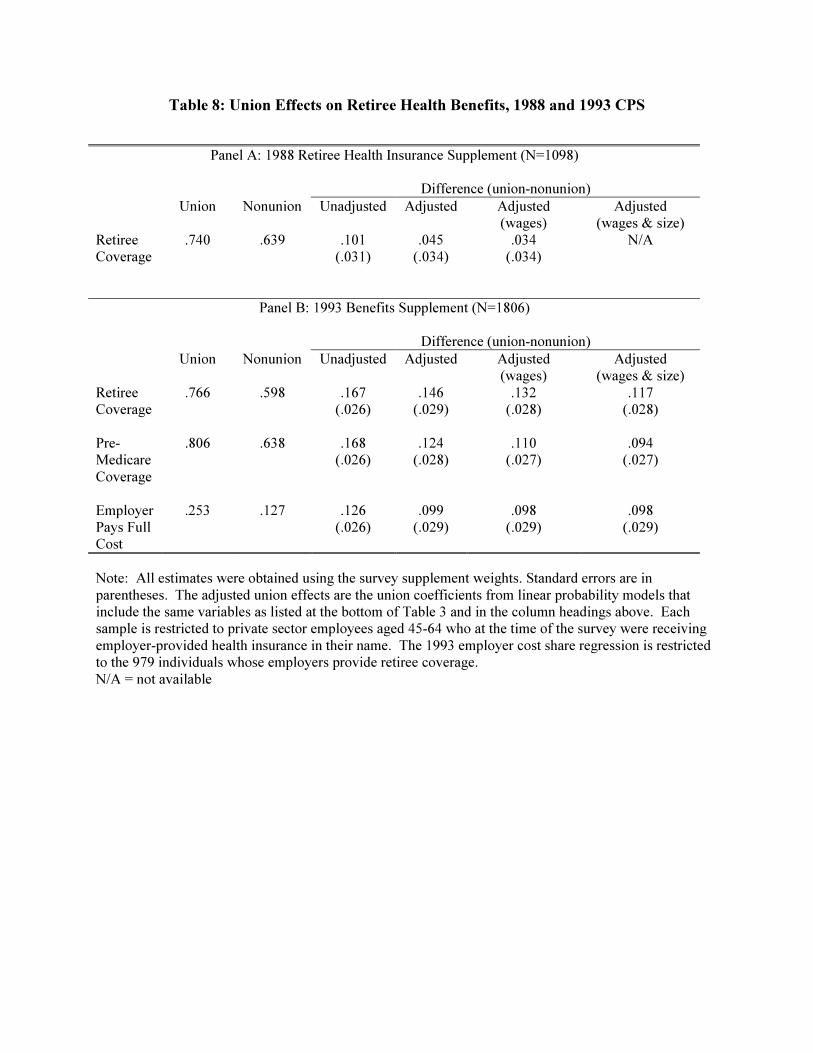
Table 8: Union Effects on Retiree Health Benefits, 1988 and 1993 CPS
Panel A: 1988 Retiree Health Insurance Supplement (N=1098)
Difference (union-nonunion)
Union Nonunion Unadjusted Adjusted Adjusted(wages)
Adjusted(wages & size)
RetireeCoverage
.740 .639 .101(.031)
.045(.034)
.034(.034)
N/A
Panel B: 1993 Benefits Supplement (N=1806)
Difference (union-nonunion)
Union Nonunion Unadjusted Adjusted Adjusted(wages)
Adjusted(wages & size)
RetireeCoverage
.766 .598 .167(.026)
.146(.029)
.132(.028)
.117(.028)
Pre-MedicareCoverage
.806 .638 .168(.026)
.124(.028)
.110(.027)
.094(.027)
EmployerPays FullCost
.253 .127 .126(.026)
.099(.029)
.098(.029)
.098(.029)
Note: All estimates were obtained using the survey supplement weights. Standard errors are inparentheses. The adjusted union effects are the union coefficients from linear probability models thatinclude the same variables as listed at the bottom of Table 3 and in the column headings above. Eachsample is restricted to private sector employees aged 45-64 who at the time of the survey were receivingemployer-provided health insurance in their name. The 1993 employer cost share regression is restrictedto the 979 individuals whose employers provide retiree coverage.N/A = not available
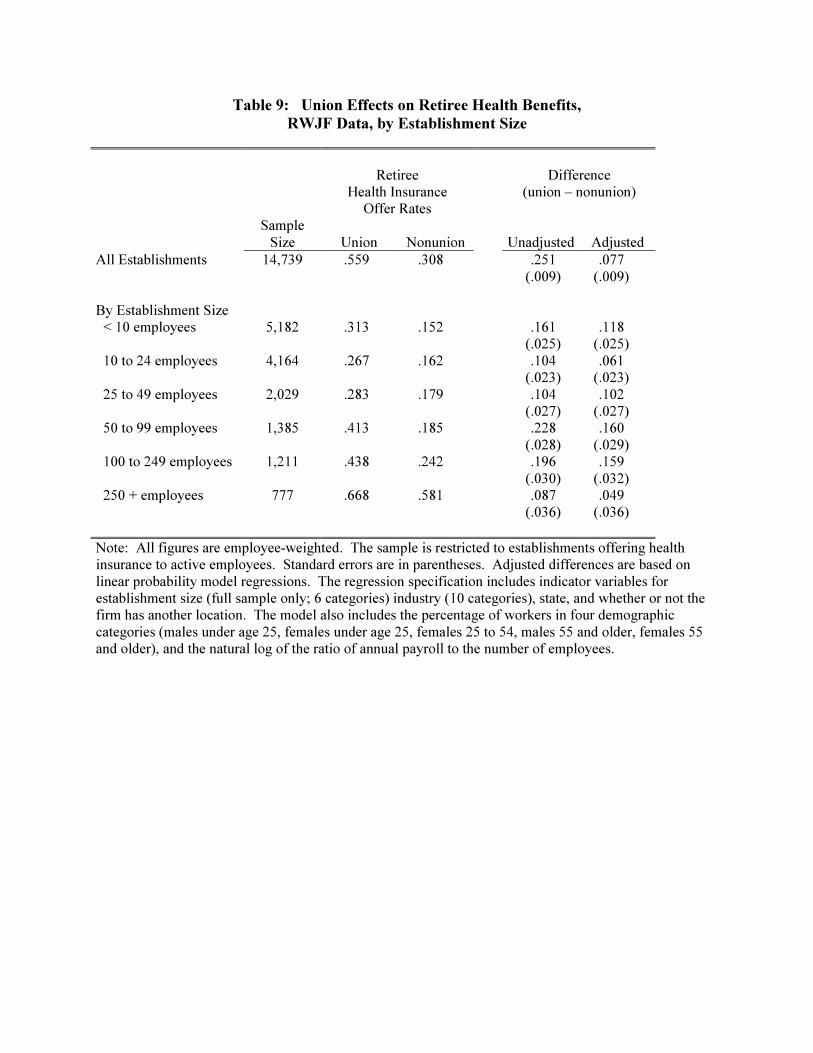
Table 9: Union Effects on Retiree Health Benefits,
RWJF Data, by Establishment Size
RetireeHealth Insurance
Offer Rates
Difference(union – nonunion)
SampleSize Union Nonunion Unadjusted Adjusted
All Establishments 14,739 .559 .308 .251(.009)
.077(.009)
By Establishment Size < 10 employees 5,182 .313 .152 .161
(.025).118
(.025) 10 to 24 employees 4,164 .267 .162 .104
(.023).061
(.023) 25 to 49 employees 2,029 .283 .179 .104
(.027).102
(.027) 50 to 99 employees 1,385 .413 .185 .228
(.028).160
(.029) 100 to 249 employees 1,211 .438 .242 .196
(.030).159
(.032) 250 + employees 777 .668 .581 .087
(.036).049
(.036)
Note: All figures are employee-weighted. The sample is restricted to establishments offering healthinsurance to active employees. Standard errors are in parentheses. Adjusted differences are based onlinear probability model regressions. The regression specification includes indicator variables forestablishment size (full sample only; 6 categories) industry (10 categories), state, and whether or not thefirm has another location. The model also includes the percentage of workers in four demographiccategories (males under age 25, females under age 25, females 25 to 54, males 55 and older, females 55and older), and the natural log of the ratio of annual payroll to the number of employees.