Embed Size (px)
DESCRIPTION
Union Comprehensive Annual Financial Report for 2014-2015. Visit www.unionps.org for more information.
Citation preview

Union Public SchoolsIndependent School District #9Tulsa, Oklahoma 74133
Union Public SchoolsIndependent District #9
Tulsa, Oklahoma
Comprehensive AnnualFinancial Report
For the Fiscal Year Ending June 30, 2015
Prepared by:Department of Finance
Debra J. Jacoby, CPAChief Financial Officer/Treasurer
Catherine L. Bentley, CPADirector of Financial Reporting/Treasury
Gail. L. Easterling, CPADirector of Accounting

This page intentionally left blank.
Union Public Schools - Table of ContentsComprehensive Annual Financial Report
For the Fiscal Year Ending June 30, 2015
INTRODUCTORY SECTION ........................................................................................................Page
Transmittal Letter and District Profile .......................................................................................1-15 ASBO Certificate of Excellence ....................................................................................................... 16 GFOA Certificate of Achievement ................................................................................................. 17 School Officials ................................................................................................................................. 18 Organizational Chart ....................................................................................................................... 19
FINANCIAL SECTION
Independent Auditor’s Report ..................................................................................................21-24 Management’s Discussion and Analysis .................................................................................25-36 Basic Financial Statements Governmentwide Financial Statements Statement of Net Position ................................................................................................... 37 Statement of Activities ................................................................................................... .38-39 Fund Financial Statements Balance Sheets - Governmental Funds .............................................................................. 41 Statement of Revenues, Expenditures, and Changes in Fund Balances - Governmental Funds ........................................................................ 42 Reconciliation of the Statement of Revenues, Expenditures, and Changes in Fund Balances of Governmental Funds to the Statement of Activities ............. 43 Statement of Net Position - Proprietary Funds ................................................................ 44 Statement of Revenues, Expenses, and Changes in Net Position - Proprietary Funds ................................................................................. 45 Statement of Cash Flows - Proprietary Funds ................................................................. 46 Statement of Net Position - Fiduciary Funds ................................................................... 47 Statement of Changes in Net Position - Fiduciary Funds .............................................. 48 Notes to the Financial Statements.......................................................................................49-76 Required Supplementary Information: Schedule of Funding Progress for Other Post-Employment Benefits ................................ 77 Schedule of the District’s Proportionate Share of the Net Pension Liability- Oklahoma Teachers’ Retirement System .......................................................................... 78 Schedule of District’s Contributions- Oklahoma Teacher’s Retirement System .......................................................................... 79 Schedule of Revenues, Expenditures, and Changes in Fund Balance - Budget and Actual - (Budgetary Basis) - Budgeted Governmental Fund Types - General Fund...................................................................... 80
Union Public Schools - Table of ContentsComprehensive Annual Financial Report
For the Fiscal Year Ending June 30, 2015
FINANCIAL SECTION (Cont.) ......................................................................................................Page Schedule of Revenues, Expenditures, and Changes in Fund Balance - Budget and Actual - (Budgetary Basis) - Budgeted Governmental Fund Types - Building Fund .................................................. 81 Other Supplementary Information: Combining Statement of Changes in Assets and Liabilities - Agency Funds ............. 83 STATISTICAL SECTION
Net Position by Component ........................................................................................................... 87 Changes in Net Position .............................................................................................................88-89 Fund Balances of Governmental Funds ........................................................................................ 90 Changes in Fund Balances of Governmental Funds ................................................................... 91
Assessed and Estimated Actual Value of Taxable Property ....................................................... 93 Direct and Overlapping Property Tax Rates ................................................................................ 94 Principal Property Taxpayers ......................................................................................................... 95 Property Tax Levies and Collections ............................................................................................. 96
Ratio of Outstanding Debt by Type ............................................................................................... 97 Ratios of Net General Bonded Debt Outstanding ....................................................................... 98 Direct and Overlapping Governmental Activities Debt ............................................................. 99 Legal Debt Margin ......................................................................................................................... 100
Demographic and Economic Statistics .................................................................................101-102 Tulsa Area Principal Employers ................................................................................................... 103
Capital Assets by Function and Activity .................................................................................... 105 Employee Information .................................................................................................................. 106 Operating Statistics ........................................................................................................................ 107 Support Services Statistics ............................................................................................................ 108 School Building Information ................................................................................................. 109-111 Insurance Schedule ........................................................................................................................ 112
Union Public SchoolsIndependent District #9
December 22, 2015
To the Patrons of Union Public Schools:
The Comprehensive Annual Financial Report of Union Public Schools, Independent District #9 (the “District”) for the fiscal year ending June 30, 2015, is hereby submitted. Responsibility for both the accuracy of the data and the completeness and fairness of the presentation, including all disclosures, rests with the District. To the best of our knowledge and belief, the enclosed data is accurate in all material respects and is reported in a manner designed to present fairly the financial position and results of operation of the various funds of the District. All disclosures necessary to enable the reader to gain an understanding of the District’s financial activities have been included.
The letter of transmittal is designed to complement Management’s Discussion and Analysis and should be read in conjunction with it. Union Public Schools Management’s Discussion and Analysis can be found immediately after the report of the independent auditor, on page 25.
The report includes all current funds of the District. The services provided include education of preschool through adults with primary emphasis on Pre-K through grade 12.
Education Service Center 8506 E. 61st Street Tulsa, OK 74133 918-357-4321 Fax: 918-357-6017Website: www.unionps.org
1
2
IntroductionUnion Public Schools, Independent District #9, Tulsa County, is a premiere Oklahoma school district “ahead of the curve” on college and career readiness and expanded avenues for individual student success.
Its approximately 16,000 students, Pre-K through 12th grade, reside within a 28-square-mile boundary encompassing both southeast Tulsa and a portion of Broken Arrow. The school system is the heart of the community and serves as a unifying force. It includes an Early Childhood Education Center for three-year-olds; 13 elementary schools, Pre-K through 5th grade; and five secondary schools – a 6th/7th Grade Center, 8th Grade Center, 9th Grade Center, High School for grades 10-12, and an Alternative School serving grades 9-12.
Parents choose the Union district for its all-around excellence. They take great pride in its wide-ranging, dynamic academic programs; award-winning activities; caring, talented teachers; highly respected elected and administrative leaders; and remarkable facilities. Union is one of the leading districts in Oklahoma in the number of teachers earning National Board Certification and in number of Presidential Math and Science Award recipients.
Union’s Community Schools—elementary schools complete with health clinics and services from community agencies—serve as a model to other districts nationwide. They increase academic success by forming community partnerships to provide extra supports such as early care, health and social services, out-of-school activities, family/community engagement, neighborhood development, and lifelong learning.
In addition to challenging Pre-AP(Advanced Placement)
classes, Union offers a variety of Advanced Placement classes which allow students to earn college credit while learning about a subject in depth. In partnership with Tulsa Community College (TCC), Union was one of the first to pilot a unique concurrent enrollment program at the Union Collegiate Academy (UCA) on its High School campus, enabling qualifying students to earn both high school and college credits at the same time – virtually tuition free! It has not been unusual for some to graduate with both a high school diploma and enough credits for an associates degree.
UCA provides students a challenging college-like experience with TCC instructors, tiered lecture halls, advanced science labs, student lounges, and specialty food shops, along with a safety net of high school staff members there to ensure their success. Counselors in the UCA’s College and Career Center help students and their parents complete college entrance, financial aid, and scholarship applications or bank college credit through Tulsa Technology Center. Students love the UCA’s online courses – Union Virtual Learning Academy – because of the flexibility they provide and because teachers are always there to assist.
The Union community provides whatever it takes to ensure all students graduate college/career ready. Successful bond issues have funded state-of-the-art tools to enhance reading, language, math, science, and writing skills at every grade level. Art, music, and physical education enrich the traditional curriculum. Professionals in remedial reading, speech therapy, and special education are assigned to the schools along with library media specialists, nurses, and counselors. Courses for gifted students are offered at all levels, as are programs for English Language Learners (ELL).
When Union was founded in 1919, it combined four small, rural communities – Boles, McCollough, Mayo, and Alsuma – and had only four students in its graduating class. Today it is the eighth largest district in Oklahoma. Union’s strong sense of tradition and pride as well as its emphasis on partnerships and personalized instruction is underscored in its theme, “Together We Make a Difference.”
Revised 7-1-15
31st ST.
41st ST.
51st ST.
61st ST.
71st ST.
81st ST.
91st ST.
96th ST.
101st ST.
105th ST.
GA
RN
ETT
129th
E. A
VE. 14
5th E
. AVE
.
MEM
OR
IAL
SHER
IDA
N
MIN
GO89
th E
. AVE
.
YALE
76th PL.
56th ST.
89th E
. AVE
MIN
GO
Union Public Schools District ProfileFiscal Year Ending June 30, 2015
3
Union Public Schools District ProfileFiscal Year Ending June 30, 2015
In 2014-2015, Union grew by 297 students. With a 1.9 percent increase over the previous year, Union served 15,823 students – 7,656 at the elementary level and 8,167 in grades 6-12.
In terms of racial origin, 10 percent were Native American, 16.4 percent were African-American, 0.2 percent were Pacific Islander/Hawaiian, 7.3 percent were Asian, 37.0 percent were Caucasian; and 29.1 percent were of Hispanic ethnicity.
There were 236 three-year-olds at the Rosa Parks Early Childhood Education Center, and 756 four-year-olds enrolled in Pre-K classes districtwide.
The district had 1,721 students, or 10.87%, identified with special needs, and 3,049, or 19%, were identified as gifted.
During summer school, 1,743 elementary students received remediation or enrichment.
There were well over 1,000 students (grades Pre-K-7) enrolled in Union’s Extended Day Program (EDP). Before and after school, EDP students engaged in cooking projects, science experiments, homework clubs, multicultural activities, active outdoor play and more. EDP Summer Camp was held at Grove Elementary offering weekly themes over a nine-week period.
English Language Learner (ELL) services were provided to 2,015 elementary and 800 secondary students; 501 became English-proficient and exited the program. Our diverse population speaks more than 50 different languages.
More than 14,425 Union students were involved in some form of the arts, including 6,922 elementary students who took both art and music classes. At the secondary level (grades 6-12), 1,017 were in band; 598 in orchestra; 1,401 in vocal music; 1,556 in drama; 235 in speech/debate; and 2,462 in a wide variety of visual arts disciplines.
More than 2,500 students in grades K-12 participated in Union’s 167 non-competitive sports and spirit programs. Approximately 1,600 were involved in its 23 competitive sports teams and spirit squads grades 7-12. District athletic participation in grades 7-12 totaled 1,638; 667 girls and 971 boys.
Of the district’s 2014-2015 seniors, 30% planned to further their education at four-year colleges or universities, 36% at two-year schools, 11% planned on attending technical or vocational schools or entering the military, and 23% were undecided.
College classes, which also count toward graduation, were offered at the UCA for only $12.75, per course, through the Tulsa Community College (TCC) EXCELerate program. In the past five years of Union’s
TCC partnership, high school students have earned a total of 8,724 hours of college credit, with an estimated savings to Union families of more than $5,000,000.
The district offered 22 Advanced Placement (AP) courses, and 573 students took 1,090 AP exams, with 55% passing.
Union seniors received more than $2.8 million in scholarship offers.
With 174 seniors from the class of 2014 qualifying for the Oklahoma’s Promise Scholarship, Union was recognized by the Oklahoma State Regents for Higher Education as the Oklahoma’s Promise State 6A Champion for the third consecutive year.
More than 600 seniors qualified to receive the Tulsa Achieves scholarship through Tulsa Community College, and more than 178 were eligible to receive Oklahoma’s Promise scholarships. Seventy-six percent of the seniors took the ACT, and their average score was 21.5.
Academic All-Conference honors went to 146 Union athletes, 76 received Honorable Mention, and 34 student-athletes signed athletic college scholarships.
The graduating class of 2015 numbered 1,138 students, the largest number in the district’s history. Over the past three years more than 3,100 students have earned their diploma.
More than 3,300 students were served in Union’s Adult Education Program, and the district continued to serve most of northeastern Oklahoma including Bixby, Jenks, Sapulpa, and Sand Springs.
Elementary Student Achievement
Andersen fourth grader Garris Munoz competed at the Hall of Fame Dance Challenge in Oklahoma City and received First Place Platinum, First Place in his division, and overall High Point in the National Division for his lyrical piece “Near Light.”
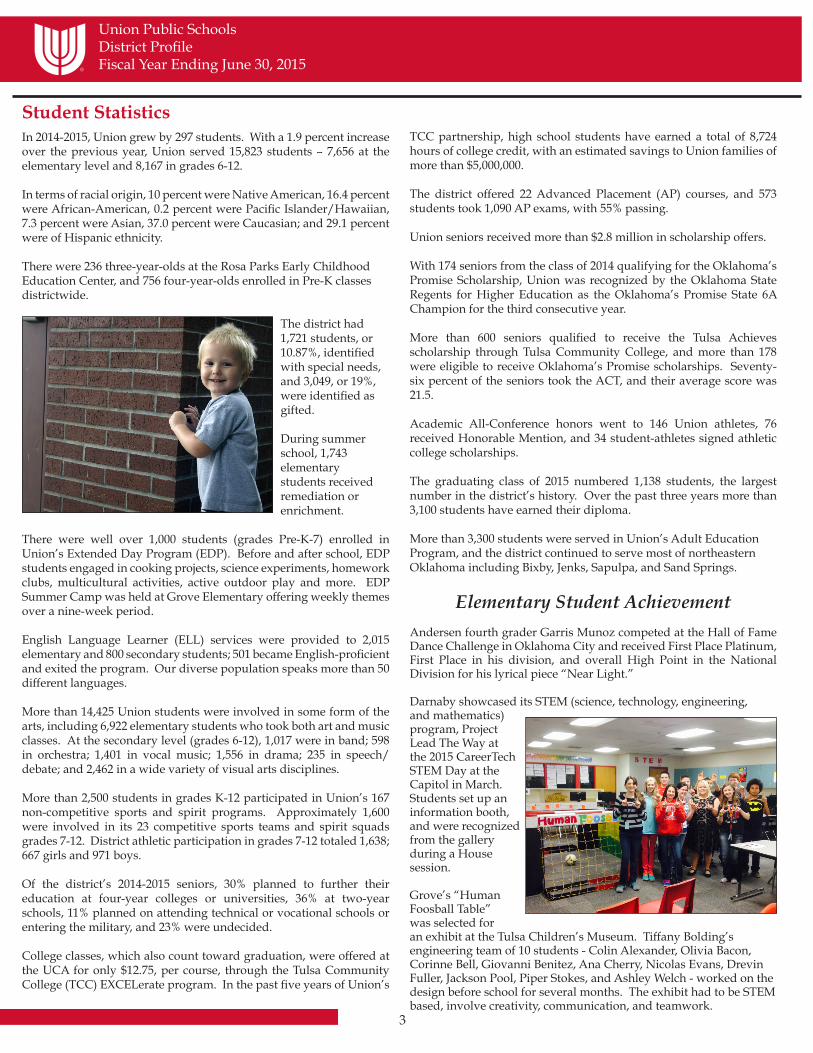
Darnaby showcased its STEM (science, technology, engineering, and mathematics) program, Project Lead The Way at the 2015 CareerTech STEM Day at the Capitol in March. Students set up an information booth, and were recognized from the gallery during a House session.
Grove’s “Human Foosball Table” was selected for an exhibit at the Tulsa Children’s Museum. Tiffany Bolding’s engineering team of 10 students - Colin Alexander, Olivia Bacon, Corinne Bell, Giovanni Benitez, Ana Cherry, Nicolas Evans, Drevin Fuller, Jackson Pool, Piper Stokes, and Ashley Welch - worked on the design before school for several months. The exhibit had to be STEM based, involve creativity, communication, and teamwork.
Student Statistics
4
Union Public Schools District ProfileFiscal Year Ending June 30, 2015
Peters fifth grader Meghana Venkatesha was selected the Oklahoma winner of the 2015 Nicholas Green Distinguished Student Award. She was recognized at the Oklahoma Association of Gifted, Creative and Talented State Conference and received a $500 savings bond. Meghana was one of 50 students in the nation to receive this award.
Secondary Student Achievement
Six seniors were named National Merit Finalists – Delaney Couri, Megan Harju, Lindsay Martin, Nitesh Mathur, Jeremy Roberts, and Daniella Royer. Sam Bogard and Emily Koehn were Semifinalists, and Commended Students included Madeline Harney, Rachel Hurtado, and Haley Welch.
Seniors Daniel Koehler Yaschine and Bianca Moreno were recognized as outstanding Hispanic/Latino high school students by the College Board’s National Hispanic Recognition Program (NHRP.)
Senior Rachel Hurtado earned the title of first runner-up at the first-ever Oklahoma Youth Poet Laureate inaugural ceremony. Twelve finalists from across the state performed their poetic pieces at the University of Oklahoma. Senior Kerry Hagins was awarded Honorable Mention.
Seniors Andrew Sparkman and Alyssa Leggett were named Mr. and Miss Union – the highest honor a student may receive at Union High School.
Senior Aldyn Lieberman was named a 2015 recipient of the Scholarships to Success Entrepreneurship Scholarship through the district’s partnership with Dream It, Do It to expand students’ knowledge of entrepreneurship and manufacturing.
Senior Jacob Armstrong created a website for tracking attendance in Service Learning. The website allows for supervisors to take attendance daily or weekly electronically. It also sends an email reminder to the supervisor each Monday to turn in attendance and has the ability to generate attendance reports.
Seniors Madeline Harney, Jeremy Roberts, and Daniella Royer were selected as candidates for the U.S. Presidential Scholars Program, and Daniella was named one of 565 semifinalists nationwide.
Senior Michael Hill was one of two delegates selected from Oklahoma to attend the American Legion Boys Nation. Selection is based on leadership skills, academic record, and activity at American Legion Boys State.
2015 Valedictorians were Sheridan Chappelle, Brian Dunagan, Madeline Harney, Nitesh Mathur, Samantha Osman, Han Pham,
Cole Roberts, Jeremy Roberts, Daniella Royer, Sang Ha Seo, Andrew Sparkman, Monica Venkatesha, and Haley Welch. Salutatorians were Delaney Couri, Olivia Darr, Deborah Ede, Laura Gray, Megan Harju, Lindsay Martin, Bianca Moreno, Savannah Ramsey, Zoya Sharieff, Tanner Stokes, Emily Tobben, and Paige Tobben.
Nitesh Mathur and Laura Gray were named Seniors of the Year.
Mason Farquhar (football) and Natalie Heiliger (pom) were named Homecoming King and Queen.
Six Union students were inducted into the Oklahoma Indian Student Honor Society for their academic performance and community involvement. More than 800 names across the state were submitted for inclusion. Students inducted include seniors Laura Gray, Thomas Cox, Victoria Granger; sophomores Reid Rector, Joshua Spears; and freshman Bailey Henson.
Three teams of four students each competed at the Oklahoma State University (OSU) Engineering Design Challenge taking 2nd, 3rd and 4th place honors.
Sophomore Charles Gordon was named 2015 Youth of the Year for The Salvation Army Boys & Girls Clubs of Metro Tulsa. The award is the highest honor a Club member can receive. He was awarded a $5,000 scholarship.
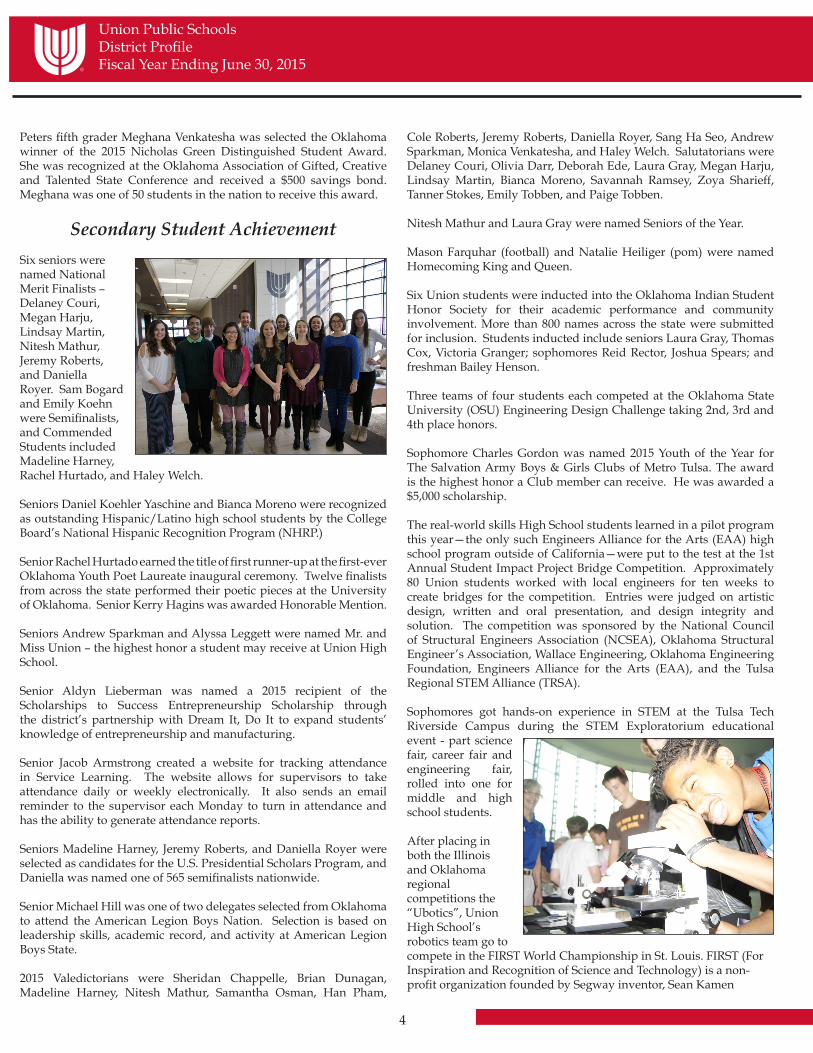
The real-world skills High School students learned in a pilot program this year—the only such Engineers Alliance for the Arts (EAA) high school program outside of California—were put to the test at the 1st Annual Student Impact Project Bridge Competition. Approximately 80 Union students worked with local engineers for ten weeks to create bridges for the competition. Entries were judged on artistic design, written and oral presentation, and design integrity and solution. The competition was sponsored by the National Council of Structural Engineers Association (NCSEA), Oklahoma Structural Engineer’s Association, Wallace Engineering, Oklahoma Engineering Foundation, Engineers Alliance for the Arts (EAA), and the Tulsa Regional STEM Alliance (TRSA).
Sophomores got hands-on experience in STEM at the Tulsa Tech Riverside Campus during the STEM Exploratorium educational event - part science fair, career fair and engineering fair, rolled into one for middle and high school students.
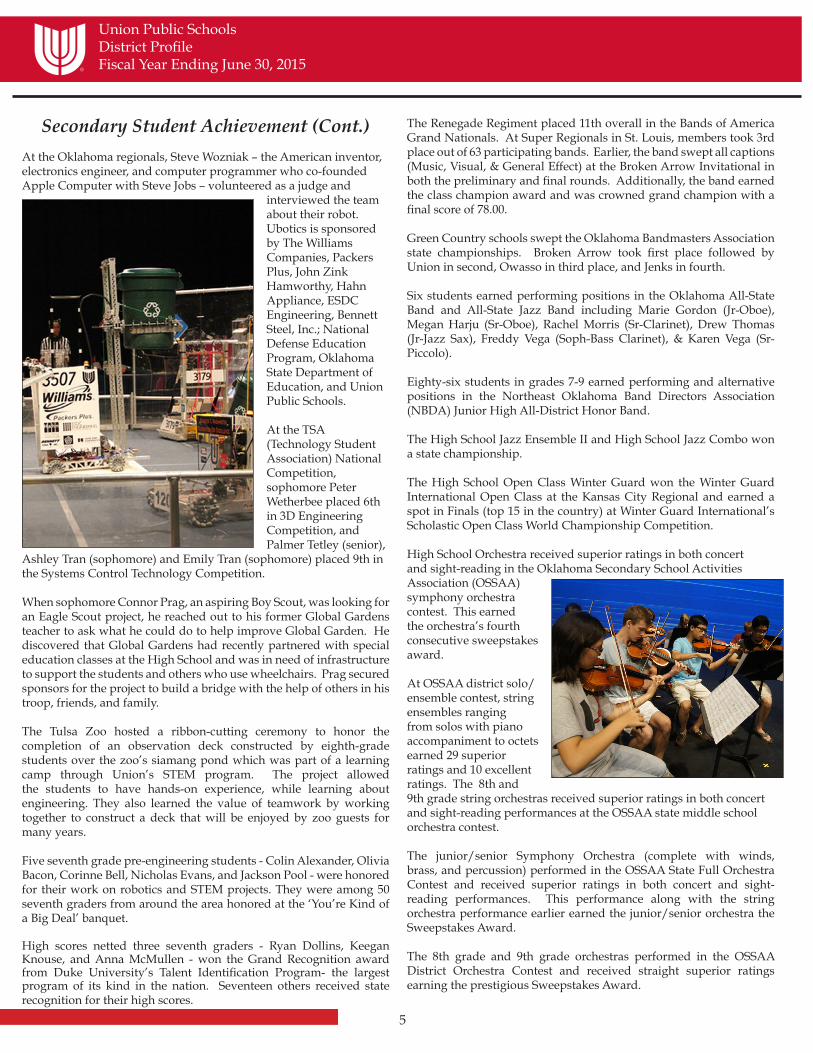
After placing in both the Illinois and Oklahoma regional competitions the “Ubotics”, Union High School’s robotics team go to compete in the FIRST World Championship in St. Louis. FIRST (For Inspiration and Recognition of Science and Technology) is a non-profit organization founded by Segway inventor, Sean Kamen
5
Union Public Schools District ProfileFiscal Year Ending June 30, 2015
Secondary Student Achievement (Cont.)
At the Oklahoma regionals, Steve Wozniak – the American inventor, electronics engineer, and computer programmer who co-founded Apple Computer with Steve Jobs – volunteered as a judge and
interviewed the team about their robot. Ubotics is sponsored by The Williams Companies, Packers Plus, John Zink Hamworthy, Hahn Appliance, ESDC Engineering, Bennett Steel, Inc.; National Defense Education Program, Oklahoma State Department of Education, and Union Public Schools.
At the TSA (Technology Student Association) National Competition, sophomore Peter Wetherbee placed 6th in 3D Engineering Competition, and Palmer Tetley (senior),
Ashley Tran (sophomore) and Emily Tran (sophomore) placed 9th in the Systems Control Technology Competition.
When sophomore Connor Prag, an aspiring Boy Scout, was looking for an Eagle Scout project, he reached out to his former Global Gardens teacher to ask what he could do to help improve Global Garden. He discovered that Global Gardens had recently partnered with special education classes at the High School and was in need of infrastructure to support the students and others who use wheelchairs. Prag secured sponsors for the project to build a bridge with the help of others in his troop, friends, and family.
The Tulsa Zoo hosted a ribbon-cutting ceremony to honor the completion of an observation deck constructed by eighth-grade students over the zoo’s siamang pond which was part of a learning camp through Union’s STEM program. The project allowed the students to have hands-on experience, while learning about engineering. They also learned the value of teamwork by working together to construct a deck that will be enjoyed by zoo guests for many years.
Five seventh grade pre-engineering students - Colin Alexander, Olivia Bacon, Corinne Bell, Nicholas Evans, and Jackson Pool - were honored for their work on robotics and STEM projects. They were among 50 seventh graders from around the area honored at the ‘You’re Kind of a Big Deal’ banquet.
High scores netted three seventh graders - Ryan Dollins, Keegan Knouse, and Anna McMullen - won the Grand Recognition award from Duke University’s Talent Identification Program- the largest program of its kind in the nation. Seventeen others received state recognition for their high scores.
The Renegade Regiment placed 11th overall in the Bands of America Grand Nationals. At Super Regionals in St. Louis, members took 3rd place out of 63 participating bands. Earlier, the band swept all captions (Music, Visual, & General Effect) at the Broken Arrow Invitational in both the preliminary and final rounds. Additionally, the band earned the class champion award and was crowned grand champion with a final score of 78.00.
Green Country schools swept the Oklahoma Bandmasters Association state championships. Broken Arrow took first place followed by Union in second, Owasso in third place, and Jenks in fourth.
Six students earned performing positions in the Oklahoma All-State Band and All-State Jazz Band including Marie Gordon (Jr-Oboe), Megan Harju (Sr-Oboe), Rachel Morris (Sr-Clarinet), Drew Thomas (Jr-Jazz Sax), Freddy Vega (Soph-Bass Clarinet), & Karen Vega (Sr-Piccolo).
Eighty-six students in grades 7-9 earned performing and alternative positions in the Northeast Oklahoma Band Directors Association (NBDA) Junior High All-District Honor Band.
The High School Jazz Ensemble II and High School Jazz Combo won a state championship.
The High School Open Class Winter Guard won the Winter Guard International Open Class at the Kansas City Regional and earned a spot in Finals (top 15 in the country) at Winter Guard International’s Scholastic Open Class World Championship Competition.
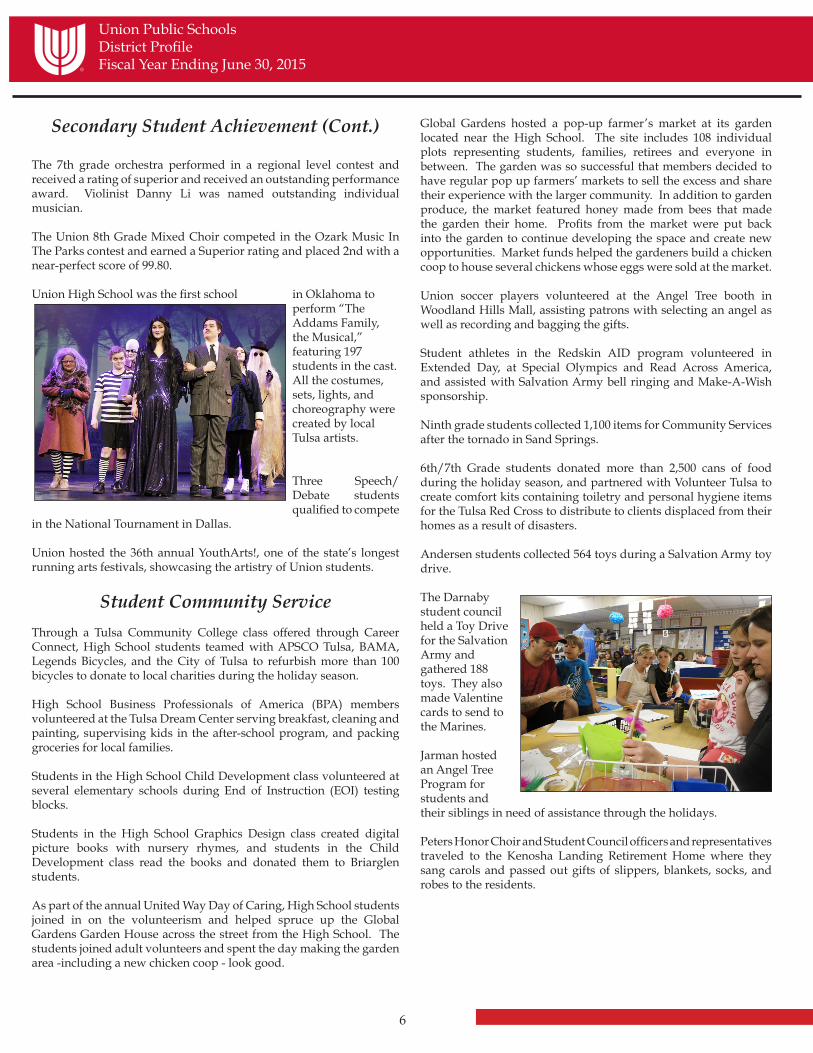
High School Orchestra received superior ratings in both concert and sight-reading in the Oklahoma Secondary School Activities Association (OSSAA) symphony orchestra contest. This earned the orchestra’s fourth consecutive sweepstakes award.
At OSSAA district solo/ensemble contest, string ensembles ranging from solos with piano accompaniment to octets earned 29 superior ratings and 10 excellent ratings. The 8th and 9th grade string orchestras received superior ratings in both concert and sight-reading performances at the OSSAA state middle school orchestra contest.
The junior/senior Symphony Orchestra (complete with winds, brass, and percussion) performed in the OSSAA State Full Orchestra Contest and received superior ratings in both concert and sight-reading performances. This performance along with the string orchestra performance earlier earned the junior/senior orchestra the Sweepstakes Award.
The 8th grade and 9th grade orchestras performed in the OSSAA District Orchestra Contest and received straight superior ratings earning the prestigious Sweepstakes Award.
6
Union Public Schools District ProfileFiscal Year Ending June 30, 2015
Secondary Student Achievement (Cont.)
The 7th grade orchestra performed in a regional level contest and received a rating of superior and received an outstanding performance award. Violinist Danny Li was named outstanding individual musician.
The Union 8th Grade Mixed Choir competed in the Ozark Music In The Parks contest and earned a Superior rating and placed 2nd with a near-perfect score of 99.80.
Union High School was the first school in Oklahoma to perform “The Addams Family, the Musical,” featuring 197 students in the cast. All the costumes, sets, lights, and choreography were created by local Tulsa artists.
Three Speech/Debate students qualified to compete
in the National Tournament in Dallas.
Union hosted the 36th annual YouthArts!, one of the state’s longest running arts festivals, showcasing the artistry of Union students.
Student Community Service
Through a Tulsa Community College class offered through Career Connect, High School students teamed with APSCO Tulsa, BAMA, Legends Bicycles, and the City of Tulsa to refurbish more than 100 bicycles to donate to local charities during the holiday season.
High School Business Professionals of America (BPA) members volunteered at the Tulsa Dream Center serving breakfast, cleaning and painting, supervising kids in the after-school program, and packing groceries for local families.
Students in the High School Child Development class volunteered at several elementary schools during End of Instruction (EOI) testing blocks.
Students in the High School Graphics Design class created digital picture books with nursery rhymes, and students in the Child Development class read the books and donated them to Briarglen students.
As part of the annual United Way Day of Caring, High School students joined in on the volunteerism and helped spruce up the Global Gardens Garden House across the street from the High School. The students joined adult volunteers and spent the day making the garden area -including a new chicken coop - look good.
Global Gardens hosted a pop-up farmer’s market at its garden located near the High School. The site includes 108 individual plots representing students, families, retirees and everyone in between. The garden was so successful that members decided to have regular pop up farmers’ markets to sell the excess and share their experience with the larger community. In addition to garden produce, the market featured honey made from bees that made the garden their home. Profits from the market were put back into the garden to continue developing the space and create new opportunities. Market funds helped the gardeners build a chicken coop to house several chickens whose eggs were sold at the market.
Union soccer players volunteered at the Angel Tree booth in Woodland Hills Mall, assisting patrons with selecting an angel as well as recording and bagging the gifts.
Student athletes in the Redskin AID program volunteered in Extended Day, at Special Olympics and Read Across America, and assisted with Salvation Army bell ringing and Make-A-Wish sponsorship.
Ninth grade students collected 1,100 items for Community Services after the tornado in Sand Springs.
6th/7th Grade students donated more than 2,500 cans of food during the holiday season, and partnered with Volunteer Tulsa to create comfort kits containing toiletry and personal hygiene items for the Tulsa Red Cross to distribute to clients displaced from their homes as a result of disasters.
Andersen students collected 564 toys during a Salvation Army toy drive.
The Darnaby student council held a Toy Drive for the Salvation Army and gathered 188 toys. They also made Valentine cards to send to the Marines.
Jarman hosted an Angel Tree Program for students and their siblings in need of assistance through the holidays.
Peters Honor Choir and Student Council officers and representatives traveled to the Kenosha Landing Retirement Home where they sang carols and passed out gifts of slippers, blankets, socks, and robes to the residents.

7
Union Public Schools District ProfileFiscal Year Ending June 30, 2015
Employee Statistics
Ninth Grade & High School Athletic Achievement
It was yet another coronation for Union, as the Redskins won their fifth consecutive Class 6A girls’ golf state championship.
The girls’ soccer team won the state championship with a perfect 17-0 record. They finished at No. 1
in the top-50 FAB 50 Girls spring rankings. This was the first time an Oklahoma girls’ team has been crowned the champ in the 16 years the website has been doing rankings.
Juniors Ben Fields and Ayo Ologolo, sophomore Trey Brown, and freshman A.K. Wilson teamed to win the state track championship in the 4x200 relay.
The Highsteppers garnered another state championship bringing their program total to 31, and Junior Highsteppers finished 1st in Kick and 3rd in Jazz.
At the Regional Showcase in Keller, Texas, the Varsity Highsteppers were named Medium Varsity Grand Champions, and received Best in Class for their hip hop and kick routines, as well as First Runner Up Best in Class for jazz. They were awarded the team Super Sweepstakes award for receiving an average score of 90 or higher in all three routines. The officers were named 1st Runner Up Best in Class for their jazz and contemporary routines, and also received a Silver Sweepstakes award for having a score of 85 or higher on two routines.
Also at the Regional Showcase, JV Highstepper officers won Best in Class and a Superior Performance award for their contemporary dance, and the team won Best in Class and a Superior Performance award for kick.
All three Highstepper seniors - Ashlyn Ernest, Hailey Dickson, and Maddie Parks - were named to the Oklahoma State Dance Team Director’s Association (OSDTDA) Eastern All-Regional dance team. They were selected from among more than 80 girls from across the state.
Varsity Pom finished second in state; JV was third and 8th grade was third. Seventh grade Pom also took a state championship.
Union Varsity Cheer finished as runners-up at 2015 National Cheerleaders Association (NCA) National Championships as well as runners-up at state.
Seniors Demery Pennington and Dominique Rodriguez were named to the All-State Cheerleading Squad.
Senior Highstepper Ashlyn Ernest and senior Pom member Madeline Harney received OSDTDA Community Service scholarships at state. Pom senior Abby Edgeller was awarded an Academic Scholarship.
Senior Jeremy Roberts was named to the All-State East tennis team.
Senior Chance Wenglewski won the 6A 220-lb. state wrestling championship. He finished his wrestling career at Union as a 3x placer, 2x state runner-up, and the 2015 State Champion. Junior Mason Naifeh was the 2015 106-lb. state runner up.
Union senior quarterback Mason Farquhar was named a finalist for 2014 Vype Mr. Football and was named to the Coaches All-State football team.
The girls’ golf and boys’ swimming teams earned the Distinguished Academic Plaque for a GPA of 3.50 and ranked in the top five of Class 6A. Academic Achievement Certificates (GPA of 3.25 or above and upper 1/3 of Class 6A) were awarded to girls’ swimming, slowpitch softball, girls’ tennis, boys’ tennis, boys’ golf, and boys’ soccer.
Employee StatisticsUnion employed 80 administrators – 65 certified and 15 non-certified – and 1002 certified teachers. Support staff members accounted for another 898 positions, both full time and part time. The ethnic diversity among the staff was African-American 5.9%; American Indian 5.6%, Asian 2.0%, Hispanic 10.8%, Caucasian and other 75.7%; 415 were male and 1,565 female. During new teacher induction, 178 teachers were welcomed to the district.
At the end of 2014-2015, Union had 81 National Board Certified teachers, and 36.7% of district teaching and administrative staff held graduate-level degrees – 380 had master’s degrees and 17 had doctorates.
Teaching & Learning
Superintendent Dr. Kirt Hartzler was selected by the U.S. Department of Education as one of 100 top school leaders from across America to participate in the first-ever National Connected Superintendents Summit at the White House. The event builds on the momentum of the ConnectED Initiative, a plan President Obama announced in 2013, to connect 99% of students to high speed Internet and empower teachers with the technology they need to transform teaching and learning. Dr. Hartzler was among exemplary local school chiefs recognized for their leadership in helping transition their districts to digital learning.
Dr. Vince Bertram, President & CEO of Project Lead The Way, visited Darnaby and the Union Collegiate Academy. Project Lead the Way is a national program designed to promote interest in science, technology, engineering and mathematics (STEM).
8
Union Public Schools District ProfileFiscal Year Ending June 30, 2015
Teaching & Learning (Cont.)
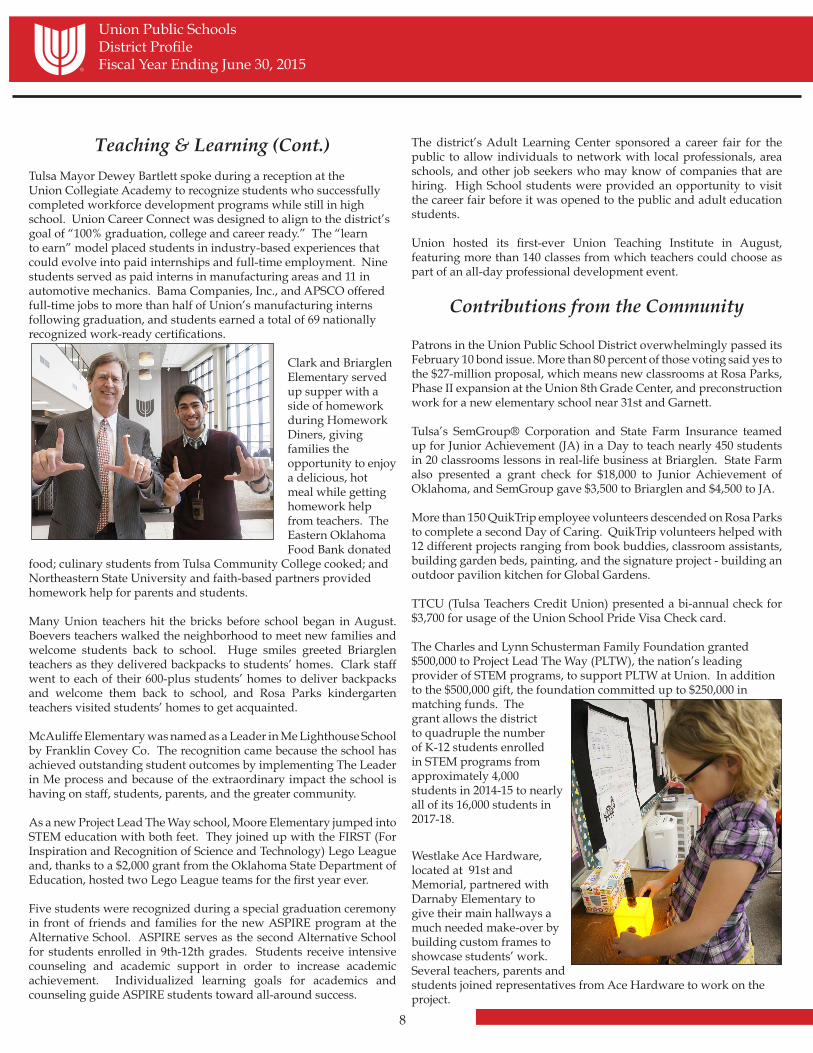
Tulsa Mayor Dewey Bartlett spoke during a reception at the Union Collegiate Academy to recognize students who successfully completed workforce development programs while still in high school. Union Career Connect was designed to align to the district’s goal of “100% graduation, college and career ready.” The “learn to earn” model placed students in industry-based experiences that could evolve into paid internships and full-time employment. Nine students served as paid interns in manufacturing areas and 11 in automotive mechanics. Bama Companies, Inc., and APSCO offered full-time jobs to more than half of Union’s manufacturing interns following graduation, and students earned a total of 69 nationally recognized work-ready certifications.
Clark and Briarglen Elementary served up supper with a side of homework during Homework Diners, giving families the opportunity to enjoy a delicious, hot meal while getting homework help from teachers. The Eastern Oklahoma Food Bank donated
food; culinary students from Tulsa Community College cooked; and Northeastern State University and faith-based partners provided homework help for parents and students.
Many Union teachers hit the bricks before school began in August. Boevers teachers walked the neighborhood to meet new families and welcome students back to school. Huge smiles greeted Briarglen teachers as they delivered backpacks to students’ homes. Clark staff went to each of their 600-plus students’ homes to deliver backpacks and welcome them back to school, and Rosa Parks kindergarten teachers visited students’ homes to get acquainted.
McAuliffe Elementary was named as a Leader in Me Lighthouse School by Franklin Covey Co. The recognition came because the school has achieved outstanding student outcomes by implementing The Leader in Me process and because of the extraordinary impact the school is having on staff, students, parents, and the greater community.
As a new Project Lead The Way school, Moore Elementary jumped into STEM education with both feet. They joined up with the FIRST (For Inspiration and Recognition of Science and Technology) Lego League and, thanks to a $2,000 grant from the Oklahoma State Department of Education, hosted two Lego League teams for the first year ever.
Five students were recognized during a special graduation ceremony in front of friends and families for the new ASPIRE program at the Alternative School. ASPIRE serves as the second Alternative School for students enrolled in 9th-12th grades. Students receive intensive counseling and academic support in order to increase academic achievement. Individualized learning goals for academics and counseling guide ASPIRE students toward all-around success.
The district’s Adult Learning Center sponsored a career fair for the public to allow individuals to network with local professionals, area schools, and other job seekers who may know of companies that are hiring. High School students were provided an opportunity to visit the career fair before it was opened to the public and adult education students.
Union hosted its first-ever Union Teaching Institute in August, featuring more than 140 classes from which teachers could choose as part of an all-day professional development event.
Contributions from the Community
Patrons in the Union Public School District overwhelmingly passed its February 10 bond issue. More than 80 percent of those voting said yes to the $27-million proposal, which means new classrooms at Rosa Parks, Phase II expansion at the Union 8th Grade Center, and preconstruction work for a new elementary school near 31st and Garnett.
Tulsa’s SemGroup® Corporation and State Farm Insurance teamed up for Junior Achievement (JA) in a Day to teach nearly 450 students in 20 classrooms lessons in real-life business at Briarglen. State Farm also presented a grant check for $18,000 to Junior Achievement of Oklahoma, and SemGroup gave $3,500 to Briarglen and $4,500 to JA.
More than 150 QuikTrip employee volunteers descended on Rosa Parks to complete a second Day of Caring. QuikTrip volunteers helped with 12 different projects ranging from book buddies, classroom assistants, building garden beds, painting, and the signature project - building an outdoor pavilion kitchen for Global Gardens.
TTCU (Tulsa Teachers Credit Union) presented a bi-annual check for $3,700 for usage of the Union School Pride Visa Check card.
The Charles and Lynn Schusterman Family Foundation granted $500,000 to Project Lead The Way (PLTW), the nation’s leading provider of STEM programs, to support PLTW at Union. In addition to the $500,000 gift, the foundation committed up to $250,000 in matching funds. The grant allows the district to quadruple the number of K-12 students enrolled in STEM programs from approximately 4,000 students in 2014-15 to nearly all of its 16,000 students in 2017-18.
Westlake Ace Hardware, located at 91st and Memorial, partnered with Darnaby Elementary to give their main hallways a much needed make-over by building custom frames to showcase students’ work. Several teachers, parents and students joined representatives from Ace Hardware to work on the project.
9
Union Public Schools District ProfileFiscal Year Ending June 30, 2015
Teaching & Learning (Cont.)
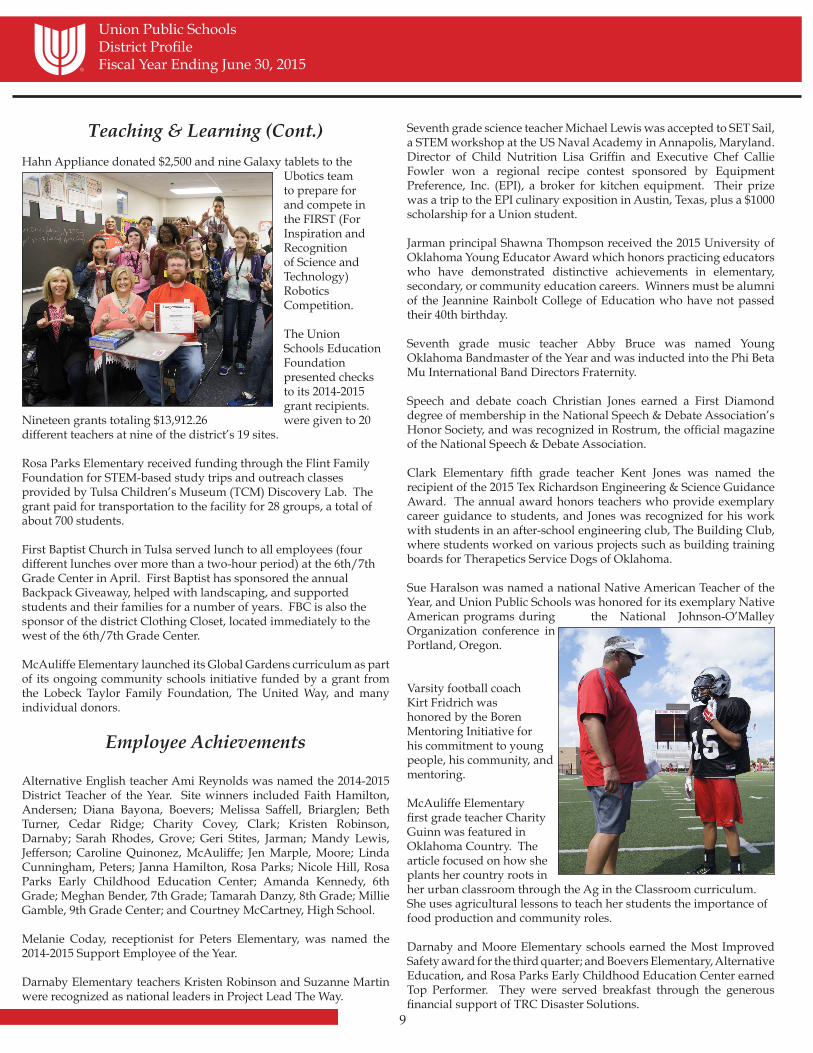
Hahn Appliance donated $2,500 and nine Galaxy tablets to the Ubotics team to prepare for and compete in the FIRST (For Inspiration and Recognition of Science and Technology) Robotics Competition.
The Union Schools Education Foundation presented checks to its 2014-2015 grant recipients.
Nineteen grants totaling $13,912.26 were given to 20 different teachers at nine of the district’s 19 sites.
Rosa Parks Elementary received funding through the Flint Family Foundation for STEM-based study trips and outreach classes provided by Tulsa Children’s Museum (TCM) Discovery Lab. The grant paid for transportation to the facility for 28 groups, a total of about 700 students.
First Baptist Church in Tulsa served lunch to all employees (four different lunches over more than a two-hour period) at the 6th/7th Grade Center in April. First Baptist has sponsored the annual Backpack Giveaway, helped with landscaping, and supported students and their families for a number of years. FBC is also the sponsor of the district Clothing Closet, located immediately to the west of the 6th/7th Grade Center.
McAuliffe Elementary launched its Global Gardens curriculum as part of its ongoing community schools initiative funded by a grant from the Lobeck Taylor Family Foundation, The United Way, and many individual donors.
Employee Achievements
Alternative English teacher Ami Reynolds was named the 2014-2015 District Teacher of the Year. Site winners included Faith Hamilton, Andersen; Diana Bayona, Boevers; Melissa Saffell, Briarglen; Beth Turner, Cedar Ridge; Charity Covey, Clark; Kristen Robinson, Darnaby; Sarah Rhodes, Grove; Geri Stites, Jarman; Mandy Lewis, Jefferson; Caroline Quinonez, McAuliffe; Jen Marple, Moore; Linda Cunningham, Peters; Janna Hamilton, Rosa Parks; Nicole Hill, Rosa Parks Early Childhood Education Center; Amanda Kennedy, 6th Grade; Meghan Bender, 7th Grade; Tamarah Danzy, 8th Grade; Millie Gamble, 9th Grade Center; and Courtney McCartney, High School.
Melanie Coday, receptionist for Peters Elementary, was named the 2014-2015 Support Employee of the Year.
Darnaby Elementary teachers Kristen Robinson and Suzanne Martin were recognized as national leaders in Project Lead The Way.
Seventh grade science teacher Michael Lewis was accepted to SET Sail, a STEM workshop at the US Naval Academy in Annapolis, Maryland. Director of Child Nutrition Lisa Griffin and Executive Chef Callie Fowler won a regional recipe contest sponsored by Equipment Preference, Inc. (EPI), a broker for kitchen equipment. Their prize was a trip to the EPI culinary exposition in Austin, Texas, plus a $1000 scholarship for a Union student.
Jarman principal Shawna Thompson received the 2015 University of Oklahoma Young Educator Award which honors practicing educators who have demonstrated distinctive achievements in elementary, secondary, or community education careers. Winners must be alumni of the Jeannine Rainbolt College of Education who have not passed their 40th birthday.
Seventh grade music teacher Abby Bruce was named Young Oklahoma Bandmaster of the Year and was inducted into the Phi Beta Mu International Band Directors Fraternity.
Speech and debate coach Christian Jones earned a First Diamond degree of membership in the National Speech & Debate Association’s Honor Society, and was recognized in Rostrum, the official magazine of the National Speech & Debate Association.
Clark Elementary fifth grade teacher Kent Jones was named the recipient of the 2015 Tex Richardson Engineering & Science Guidance Award. The annual award honors teachers who provide exemplary career guidance to students, and Jones was recognized for his work with students in an after-school engineering club, The Building Club, where students worked on various projects such as building training boards for Therapetics Service Dogs of Oklahoma.
Sue Haralson was named a national Native American Teacher of the Year, and Union Public Schools was honored for its exemplary Native American programs during the National Johnson-O’Malley Organization conference in Portland, Oregon.
Varsity football coach Kirt Fridrich was honored by the Boren Mentoring Initiative for his commitment to young people, his community, and mentoring.
McAuliffe Elementary first grade teacher Charity Guinn was featured in Oklahoma Country. The article focused on how she plants her country roots in her urban classroom through the Ag in the Classroom curriculum. She uses agricultural lessons to teach her students the importance of food production and community roles.
Darnaby and Moore Elementary schools earned the Most Improved Safety award for the third quarter; and Boevers Elementary, Alternative Education, and Rosa Parks Early Childhood Education Center earned Top Performer. They were served breakfast through the generous financial support of TRC Disaster Solutions.
10
Union Public Schools District ProfileFiscal Year Ending June 30, 2015
The Oklahoma Energy Resources Board (OERB) selected High School teacher Jona Ghose as the winner of the 2015 Harlan Krumme Memorial Energy Education Grant. Ghose was chosen for her innovative techniques in teaching her students about oil and natural gas, and she received $500 for classroom materials and an additional
$500 for personal use.
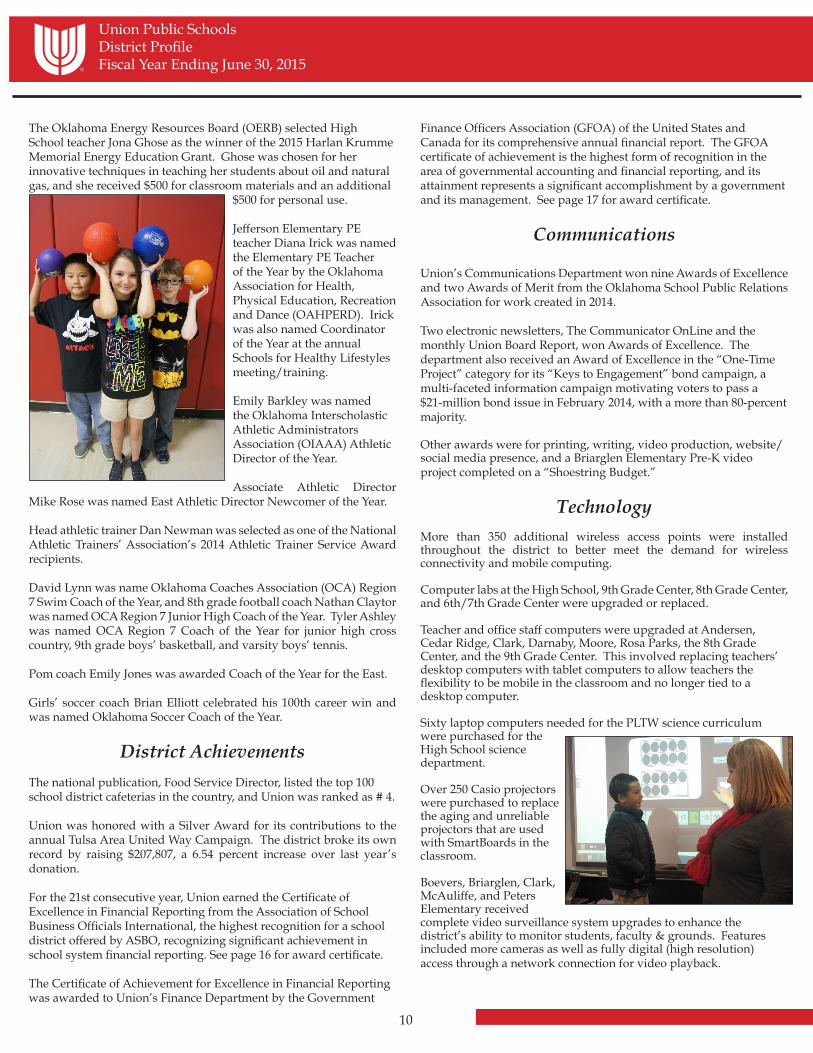
Jefferson Elementary PE teacher Diana Irick was named the Elementary PE Teacher of the Year by the Oklahoma Association for Health, Physical Education, Recreation and Dance (OAHPERD). Irick was also named Coordinator of the Year at the annual Schools for Healthy Lifestyles meeting/training.
Emily Barkley was named the Oklahoma Interscholastic Athletic Administrators Association (OIAAA) Athletic Director of the Year.
Associate Athletic Director Mike Rose was named East Athletic Director Newcomer of the Year.
Head athletic trainer Dan Newman was selected as one of the National Athletic Trainers’ Association’s 2014 Athletic Trainer Service Award recipients.
David Lynn was name Oklahoma Coaches Association (OCA) Region 7 Swim Coach of the Year, and 8th grade football coach Nathan Claytor was named OCA Region 7 Junior High Coach of the Year. Tyler Ashley was named OCA Region 7 Coach of the Year for junior high cross country, 9th grade boys’ basketball, and varsity boys’ tennis.
Pom coach Emily Jones was awarded Coach of the Year for the East.
Girls’ soccer coach Brian Elliott celebrated his 100th career win and was named Oklahoma Soccer Coach of the Year.
District Achievements
The national publication, Food Service Director, listed the top 100 school district cafeterias in the country, and Union was ranked as # 4.
Union was honored with a Silver Award for its contributions to the annual Tulsa Area United Way Campaign. The district broke its own record by raising $207,807, a 6.54 percent increase over last year’s donation.
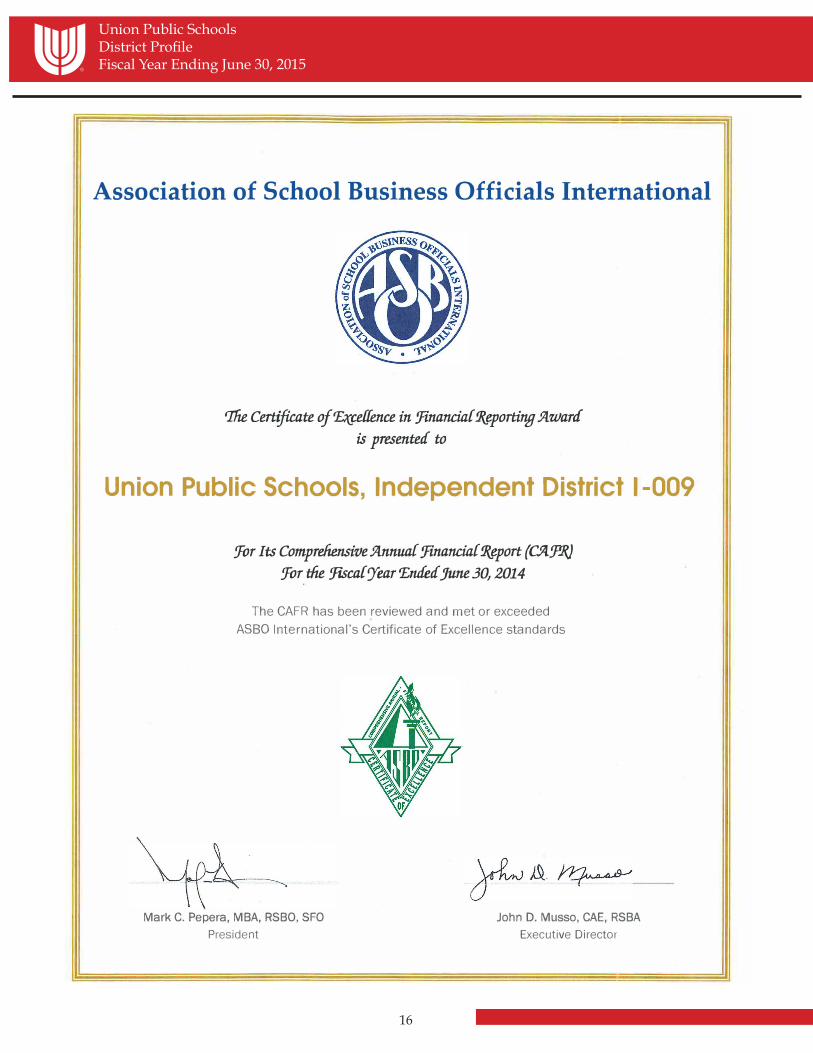
For the 21st consecutive year, Union earned the Certificate of Excellence in Financial Reporting from the Association of School Business Officials International, the highest recognition for a school district offered by ASBO, recognizing significant achievement in school system financial reporting. See page 16 for award certificate.
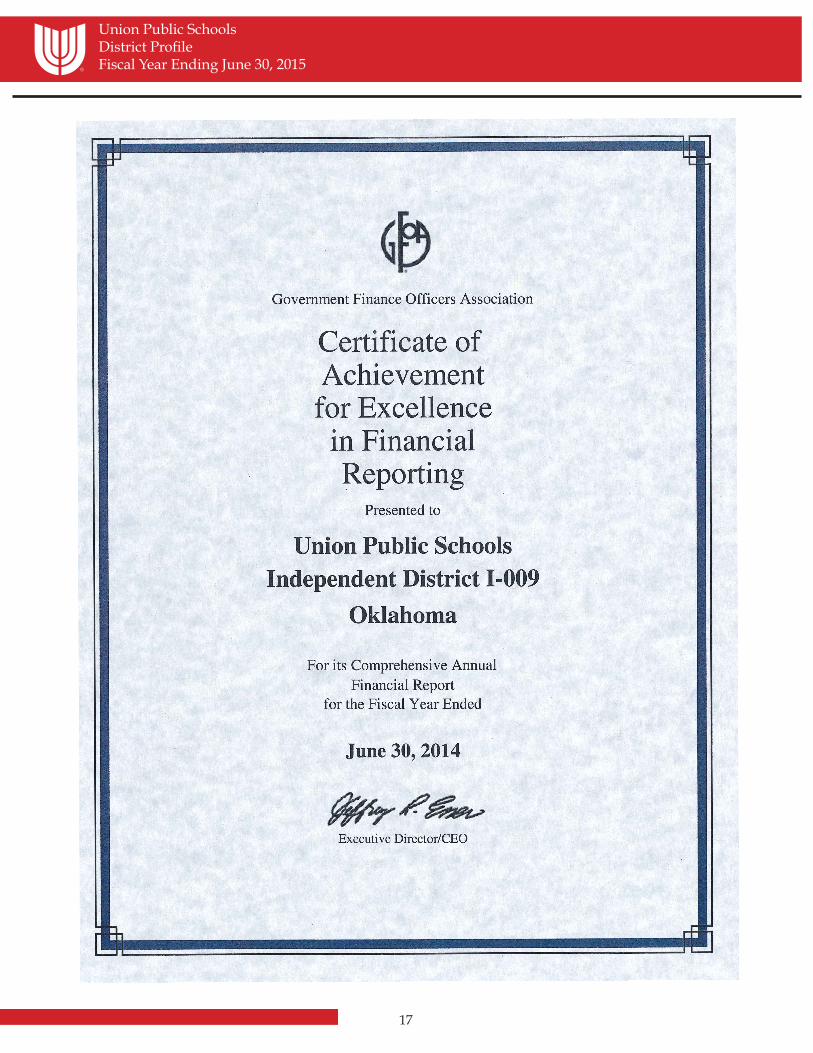
The Certificate of Achievement for Excellence in Financial Reporting was awarded to Union’s Finance Department by the Government
Finance Officers Association (GFOA) of the United States and Canada for its comprehensive annual financial report. The GFOA certificate of achievement is the highest form of recognition in the area of governmental accounting and financial reporting, and its attainment represents a significant accomplishment by a government and its management. See page 17 for award certificate.
Communications
Union’s Communications Department won nine Awards of Excellence and two Awards of Merit from the Oklahoma School Public Relations Association for work created in 2014.
Two electronic newsletters, The Communicator OnLine and the monthly Union Board Report, won Awards of Excellence. The department also received an Award of Excellence in the “One-Time Project” category for its “Keys to Engagement” bond campaign, a multi-faceted information campaign motivating voters to pass a $21-million bond issue in February 2014, with a more than 80-percent majority. Other awards were for printing, writing, video production, website/social media presence, and a Briarglen Elementary Pre-K video project completed on a “Shoestring Budget.”
TechnologyMore than 350 additional wireless access points were installed throughout the district to better meet the demand for wireless connectivity and mobile computing.
Computer labs at the High School, 9th Grade Center, 8th Grade Center, and 6th/7th Grade Center were upgraded or replaced.
Teacher and office staff computers were upgraded at Andersen, Cedar Ridge, Clark, Darnaby, Moore, Rosa Parks, the 8th Grade Center, and the 9th Grade Center. This involved replacing teachers’ desktop computers with tablet computers to allow teachers the flexibility to be mobile in the classroom and no longer tied to a desktop computer.
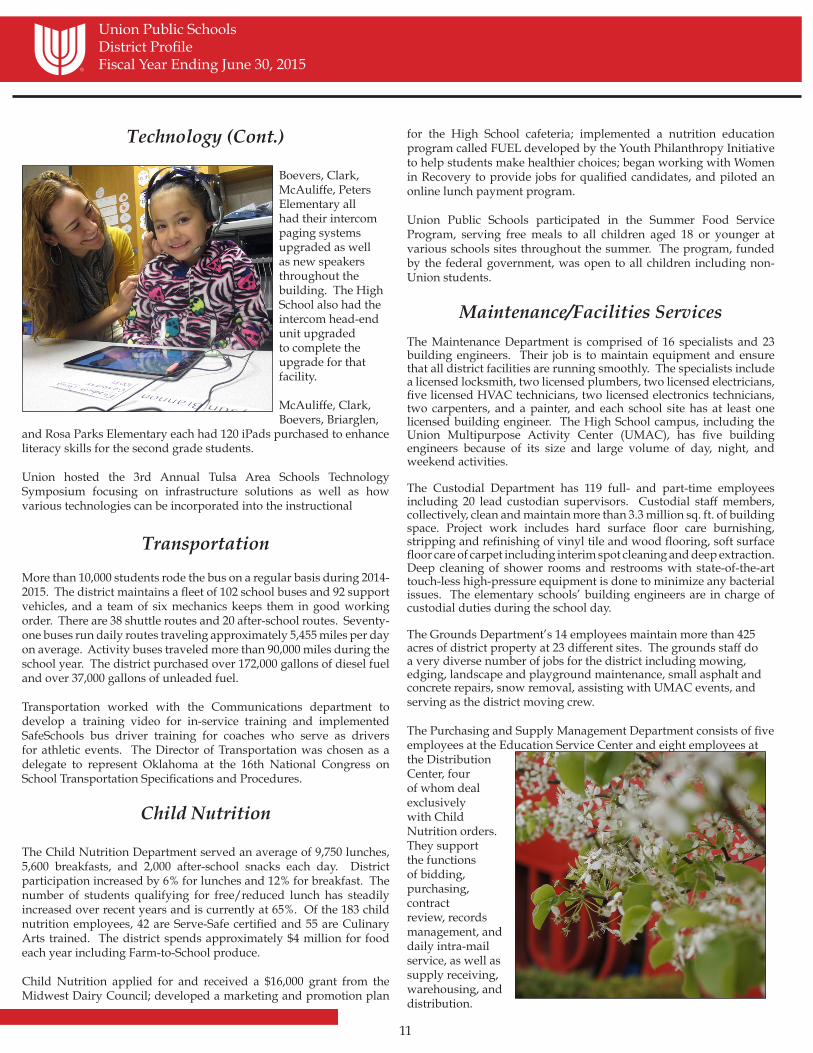
Sixty laptop computers needed for the PLTW science curriculum were purchased for the High School science department.
Over 250 Casio projectors were purchased to replace the aging and unreliable projectors that are used with SmartBoards in the classroom.
Boevers, Briarglen, Clark, McAuliffe, and Peters Elementary received complete video surveillance system upgrades to enhance the district’s ability to monitor students, faculty & grounds. Features included more cameras as well as fully digital (high resolution) access through a network connection for video playback.
11
Union Public Schools District ProfileFiscal Year Ending June 30, 2015
Technology (Cont.)
Boevers, Clark, McAuliffe, Peters Elementary all had their intercom paging systems upgraded as well as new speakers throughout the building. The High School also had the intercom head-end unit upgraded to complete the upgrade for that facility.
McAuliffe, Clark, Boevers, Briarglen,
and Rosa Parks Elementary each had 120 iPads purchased to enhance literacy skills for the second grade students.
Union hosted the 3rd Annual Tulsa Area Schools Technology Symposium focusing on infrastructure solutions as well as how various technologies can be incorporated into the instructional
Transportation
More than 10,000 students rode the bus on a regular basis during 2014-2015. The district maintains a fleet of 102 school buses and 92 support vehicles, and a team of six mechanics keeps them in good working order. There are 38 shuttle routes and 20 after-school routes. Seventy-one buses run daily routes traveling approximately 5,455 miles per day on average. Activity buses traveled more than 90,000 miles during the school year. The district purchased over 172,000 gallons of diesel fuel and over 37,000 gallons of unleaded fuel.
Transportation worked with the Communications department to develop a training video for in-service training and implemented SafeSchools bus driver training for coaches who serve as drivers for athletic events. The Director of Transportation was chosen as a delegate to represent Oklahoma at the 16th National Congress on School Transportation Specifications and Procedures.
Child Nutrition
The Child Nutrition Department served an average of 9,750 lunches, 5,600 breakfasts, and 2,000 after-school snacks each day. District participation increased by 6% for lunches and 12% for breakfast. The number of students qualifying for free/reduced lunch has steadily increased over recent years and is currently at 65%. Of the 183 child nutrition employees, 42 are Serve-Safe certified and 55 are Culinary Arts trained. The district spends approximately $4 million for food each year including Farm-to-School produce.
Child Nutrition applied for and received a $16,000 grant from the Midwest Dairy Council; developed a marketing and promotion plan
for the High School cafeteria; implemented a nutrition education program called FUEL developed by the Youth Philanthropy Initiative to help students make healthier choices; began working with Women in Recovery to provide jobs for qualified candidates, and piloted an online lunch payment program.
Union Public Schools participated in the Summer Food Service Program, serving free meals to all children aged 18 or younger at various schools sites throughout the summer. The program, funded by the federal government, was open to all children including non-Union students.
Maintenance/Facilities ServicesThe Maintenance Department is comprised of 16 specialists and 23 building engineers. Their job is to maintain equipment and ensure that all district facilities are running smoothly. The specialists include a licensed locksmith, two licensed plumbers, two licensed electricians, five licensed HVAC technicians, two licensed electronics technicians, two carpenters, and a painter, and each school site has at least one licensed building engineer. The High School campus, including the Union Multipurpose Activity Center (UMAC), has five building engineers because of its size and large volume of day, night, and weekend activities.
The Custodial Department has 119 full- and part-time employees including 20 lead custodian supervisors. Custodial staff members, collectively, clean and maintain more than 3.3 million sq. ft. of building space. Project work includes hard surface floor care burnishing, stripping and refinishing of vinyl tile and wood flooring, soft surface floor care of carpet including interim spot cleaning and deep extraction. Deep cleaning of shower rooms and restrooms with state-of-the-art touch-less high-pressure equipment is done to minimize any bacterial issues. The elementary schools’ building engineers are in charge of custodial duties during the school day.
The Grounds Department’s 14 employees maintain more than 425 acres of district property at 23 different sites. The grounds staff do a very diverse number of jobs for the district including mowing, edging, landscape and playground maintenance, small asphalt and concrete repairs, snow removal, assisting with UMAC events, and serving as the district moving crew.
The Purchasing and Supply Management Department consists of five employees at the Education Service Center and eight employees at the Distribution Center, four of whom deal exclusively with Child Nutrition orders. They support the functions of bidding, purchasing, contract review, records management, and daily intra-mail service, as well as supply receiving, warehousing, and distribution.

12
Union Public Schools District ProfileFiscal Year Ending June 30, 2015
Safety and Security
More than 6,740 safety training videos were completed with a 95% successful completion rate, and routine site safety walks were completed at all sites. The SafeSchools Alert program was successfully implemented, and safety training was incorporated into substitute workshops. A Chemical Hygiene Plan and a Safety Patrol handbook were written, implemented, and distributed. The injury incurred cost rate decreased from a seven-year average of $770,000
per semester to $142,888 for the first semester of 2014-2015. The claim litigation rate improved from 12.62% in 2011-2012 to 0% in 2014-2015.
In addition to the Director of Security and a district Security Coordinator, the district employed ten full-time security officers at the secondary
schools and 25 part-time officers for athletic and special events. One Broken Arrow School Resource Officer was on call daily in addition to six off-duty Tulsa Police Department officers on a rotating schedule, allowing one to patrol the district each day. The district partnered with the Tulsa Tech Criminal Justice Department to allow Tech students to shadow security officers during sporting events.
Union Multipurpose Activity Center
The Facilities Department includes 2.5 employees who scheduled and coordinated 14,056 activities throughout the district during the 2014-15 school year. This included 128,097 room hours and 1,351,988 attendees to the events. The department also oversees the U-Wear store, with one full-time employee, which markets Union spirit wear and items.
Facility scheduling not only encompasses the actual event but all the communications, operations, and maintenance to prepare, set up, run, and clean up every event. This makes accurate scheduling very important. An estimated 34,818 activities occurred during the year, and there were 2,274 facility rentals to outside groups which involved scheduling, contracts, scheduling conflict resolution, staffing, and set up and tear down.
Construction/Facilities
The Track project included a new track surface, an artificial turf football field, a track facility including locker rooms, restrooms, coaches’ offices, concession area, and ticket office, a new discus and shot throwing area, bleacher modifications, new sidewalks and plaza area, a new press box, a new scoreboard, a band observation tower, new fencing, and additional landscape.
The 6th/7th Grade Center Expansion Project, Phase 2, included nine
new classrooms, a new office area and conference rooms, a nurses’ office, a clinic, several small offices, a new entry and plaza area, landscaping, resealing/re-striping the entire parking lot, expansion of the bus loop plus additional sidewalks, and other finish upgrades such as new paint to beautify the campus.
The 8th Grade Center Expansion Project, Phase 1, includes a new fine arts wing (band room, orchestra room, choir room, and visual art room), a new gym, a football locker room, a weight room, a training room, storage, a new soccer space (includes larger locker rooms, coaches’ offices, and concession area), restroom upgrades, and parking entry and exit changes to separate the 8th Grade Center parking from McAuliffe Elementary parking. The work completed over the summer included the relocation and/or replacement of numerous underground utility lines and new entry and parking lot installation at McAuliffe Elementary.
The Operations Complex project included the addition of a modular building for technology employees and purchase of, or repairs, to equipment. Structures of all of the freezers and coolers in the warehouse were sealed. Some of the other projects completed in the complex included improved lighting, doors, compressors, walls and ceilings, flooring, shelving, and overhead door and spring replacement. Climate control areas were expanded in the warehouse; three sections of the parking lot and driveway were replaced; and the transportation mechanic pits were filled for safety reasons.
Among the larger school site projects were flooring replacements at Clark Elementary and Peters Elementary. The Peters Elementary gym and cafeteria floors were also replaced.
Other smaller projects included:• The Andersen Elementary cabinet replacement project was
completed.• The softball field upgrade project, including new dugouts,
storage rooms, and infield grading and drain installation, was completed.
• The High School minor renovation project included the removal of two locker areas to create a Rockets and Robots work room and a storage room, and two rooms received separation walls to create new additional classrooms.
• The 6th/7th Grade Center kitchen floor replacement project was completed.
• Boevers, Briarglen, Clark, Darnaby, McAuliffe, 6th/7th, and 9th Grade Center received kitchen supply and exhaust fan replacements.
• A new walk-in freezer/cooler was installed at Darnaby Elementary, and they received a new dish-machine as well.
• Parking lots at the 9th Grade Center and Rosa Parks were resealed and re-striped.

13
Union Public Schools District ProfileFiscal Year Ending June 30, 2015
Economic Condition
Union Public Schools is located within the Tulsa Metropol-itan Statistical Area (MSA), a seven-coun-ty area whose population exceeds 969,224 or 25 percent of the population of the state of Okla-homa. The Tulsa Metropolitan Cham-ber of Commerce
reports Tulsa’s major industries as aerospace parts manufacturing and aviation, transportation, distribution and logistics; machinery and electrical equipment manufacturing; health care; and petroleum and natural gas. The Chamber estimates the value of all goods and services produced in the Tulsa MSA for 2014 at $50.9 billion, or 30.7 percent of the Oklahoma economy.
Forbes recently named Tulsa the 70th best place to do business and have a career. Tulsa’s economy grew faster than the U.S. average in 2014 in both employment and in the production of goods and ser-vices, but a fourth quarter drop in oil prices has negatively affected gross domestic product and employment outlook for 2015. Despite this negative impact, Tulsa continues to be a prime location for employers looking to relocate or expand due to a low cost of doing business at 15 percent below the U.S. average; a desirable central location; and a cost of living that is 11 percent below the U.S. average. According to the Tulsa Metropolitan Chamber of Commerce, em-ployment should continue to increase by .08 percent in 2015, down slightly from 1.6 percent in 2014 as a result of oil prices impacting employment with no additional hiring or layoffs.
Many publications have praised the Tulsa MSA for strong economic rankings, including:
• #2 – “Best Cities to Start a Business” – WalletHub, 2015• #5 – “Most Affordable Big Cities in the U.S.” – Kiplinger, 2015• #10 – “Ten Best Cities for New Grads to Launch Their Careers” – The
Fiscal Times, 2015• #10 – “20 Best Places to Live in Your 20’s” – WalletHub, 2015• #37 – “Best Cities for Cost of Doing Business” – Forbes, 2015 The area’s economy has continued to remain strong in the national and international financial markets despite reductions in oil prices. The Office of the State Treasurer maintains reports that the state end-ed fiscal year 2015 with 1.8 percent higher revenues than the prior year. The slight increase in revenue is attributed to various economic indicators such as gross income tax (up 6.5 percent) and sales tax (up 3.4 percent). A reduction in oil prices has hindered revenue collec-tion increases for FY 2015, although collections are higher than FY 2014.
The unemployment rate in the Tulsa MSA was 5.7 percent in 2013, and then decreased to a 2014 level of 4.8 percent, with a 2015 project-ed rate of 4.0 percent, 1.5 percent below the U.S. average. The Tulsa Chamber projects the unemployment rate will continue to decrease through 2019 despite drops in oil prices.
Union Public Schools contributes to Tulsa’s workplace initiatives by offering community programs for both adults and children such as:
• Adult Basic Education – classes for adults who need basic instruction in reading, writing, math and life skills,
• Workplace Education – links education goals to the employer’s desire for high performance work and product quality,
• GED Preparation – instruction to prepare adults to take the Tests of General Educational Development (GED),
• English as a Second Language (ESL) – instruction to non-English speaking adults to help them be productive citizens of our community.
The Adult Education program exceeded their goal in school year 2014-2015 by serving over 3,300 students. Due to program expansion that includes six Northeastern Oklahoma counties and 50 classes, the program predicts continued growth in school year 2015-2016 with estimates beyond 3,500 adults.
In addition to helping many adults in the community, Union Public Schools has formed relationships with numerous Tulsa area programs including: • Asbury Learning Center• The Carrera Program• CAP (Community Action Project)• Department of Human Services• Arts and Humanities Council of Tulsa• Metropolitan Tulsa Urban League • South Tulsa Community House• Northeastern State University• Oklahoma State University• Tulsa Community College • Tulsa Technology Center • Workforce Tulsa Eastgate Metroplex, Pryor, and Muskogee
The District provides opportunities for community involvement through Community Schools, a program that connects businesses, lo-cal agencies, and foundations with Union Public Schools to improve quality of life for students, families, and surrounding areas. Utilizing the Tulsa Area Community Schools Initiative vision, Union continues to work with organizations to provide activities and programs that bring communities closer.
STEM programs continue to provide positive educational learn-ing opportunities at Union Public Schools. Through access to cutting-edge labs from elementary to the Union Collegiate Academy, the STEM program provides a unique approach to learning to further students’ interests in science, technology, engineering, and mathematics fields.
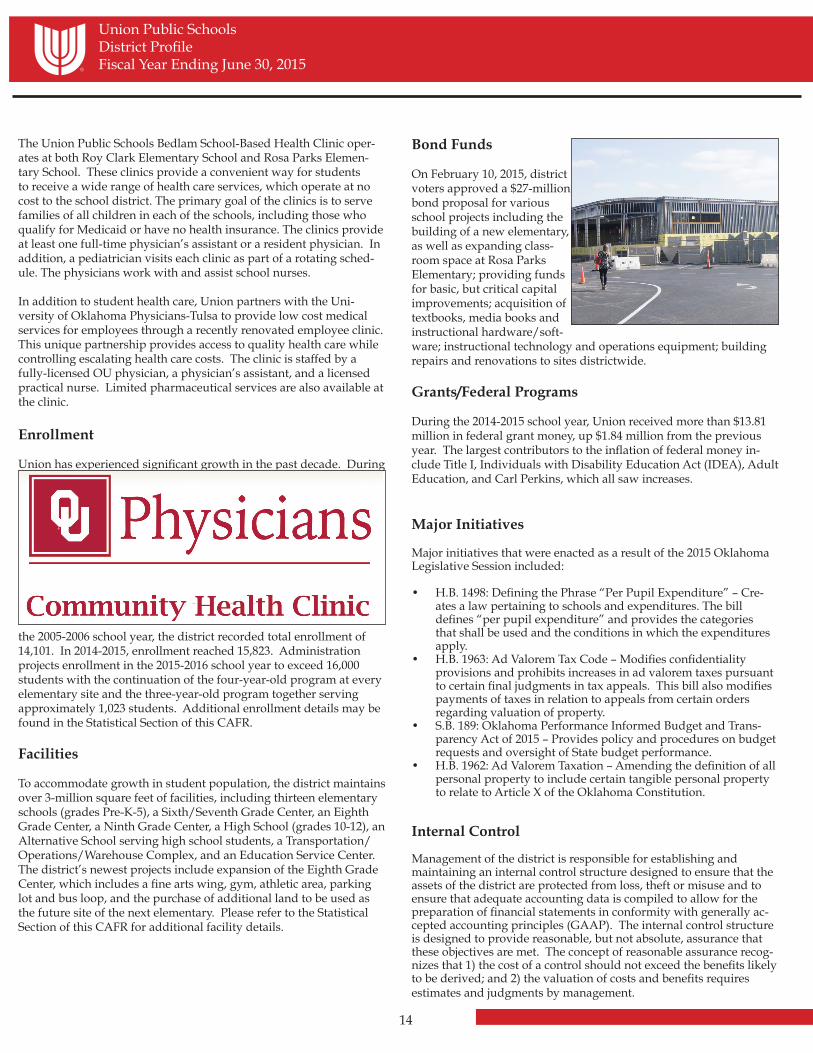
Union Public Schools sustains efforts to deliver superior healthcare to the district. A collaborative effort between the University of Oklahoma (OU) Bed-lam Community Health Clinic and Union Public Schools produces cutting-edge services for the Union community.
14
Union Public Schools District ProfileFiscal Year Ending June 30, 2015
The Union Public Schools Bedlam School-Based Health Clinic oper-ates at both Roy Clark Elementary School and Rosa Parks Elemen-tary School. These clinics provide a convenient way for students to receive a wide range of health care services, which operate at no cost to the school district. The primary goal of the clinics is to serve families of all children in each of the schools, including those who qualify for Medicaid or have no health insurance. The clinics provide at least one full-time physician’s assistant or a resident physician. In addition, a pediatrician visits each clinic as part of a rotating sched-ule. The physicians work with and assist school nurses.
In addition to student health care, Union partners with the Uni-versity of Oklahoma Physicians-Tulsa to provide low cost medical services for employees through a recently renovated employee clinic. This unique partnership provides access to quality health care while controlling escalating health care costs. The clinic is staffed by a fully-licensed OU physician, a physician’s assistant, and a licensed practical nurse. Limited pharmaceutical services are also available at the clinic.
Enrollment
Union has experienced significant growth in the past decade. During
the 2005-2006 school year, the district recorded total enrollment of 14,101. In 2014-2015, enrollment reached 15,823. Administration projects enrollment in the 2015-2016 school year to exceed 16,000 students with the continuation of the four-year-old program at every elementary site and the three-year-old program together serving approximately 1,023 students. Additional enrollment details may be found in the Statistical Section of this CAFR.
Facilities
To accommodate growth in student population, the district maintains over 3-million square feet of facilities, including thirteen elementary schools (grades Pre-K-5), a Sixth/Seventh Grade Center, an Eighth Grade Center, a Ninth Grade Center, a High School (grades 10-12), an Alternative School serving high school students, a Transportation/Operations/Warehouse Complex, and an Education Service Center. The district’s newest projects include expansion of the Eighth Grade Center, which includes a fine arts wing, gym, athletic area, parking lot and bus loop, and the purchase of additional land to be used as the future site of the next elementary. Please refer to the Statistical Section of this CAFR for additional facility details.
Bond Funds
On February 10, 2015, district voters approved a $27-million bond proposal for various school projects including the building of a new elementary, as well as expanding class-room space at Rosa Parks Elementary; providing funds for basic, but critical capital improvements; acquisition of textbooks, media books and instructional hardware/soft-ware; instructional technology and operations equipment; building repairs and renovations to sites districtwide.
Grants/Federal Programs
During the 2014-2015 school year, Union received more than $13.81 million in federal grant money, up $1.84 million from the previous year. The largest contributors to the inflation of federal money in-clude Title I, Individuals with Disability Education Act (IDEA), Adult Education, and Carl Perkins, which all saw increases. Major Initiatives
Major initiatives that were enacted as a result of the 2015 Oklahoma Legislative Session included:
• H.B. 1498: Defining the Phrase “Per Pupil Expenditure” – Cre-ates a law pertaining to schools and expenditures. The bill defines “per pupil expenditure” and provides the categories that shall be used and the conditions in which the expenditures apply.
• H.B. 1963: Ad Valorem Tax Code – Modifies confidentiality provisions and prohibits increases in ad valorem taxes pursuant to certain final judgments in tax appeals. This bill also modifies payments of taxes in relation to appeals from certain orders regarding valuation of property.
• S.B. 189: Oklahoma Performance Informed Budget and Trans-parency Act of 2015 – Provides policy and procedures on budget requests and oversight of State budget performance.
• H.B. 1962: Ad Valorem Taxation – Amending the definition of all personal property to include certain tangible personal property to relate to Article X of the Oklahoma Constitution.
Internal Control
Management of the district is responsible for establishing and maintaining an internal control structure designed to ensure that the assets of the district are protected from loss, theft or misuse and to ensure that adequate accounting data is compiled to allow for the preparation of financial statements in conformity with generally ac-cepted accounting principles (GAAP). The internal control structure is designed to provide reasonable, but not absolute, assurance that these objectives are met. The concept of reasonable assurance recog-nizes that 1) the cost of a control should not exceed the benefits likely to be derived; and 2) the valuation of costs and benefits requires estimates and judgments by management.
15
Kirt Hartzler, Ed.D.Superintendent
Debra J. Jacoby, CPAChief Financial Officer/Treasurer
Catherine L. Bentley, CPADirector of Financial Reporting/Treasury
Gail Easterling, CPADirector of Accounting
Union Public Schools District ProfileFiscal Year Ending June 30, 2015
Long-Term Financial Planning
The Board of Education of Union Public Schools, in conjunction with the Superintendent and Chief Financial Officer, establishes a system of sound financial planning and management to assure that the district’s objectives are addressed and that funds are expended in accordance with plans expressed through the Board budget. The financial management system components include: 1) a planning process that con-sists of a review of state statutes, Board policies, concepts, ideas, problems, constraints, approaches and systems before dollar amounts are established in the budget; and 2) a budget that is the expression of the plans of the Board through three main budgets – the General Fund, a Special Revenue Fund, and the Child Nutrition Fund.
Budgetary Controls
The district utilizes budgetary controls to ensure compliance with legal appropriation limitations and to provide an operating plan for the district’s resources. The annual appropriated budget includes activity of the General, Special Revenue Funds, and Child Nutrition Funds. Capital projects activity is controlled with approval of project-length financial plans. Initial budgets are adopted at the beginning of the fiscal year with periodic amendments approved by the Board as necessary.
The level of budgetary control is maintained by fund, project, and function of the OCAS (Oklahoma Cost Accounting System.) Individual line items may be adjusted without Board action, but total budgeted expenditures may not exceed appropriations at the major fund level without Board approval. The district utilizes an encumbrance system as a technique of budgetary control with encumbered appropriations lapsing at year end.
Independent Audit
Oklahoma state statutes require an annual audit by independent certified public accountants. The accounting firm of RSM US LLP, was selected by the Board to conduct the audit. In addition to meeting the requirements set forth in state statutes, the audit was also designed to meet the requirements of the Federal Single Audit Act of 1984 and related Uniform Grant Guidance (UGG). The auditor’s report on the basic financial statements is included in the financial section of this report. Closing
Sincerely,
16
Union Public Schools District ProfileFiscal Year Ending June 30, 2015
Association of School Business Officials International
'Ifie. Certificate of '4,ceffence in Jina,ic,ia{ !l(gporting .9Lwartf is presentetf to
Union Public Schools, Independent District I-009
17
Union Public Schools District ProfileFiscal Year Ending June 30, 2015

18
Union Public Schools District ProfileFiscal Year Ending June 30, 2015
2014-2015BOARD OF EDUCATION
JeffBennettDistrict #12011-2016
PatrickCoyleDistrict #22012-2017
Heather McAdamsDistrict #32013-2018
Stacey RoemermanDistrict #42014-2019
EdPaytonDistrict #52010-2015Retired Feb. 2015
KenKinnearDistrict #52015-2020Inducted Feb. 2015
2014-2015 Administrators
Dr. Kirt Hartzler, Ed.D.. ...........................................................................................SuperintendentDebra Jacoby, CPA .................................................................... Chief Financial Officer/TreasurerDr. Kathy Dodd ......................................................................................Associate SuperintendentCharlie Bushyhead ....................................................Asst. Superintendent for Support ServicesGretchen Haas-Bethell ..............................................Sr. Executive Director of CommunicationsCynthia Solomon .................................................... Sr. Executive Director of Human ResourcesJackie White ..............................................................Sr. Executive Director of Federal ProgramsTodd Borland ........................................................................... Executive Director of TechnologySandi Calvin ........................................................... Executive Director of Elementary Education Todd Nelson .............................................................Executive Director of Student AchievementLee Snodgrass .................................................................... Executive Director of Special ProjectsLisa Witcher ............................................................. Executive Director of Secondary Education
Emily Barkley .................................................................................................. Director of AthleticsCathy Bentley, CPA .................................................... Director of Financial Reporting/TreasuryGail Easterling, CPA ....................................................................................Director of AccountingGary Greenhill .......................................................................................Director of TransportationLisa Griffin ........................................................................................... Director of Child NutritionFred Isaacs ..................................................................................Director of Construction ServicesDr. Penny Kay ......................................................................................Director of Special Services Matt McCready ................................................................................................Director of Fine ArtsDave Stauffer ........................................................................................................ Director of SafetyTy Wardlow ....................................................................................................... Director of SecurityDavid Young .........................................................Director of Purchasing/Supply Management
Kelly Brassfield ............................................................................................... IT Program DirectorSusan Crowder ........................................................................Director of Professional Standards Sherri Fair ........................................................................Director of Student Data & AssessmentJoanna Jamison ..................................................................................Director of Adult EducationSarah McBryde ................................................................................................ Director of Facilities
Christine Bunyard ............................................................................ Associate Director of Payroll Becky Byers, CPA ............................................................................. Associate Director of Budget Steve Dunlap .........................................................................................Associate Athletic DirectorKirk Fridrich .........................................................................................Associate Athletic DirectorJay Loegering .................................................................Associate Director of Human ResourcesCharles Pisarra ...............................................................................Associate Director of Fine ArtsMike Rose ..............................................................................................Associate Athletic Director
2014-2015 Principals
Gart Morris,Tony Tempest, John Chargois ................................................................ High SchoolJohn Federline ...................................................................................................Ninth Grade Center Richard Storm ..................................................................................................... Alternative SchoolMarla Robinson .............................................................................................. Eighth Grade CenterSteve Pittman,Tamra Bird ................................................................Sixth/Seventh Grade CenterBethany Harper ............................................................................................ Andersen ElementaryAlycia Pennington ............................................................................................Boevers ElementaryTracy Weese .................................................................................................... Briarglen ElementaryEllen Crager ............................................................................................. Cedar Ridge ElementaryTheresa Kiger ........................................................................................................Clark ElementaryChris Reynolds ............................................................................................... Darnaby ElementaryKim Berns .............................................................................................................Grove ElementaryShawna Thompson ...........................................................................................Jarman ElementaryKim Rampey ................................................................................................... Jefferson ElementaryRita Long .......................................................................................................McAuliffe ElementaryLindsay Smith .....................................................................................................Moore ElementaryChasity Gray ........................................................................................................Peters ElementaryKaren Vance ................................................................................................ Rosa Parks Elementary
Lynn McClure .................................................... Rosa Parks Early Childhood Education Center
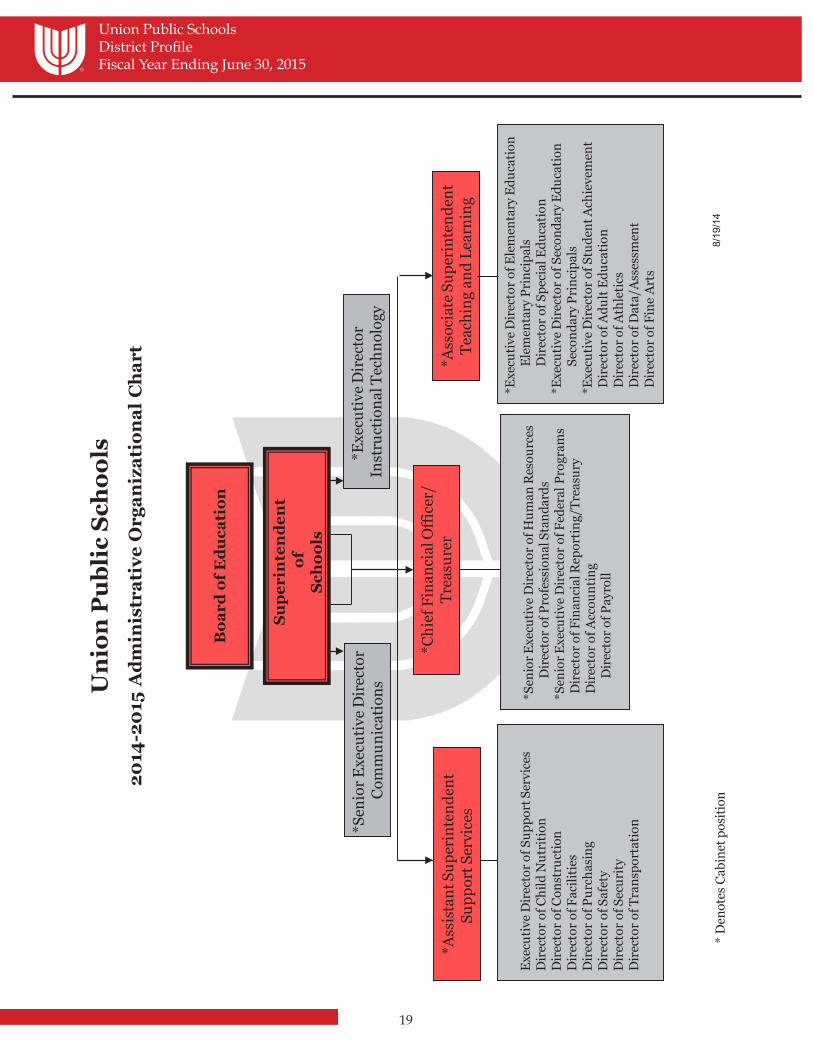
19
Union Public Schools District ProfileFiscal Year Ending June 30, 2015
Boa
rd o
f Edu
cati
on
*Sen
ior E
xecu
tive
Dir
ecto
r of H
uman
Res
ourc
esD
irec
tor o
f Pro
fess
iona
l Sta
ndar
ds*S
enio
r Exe
cutiv
e D
irec
tor o
f Fed
eral
Pro
gram
sD
irec
tor o
f Fin
anci
al R
epor
ting/
Trea
sury
Dir
ecto
r of A
ccou
ntin
gD
irec
tor o
f Pay
roll
Uni
on P
ubli
c Sc
hool
s20
14-2
015
Adm
inis
trat
ive
Org
aniz
atio
nal C
hart
*Ass
ista
nt S
uper
inte
nden
tSu
ppor
t Ser
vice
s *A
ssoc
iate
Sup
erin
tend
ent
Teac
hing
and
Lea
rnin
g
*Chi
ef F
inan
cial
Offi
cer/
Trea
sure
r
Supe
rin
ten
den
tof
Sc
hool
s
*Exe
cutiv
e Dir
ecto
rIn
stru
ctio
nal T
echn
olog
y*S
enio
r Exe
cutiv
e Dir
ecto
rCo
mm
unic
atio
ns
Exec
utiv
e D
irec
tor o
f Sup
port
Ser
vice
sD
irec
tor o
f Chi
ld N
utri
tion
Dir
ecto
r of C
onst
ruct
ion
Dir
ecto
r of F
acili
ties
Dir
ecto
r of P
urch
asin
g D
irec
tor o
f Saf
ety
Dir
ecto
r of S
ecur
ityD
irec
tor o
f Tra
nspo
rtat
ion
*Exe
cutiv
e Dir
ecto
r of E
lem
enta
ry E
duca
tion
Elem
enta
ry P
rinc
ipal
s D
irec
tor o
f Spe
cial
Edu
catio
n*E
xecu
tive D
irec
tor o
f Sec
onda
ry E
duca
tion
Seco
ndar
y Pr
inci
pals
*Exe
cutiv
e Dir
ecto
r of S
tude
nt A
chie
vem
ent
Dir
ecto
r of A
dult
Educ
atio
nD
irec
tor o
f Ath
letic
sD
irec
tor o
f Dat
a/As
sess
men
tD
irec
tor o
f Fin
e Ar
ts
* D
enot
es C
abin
etpo
sitio
n8/
19/1
4

This page intentionally left blank.
20
21
Independent Auditor’s Report To the Board of Education Union Public Schools Tulsa, Oklahoma Report on the Financial Statements We have audited the accompanying financial statements of the governmental activities, business-type activities, each major fund, and the aggregate remaining fund information of Union Public Schools (the “District”) as of and for the year ended June 30, 2015, and the related notes to the financial statements, which collectively comprise the District’s basic financial statements as listed in the table of contents. Management’s Responsibility for the Financial Statements Management is responsible for the preparation and fair presentation of these financial statements in accordance with accounting principles generally accepted in the United States of America; this includes the design, implementation, and maintenance of internal control relevant to the preparation and fair presentation of financial statements that are free from material misstatement, whether due to fraud or error. Auditor’s Responsibility Our responsibility is to express opinions on these financial statements based on our audit. We conducted our audit in accordance with auditing standards generally accepted in the United States of America. Those standards require that we plan and perform the audit to obtain reasonable assurance about whether the financial statements are free of material misstatement. An audit involves performing procedures to obtain audit evidence about the amounts and disclosures in the financial statements. The procedures selected depend on the auditor’s judgment, including the assessment of the risks of material misstatement of the financial statements, whether due to fraud or error. In making those risk assessments, the auditor considers internal control relevant to the entity’s preparation and fair presentation of the financial statements in order to design audit procedures that are appropriate in the circumstances, but not for the purpose of expressing an opinion on the effectiveness of the entity’s internal control. Accordingly, we express no such opinion. An audit also includes evaluating the appropriateness of accounting policies used and the reasonableness of significant accounting estimates made by management, as well as evaluating the overall presentation of the financial statements. We believe that the audit evidence we have obtained is sufficient and appropriate to provide a basis for our audit opinions.
22
Opinions In our opinion, the financial statements referred to above present fairly, in all material respects, the respective financial position of the governmental activities, the business-type activities, each major fund, and the aggregate remaining fund information of the District, as of June 30, 2015, and the respective changes in financial position and, where applicable, cash flows thereof, for the year then ended, in accordance with accounting principles generally accepted in the United States of America. Emphasis of Matter As discussed in Note K, in 2015, the District adopted Governmental Accounting Standards Board (GASB) Statement No. 68, Accounting and Financial Reporting for Pensions, and GASB Statement No. 71, Pension Transition of Contributions Made Subsequent to the Measurement Date – an Amendment of GASB Statement No. 68. The provisions of GASB Statements No. 68 and No. 71 required the District to restate its net position as of July 1, 2014 upon adoption. Our opinion is not modified with respect to the matter. Other Matters Required Supplementary Information Accounting principles generally accepted in the United States of America require that the management’s discussion and analysis, the schedule of funding progress for other post employment benefits, the schedule of the District’s proportionate share of the net pension liability, the schedule of the District’s contributions to Oklahoma Teacher’s Retirement System, and the respective budgetary and actual comparison schedules for the General Fund and Building Fund, as listed in the table of contents, be presented to supplement the basic financial statements. Such information, although not a part of the basic financial statements, is required by the Governmental Accounting Standards Board who considers it to be an essential part of financial reporting for placing the basic financial statements in an appropriate operational, economic, or historical context. We have applied certain limited procedures to the required supplementary information in accordance with auditing standards generally accepted in the United States of America, which consisted of inquiries of management about the methods of preparing the information and comparing the information for consistency with management’s responses to our inquiries, the basic financial statements, and other knowledge we obtained during our audit of the basic financial statements. We do not express an opinion or provide any assurance on the information because the limited procedures do not provide us with sufficient evidence to express an opinion or provide any assurance. Other Supplementary Information Our audit was conducted for the purpose of forming opinions on the financial statements that collectively comprise the District’s basic financial statements. The combining financial statements are presented for purposes of additional analysis and are not a required part of the basic financial statements. Such information is the responsibility of management and was derived from and relates directly to the underlying accounting and other records used to prepare the basic financial statements. Such information has been subjected to the auditing procedures applied in the audit of the basic financial statements and certain additional procedures, including comparing and reconciling such information directly to the underlying accounting and other records used to prepare the basic financial statements or to the basic financial statements themselves, and other additional procedures in accordance with auditing standards generally accepted in the United States of America. In our opinion, the combining financial statements are fairly stated in all material respects in relation to the basic financial statements as a whole.
23
Other Information The accompanying Introductory and Statistical sections, as listed in the table of contents, have not been subjected to the procedures applied in the audit of the basic financial statements and, accordingly, we do not express an opinion or provide any assurance on them.
Oklahoma City, Oklahoma December 22, 2015

24
This page is intentionally left blank.
Union Public Schools – Management’s Discussion and Analysis
25
The Management’s Discussion and Analysis of Union Public School District’s financial performance provides a narrative overview of the district’s financial activities for the fiscal year ended June 30, 2015. The intent of this discussion and analysis is to look at the district’s financial performance as a whole. Readers should also review the transmittal letter, notes to the basic financial statements, and supplementary information to enhance their understanding of the district’s financial performance. Financial Highlights Key financial highlights for fiscal year 2015 are as follows: » In total, the district’s net position increased $10.39 million. The net position of governmental activities
increased $9.61 million which represents a 13.44 percent increase from fiscal year 2014 when using the restated beginning net position due to the implementation of GASB 68 and 71.
» The net position of business-type activities increased $774,575 or 18.17 percent from fiscal year 2014. » General revenues accounted for $110.91 million in revenue or 75.60 percent of all revenues. Program
specific revenues in the form of charges for services and sales, grants and contributions accounted for $35.80 million or 24.40 percent of total revenues of $146.72 million.
» The district had $127.97 million in expenses related to governmental activities; only $26.85 million of
these expenses were offset by program specific charges for services, grants or contributions. Expenses are shown in programs that are easily identifiable utilizing the current Oklahoma Cost Accounting System (OCAS) coding structure.
» Among the major funds, the general fund had $111.15 million in revenues, $110.64 million in
expenditures, and $1.0 million in other uses and transfers into the fund resulting in a fund balance increase of $1.51 million. This increase is primarily a result of an increase in state and local revenue collections. The building fund had $4.08 million in revenues, $5.17 million in expenditures, and $82,766 in transfers into the fund yielding a fund balance decrease of $1.01 million. This decrease is primarily attributed to a one-time expenditure for the remodel of the operations complex. Bond fund revenues totaled $134,121. Net bond sale proceeds were $27 million. Expenditures in the bond fund totaled $22.26 million. The sinking fund had $21.58 million in revenues and $21.9 million in expenditures.
» The net position for the child nutrition enterprise fund increased $774,575. This increase resulted from
operating revenues of $2.16 million and non-operating revenues of $6.97 million exceeding operating expenses of $8.36 million.
Overview of the Financial Statements This Comprehensive Annual Financial Report (CAFR) consists of a series of basic financial statements: 1) government-wide financial statements, 2) fund financial statements, and 3) notes to the financial statements. Other supplementary information is included in addition to the basic financial statements. These statements are organized so the reader can understand Union Public School District as a financial whole, an entire operating entity. The statements then proceed to provide an increasingly detailed look at specific financial activities. Government-wide financial statements. The government-wide financial statements are designed to provide information about the activities of the district as a whole, presenting both an aggregate view of the district’s finances and a longer-term view of those finances. The Statement of Net Position presents information on all of the district’s assets, deferred outflows of resources, liabilities, and deferred inflows of resources with the difference reported as net position.
Union Public Schools – Management’s Discussion and Analysis
26
The Statement of Activities presents information showing how the district’s net position changed during fiscal year 2015. While this document contains the large number of funds used by the district to provide programs and activities, the view of the district as a whole looks at all financial transactions and asks the question, “How did we do financially during 2015?” The Statement of Net Position and the Statement of Activities answer this question. These statements include all assets, deferred outflows of resources, liabilities, and deferred inflows of resources using the accrual basis of accounting similar to the accounting used by most private-sector companies. This basis of accounting takes into account all of the current year’s revenues and expenditures regardless of when cash is received or paid. These two statements report the district’s net position and changes in that position. This change in net position is important because it tells the reader that, for the district as a whole, its financial position has improved or diminished. The causes of this change may be the result of many factors—some financial, some not. Non-financial factors include the district’s property tax base, current property tax laws in Oklahoma restricting revenue growth, facility conditions, mandated educational programs, and other factors. The Statement of Net Position and the Statement of Activities are divided into two distinct types of activities: » Governmental activities—most of the district’s programs and services are reported here, including
instruction, support services, operation and maintenance of plant, pupil transportation, and extracurricular activities.
» Business-type activities—these goods or services are provided on a fee basis to recover all of the expenses
of the goods or services provided. The district’s child nutrition program is reported as a business-type activity.
The government-wide financial statements can be found beginning on page 37. Fund Financial Statements. A fund is a grouping of related accounts that is used to maintain control over resources that have been segregated for specific activities or objectives. Union Public School District uses fund accounting to ensure and demonstrate compliance with finance-related legal requirements. All of the funds can be divided into three categories: 1) governmental funds, 2) proprietary funds, and 3) fiduciary funds. Governmental Funds. Governmental funds are used to account for essentially the same functions reported as governmental activities in the government-wide financial statements. However, unlike the government-wide financial statements, governmental fund financial statements focus on near-term inflows and outflows of spendable resources, as well as on balances of spendable resources available at the end of the fiscal year. Such information may be useful in evaluating the district’s near-term financing requirements. Because the focus of governmental funds is narrower than that of the government-wide financial statements, it is useful to compare the information presented for governmental funds with similar information presented for governmental activities in the government-wide financial statements. By doing so, readers may better understand the long-term impact of the district’s near-term financing decisions. Both the governmental fund balance sheet and the governmental fund statement of revenues, expenditures, and changes in fund balances provide a reconciliation to facilitate this comparison. Information is presented separately in the governmental fund balance sheet and in the governmental fund statement of revenues, expenditures, and changes in fund balances for the general fund, the building fund, the sinking (debt service) fund and the bond fund, all of which are considered to be major funds. A summary of the district’s major funds can be found in Note A of the notes to the financial statements beginning on page 49 of this report.
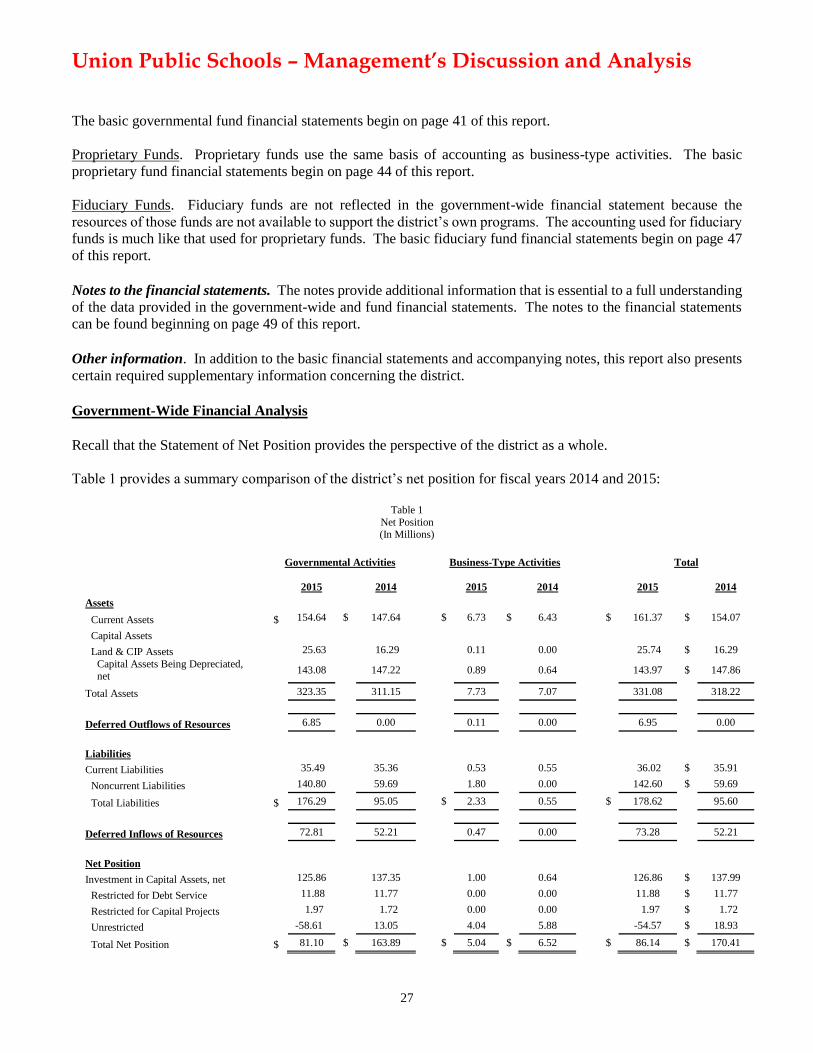
Union Public Schools – Management’s Discussion and Analysis
27
The basic governmental fund financial statements begin on page 41 of this report.
Proprietary Funds. Proprietary funds use the same basis of accounting as business-type activities. The basic
proprietary fund financial statements begin on page 44 of this report.
Fiduciary Funds. Fiduciary funds are not reflected in the government-wide financial statement because the
resources of those funds are not available to support the district’s own programs. The accounting used for fiduciary
funds is much like that used for proprietary funds. The basic fiduciary fund financial statements begin on page 47
of this report.
Notes to the financial statements. The notes provide additional information that is essential to a full understanding
of the data provided in the government-wide and fund financial statements. The notes to the financial statements
can be found beginning on page 49 of this report.
Other information. In addition to the basic financial statements and accompanying notes, this report also presents
certain required supplementary information concerning the district.
Government-Wide Financial Analysis
Recall that the Statement of Net Position provides the perspective of the district as a whole.
Table 1 provides a summary comparison of the district’s net position for fiscal years 2014 and 2015:
Table 1
Net Position (In Millions)
Governmental Activities Business-Type Activities Total
2015 2014 2015 2014 2015 2014
Assets
Current Assets $ 154.64 $ 147.64 $ 6.73 $ 6.43 $ 161.37 $ 154.07
Capital Assets
Land & CIP Assets 25.63 16.29 0.11 0.00 25.74 $ 16.29
Capital Assets Being Depreciated, net
143.08 147.22 0.89 0.64 143.97 $ 147.86
Total Assets 323.35 311.15 7.73 7.07 331.08 318.22
Deferred Outflows of Resources 6.85 0.00 0.11 0.00 6.95 0.00
Liabilities
Current Liabilities 35.49 35.36 0.53 0.55 36.02 $ 35.91
Noncurrent Liabilities 140.80 59.69 1.80 0.00 142.60 $ 59.69
Total Liabilities $ 176.29 95.05 $ 2.33 0.55 $ 178.62 95.60
Deferred Inflows of Resources 72.81 52.21 0.47 0.00 73.28 52.21
Net Position
Investment in Capital Assets, net 125.86 137.35 1.00 0.64 126.86 $ 137.99
Restricted for Debt Service 11.88 11.77 0.00 0.00 11.88 $ 11.77
Restricted for Capital Projects 1.97 1.72 0.00 0.00 1.97 $ 1.72
Unrestricted -58.61 13.05 4.04 5.88 -54.57 $ 18.93
Total Net Position $ 81.10 $ 163.89 $ 5.04 $ 6.52 $ 86.14 $ 170.41
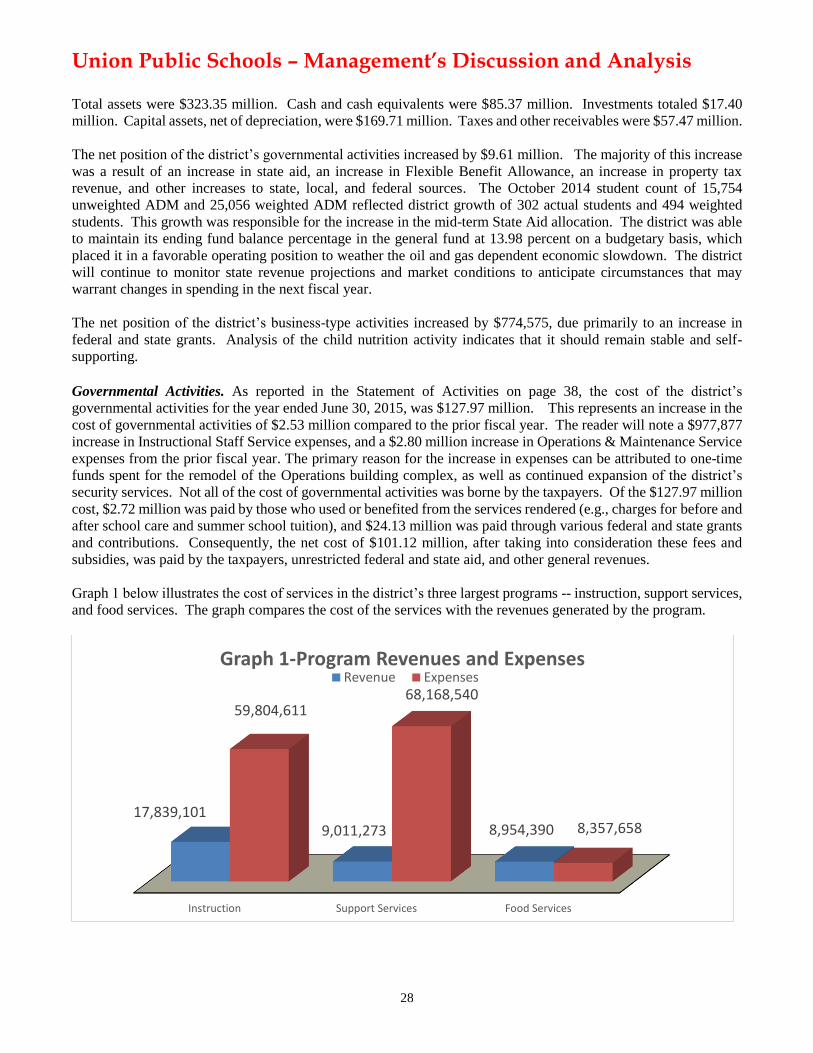
Union Public Schools – Management’s Discussion and Analysis
28
Total assets were $323.35 million. Cash and cash equivalents were $85.37 million. Investments totaled $17.40
million. Capital assets, net of depreciation, were $169.71 million. Taxes and other receivables were $57.47 million.
The net position of the district’s governmental activities increased by $9.61 million. The majority of this increase
was a result of an increase in state aid, an increase in Flexible Benefit Allowance, an increase in property tax
revenue, and other increases to state, local, and federal sources. The October 2014 student count of 15,754
unweighted ADM and 25,056 weighted ADM reflected district growth of 302 actual students and 494 weighted
students. This growth was responsible for the increase in the mid-term State Aid allocation. The district was able
to maintain its ending fund balance percentage in the general fund at 13.98 percent on a budgetary basis, which
placed it in a favorable operating position to weather the oil and gas dependent economic slowdown. The district
will continue to monitor state revenue projections and market conditions to anticipate circumstances that may
warrant changes in spending in the next fiscal year.
The net position of the district’s business-type activities increased by $774,575, due primarily to an increase in
federal and state grants. Analysis of the child nutrition activity indicates that it should remain stable and self-
supporting. Governmental Activities. As reported in the Statement of Activities on page 38, the cost of the district’s
governmental activities for the year ended June 30, 2015, was $127.97 million. This represents an increase in the
cost of governmental activities of $2.53 million compared to the prior fiscal year. The reader will note a $977,877
increase in Instructional Staff Service expenses, and a $2.80 million increase in Operations & Maintenance Service
expenses from the prior fiscal year. The primary reason for the increase in expenses can be attributed to one-time
funds spent for the remodel of the Operations building complex, as well as continued expansion of the district’s
security services. Not all of the cost of governmental activities was borne by the taxpayers. Of the $127.97 million
cost, $2.72 million was paid by those who used or benefited from the services rendered (e.g., charges for before and
after school care and summer school tuition), and $24.13 million was paid through various federal and state grants
and contributions. Consequently, the net cost of $101.12 million, after taking into consideration these fees and
subsidies, was paid by the taxpayers, unrestricted federal and state aid, and other general revenues.
Graph 1 below illustrates the cost of services in the district’s three largest programs -- instruction, support services,
and food services. The graph compares the cost of the services with the revenues generated by the program.
Instruction Support Services Food Services
17,839,101 9,011,273 8,954,390
59,804,611 68,168,540
8,357,658
Graph 1-Program Revenues and ExpensesRevenue Expenses
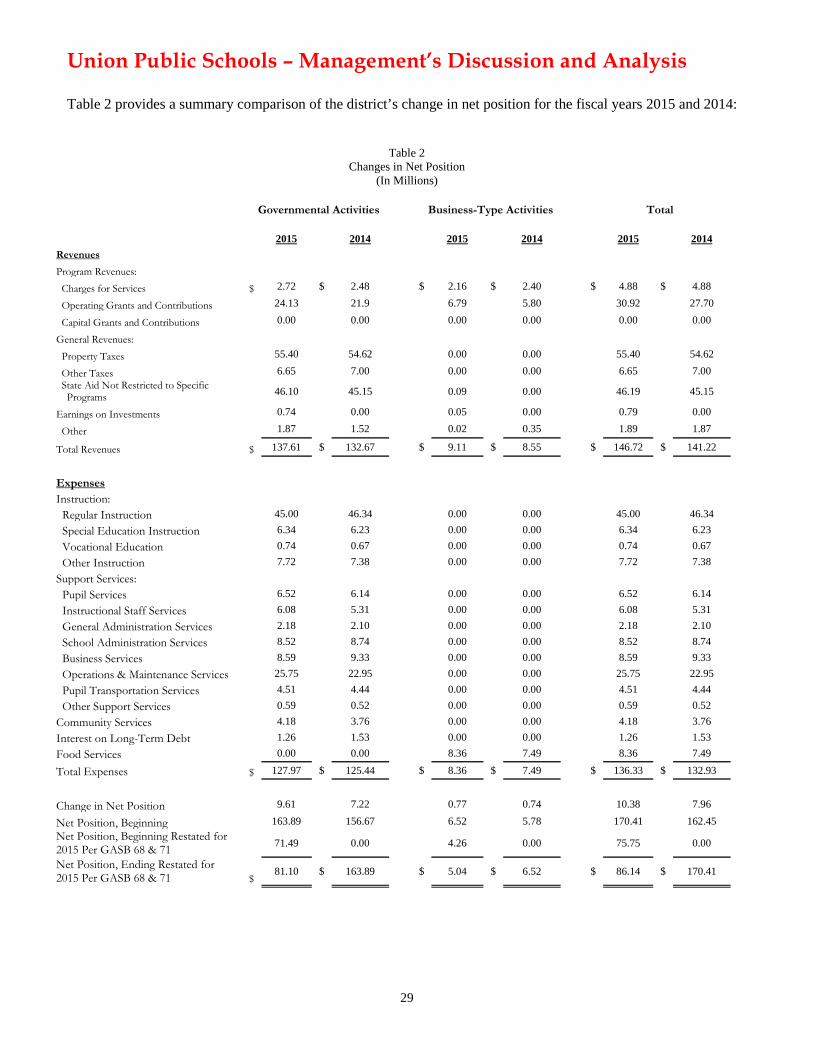
Union Public Schools – Management’s Discussion and Analysis
29
Table 2 provides a summary comparison of the district’s change in net position for the fiscal years 2015 and 2014:
Table 2
Changes in Net Position (In Millions)
Governmental Activities Business-Type Activities Total
2015 2014 2015 2014 2015 2014 Revenues
Program Revenues:
Charges for Services $ 2.72 $ 2.48 $ 2.16 $ 2.40 $ 4.88 $ 4.88
Operating Grants and Contributions 24.13 21.9 6.79 5.80 30.92 27.70
Capital Grants and Contributions 0.00 0.00 0.00 0.00 0.00 0.00
General Revenues: Property Taxes 55.40 54.62 0.00 0.00 55.40 54.62
Other Taxes 6.65 7.00 0.00 0.00 6.65 7.00 State Aid Not Restricted to Specific Programs 46.10 45.15 0.09 0.00 46.19 45.15
Earnings on Investments 0.74 0.00 0.05 0.00 0.79 0.00
Other 1.87 1.52 0.02 0.35 1.89 1.87
Total Revenues $ 137.61 $ 132.67 $ 9.11 $ 8.55 $ 146.72 $ 141.22
Expenses Instruction: Regular Instruction 45.00 46.34 0.00 0.00 45.00 46.34 Special Education Instruction 6.34 6.23 0.00 0.00 6.34 6.23 Vocational Education 0.74 0.67 0.00 0.00 0.74 0.67 Other Instruction 7.72 7.38 0.00 0.00 7.72 7.38 Support Services: Pupil Services 6.52 6.14 0.00 0.00 6.52 6.14 Instructional Staff Services 6.08 5.31 0.00 0.00 6.08 5.31 General Administration Services 2.18 2.10 0.00 0.00 2.18 2.10 School Administration Services 8.52 8.74 0.00 0.00 8.52 8.74 Business Services 8.59 9.33 0.00 0.00 8.59 9.33 Operations & Maintenance Services 25.75 22.95 0.00 0.00 25.75 22.95 Pupil Transportation Services 4.51 4.44 0.00 0.00 4.51 4.44 Other Support Services 0.59 0.52 0.00 0.00 0.59 0.52 Community Services 4.18 3.76 0.00 0.00 4.18 3.76 Interest on Long-Term Debt 1.26 1.53 0.00 0.00 1.26 1.53 Food Services 0.00 0.00 8.36 7.49 8.36 7.49
Total Expenses $ 127.97 $ 125.44 $ 8.36 $ 7.49 $ 136.33 $ 132.93
Change in Net Position 9.61 7.22 0.77 0.74 10.38 7.96 Net Position, Beginning 163.89 156.67 6.52 5.78 170.41 162.45 Net Position, Beginning Restated for 2015 Per GASB 68 & 71
71.49 0.00 4.26 0.00 75.75 0.00
Net Position, Ending Restated for 2015 Per GASB 68 & 71 $
81.10 $ 163.89 $ 5.04 $ 6.52 $ 86.14 $ 170.41

Union Public Schools – Management’s Discussion and Analysis
30
Total governmental activities revenues increased in fiscal year 2015 to $137.59 million. This represents a 3.70 percent revenue increase over the previous year. Graph 2 illustrates the components of this revenue. Governmental activities increased the district’s net position by $9.61 million, thereby accounting for a majority of the improvement in the net position of the district.
Instruction comprised 46.73 percent of governmental program expenditures. Support services expenditures made up 53.27 percent of governmental expenditures. Graph 3 illustrates the components of the expenditures in the governmental activities.
Union Public Schools – Management’s Discussion and Analysis
31
Business-Type Activities. Business-type activities consist of child nutrition services. This program had operating revenues of $2.16 million, non-operating revenues of $6.97 million, and expenses of $8.35 million for fiscal year 2015. The increase in Child Nutrition expenditures reflects additional student enrollment, an increase in the cost of food, as well as a concerted effort to provide more healthy food options for students. The Child Nutrition fund ended the year in a positive financial condition. Management has reviewed this program and, barring any unforeseen circumstances, the child nutrition program should remain stable and require no support from tax revenues. Financial Analysis of the Government’s Funds As noted earlier, Union Public School District uses fund accounting to ensure and demonstrate compliance with finance-related legal requirements. Governmental Funds. The focus of the district’s governmental funds is to provide information on near-term inflows, outflows, and balances of spendable resources. Such information is useful in assessing the district’s financing requirements. In particular, fund balances may serve as a useful measure of a government’s net resources available for spending at the end of the fiscal year. As of the end of the current fiscal year, the district’s governmental funds reported combined ending fund balances of $80.50 million, with $277,419 of this total amount constituting non-spendable fund balance reserved for inventories. In addition, $57.73 million is restricted for specific purposes: $10.52 million in the building fund for uses mandated by the Oklahoma Constitution including building erection and maintenance, security, utilities, and fire/casualty premiums; $11.88 million in the sinking fund for debt service, and $35.34 million in the bond fund for capital projects. Assigned fund balance totals $3.49 million for compensating balances, early retirement incentive, and insurance recovery. Unassigned fund balance totals $19.00 million and is available for spending at the district’s discretion. The general fund is the chief operating fund of the district. At the end of the current fiscal year, unassigned fund balance of the general fund was $19.00 million. As a measure of the general fund’s liquidity, it may be useful to compare both unassigned fund balance and total fund balance to total fund expenditures. Unassigned fund balance represents 17.17 percent of total general fund expenditures. The fund balance of the District’s general fund increased by $1.51 million from the prior year as a result of an increase in local revenue, primarily ad valorem tax and Project Lead the Way collections, as well as federal revenue sources in the form of Adult Education, IDEA, and Title I and II. Controlling fiscal year-end expenditures to maintain a continuing level of fund balance is also a contributing factor to the district’s financial stability. The district relies on the ending fund balance to meet cash flow needs during the first six months of the following fiscal year. While a small portion of the revenue is collected during the first six months of the fiscal year, the significant revenue collections occur in late spring. This annual cash flow trend requires the district to increase the ending fund balance each year as the expenditure budget grows in order to meet cash flow requirements of the first six months prior to tax revenues being collected. The revenue and expenditure budgets are revised during the fiscal year based on the final federal grant award notifications, state aid allocation revisions, actual revenue receipts and other unanticipated increases or decreases in revenue or expenditures. Fiscal year 2015 general fund revenue budgets were revised during the year based on adjustments to revenue collections. The fiscal year saw a $1.50 million increase in mid-term state aid, State Flexible Benefit Allowance, property tax collections, and other local, state, and federal sources, while federal grant collections estimates were reduced.
Union Public Schools – Management’s Discussion and Analysis
32
The variance in the final budget versus the actual revenues and expenditures revealed a variance in revenues of $841,044 and a variance in expenditures of $2.29 million. This revenue variance is primarily due to higher than anticipated collections of local and state sources of revenue. The approved final expenditure budget was intentionally larger than anticipated actual expenditures to provide the flexibility necessary to manage any unanticipated revenue receipts and expenditures incurred in the final days of the fiscal year. The building fund had a total fund balance of $10.52 million. The net decrease in fund balance during the current year in the building fund was $1.01 million. This decrease in fund balance is attributed to the District’s need to keep sites operational by maintaining and repairing buildings. The Oklahoma Constitution allows building funds to be used for erecting, remodeling, repairing, or maintaining school buildings; purchasing furniture, equipment, or computer software; paying energy and utility costs; purchasing telecommunications services; paying fire and casualty insurance premiums; purchasing security systems; and paying salaries of security personnel. The ending fund balance will be used for those purposes. The building fund budget was revised from the original budget approved by the Board on November 2014. The building fund revenue budget was revised and approved by the Board in May 2015 to reflect an increase in insurance reimbursements. The building fund expenditure budget was not revised during fiscal year 2015, reflecting a no net change from the original budget. The sinking (debt service) fund had a total fund balance of $11.88 million, all of which was restricted for the payment of debt service. The net increase in fund balance during the current year in the debt service fund was $108,886. Millage rates for sinking fund levies are not controlled by the district but are set annually by the Tulsa County Excise Board after a thorough review of property valuations and the district’s debt service needs. The bond fund had a total fund balance of $35.34 million, all of which was committed for capital projects. The net increase in fund balance during the current year in the bond fund was $4.80 million. This increase in fund balance is primarily due to the passage of a larger bond issue than the prior year, and reduced capital outlay expenditures. On February 10, 2015, district voters approved a $27 million bond proposal which included funds for: site improvements; acquisition of textbooks, media books and instructional hardware/software. Because of its strong patron support base, the district is prudent to keep bonded capacity at traditional levels while not imposing an undue tax burden on the community. More information regarding bond funds and millage levies may be found in the Statistical Section. Statutory requirements dictate that bond funds be used for the voter-approved purposes of acquiring school sites, constructing and equipping new school facilities and renovating existing facilities. Proprietary Funds. Union Public School District’s proprietary funds provide the same type of information found in the government-wide financial statements, but in more detail. The proprietary funds have operating revenues of $15.37 million and non-operating revenues of $6.97 million. Operating expenses were $21.71 million. General Fund Budgetary Highlights Union Public School District adopts an annual appropriated budget for its general fund. The district’s budget is prepared according to Oklahoma law and is based on accounting for certain transactions on a basis of cash receipts, disbursements, and encumbrances. The most significantly budgeted fund is the general fund. For the general fund, budget basis revenue was $105.68 million with original budget estimates of $103.34 million and final budget estimates of $104.84 million. The majority of the revenue variance came from higher than anticipated local source collections and state revenue sources (state aid, flexible benefit allowance, and property tax collections) offset by lower than anticipated federal (ad valorem collections) sources. The final expenditure budget was intentionally approved to be larger than needed in order to provide the necessary spending authority to the district by the Board to meet the State of Oklahoma spending requirements. The district must have sufficient budget spending authority to allow for any unanticipated revenues that might be collected
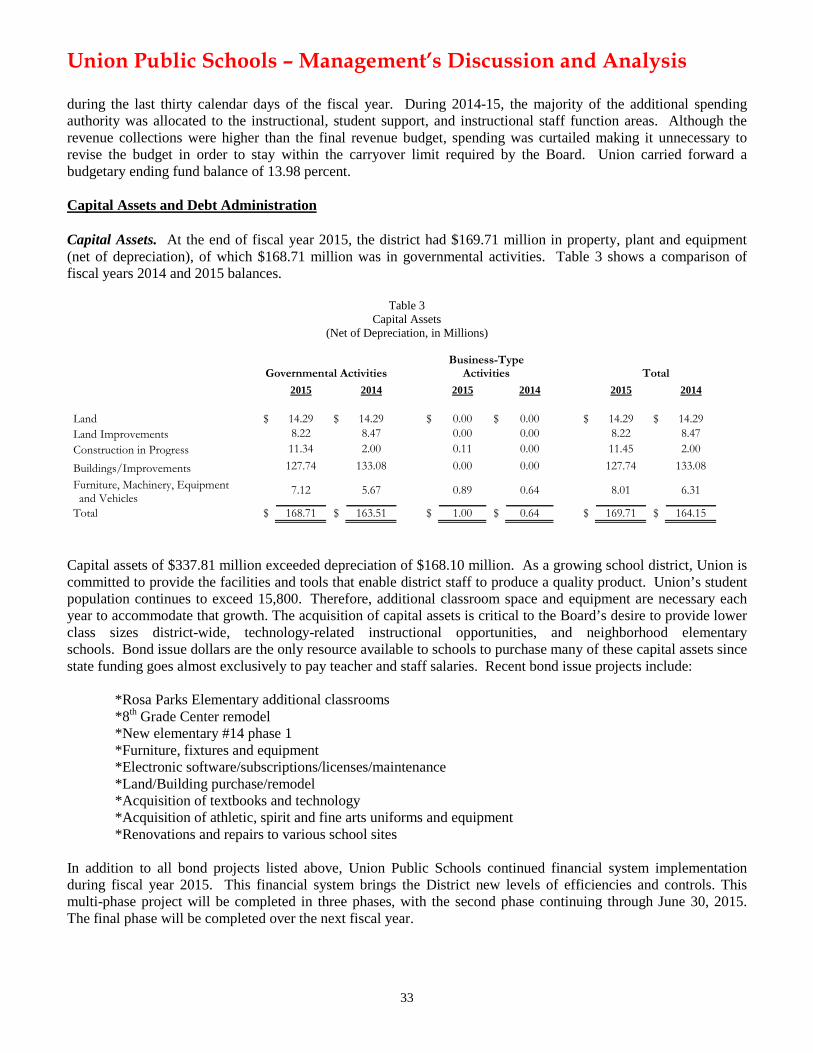
Union Public Schools – Management’s Discussion and Analysis
33
during the last thirty calendar days of the fiscal year. During 2014-15, the majority of the additional spending authority was allocated to the instructional, student support, and instructional staff function areas. Although the revenue collections were higher than the final revenue budget, spending was curtailed making it unnecessary to revise the budget in order to stay within the carryover limit required by the Board. Union carried forward a budgetary ending fund balance of 13.98 percent. Capital Assets and Debt Administration Capital Assets. At the end of fiscal year 2015, the district had $169.71 million in property, plant and equipment (net of depreciation), of which $168.71 million was in governmental activities. Table 3 shows a comparison of fiscal years 2014 and 2015 balances.
Table 3
Capital Assets (Net of Depreciation, in Millions)
Governmental Activities Business-Type
Activities Total 2015 2014 2015 2014 2015 2014
Land $ 14.29 $ 14.29 $ 0.00 $ 0.00 $ 14.29 $ 14.29 Land Improvements 8.22 8.47 0.00 0.00 8.22 8.47 Construction in Progress 11.34 2.00 0.11 0.00 11.45 2.00
Buildings/Improvements 127.74 133.08 0.00 0.00 127.74 133.08
Furniture, Machinery, Equipment and Vehicles
7.12 5.67 0.89 0.64 8.01 6.31
Total $ 168.71 $ 163.51 $ 1.00 $ 0.64 $ 169.71 $ 164.15
Capital assets of $337.81 million exceeded depreciation of $168.10 million. As a growing school district, Union is committed to provide the facilities and tools that enable district staff to produce a quality product. Union’s student population continues to exceed 15,800. Therefore, additional classroom space and equipment are necessary each year to accommodate that growth. The acquisition of capital assets is critical to the Board’s desire to provide lower class sizes district-wide, technology-related instructional opportunities, and neighborhood elementary schools. Bond issue dollars are the only resource available to schools to purchase many of these capital assets since state funding goes almost exclusively to pay teacher and staff salaries. Recent bond issue projects include: *Rosa Parks Elementary additional classrooms *8th Grade Center remodel
*New elementary #14 phase 1 *Furniture, fixtures and equipment *Electronic software/subscriptions/licenses/maintenance
*Land/Building purchase/remodel *Acquisition of textbooks and technology *Acquisition of athletic, spirit and fine arts uniforms and equipment *Renovations and repairs to various school sites In addition to all bond projects listed above, Union Public Schools continued financial system implementation during fiscal year 2015. This financial system brings the District new levels of efficiencies and controls. This multi-phase project will be completed in three phases, with the second phase continuing through June 30, 2015. The final phase will be completed over the next fiscal year.
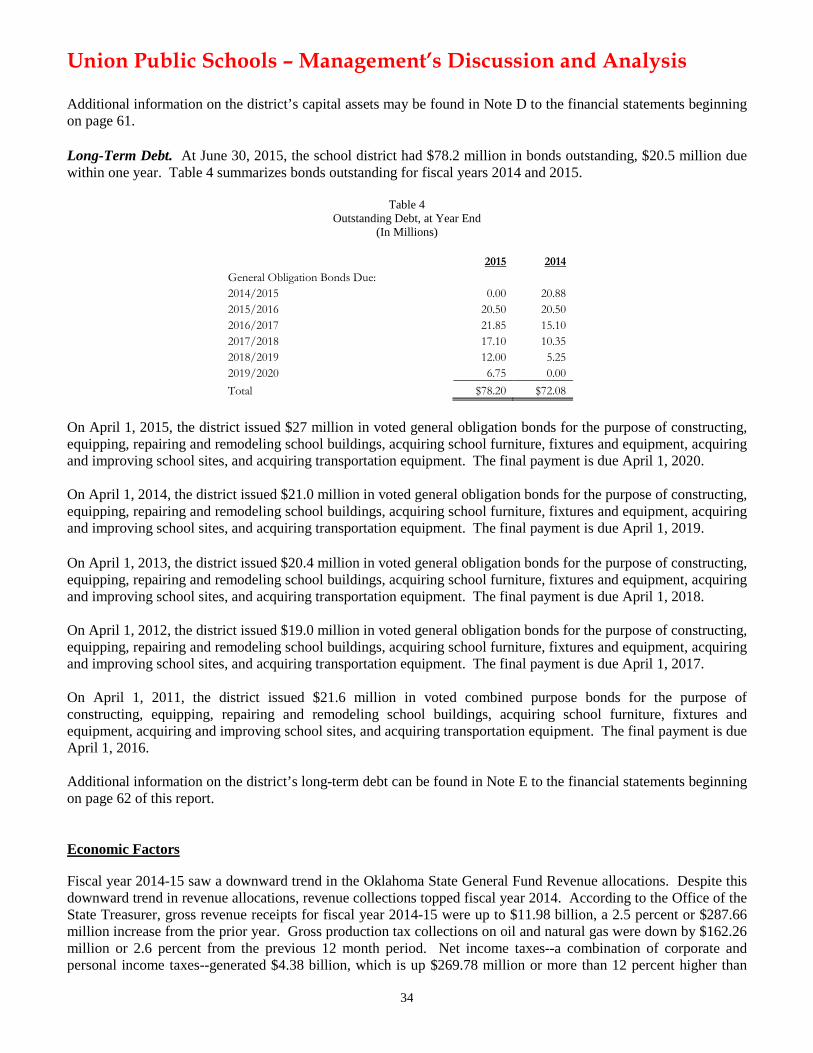
Union Public Schools – Management’s Discussion and Analysis
34
Additional information on the district’s capital assets may be found in Note D to the financial statements beginning on page 61. Long-Term Debt. At June 30, 2015, the school district had $78.2 million in bonds outstanding, $20.5 million due within one year. Table 4 summarizes bonds outstanding for fiscal years 2014 and 2015.
Table 4 Outstanding Debt, at Year End
(In Millions)
On April 1, 2015, the district issued $27 million in voted general obligation bonds for the purpose of constructing, equipping, repairing and remodeling school buildings, acquiring school furniture, fixtures and equipment, acquiring and improving school sites, and acquiring transportation equipment. The final payment is due April 1, 2020. On April 1, 2014, the district issued $21.0 million in voted general obligation bonds for the purpose of constructing, equipping, repairing and remodeling school buildings, acquiring school furniture, fixtures and equipment, acquiring and improving school sites, and acquiring transportation equipment. The final payment is due April 1, 2019.
On April 1, 2013, the district issued $20.4 million in voted general obligation bonds for the purpose of constructing, equipping, repairing and remodeling school buildings, acquiring school furniture, fixtures and equipment, acquiring and improving school sites, and acquiring transportation equipment. The final payment is due April 1, 2018. On April 1, 2012, the district issued $19.0 million in voted general obligation bonds for the purpose of constructing, equipping, repairing and remodeling school buildings, acquiring school furniture, fixtures and equipment, acquiring and improving school sites, and acquiring transportation equipment. The final payment is due April 1, 2017. On April 1, 2011, the district issued $21.6 million in voted combined purpose bonds for the purpose of constructing, equipping, repairing and remodeling school buildings, acquiring school furniture, fixtures and equipment, acquiring and improving school sites, and acquiring transportation equipment. The final payment is due April 1, 2016. Additional information on the district’s long-term debt can be found in Note E to the financial statements beginning on page 62 of this report. Economic Factors Fiscal year 2014-15 saw a downward trend in the Oklahoma State General Fund Revenue allocations. Despite this downward trend in revenue allocations, revenue collections topped fiscal year 2014. According to the Office of the State Treasurer, gross revenue receipts for fiscal year 2014-15 were up to $11.98 billion, a 2.5 percent or $287.66 million increase from the prior year. Gross production tax collections on oil and natural gas were down by $162.26 million or 2.6 percent from the previous 12 month period. Net income taxes--a combination of corporate and personal income taxes--generated $4.38 billion, which is up $269.78 million or more than 12 percent higher than
2015 2014 General Obligation Bonds Due: 2014/2015 0.00 20.88 2015/2016 20.50 20.50 2016/2017 21.85 15.10 2017/2018 17.10 10.35 2018/2019 12.00 5.25 2019/2020 6.75 0.00 Total $78.20 $72.08
Union Public Schools – Management’s Discussion and Analysis
35
the prior year. Motor vehicle tax collections totaled $766.25 million, and other state revenue sources generated $1.65 billion, up $59.80 million or 2.54 percent from the previous fiscal year. Oklahoma’s economy has been on a downturn as the impact of oil prices negatively affects revenue collections. Despite this downturn, the district strives to maintain a conservative budget and the tradition of maintaining a strong year-end fund balance. The district expects student growth to continue both at the elementary and secondary level, and anticipates this growth by purchasing additional land and facilities to accommodate the increase in students. This new elementary site will precipitate adding teachers and programs over the next few years as state and federal funding sources continue to improve. The county assessor provided Union with projections of growth in the district’s net assessed valuation. Actual growth was recorded at 3.28 percent in 2014-2015. The actual increase in the district’s net assessed valuation for 2015-2016 is 2.65 percent. The expected increase in student enrollment and business and residential growth in the district should provide additional future revenue. By working to provide mutual benefit to the community and schools, Union continued its history of positive citizen support. The district’s patron base once again passed a bond issue on February 10, 2015, for $27 million. These bond dollars provided the necessary funding for facilities, renovations, technology, textbooks, instructional equipment and uniforms. These annual bond dollars and strong patron support allow Union the opportunity and obligation to maintain facilities and to maximize the use of instructional technology and equipment. State law limits a school district’s bonding capacity to ten percent of its net assessed valuation. Based on these factors, the Board of Education and administration are confident that with ongoing, prudent fiscal management, Union Public Schools can continue to make instruction the top budgetary priority to ensure the district keeps its academic focus and delivers its services more efficiently and effectively. Union continues to attract families who want excellent learning opportunities for their children, and also continue to attract the best in faculty and staff by providing the facilities and tools that enable them to produce a quality product. Contacting the School District’s Financial Management This financial report is designed to provide our citizen’s, taxpayers, investors, and creditors with a general overview of the district’s finances to show the district’s accountability for the funds it receives. If you have questions about this report or need additional financial information, contact Debra J. Jacoby, CPA, Chief Financial Officer at Union Public Schools, 8506 East 61st Street, Tulsa, Oklahoma 74133.

36
This page is intentionally left blank.
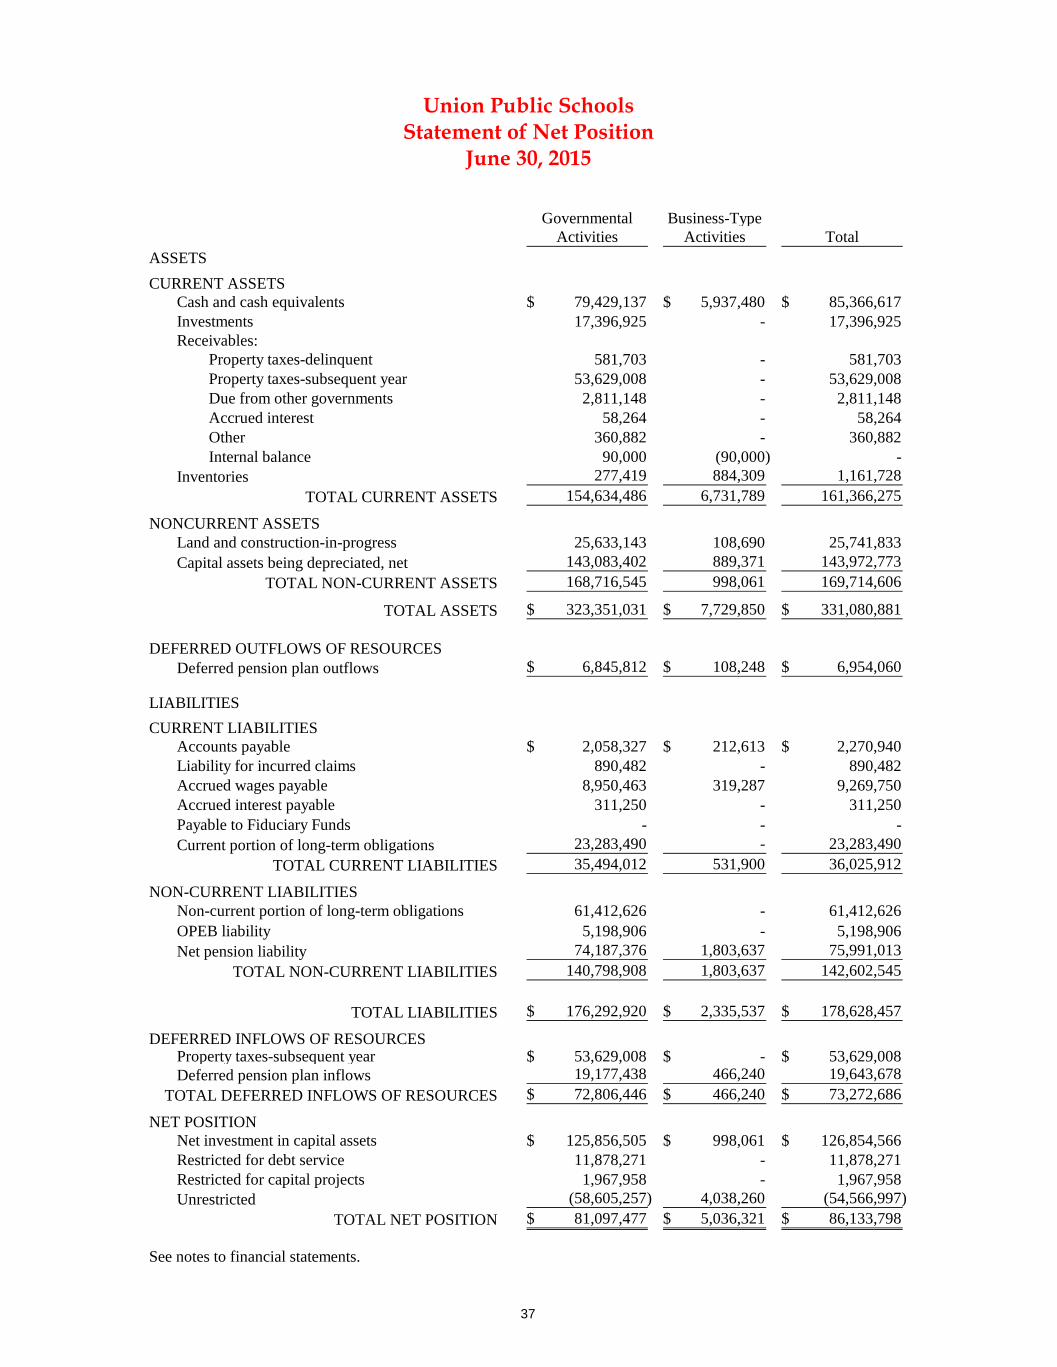
Governmental Business-Type
Activities Activities Total
ASSETS
CURRENT ASSETS
Cash and cash equivalents 79,429,137$ 5,937,480$ 85,366,617$
Investments 17,396,925 - 17,396,925
Receivables:
Property taxes-delinquent 581,703 - 581,703
Property taxes-subsequent year 53,629,008 - 53,629,008
Due from other governments 2,811,148 - 2,811,148
Accrued interest 58,264 - 58,264
Other 360,882 - 360,882
Internal balance 90,000 (90,000) -
Inventories 277,419 884,309 1,161,728
TOTAL CURRENT ASSETS 154,634,486 6,731,789 161,366,275
NONCURRENT ASSETS
Land and construction-in-progress 25,633,143 108,690 25,741,833
Capital assets being depreciated, net 143,083,402 889,371 143,972,773
TOTAL NON-CURRENT ASSETS 168,716,545 998,061 169,714,606
TOTAL ASSETS 323,351,031$ 7,729,850$ 331,080,881$
DEFERRED OUTFLOWS OF RESOURCES
Deferred pension plan outflows 6,845,812$ 108,248$ 6,954,060$
LIABILITIES
CURRENT LIABILITIES
Accounts payable 2,058,327$ 212,613$ 2,270,940$
Liability for incurred claims 890,482 - 890,482
Accrued wages payable 8,950,463 319,287 9,269,750
Accrued interest payable 311,250 - 311,250
Payable to Fiduciary Funds - - -
Current portion of long-term obligations 23,283,490 - 23,283,490
TOTAL CURRENT LIABILITIES 35,494,012 531,900 36,025,912
NON-CURRENT LIABILITIES
Non-current portion of long-term obligations 61,412,626 - 61,412,626
OPEB liability 5,198,906 - 5,198,906
Net pension liability 74,187,376 1,803,637 75,991,013
TOTAL NON-CURRENT LIABILITIES 140,798,908 1,803,637 142,602,545
TOTAL LIABILITIES 176,292,920$ 2,335,537$ 178,628,457$
DEFERRED INFLOWS OF RESOURCESProperty taxes-subsequent year 53,629,008$ -$ 53,629,008$
Deferred pension plan inflows 19,177,438 466,240 19,643,678
TOTAL DEFERRED INFLOWS OF RESOURCES 72,806,446$ 466,240$ 73,272,686$
NET POSITION
Net investment in capital assets 125,856,505$ 998,061$ 126,854,566$
Restricted for debt service 11,878,271 - 11,878,271
Restricted for capital projects 1,967,958 - 1,967,958
Unrestricted (58,605,257) 4,038,260 (54,566,997)
TOTAL NET POSITION 81,097,477$ 5,036,321$ 86,133,798$
See notes to financial statements.
Union Public Schools
June 30, 2015Statement of Net Position
37
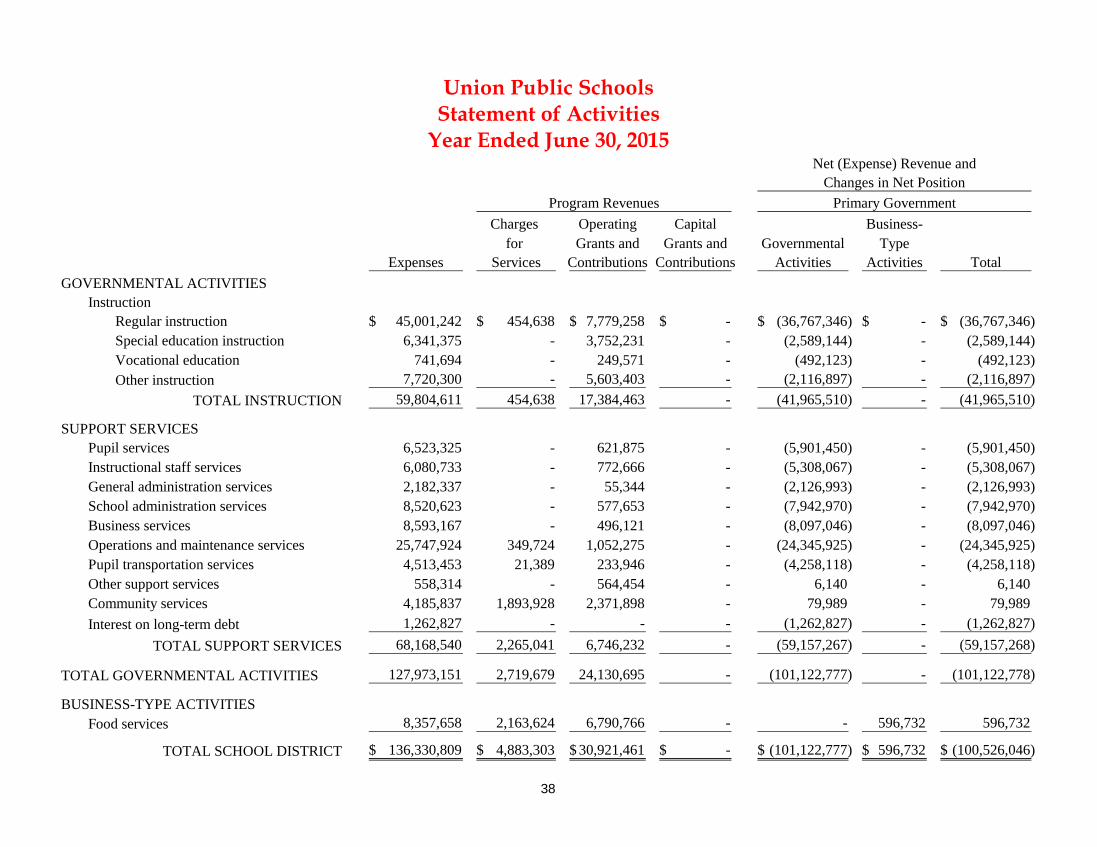
Net (Expense) Revenue and
Changes in Net Position
Program Revenues Primary Government
Charges Operating Capital Business-
for Grants and Grants and Governmental Type
Expenses Services Contributions Contributions Activities Activities Total
GOVERNMENTAL ACTIVITIES
Instruction
Regular instruction 45,001,242$ 454,638$ 7,779,258$ -$ (36,767,346)$ -$ (36,767,346)$
Special education instruction 6,341,375 - 3,752,231 - (2,589,144) - (2,589,144)
Vocational education 741,694 - 249,571 - (492,123) - (492,123)
Other instruction 7,720,300 - 5,603,403 - (2,116,897) - (2,116,897)
TOTAL INSTRUCTION 59,804,611 454,638 17,384,463 - (41,965,510) - (41,965,510)
SUPPORT SERVICES
Pupil services 6,523,325 - 621,875 - (5,901,450) - (5,901,450)
Instructional staff services 6,080,733 - 772,666 - (5,308,067) - (5,308,067)
General administration services 2,182,337 - 55,344 - (2,126,993) - (2,126,993)
School administration services 8,520,623 - 577,653 - (7,942,970) - (7,942,970)
Business services 8,593,167 - 496,121 - (8,097,046) - (8,097,046)
Operations and maintenance services 25,747,924 349,724 1,052,275 - (24,345,925) - (24,345,925)
Pupil transportation services 4,513,453 21,389 233,946 - (4,258,118) - (4,258,118)
Other support services 558,314 - 564,454 - 6,140 - 6,140
Community services 4,185,837 1,893,928 2,371,898 - 79,989 - 79,989
Interest on long-term debt 1,262,827 - - - (1,262,827) - (1,262,827)
TOTAL SUPPORT SERVICES 68,168,540 2,265,041 6,746,232 - (59,157,267) - (59,157,268)
TOTAL GOVERNMENTAL ACTIVITIES 127,973,151 2,719,679 24,130,695 - (101,122,777) - (101,122,778)
BUSINESS-TYPE ACTIVITIES
Food services 8,357,658 2,163,624 6,790,766 - - 596,732 596,732
TOTAL SCHOOL DISTRICT 136,330,809$ 4,883,303$ 30,921,461$ -$ (101,122,777)$ 596,732$ (100,526,046)$
Union Public SchoolsStatement of Activities
Year Ended June 30, 2015
38
Net (Expense) Revenue and
Changes in Net Position
Primary Government
Business-
Governmental Type
Activities Activities Total
GENERAL REVENUES
Taxes
Property tax, levied for general
purposes 33,969,278$ -$ 33,969,278$
Property tax, levied for debt services 21,427,050 - 21,427,050
Intermediate County taxes 6,653,037 - 6,653,037
State aid not restricted to specific
programs 46,103,550 99,171 46,202,721
Earnings on investments 740,150 54,612 794,762
Transfers (24,060) 24,060 -
Other 1,866,128 - 1,866,128
TOTAL GENERAL REVENUES 110,735,133 177,843 110,912,976
CHANGES IN NET POSITION 9,612,356 774,575 10,386,931
NET POSITION AT BEGINNING OF YEAR 163,896,215 6,518,196 170,414,411
RESTATEMENT IMPLEMENTATION OF GASB 68 &71 92,411,094 2,256,450 94,667,544
Beginning net position as restated 71,485,121 4,261,746 75,746,867
NET POSITION AT END OF YEAR 81,097,477$ 5,036,321$ 86,133,798$
See notes to financial statements.
Union Public SchoolsStatement of Activities - Continued
Year Ended June 30, 2015
39

This page is intentionally left blank.
40
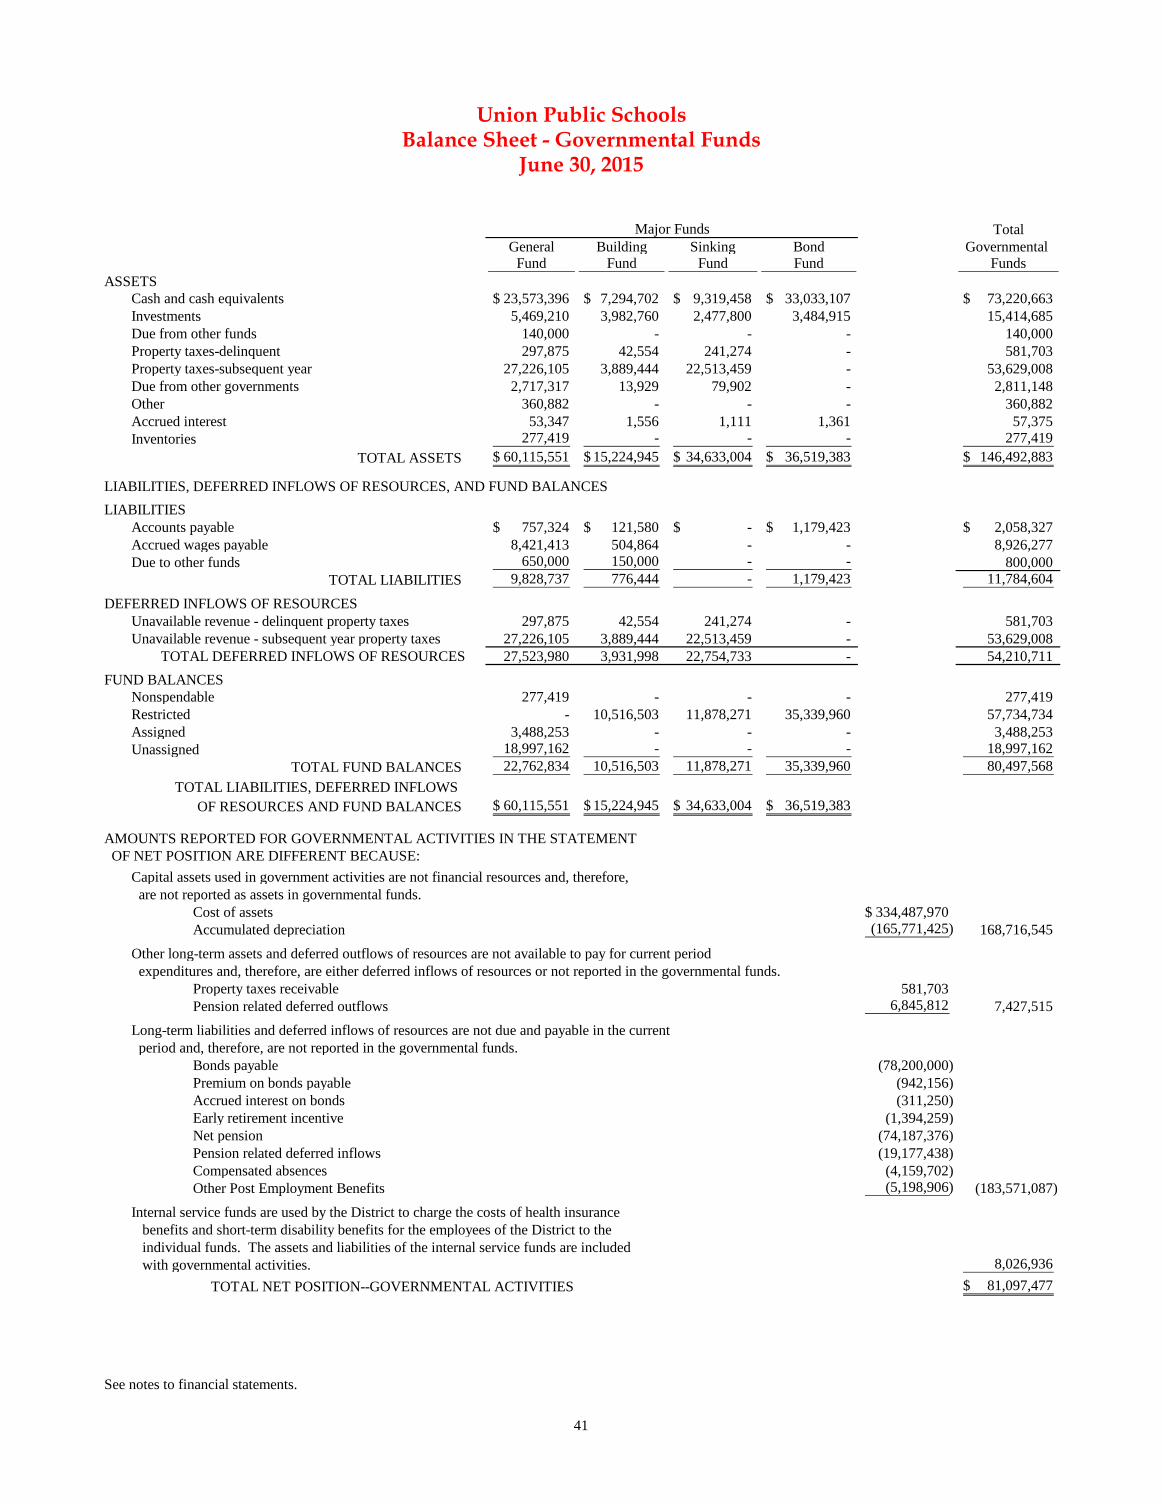
Total
General Building Sinking Bond Governmental Fund Fund Fund Fund Funds
ASSETS
Cash and cash equivalents 23,573,396$ 7,294,702$ 9,319,458$ 33,033,107$ 73,220,663$
Investments 5,469,210 3,982,760 2,477,800 3,484,915 15,414,685
Due from other funds 140,000 - - - 140,000
Property taxes-delinquent 297,875 42,554 241,274 - 581,703
Property taxes-subsequent year 27,226,105 3,889,444 22,513,459 - 53,629,008
Due from other governments 2,717,317 13,929 79,902 - 2,811,148
Other 360,882 - - - 360,882
Accrued interest 53,347 1,556 1,111 1,361 57,375
Inventories 277,419 - - - 277,419
TOTAL ASSETS 60,115,551$ 15,224,945$ 34,633,004$ 36,519,383$ 146,492,883$
LIABILITIES, DEFERRED INFLOWS OF RESOURCES, AND FUND BALANCES
LIABILITIES
Accounts payable 757,324$ 121,580$ -$ 1,179,423$ 2,058,327$
Accrued wages payable 8,421,413 504,864 - - 8,926,277
Due to other funds 650,000 150,000 - - 800,000
TOTAL LIABILITIES 9,828,737 776,444 - 1,179,423 11,784,604
DEFERRED INFLOWS OF RESOURCES
Unavailable revenue - delinquent property taxes 297,875 42,554 241,274 - 581,703
Unavailable revenue - subsequent year property taxes 27,226,105 3,889,444 22,513,459 - 53,629,008
TOTAL DEFERRED INFLOWS OF RESOURCES 27,523,980 3,931,998 22,754,733 - 54,210,711
FUND BALANCES
Nonspendable 277,419 - - - 277,419
Restricted - 10,516,503 11,878,271 35,339,960 57,734,734
Assigned 3,488,253 - - - 3,488,253
Unassigned 18,997,162 - - - 18,997,162
TOTAL FUND BALANCES 22,762,834 10,516,503 11,878,271 35,339,960 80,497,568
TOTAL LIABILITIES, DEFERRED INFLOWS
OF RESOURCES AND FUND BALANCES 60,115,551$ 15,224,945$ 34,633,004$ 36,519,383$
AMOUNTS REPORTED FOR GOVERNMENTAL ACTIVITIES IN THE STATEMENT
OF NET POSITION ARE DIFFERENT BECAUSE:
Capital assets used in government activities are not financial resources and, therefore,
are not reported as assets in governmental funds.
Cost of assets 334,487,970$
Accumulated depreciation (165,771,425) 168,716,545
Other long-term assets and deferred outflows of resources are not available to pay for current period
expenditures and, therefore, are either deferred inflows of resources or not reported in the governmental funds.
Property taxes receivable 581,703
Pension related deferred outflows 6,845,812 7,427,515
Long-term liabilities and deferred inflows of resources are not due and payable in the current
period and, therefore, are not reported in the governmental funds.
Bonds payable (78,200,000)
Premium on bonds payable (942,156)
Accrued interest on bonds (311,250)
Early retirement incentive (1,394,259)
Net pension (74,187,376)
Pension related deferred inflows (19,177,438)
Compensated absences (4,159,702)
Other Post Employment Benefits (5,198,906) (183,571,087)
Internal service funds are used by the District to charge the costs of health insurance
benefits and short-term disability benefits for the employees of the District to the
individual funds. The assets and liabilities of the internal service funds are included
with governmental activities. 8,026,936
TOTAL NET POSITION--GOVERNMENTAL ACTIVITIES 81,097,477$
See notes to financial statements.
Union Public SchoolsBalance Sheet - Governmental Funds
June 30, 2015
Major Funds
41
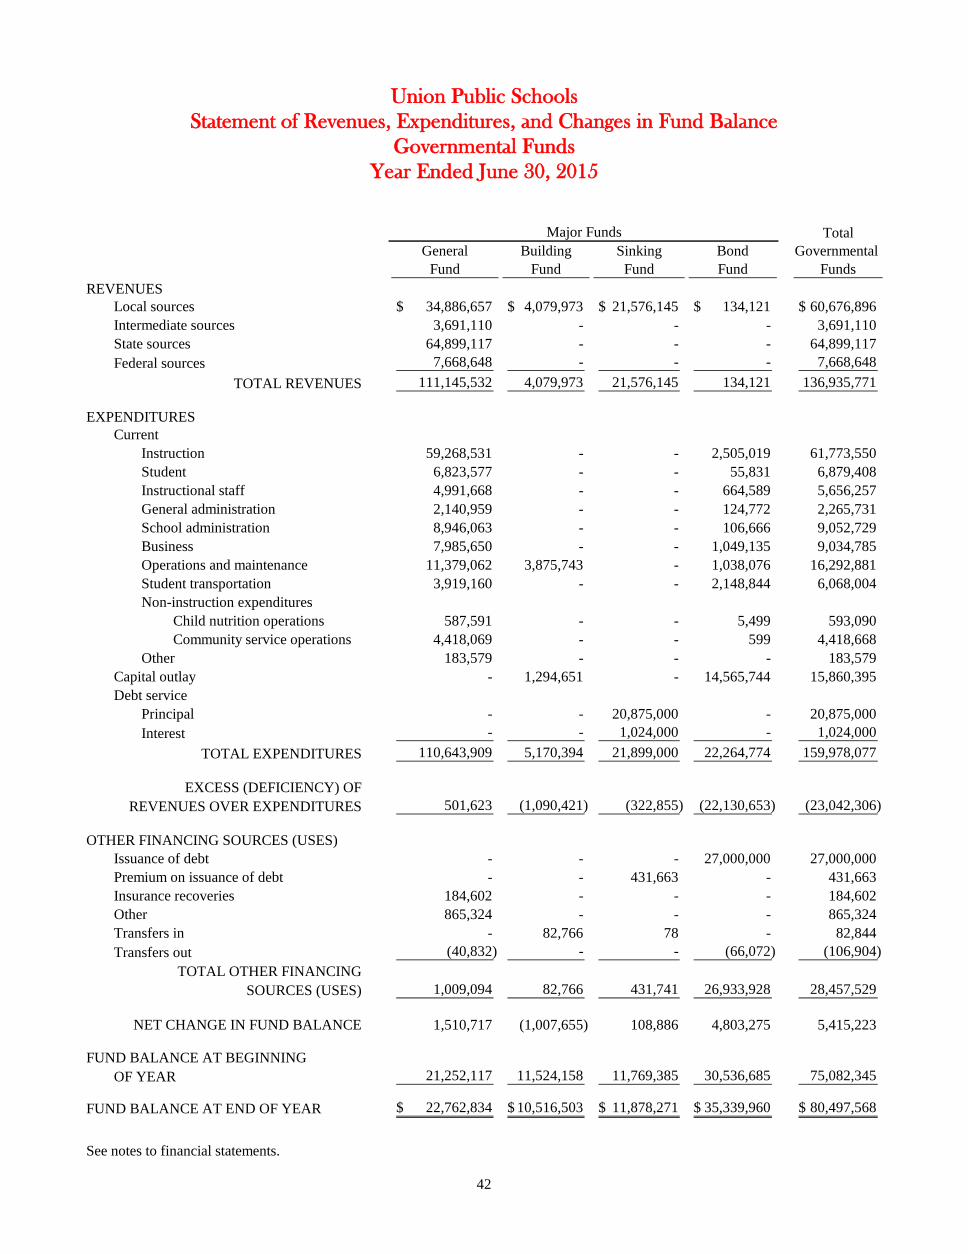
Total
General Building Sinking Bond Governmental
Fund Fund Fund Fund Funds
REVENUES
Local sources 34,886,657$ 4,079,973$ 21,576,145$ 134,121$ 60,676,896$
Intermediate sources 3,691,110 - - - 3,691,110
State sources 64,899,117 - - - 64,899,117
Federal sources 7,668,648 - - - 7,668,648
TOTAL REVENUES 111,145,532 4,079,973 21,576,145 134,121 136,935,771
EXPENDITURES
Current
Instruction 59,268,531 - - 2,505,019 61,773,550
Student 6,823,577 - - 55,831 6,879,408
Instructional staff 4,991,668 - - 664,589 5,656,257
General administration 2,140,959 - - 124,772 2,265,731
School administration 8,946,063 - - 106,666 9,052,729
Business 7,985,650 - - 1,049,135 9,034,785
Operations and maintenance 11,379,062 3,875,743 - 1,038,076 16,292,881
Student transportation 3,919,160 - - 2,148,844 6,068,004
Non-instruction expenditures
Child nutrition operations 587,591 - - 5,499 593,090
Community service operations 4,418,069 - - 599 4,418,668
Other 183,579 - - - 183,579
Capital outlay - 1,294,651 - 14,565,744 15,860,395
Debt service
Principal - - 20,875,000 - 20,875,000
Interest - - 1,024,000 - 1,024,000
TOTAL EXPENDITURES 110,643,909 5,170,394 21,899,000 22,264,774 159,978,077
EXCESS (DEFICIENCY) OF
REVENUES OVER EXPENDITURES 501,623 (1,090,421) (322,855) (22,130,653) (23,042,306)
OTHER FINANCING SOURCES (USES)
Issuance of debt - - - 27,000,000 27,000,000
Premium on issuance of debt - - 431,663 - 431,663
Insurance recoveries 184,602 - - - 184,602
Other 865,324 - - - 865,324
Transfers in - 82,766 78 - 82,844
Transfers out (40,832) - - (66,072) (106,904)
TOTAL OTHER FINANCING
SOURCES (USES) 1,009,094 82,766 431,741 26,933,928 28,457,529
NET CHANGE IN FUND BALANCE 1,510,717 (1,007,655) 108,886 4,803,275 5,415,223
FUND BALANCE AT BEGINNING
OF YEAR 21,252,117 11,524,158 11,769,385 30,536,685 75,082,345
FUND BALANCE AT END OF YEAR 22,762,834$ 10,516,503$ 11,878,271$ 35,339,960$ 80,497,568$
See notes to financial statements.
Major Funds
Union Public Schools
Year Ended June 30, 2015
Statement of Revenues, Expenditures, and Changes in Fund Balance
Governmental Funds
42
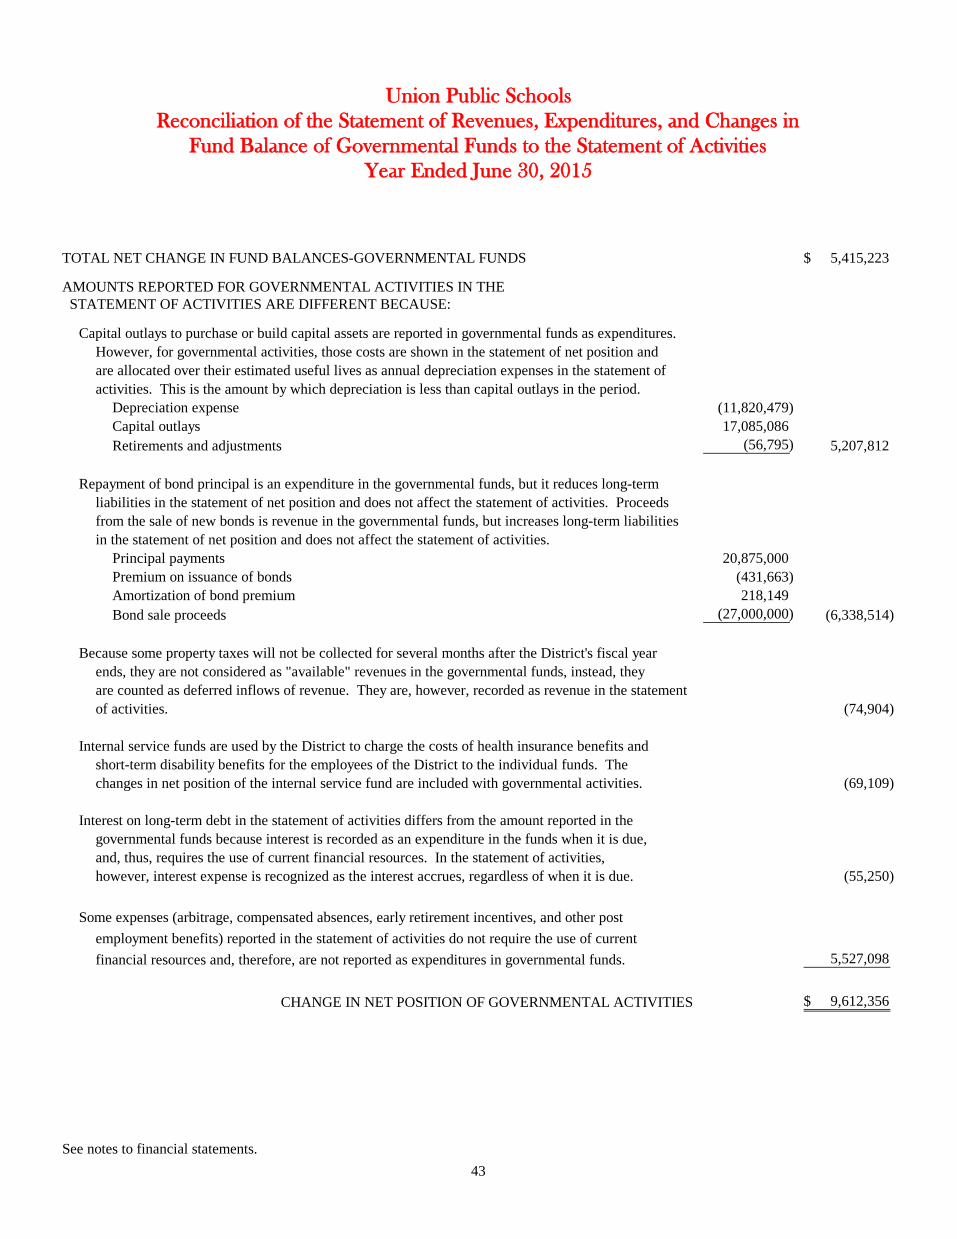
TOTAL NET CHANGE IN FUND BALANCES-GOVERNMENTAL FUNDS 5,415,223$
AMOUNTS REPORTED FOR GOVERNMENTAL ACTIVITIES IN THE
STATEMENT OF ACTIVITIES ARE DIFFERENT BECAUSE:
Capital outlays to purchase or build capital assets are reported in governmental funds as expenditures.
However, for governmental activities, those costs are shown in the statement of net position and
are allocated over their estimated useful lives as annual depreciation expenses in the statement of
activities. This is the amount by which depreciation is less than capital outlays in the period.
Depreciation expense (11,820,479)
Capital outlays 17,085,086
Retirements and adjustments (56,795) 5,207,812
Repayment of bond principal is an expenditure in the governmental funds, but it reduces long-term
liabilities in the statement of net position and does not affect the statement of activities. Proceeds
from the sale of new bonds is revenue in the governmental funds, but increases long-term liabilities
in the statement of net position and does not affect the statement of activities.
Principal payments 20,875,000
Premium on issuance of bonds (431,663)
Amortization of bond premium 218,149
Bond sale proceeds (27,000,000) (6,338,514)
Because some property taxes will not be collected for several months after the District's fiscal year
ends, they are not considered as "available" revenues in the governmental funds, instead, they
are counted as deferred inflows of revenue. They are, however, recorded as revenue in the statement
of activities. (74,904)
Internal service funds are used by the District to charge the costs of health insurance benefits and
short-term disability benefits for the employees of the District to the individual funds. The
changes in net position of the internal service fund are included with governmental activities. (69,109)
Interest on long-term debt in the statement of activities differs from the amount reported in the
governmental funds because interest is recorded as an expenditure in the funds when it is due,
and, thus, requires the use of current financial resources. In the statement of activities,
however, interest expense is recognized as the interest accrues, regardless of when it is due. (55,250)
Some expenses (arbitrage, compensated absences, early retirement incentives, and other post
employment benefits) reported in the statement of activities do not require the use of current
financial resources and, therefore, are not reported as expenditures in governmental funds. 5,527,098
CHANGE IN NET POSITION OF GOVERNMENTAL ACTIVITIES 9,612,356$
See notes to financial statements.
Union Public Schools
Year Ended June 30, 2015
Reconciliation of the Statement of Revenues, Expenditures, and Changes in
Fund Balance of Governmental Funds to the Statement of Activities
43
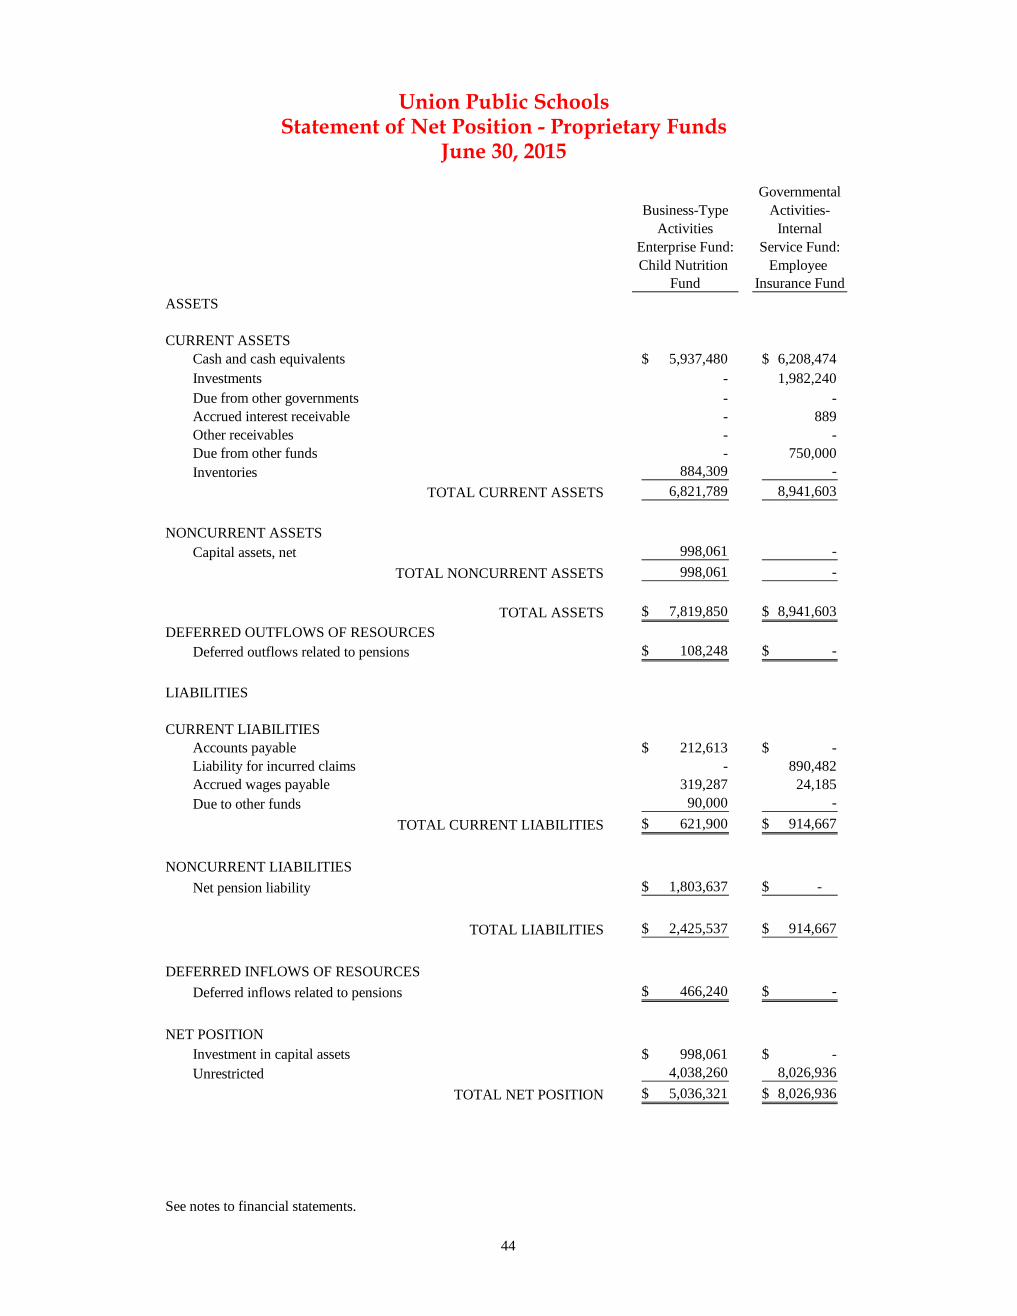
Governmental
Business-Type Activities-
Activities Internal
Enterprise Fund: Service Fund:
Child Nutrition Employee
Fund Insurance Fund
ASSETS
CURRENT ASSETS
Cash and cash equivalents 5,937,480$ 6,208,474$
Investments - 1,982,240
Due from other governments - -
Accrued interest receivable - 889
Other receivables - -
Due from other funds - 750,000
Inventories 884,309 -
TOTAL CURRENT ASSETS 6,821,789 8,941,603
NONCURRENT ASSETS
Capital assets, net 998,061 -
TOTAL NONCURRENT ASSETS 998,061 -
TOTAL ASSETS 7,819,850$ 8,941,603$
DEFERRED OUTFLOWS OF RESOURCES
Deferred outflows related to pensions 108,248$ -$
LIABILITIES
CURRENT LIABILITIES
Accounts payable 212,613$ -$
Liability for incurred claims - 890,482
Accrued wages payable 319,287 24,185
Due to other funds 90,000 -
TOTAL CURRENT LIABILITIES 621,900$ 914,667$
NONCURRENT LIABILITIES
Net pension liability 1,803,637$ -$
TOTAL LIABILITIES 2,425,537$ 914,667$
DEFERRED INFLOWS OF RESOURCES
Deferred inflows related to pensions 466,240$ -$
NET POSITION
Investment in capital assets 998,061$ -$
Unrestricted 4,038,260 8,026,936
TOTAL NET POSITION 5,036,321$ 8,026,936$
See notes to financial statements.
Union Public SchoolsStatement of Net Position - Proprietary Funds
June 30, 2015
44
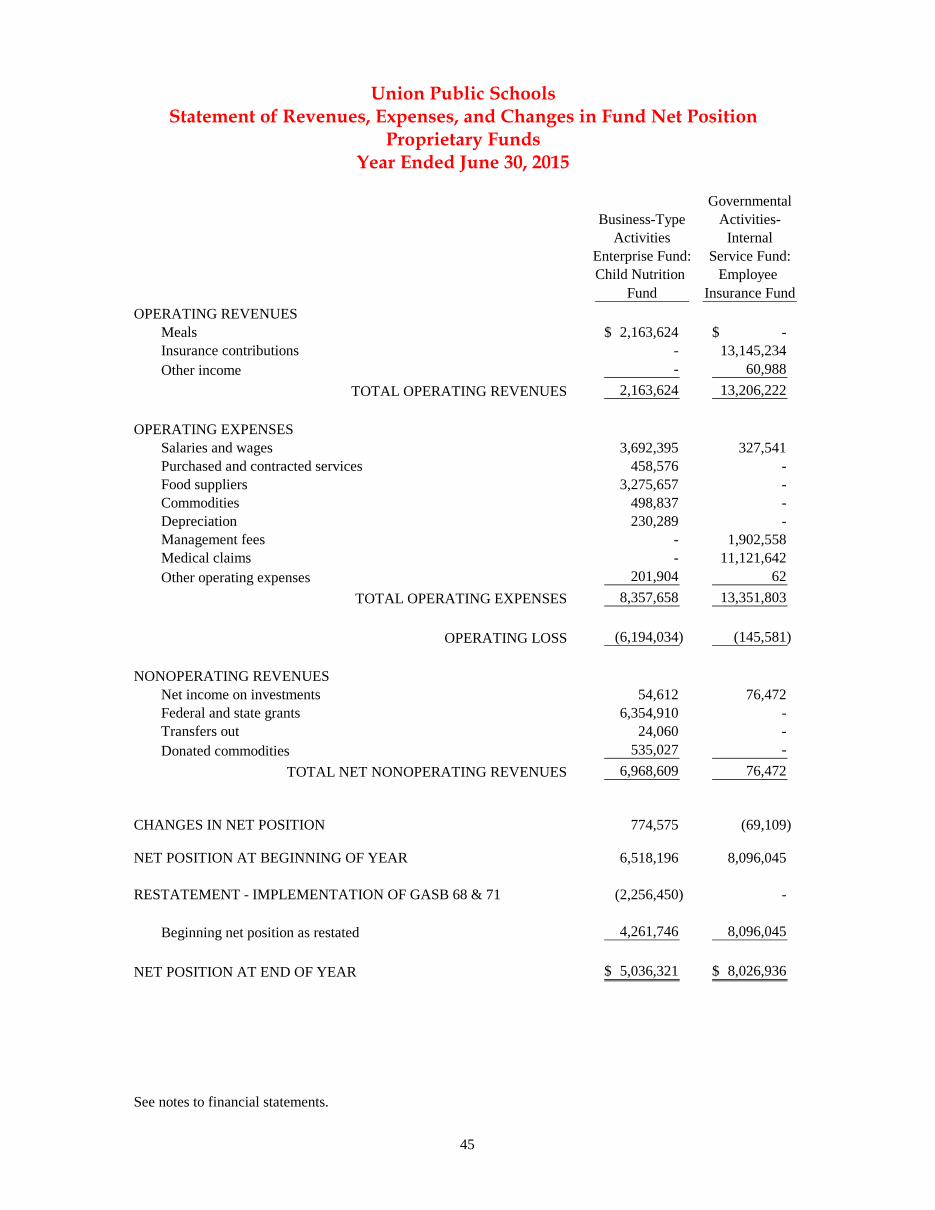
Governmental
Business-Type Activities-
Activities Internal
Enterprise Fund: Service Fund:
Child Nutrition Employee
Fund Insurance Fund
OPERATING REVENUES
Meals 2,163,624$ -$
Insurance contributions - 13,145,234
Other income - 60,988
TOTAL OPERATING REVENUES 2,163,624 13,206,222
OPERATING EXPENSES
Salaries and wages 3,692,395 327,541
Purchased and contracted services 458,576 -
Food suppliers 3,275,657 -
Commodities 498,837 -
Depreciation 230,289 -
Management fees - 1,902,558
Medical claims - 11,121,642
Other operating expenses 201,904 62
TOTAL OPERATING EXPENSES 8,357,658 13,351,803
OPERATING LOSS (6,194,034) (145,581)
NONOPERATING REVENUES
Net income on investments 54,612 76,472
Federal and state grants 6,354,910 -
Transfers out 24,060 -
Donated commodities 535,027 -
TOTAL NET NONOPERATING REVENUES 6,968,609 76,472
CHANGES IN NET POSITION 774,575 (69,109)
NET POSITION AT BEGINNING OF YEAR 6,518,196 8,096,045
RESTATEMENT - IMPLEMENTATION OF GASB 68 & 71 (2,256,450) -
Beginning net position as restated 4,261,746 8,096,045
NET POSITION AT END OF YEAR 5,036,321$ 8,026,936$
See notes to financial statements.
Union Public SchoolsStatement of Revenues, Expenses, and Changes in Fund Net Position
Year Ended June 30, 2015Proprietary Funds
45
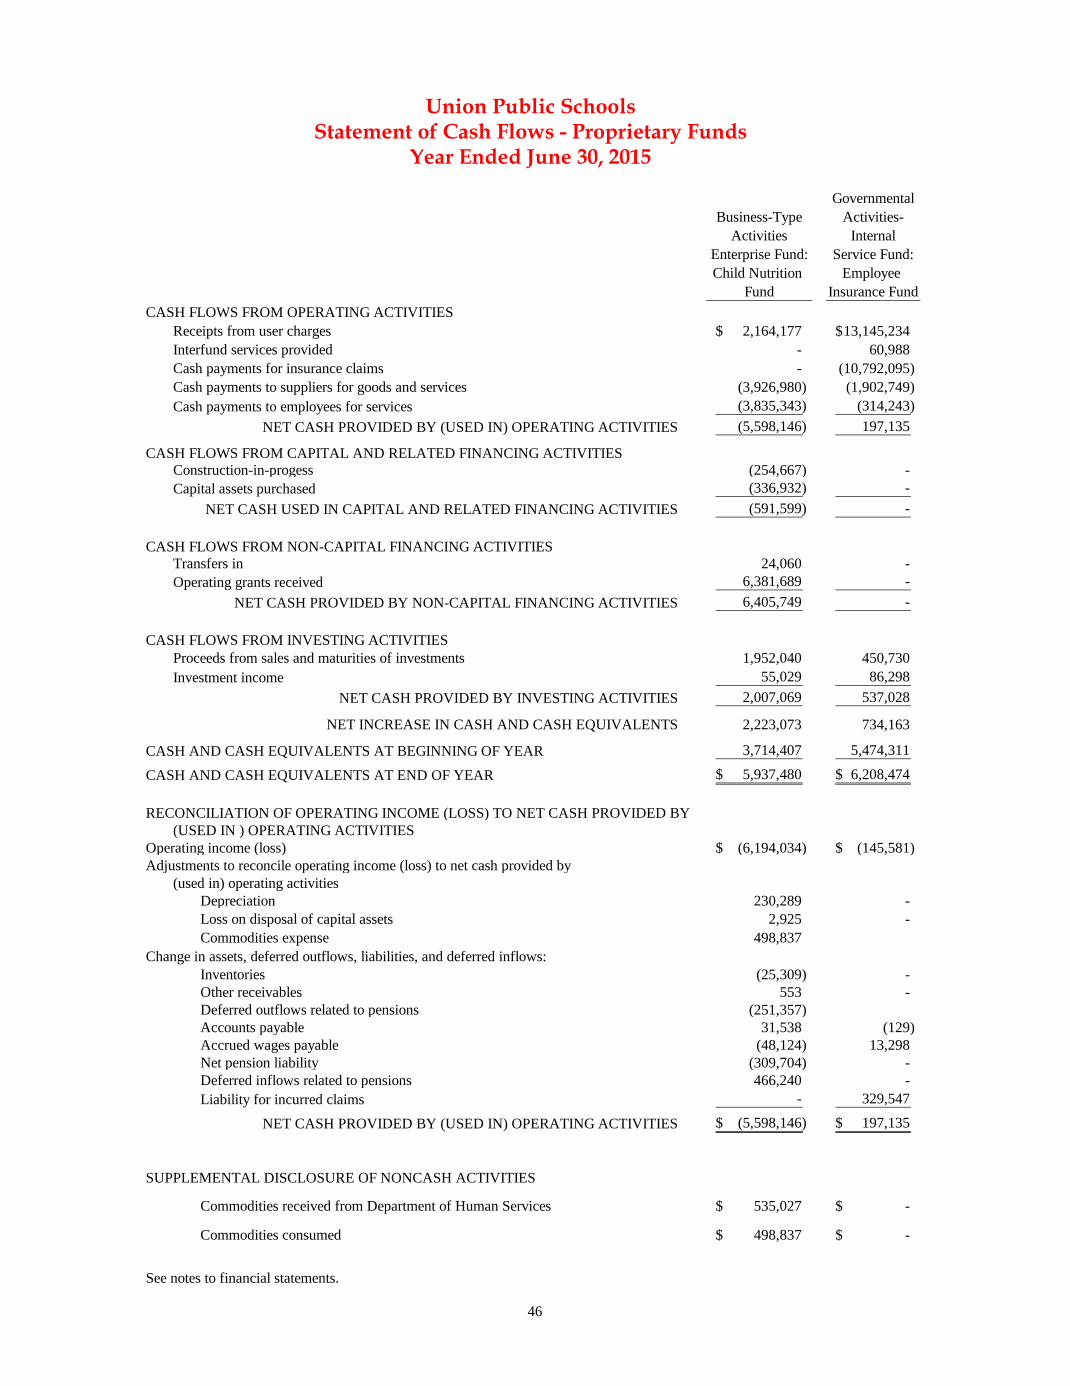
Governmental
Business-Type Activities-
Activities Internal
Enterprise Fund: Service Fund:
Child Nutrition Employee
Fund Insurance Fund
CASH FLOWS FROM OPERATING ACTIVITIES
Receipts from user charges 2,164,177$ 13,145,234$
Interfund services provided - 60,988
Cash payments for insurance claims - (10,792,095)
Cash payments to suppliers for goods and services (3,926,980) (1,902,749)
Cash payments to employees for services (3,835,343) (314,243)
NET CASH PROVIDED BY (USED IN) OPERATING ACTIVITIES (5,598,146) 197,135
CASH FLOWS FROM CAPITAL AND RELATED FINANCING ACTIVITIES
Construction-in-progess (254,667) -
Capital assets purchased (336,932) -
NET CASH USED IN CAPITAL AND RELATED FINANCING ACTIVITIES (591,599) -
CASH FLOWS FROM NON-CAPITAL FINANCING ACTIVITIES
Transfers in 24,060 -
Operating grants received 6,381,689 -
NET CASH PROVIDED BY NON-CAPITAL FINANCING ACTIVITIES 6,405,749 -
CASH FLOWS FROM INVESTING ACTIVITIES
Proceeds from sales and maturities of investments 1,952,040 450,730
Investment income 55,029 86,298
NET CASH PROVIDED BY INVESTING ACTIVITIES 2,007,069 537,028
NET INCREASE IN CASH AND CASH EQUIVALENTS 2,223,073 734,163
CASH AND CASH EQUIVALENTS AT BEGINNING OF YEAR 3,714,407 5,474,311
CASH AND CASH EQUIVALENTS AT END OF YEAR 5,937,480$ 6,208,474$
RECONCILIATION OF OPERATING INCOME (LOSS) TO NET CASH PROVIDED BY
(USED IN ) OPERATING ACTIVITIES
Operating income (loss) (6,194,034)$ (145,581)$
Adjustments to reconcile operating income (loss) to net cash provided by
(used in) operating activities
Depreciation 230,289 -
Loss on disposal of capital assets 2,925 -
Commodities expense 498,837
Change in assets, deferred outflows, liabilities, and deferred inflows:
Inventories (25,309) -
Other receivables 553 -
Deferred outflows related to pensions (251,357)
Accounts payable 31,538 (129)
Accrued wages payable (48,124) 13,298
Net pension liability (309,704) -
Deferred inflows related to pensions 466,240 -
Liability for incurred claims - 329,547
NET CASH PROVIDED BY (USED IN) OPERATING ACTIVITIES (5,598,146)$ 197,135$
SUPPLEMENTAL DISCLOSURE OF NONCASH ACTIVITIES
Commodities received from Department of Human Services 535,027$ -$
Commodities consumed 498,837$ -$
See notes to financial statements.
Union Public SchoolsStatement of Cash Flows - Proprietary Funds
Year Ended June 30, 2015
46
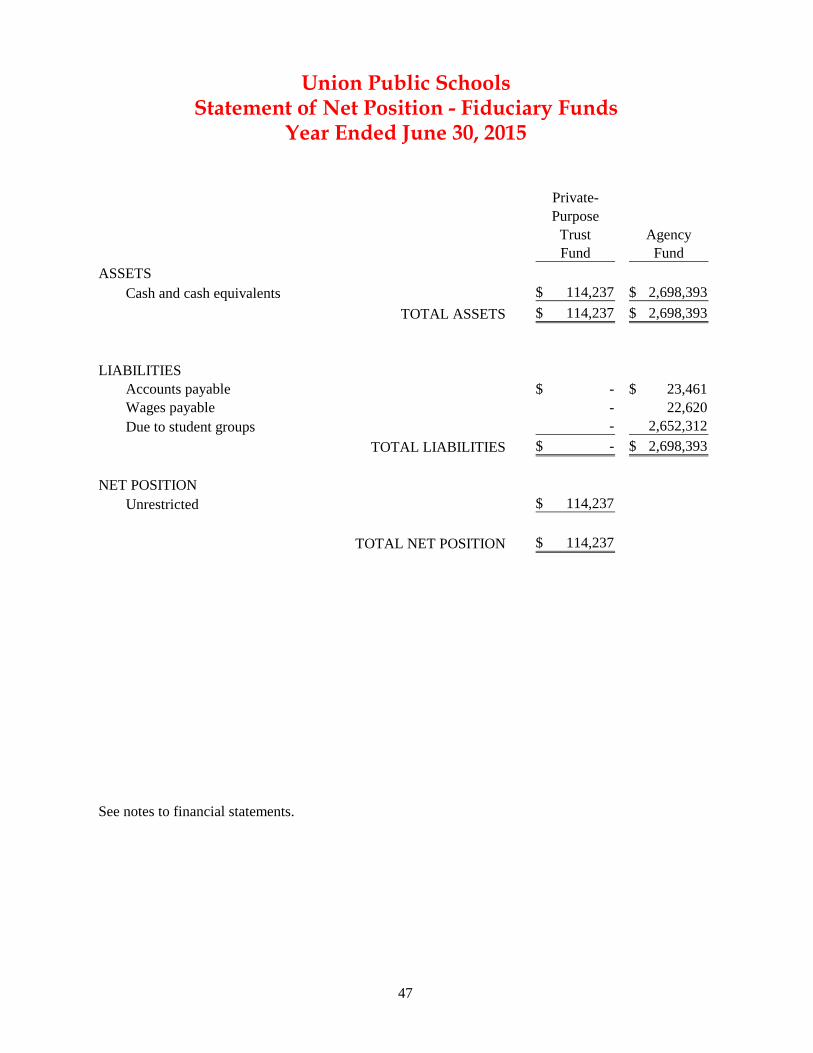
47
Private-Purpose
Trust AgencyFund Fund
ASSETSCash and cash equivalents 114,237$ 2,698,393$
TOTAL ASSETS 114,237$ 2,698,393$
LIABILITIESAccounts payable -$ 23,461$ Wages payable - 22,620 Due to student groups - 2,652,312
TOTAL LIABILITIES -$ 2,698,393$
NET POSITIONUnrestricted 114,237$
TOTAL NET POSITION 114,237$
See notes to financial statements.
Union Public SchoolsStatement of Net Position - Fiduciary Funds
Year Ended June 30, 2015
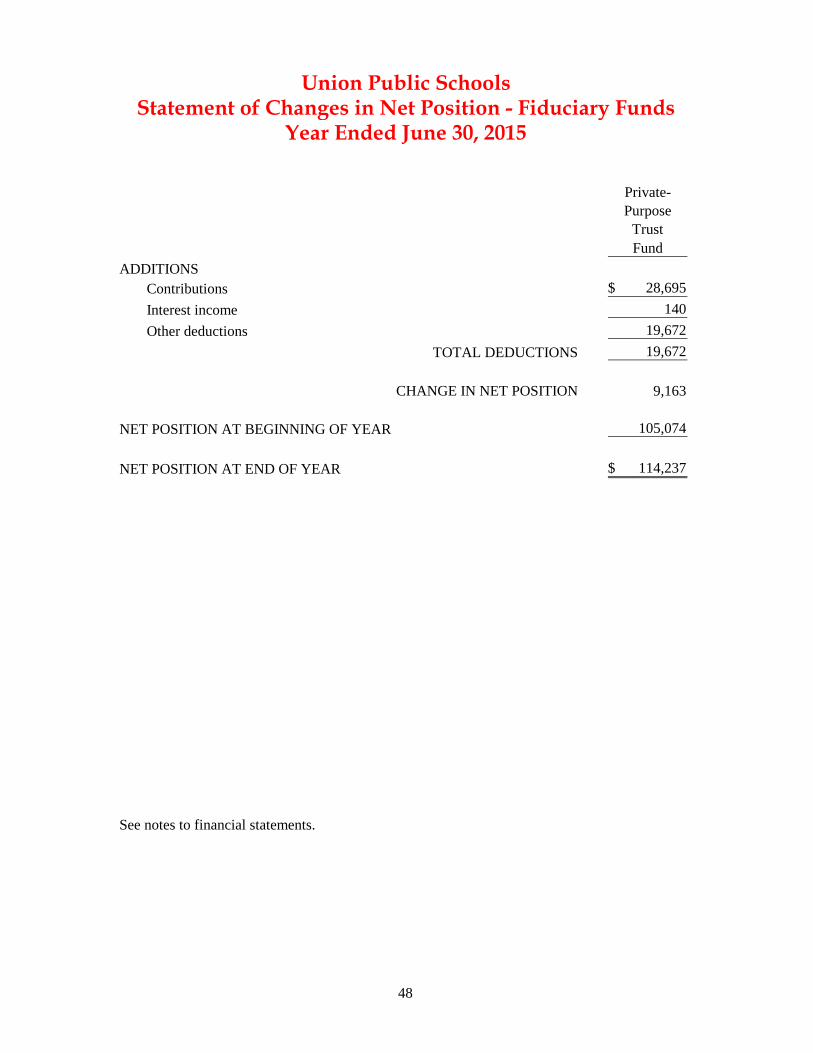
48
Private-Purpose
TrustFund
ADDITIONSContributions 28,695$ Interest income 140 Other deductions 19,672
TOTAL DEDUCTIONS 19,672
CHANGE IN NET POSITION 9,163
NET POSITION AT BEGINNING OF YEAR 105,074
NET POSITION AT END OF YEAR 114,237$
See notes to financial statements.
Union Public SchoolsStatement of Changes in Net Position - Fiduciary Funds
Year Ended June 30, 2015
Union Public Schools – Notes to Financial Statements Year Ended June 30, 2015
49
NOTE A--SUMMARY OF SIGNIFICANT ACCOUNTING POLICIES
Basis of Presentation: The financial statements of the Union Public Schools Independent District No. 9
(the “District”) have been prepared in conformity with accounting principles generally accepted in the
United States of America (“GAAP”) as applied to government units as promulgated by the Governmental
Accounting Standards Board (“GASB”), the accepted standard-setting body for governmental accounting
and financial reporting principles. The more significant of the District’s accounting policies are described
below.
Reporting Entity: The District is a corporate body for public purposes created under Title 70 of the
Oklahoma statutes and, accordingly, is a separate entity for operating and financial reporting purposes.
The District is part of the public school system of Oklahoma under the general direction and control of
the Board of Education and is financially dependent on the state of Oklahoma for support. The general
operating authority for the public school system is the Oklahoma School Code contained in Title 70,
Oklahoma statutes. As required by GAAP, the basic financial statements present the reporting entity
which consists of the primary government, organizations for which the primary government is financially
accountable, and other organizations for which the nature and significance of their relationship with the
primary government are such that exclusion could cause the District’s basic financial statements to be
misleading.
The District has presented the entities which comprise the reporting entity in the basic financial
statements for 2015. The District has not identified any component units that should be included in the
District’s reporting entity.
The governing body of the District is its Board of Education composed of five elected members. The
appointed superintendent is the executive officer of the District.
Basic Financial Statements: The government-wide financial statements (i.e. the statement of net
position and the statement of activities) report information on all of the non-fiduciary activities of the
District. For the most part, the effect of interfund activity has been removed from these statements.
Interfund services provided and used are not eliminated. Governmental activities, which are normally
supported by taxes and intergovernmental revenues, are reported separately from business-type activities,
which rely to a significant extent on fees and charges for support.
The statement of activities demonstrates the degree to which the direct expenses of a given function or
segment is offset by program revenues. Direct expenses are those that are clearly identifiable with a
specific function or segment. Indirect expenses of other functions are not allocated to those functions but
are reported separately in the statement of activities. Depreciation expense is specifically identified by
function and is included in the direct expenses to each function. Program revenues include 1) charges to
customers or applicants who purchase, use or directly benefit from goods, services, or privileges
provided by a given function or segment, and 2) grants and contributions that are restricted to meeting the
operational or capital requirements of a particular function or segment. Taxes and other items not
properly included among program revenues are reported as general revenues.
Union Public Schools – Notes to Financial Statements Year Ended June 30, 2015
50
NOTE A--SUMMARY OF SIGNIFICANT ACCOUNTING POLICIES--Continued
Basic Financial Statements-Continued: Separate financial statements are provided for governmental
funds, proprietary funds, and fiduciary funds, even though the latter are excluded from the government-
wide financial statements. Major individual governmental funds and major individual enterprise funds
are reported as separate columns in the fund financial statements.
Governmental Funds: Governmental funds are used to account for all or most of a government’s
general activities, including the collection and disbursement of earmarked monies (special revenue
funds), the acquisition or construction of general capital assets (capital projects funds), and the servicing
of general long-term debt (debt service funds). The District reports the following major governmental
funds:
General Fund
The General Fund is used to account for all financial transactions except those required to be
accounted for in another fund. Major revenue sources include local property taxes and state funding
under the Foundation and Incentive Aid Program. Expenditures include all costs associated with the
daily operations of the schools except for programs funded for building repairs and maintenance,
school construction, and debt service on bonds and other long-term debt. The General Fund also
includes expenditures for workers’ compensation and general insurance claims, and compensated
absences incurred by the District.
Building Fund
The District’s Building Fund is a special revenue fund and consists of monies derived from property
taxes levied for the purpose of erecting, remodeling, or repairing buildings and for purchasing
furniture and equipment.
Sinking Fund
The District’s sinking fund is a debt service fund and is used to account for the accumulation of
financial resources for the payment of general long-term debt principal, interest and related costs.
The primary revenue sources are local property taxes levied specifically for debt service and interest
earnings from temporary investments.
Bond Fund
The District’s bond fund is a capital project fund and is used to account for the proceeds of bond
sales to be used exclusively for acquiring school sites, constructing and equipping new school
facilities, renovating existing facilities, and acquiring transportation equipment. This fund is also
utilized to acquire books and other non-capitalizable items.
Union Public Schools – Notes to Financial Statements Year Ended June 30, 2015
51
NOTE A--SUMMARY OF SIGNIFICANT ACCOUNTING POLICIES--Continued Proprietary Funds: Proprietary funds are used to account for activities similar to those found in the private sector, where the determination of net income is necessary or useful to sound financial administration. Goods or services from such activities can be provided either to outside parties (enterprise funds) or to other departments or agencies primarily within the District (internal service funds). Proprietary funds distinguish operating revenues and expenses from non-operating items. Operating revenues and expenses generally result from providing services and producing and delivering foods in connection with a proprietary fund’s principal ongoing operations. Operating expenses for enterprise funds and internal service funds include the cost of sales and services, administrative expenses and depreciation on capital assets. All revenues and expenses not meeting this definition are reported as non-operating revenues and expenses. The District reports the following proprietary funds:
Child Nutrition Fund The District’s Child Nutrition Fund is a major enterprise fund used to account for the operations of the child nutrition programs. In addition to meal ticket sales, revenue sources include federal and state grants for free and reduced meals.
Employee Insurance Fund The Employee Insurance Fund is an internal service fund used to account for the accumulation, recording and disbursing of District and participant contributions to the District’s self-insured medical, dental, and short-term disability programs.
Fiduciary Funds: Fiduciary funds are used to account for assets held on behalf of outside parties, including other governments, or on behalf of employees or other funds within the District. When these assets are held under the terms of a formal trust agreement, a pension trust fund, an investment trust fund or a private-purpose trust fund is used. Currently, the District utilizes a private-purpose trust fund to account for activities of the Union School District Public Trust. Agency funds generally are used to account for assets that the District holds on behalf of others as their agent and do not involve measurement of results of operations. The District’s fiduciary funds have been excluded from the government-wide financial statements. The District reports the following fiduciary funds:
Private-Purpose Trust Fund The Union School District trust fund is a private-purpose trust fund used to account for donations received for the benefit of specified individuals associated with the District.
Agency Fund The Agency Fund consists of the School Activities fund. The School Activities fund is used to account for monies collected principally through fundraising efforts of the students and District sponsored groups. The administration is responsible, under the authority of the Board, for collecting, disbursing and accounting for these activity funds.
Union Public Schools – Notes to Financial Statements Year Ended June 30, 2015
52
NOTE A--SUMMARY OF SIGNIFICANT ACCOUNTING POLICIES--Continued
Basis of Accounting and Measurement Focus: The government-wide financial statements are reported
using the economic resources measurement focus and the accrual basis of accounting, as are the proprietary
fund and fiduciary fund financial statements. The economic resources measurement focus is not applicable
to the agency funds and therefore have no measurement focus. Revenues are recorded when earned and
expenses are recorded when a liability is incurred, regardless of the timing of related cash flows. Property
taxes are recognized as revenues in the year for which they are levied. Grants and similar items are
recognized as revenue as soon as all eligibility requirements imposed by the provider have been met.
Agency funds are reported in fiduciary fund financial statements and apply the accrual basis of accounting
but do not have a measurement focus.
Governmental fund financial statements are reported using the current financial resources measurement
focus and the modified accrual basis of accounting. Revenues are recognized as soon as they are both
measurable and available. Revenues are considered to be available when they are collectible within the
current period or soon enough thereafter to pay liabilities of the current period. For this purpose, the
government considers revenues to be available if they are collected within 60 days of the end of the current
fiscal period. Expenditures generally are recorded when a liability is incurred, as under modified accrual
accounting. However, debt service expenditures, as well as expenditures related to compensated absences
are recorded only when the payment is due.
Property taxes, interest and amounts due from other governments associated with the current fiscal period
are all considered to be susceptible to accrual and so have been recognized as revenues of the current fiscal
period. All other revenue items are considered to be measurable and available only when cash is received
by the government.
Budgets and Budgetary Accounting: The District is required by state law to prepare an annual budget. A
preliminary budget must be submitted to the Board of Education by December 31 for the fiscal year
beginning the following July 1. If the preliminary budget requires an additional levy, the District must hold
an election on the second Tuesday in February to approve the levy. If the preliminary budget does not
require an additional levy, it becomes the legal budget. If an election is held and the taxes are approved,
then the preliminary budget becomes the legal budget. If an election rejects the additional taxes, the District
must adopt a budget within the approved tax rate.
A budget is legally adopted by the Board of Education for the General Fund and Building Fund that
includes revenues and expenditures. These budgets are prepared on a cash basis for revenues and
principally on the modified accrual basis for expenditures. Budgetary control is maintained by fund,
function, and activity and budgeted expenditures may not exceed appropriation at the fund level.
Amendments may be made to the budget without approval by the governing body at the function and
activity levels. Fund level budgetary amendments require approval of the governing body.
In addition, encumbrance accounting is employed. Under this system, purchase orders, contracts and other
commitments for the expenditure of resources are recorded to reserve a portion of the applicable
appropriation. At the end of the year, encumbered appropriations for which goods and/or services have not
been received lapse. At the beginning of the next year, prior year encumbrances are reviewed and some are
reestablished. There were no material encumbrances which lapsed at June 30, 2015, and were reinstated
during fiscal year 2016, for the General Fund and Building Fund.
Union Public Schools – Notes to Financial Statements Year Ended June 30, 2015
53
NOTE A--SUMMARY OF SIGNIFICANT ACCOUNTING POLICIES--Continued
Assets, Liabilities, Deferred Outflows and Inflows of Resources, and Net Position
Cash and Cash Equivalents: For purposes of the statement of cash flows, the District considers all cash on
hand, demand deposits and highly liquid investments with an original maturity of three months or less when
purchased to be cash and cash equivalents.
Investments: Investments are stated at fair value. Securities traded on a national or international exchange
are valued at the last reported sales price, at current exchange rates. If quoted market prices are not
available, fair value is estimated based on the estimated fair values provided by brokerage statements. A net
change in fair value of investments is recognized and reported as a change in investment income in the
financial statements for the year ended.
Property Tax Revenues and Receivables: The District is authorized by state law to levy property taxes
which consist of ad valorem taxes on real and personal property within the District. The county assessor
performs an assessment of the valuation of non-exempt real property as of January 1st, the “lien” date. The
county assessor, upon receipt of the certification of tax levies from the county excise board, extends the tax
levies on the tax roll for submission to the county treasurer prior to October 1. The county treasurer must
commence tax collection within fifteen days of receipt of the tax rolls. The first half of taxes is due prior to
January 1. The second half is due prior to April 1.
If the first payment is not made timely, the entire tax becomes due and payable on January 2. The second
half of the taxes becomes delinquent on April 1 of the year following the year of assessment. If not paid by
the following October 1, the property is offered for sale for the amount of taxes due. The purchaser is
issued a certificate of ownership; the original owner has two years to redeem the property by paying the
taxes and penalty owed. If at the end of two years the original owner has not done so, the purchaser is
issued a deed to the property.
Uncollected taxes assessed on valuations made each year are recorded in the District’s governmental fund
financial statements. The delinquent property taxes which are not collected within 60 days of the year end
are recorded in the governmental fund financial statements as deferred inflows of resources. Uncollectible
personal and real property taxes are deemed to be immaterial because the real property can be sold for the
amount of taxes due. Property tax receivables that have been assessed for the subsequent fiscal year are
recoreded as receivable and deferred inflows of resources in both the government-wide statement of net
position and governmental funds balance sheets.
Inventories: Inventories in the governmental funds are carried at cost, using the first-in, first-out method,
and are recorded as expenditures when consumed on the fund financial statements and as expenses when
consumed on the government-wide financial statements. Inventories include fuel, instructional, janitorial,
medical, and food service supplies. Cost of donated federal surplus commodities is based on values
established by the federal government at the time of donation.
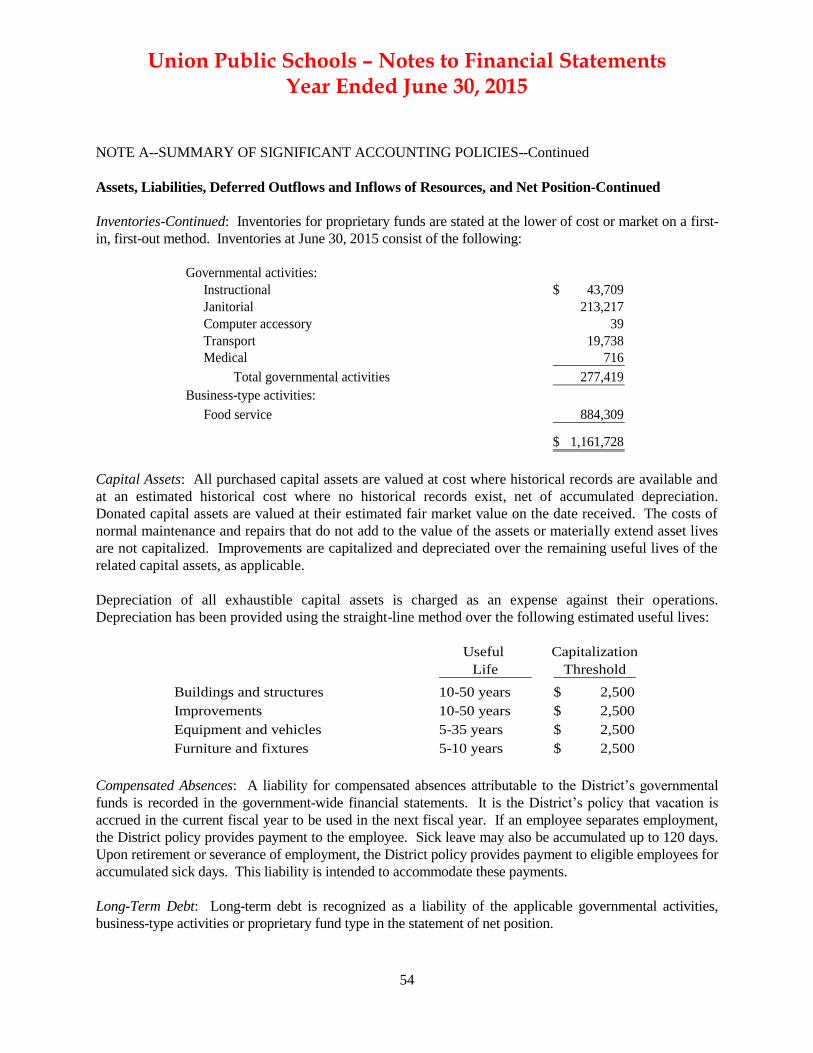
Union Public Schools – Notes to Financial Statements Year Ended June 30, 2015
54
NOTE A--SUMMARY OF SIGNIFICANT ACCOUNTING POLICIES--Continued
Assets, Liabilities, Deferred Outflows and Inflows of Resources, and Net Position-Continued
Inventories-Continued: Inventories for proprietary funds are stated at the lower of cost or market on a first-
in, first-out method. Inventories at June 30, 2015 consist of the following:
Governmental activities:
Instructional 43,709$
Janitorial 213,217
Computer accessory 39
Transport 19,738
Medical 716
Total governmental activities 277,419
Business-type activities:
Food service 884,309
1,161,728$
Capital Assets: All purchased capital assets are valued at cost where historical records are available and
at an estimated historical cost where no historical records exist, net of accumulated depreciation.
Donated capital assets are valued at their estimated fair market value on the date received. The costs of
normal maintenance and repairs that do not add to the value of the assets or materially extend asset lives
are not capitalized. Improvements are capitalized and depreciated over the remaining useful lives of the
related capital assets, as applicable.
Depreciation of all exhaustible capital assets is charged as an expense against their operations.
Depreciation has been provided using the straight-line method over the following estimated useful lives:
Useful Capitalization
Life Threshold
Buildings and structures 10-50 years 2,500$
Improvements 10-50 years 2,500$
Equipment and vehicles 5-35 years 2,500$
Furniture and fixtures 5-10 years 2,500$
Compensated Absences: A liability for compensated absences attributable to the District’s governmental
funds is recorded in the government-wide financial statements. It is the District’s policy that vacation is
accrued in the current fiscal year to be used in the next fiscal year. If an employee separates employment,
the District policy provides payment to the employee. Sick leave may also be accumulated up to 120 days.
Upon retirement or severance of employment, the District policy provides payment to eligible employees for
accumulated sick days. This liability is intended to accommodate these payments.
Long-Term Debt: Long-term debt is recognized as a liability of the applicable governmental activities,
business-type activities or proprietary fund type in the statement of net position.
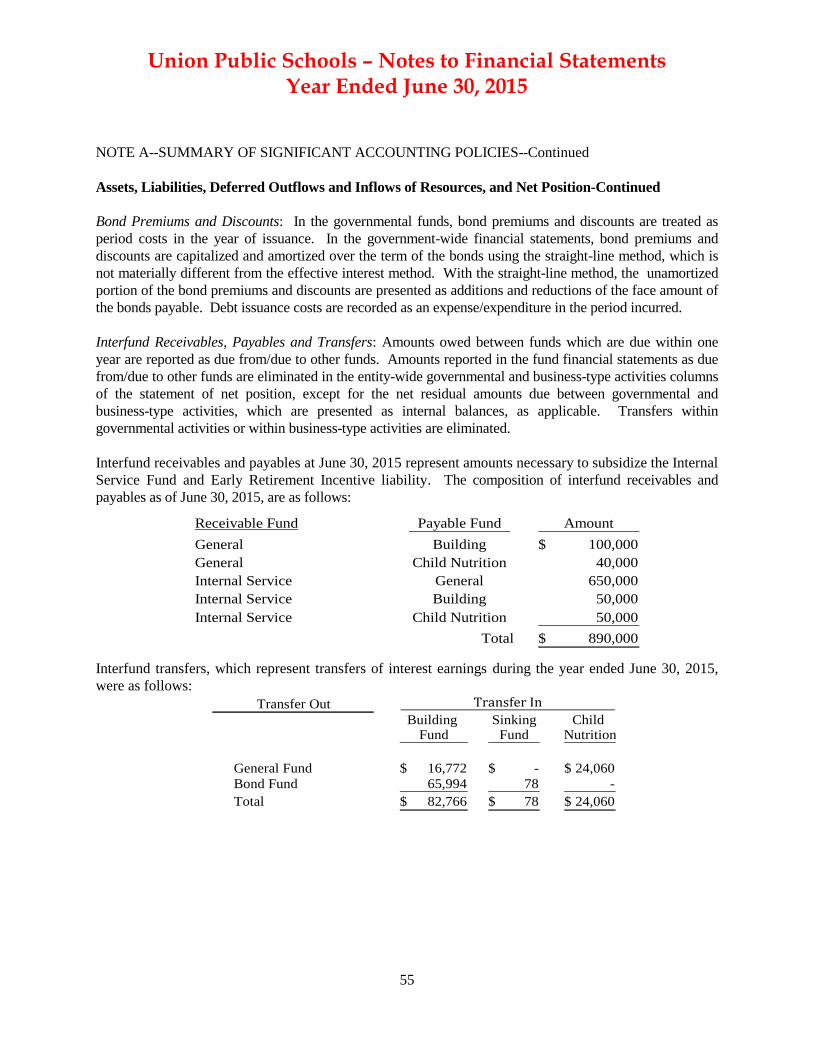
Union Public Schools – Notes to Financial Statements Year Ended June 30, 2015
55
NOTE A--SUMMARY OF SIGNIFICANT ACCOUNTING POLICIES--Continued
Assets, Liabilities, Deferred Outflows and Inflows of Resources, and Net Position-Continued
Bond Premiums and Discounts: In the governmental funds, bond premiums and discounts are treated as
period costs in the year of issuance. In the government-wide financial statements, bond premiums and
discounts are capitalized and amortized over the term of the bonds using the straight-line method, which is
not materially different from the effective interest method. With the straight-line method, the unamortized
portion of the bond premiums and discounts are presented as additions and reductions of the face amount of
the bonds payable. Debt issuance costs are recorded as an expense/expenditure in the period incurred.
Interfund Receivables, Payables and Transfers: Amounts owed between funds which are due within one
year are reported as due from/due to other funds. Amounts reported in the fund financial statements as due
from/due to other funds are eliminated in the entity-wide governmental and business-type activities columns
of the statement of net position, except for the net residual amounts due between governmental and
business-type activities, which are presented as internal balances, as applicable. Transfers within
governmental activities or within business-type activities are eliminated.
Interfund receivables and payables at June 30, 2015 represent amounts necessary to subsidize the Internal
Service Fund and Early Retirement Incentive liability. The composition of interfund receivables and
payables as of June 30, 2015, are as follows:
Receivable Fund Payable Fund Amount
General Building 100,000$
General Child Nutrition 40,000
Internal Service General 650,000
Internal Service Building 50,000
Internal Service Child Nutrition 50,000
Total 890,000$
Interfund transfers, which represent transfers of interest earnings during the year ended June 30, 2015,
were as follows:
Building Sinking Child Fund Fund Nutrition
General Fund 16,772$ -$ 24,060$
Bond Fund 65,994 78 -
Total 82,766$ 78$ 24,060$
Transfer Out Transfer In
Union Public Schools – Notes to Financial Statements Year Ended June 30, 2015
56
NOTE A--SUMMARY OF SIGNIFICANT ACCOUNTING POLICIES--Continued
Assets, Liabilities, Deferred Outflows and Inflows of Resources, and Net Position-Continued
Pensions: The net pension liability, deferred inflows and outflows of resources related to pensions,
pension expense, information about the fiduciary net position of the Oklahoma Teacher’s Retirement
System (OTRS) and additions to/deductions from OTRS’s fiduciary net position have been determined
on the same basis as reported by OTRS. For this purpose, benefit payments (including refunds of
employee contributions) are recognized when due and payable in accordance with the benefit terms.
Investments held by OTRS are reported at fair value.
Deferred Outflows of Resources: Deferred outflows of resources represents a consumption of net position
that applies to a future period(s) and so will not be recognized as an outflow of resources
(expense/expenditure) until then. At June 30, 2015, the government-wide financial statatements included
deferred outflows of resources related to pensions.
Deferred Inflows of Resources: Deferred inflows of resources represents an acquisition of net position
that applies to a future period(s) and so will not be recognized as an inflow of resources (revenue) until
then. The governmental fund balance sheet includes deferred inflows of resources related to unavailable
property taxes receivable; such receivables will be recognized as revenues in the governmental funds
when they become available. At June 30, 2015, the government-wide financial statements reflects
deferred inflows of resources related to pensions. Both the government-wide statement of net position
and governmental funds balance sheet reflect deferred inflows of resources related to property taxes
receivable that have been assessed but are not earned until the subsequent fiscal year.
Revenues, Expenses and Expenditures
State Revenues: Revenues from state sources for current operations are primarily governed by the state
aid formula under the provisions of Article XVIII, Title 70, Oklahoma statutes. The State Board of
Education administers the allocation of state aid funds to school districts based on information
accumulated from the districts. After review and verification of reports and supporting documentation,
the State Department of Education (the “Department”) may adjust allocations of money for errors
disclosed by review. Normally, such adjustments are treated as reductions or additions of revenue of the
year when the adjustment was made.
The District receives revenue from the state to administer certain categorical educational programs.
Board of Education rules require that revenue earmarked for these programs be expended only for the
program for which the money is provided and require that the money not expended as of the close of the
fiscal year be carried forward into the following year to be expended for the same categorical programs.
The Department requires that categorical educational program revenues be accounted for in the General
Fund.
Union Public Schools – Notes to Financial Statements Year Ended June 30, 2015
57
NOTE A--SUMMARY OF SIGNIFICANT ACCOUNTING POLICIES—Continued
Net Position
In the government-wide and proprietary fund financial statements, net position is displayed in three
components as follows:
Net investment in Capital Assets: This consists of capital assets, net of accumulated depreciation
plus deferred outflows of resourses (if applicable) less the outstanding balances of any bonds,
notes, other borrowings, or deferred inflows of resources (if applicable) attributable to the
acquisitions, construction, or improvement of those assets.
Restricted Net Position: Consists of net position that is legally restricted by outside parties or by
law through constitutional provisions of enabling legislation. The District would typically use
restricted net position first, as appropriate opportunities arise, but reserve the right to selectively
defer the use thereof to a future project or replacement equipment acquisition.
Unrestricted Net Position: This consists of net position that does not meet the definition of
restricted net position or net investment in capital assets.
It is the District’s policy to first use restricted net position prior to the use of unrestricted net position
when an expense is incurred for purposes for which both restricted and unrestricted net position are
available.
Governmental fund equity is classified as fund balance. Fund balance is further classified as
nonspendable, restricted, committed, assigned, and unassigned. These classifications are defined as:
Nonspendable Fund Balance: The nonspendable fund balance classification includes amounts
that cannot be spent because they are either a) not in spendable form or b) legally or
contractually required to be maintained intact. This would include items not expected to be
converted to cash including inventories and prepaid amounts. It may also include the long-term
amount of loans and receivables, as well as property acquired for resale and the corpus
(principal) of a permanent fund.
Restricted Fund Balance: The restricted fund balance classification should be reported when
constraints placed on the use of resources are either a) externally imposed by creditors, grantors,
contributors, or laws or regulations of other governments or b) imposed by law through
constitutional provisions or enabling legislation.
Committed Fund Balance: The committed fund balance classification reflects specific purposes
pursuant to constraints imposed by formal action of the District’s highest level of decision-
making authority. Also, such constraints can only be removed or changed by the same form of
formal action. For purposes of committed fund balance, the District’s Board of Education is
considered to be its highest level of decision making. A motion to set aside funds as committed
fund balance requires the approval by the Board of Education by a majority vote of the members
of the Board of Education . Such approval must take place prior to the District’s fiscal year-end
in order for it to be applicable to the District’s fiscal year-end, although it is permitted for the
specific amount of the commitment to be determined after the fiscal year-end if additional
information is required in order to determine the exact amount to be committed. The Board of
Education has the authority to remove or change the commitment of funds with a majority vote.
The District had no committed fund balance at June 30, 2015.
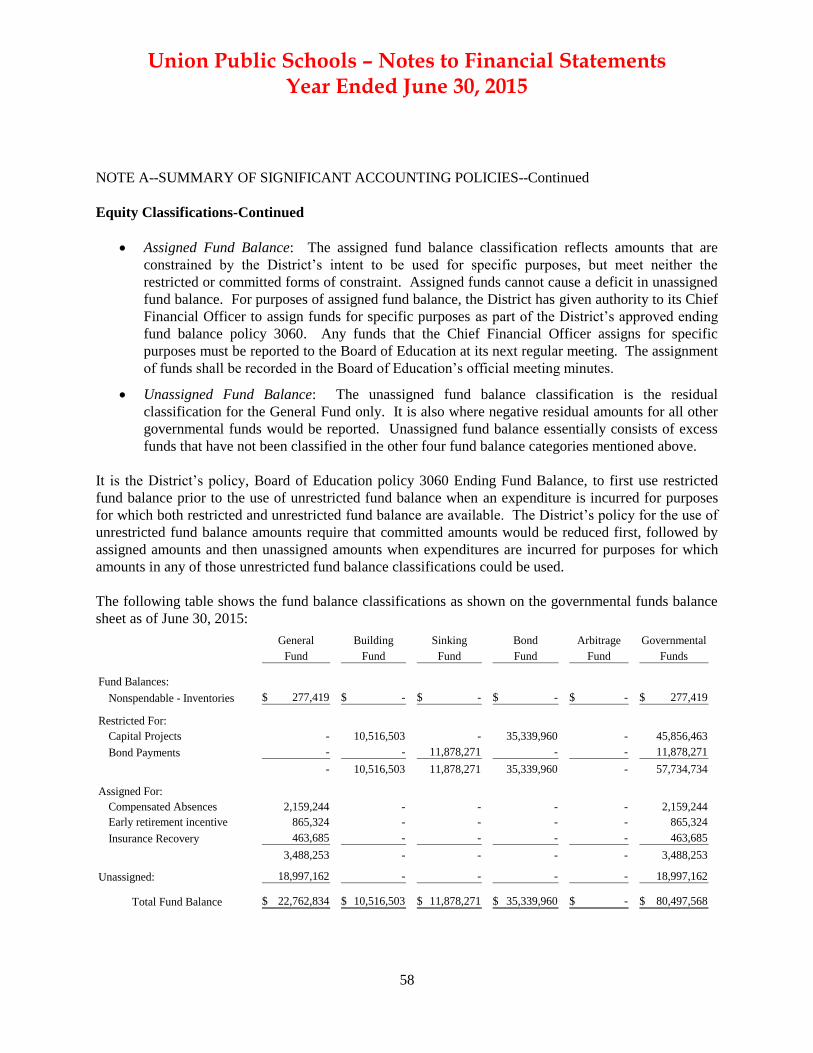
Union Public Schools – Notes to Financial Statements Year Ended June 30, 2015
58
NOTE A--SUMMARY OF SIGNIFICANT ACCOUNTING POLICIES--Continued
Equity Classifications-Continued
Assigned Fund Balance: The assigned fund balance classification reflects amounts that are
constrained by the District’s intent to be used for specific purposes, but meet neither the
restricted or committed forms of constraint. Assigned funds cannot cause a deficit in unassigned
fund balance. For purposes of assigned fund balance, the District has given authority to its Chief
Financial Officer to assign funds for specific purposes as part of the District’s approved ending
fund balance policy 3060. Any funds that the Chief Financial Officer assigns for specific
purposes must be reported to the Board of Education at its next regular meeting. The assignment
of funds shall be recorded in the Board of Education’s official meeting minutes.
Unassigned Fund Balance: The unassigned fund balance classification is the residual
classification for the General Fund only. It is also where negative residual amounts for all other
governmental funds would be reported. Unassigned fund balance essentially consists of excess
funds that have not been classified in the other four fund balance categories mentioned above.
It is the District’s policy, Board of Education policy 3060 Ending Fund Balance, to first use restricted
fund balance prior to the use of unrestricted fund balance when an expenditure is incurred for purposes
for which both restricted and unrestricted fund balance are available. The District’s policy for the use of
unrestricted fund balance amounts require that committed amounts would be reduced first, followed by
assigned amounts and then unassigned amounts when expenditures are incurred for purposes for which
amounts in any of those unrestricted fund balance classifications could be used.
The following table shows the fund balance classifications as shown on the governmental funds balance
sheet as of June 30, 2015:
General Building Sinking Bond Arbitrage Governmental
Fund Fund Fund Fund Fund Funds
Fund Balances:
Nonspendable - Inventories 277,419$ -$ -$ -$ -$ 277,419$
Restricted For:
Capital Projects - 10,516,503 - 35,339,960 - 45,856,463
Bond Payments - - 11,878,271 - - 11,878,271
- 10,516,503 11,878,271 35,339,960 - 57,734,734
Assigned For:
Compensated Absences 2,159,244 - - - - 2,159,244
Early retirement incentive 865,324 - - - - 865,324
Insurance Recovery 463,685 - - - - 463,685
3,488,253 - - - - 3,488,253
Unassigned: 18,997,162 - - - - 18,997,162
Total Fund Balance 22,762,834$ 10,516,503$ 11,878,271$ 35,339,960$ -$ 80,497,568$
Union Public Schools – Notes to Financial Statements Year Ended June 30, 2015
59
NOTE A--SUMMARY OF SIGNIFICANT ACCOUNTING POLICIES--Continued
Use of Estimates
The preparation of financial statements in conformity with accounting principles generally accepted in
the United States of America requires management to make estimates and assumptions that affect the
amounts reported in the financial statements and accompanying notes. Actual results could differ from
those estimates.
NOTE B--CASH AND INVESTMENTS
Custodial Credit Risk: Custodial credit risk is the risk that in the event of failure of counterparty, the
District will not be able to recover the value of its deposits or investments. Deposits are exposed to
custodial credit risk if they are uninsured and uncollateralized. Investment securities are exposed to
custodial credit risk if they are uninsured, are not registered in the name of the District, and are held by a
counterparty or the counterparty’s trust department but not in the name of the District.
The District’s policy requires that all deposits and investments in excess of amounts covered by federal
deposit insurance be fully collateralized by the entity holding the deposits or investments. As of June 30,
2015, all of the Districts deposits and investments were either covered by federal deposit insurance or
were fully collateralized.
Deposits: The District had deposits at financial institutions with a cash basis carrying amount for all
funds of approximately $85,103,000 at June 30, 2015. The bank balance of these deposits at June 30,
2015 was approximately $92,141,000. The difference in the carrying amount and the bank balance was
primarily due to outstanding checks.
Credit Risk: Fixed-income securities are subject to credit risk. Credit quality rating is one method of
assessing the ability of the issuer to meet its obligation. The District’s investment policy requires that,
except for United States Treasury securities, the District’s investment portfolio will be diversified to
avoid incurring undue concentration in securities of one type. The District’s policy also requires that all
deposits and investments in excess of amounts covered by federal deposit insurance be fully
collateralized by the entity holding the deposits or investments. There is no District policy related to
limitations on credit rating risk. Due to the unstable economic climate and extremely low available
interest rates for investing, investments were purchased to obtain the highest possible interest rate.
Therefore, the investment portfolio consisted of holdings totaling approximately $17,500,000, with
current fair value of approximately $17,397,000 in Federal home loan with a variable coupon rate
ranging from 1.00-1.25%. Federal home loan investments are considered obligations of the U.S.
government and therefore carry the same credit ratings as the government. The credit ratings of the U.S.
government are Moodys Aaa, Standard and Poor AA+, and Fitch AAA.
Union Public Schools – Notes to Financial Statements Year Ended June 30, 2015
60
NOTE B--CASH AND INVESTMENTS--Continued
Interest Rate Risk: Interest rate risk is the risk that changes in interest rates will adversely affect the fair
value of an investment. The District’s investment policy limits the duration of fixed-income securities to
a maximum maturity from the date of purchase of sixty months, provided that sufficient liquidity is
available to meet the District’s major cash outlays. The District’s investment committee and Board of
Education monitor the District’s investment performance on an ongoing basis to limit the District’s
interest rate risk. As of June 30, 2015, all of the District’s investments were scheduled to mature within
the next 6 years with callable dates within the next 6 months.
Investment maturities at June 30, 2015, for the District’s governmental and proprietary funds in the
aggregate, are as follows:
Security Fair Value 1-5 years 6-10 years
Federal Home Loan 17,396,925$ 4,955,600$ 12,441,325$
Maturity
NOTE C--RECEIVABLES
Receivables at June 30, 2015, all due within one year, for the District’s governmental and proprietary
funds in the aggregate, are as follows:
Management expects these receivables to be collected within the next fiscal year.
Building Sinking Bond Nutrition Service
General Fund Fund Fund Fund Fund Total
Accrued interest 53,347$ 1,556$ 1,111$ 1,361$ -$ 889$ 58,264$
Due from other governments 2,717,317 13,929 79,902 - - - 2,811,148
Other 360,882 - - - - - 360,882
Property taxes--delinquent 297,875 42,554 241,274 - - - 581,703
Property taxes--subsequent year 27,226,105 3,889,444 22,513,459 - - - 53,629,008
30,655,526$ 3,947,483$ 22,835,746$ 1,361$ -$ 889$ 57,441,005$
Union Public Schools – Notes to Financial Statements Year Ended June 30, 2015
61
NOTE D--CAPITAL ASSETS
A summary of changes in capital assets for the year ended June 30, 2015, follows:
Balance Balance
June 30, Reclassifications June 30,
2014 Additions Deductions and Adjustments 2015
Governmental activities
Capital assets not being depreciated
Land 14,293,205$ -$ -$ -$ 14,293,205$
Construction in-progress
General government 1,996,814 12,139,265 - (2,796,141) 11,339,938
Total capital assets
not being depreciated 16,290,019 12,139,265 - (2,796,141) 25,633,143
Capital assets being depreciated
Land improvements 11,414,434 2,970 (350,000) 664,747 11,732,151
Building and Building Improvements 246,237,930 122,224 - 2,131,394 248,491,548
Machinery, equipment and vehicles 45,894,633 4,820,627 (2,170,690) 86,558 48,631,128
Total capital assets
being depreciated 303,546,997 4,945,821 (2,520,690) 2,882,699 308,854,827
Less accumulated depreciation for:
Land improvements (2,945,207) (566,992) - - (3,512,199)
Building and Building Improvements (113,156,325) (7,824,701) 229,771 - (120,751,255)
Machinery, equipment and vehicles (40,226,751) (3,428,786) 2,147,566 - (41,507,971)
Total accumulated depreciation (156,328,283) (11,820,479) 2,377,337 - (165,771,425)
Total capital assets being
depreciated, net 147,218,714 (6,874,658) (143,353) 2,882,699 143,083,402
Governmental activities
Capital assets, net 163,508,733$ 5,264,607$ (143,353)$ 86,558$ 168,716,545$
Summary of Governmental Activities
Capital Assets
Total capital assets 319,837,016$ 17,085,086$ (2,520,690)$ 86,558$ 334,487,970$
Less accumulated depreciation (156,328,283) (11,820,479) 2,377,337 - (165,771,425)
Capital assets, net 163,508,733$ 5,264,607$ (143,353)$ 86,558$ 168,716,545$
Business type activities
Capital assets not being depreciated
Construction in-progress -$ 254,667$ -$ (145,977)$ 108,690$
Capital assets being depreciated
Furniture, equipment and vehicles 2,779,165 336,932 (53,418) 145,977 3,208,656
Less accumulated depreciation for
Furniture, equipment and vehicles (2,139,489) (230,289) 50,493 - (2,319,285)
Total capital assets being
depreciated, net 639,676 106,643 (2,925) 145,977 889,371
Capital assets, net 639,676$ 361,310$ (2,925)$ -$ 998,061$
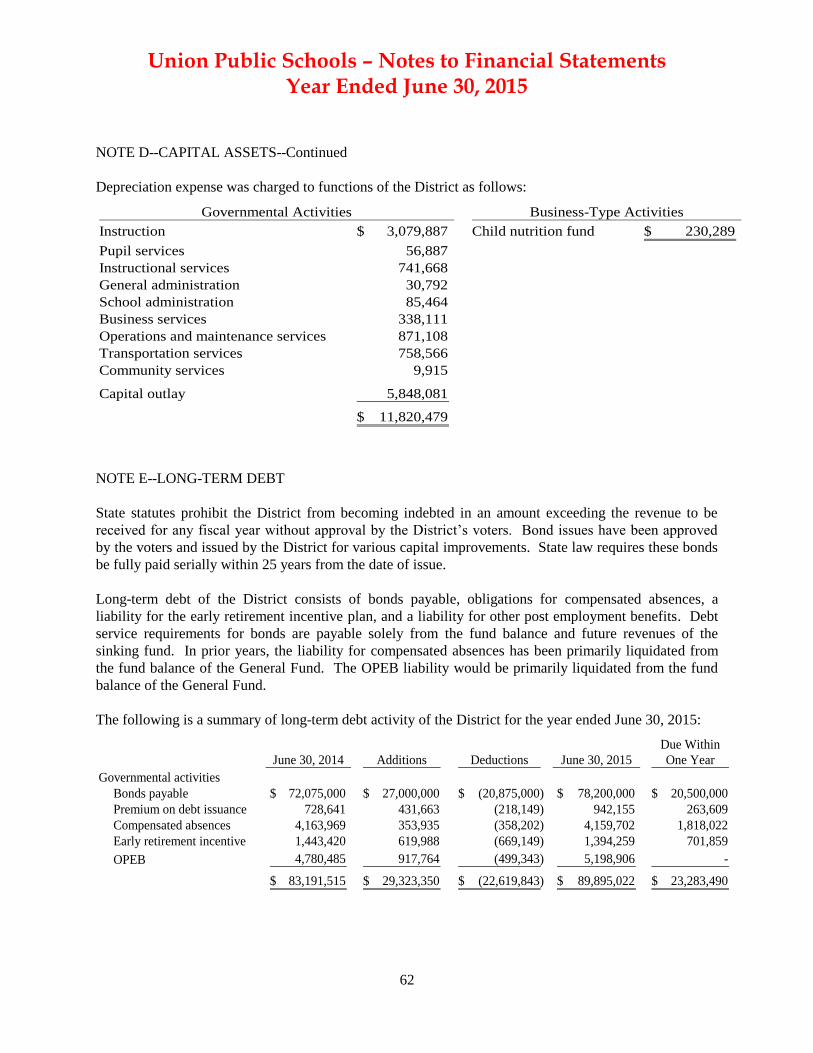
Union Public Schools – Notes to Financial Statements Year Ended June 30, 2015
62
NOTE D--CAPITAL ASSETS--Continued
Depreciation expense was charged to functions of the District as follows:
Instruction 3,079,887$ Child nutrition fund 230,289$
Pupil services 56,887
Instructional services 741,668
General administration 30,792
School administration 85,464
Business services 338,111
Operations and maintenance services 871,108
Transportation services 758,566
Community services 9,915
Capital outlay 5,848,081
11,820,479$
Business-Type ActivitiesGovernmental Activities
NOTE E--LONG-TERM DEBT
State statutes prohibit the District from becoming indebted in an amount exceeding the revenue to be
received for any fiscal year without approval by the District’s voters. Bond issues have been approved
by the voters and issued by the District for various capital improvements. State law requires these bonds
be fully paid serially within 25 years from the date of issue.
Long-term debt of the District consists of bonds payable, obligations for compensated absences, a
liability for the early retirement incentive plan, and a liability for other post employment benefits. Debt
service requirements for bonds are payable solely from the fund balance and future revenues of the
sinking fund. In prior years, the liability for compensated absences has been primarily liquidated from
the fund balance of the General Fund. The OPEB liability would be primarily liquidated from the fund
balance of the General Fund.
The following is a summary of long-term debt activity of the District for the year ended June 30, 2015:
Due Within
June 30, 2014 Additions Deductions June 30, 2015 One Year
Governmental activities
Bonds payable 72,075,000$ 27,000,000$ (20,875,000)$ 78,200,000$ 20,500,000$
Premium on debt issuance 728,641 431,663 (218,149) 942,155 263,609
Compensated absences 4,163,969 353,935 (358,202) 4,159,702 1,818,022
Early retirement incentive 1,443,420 619,988 (669,149) 1,394,259 701,859
OPEB 4,780,485 917,764 (499,343) 5,198,906 -
83,191,515$ 29,323,350$ (22,619,843)$ 89,895,022$ 23,283,490$
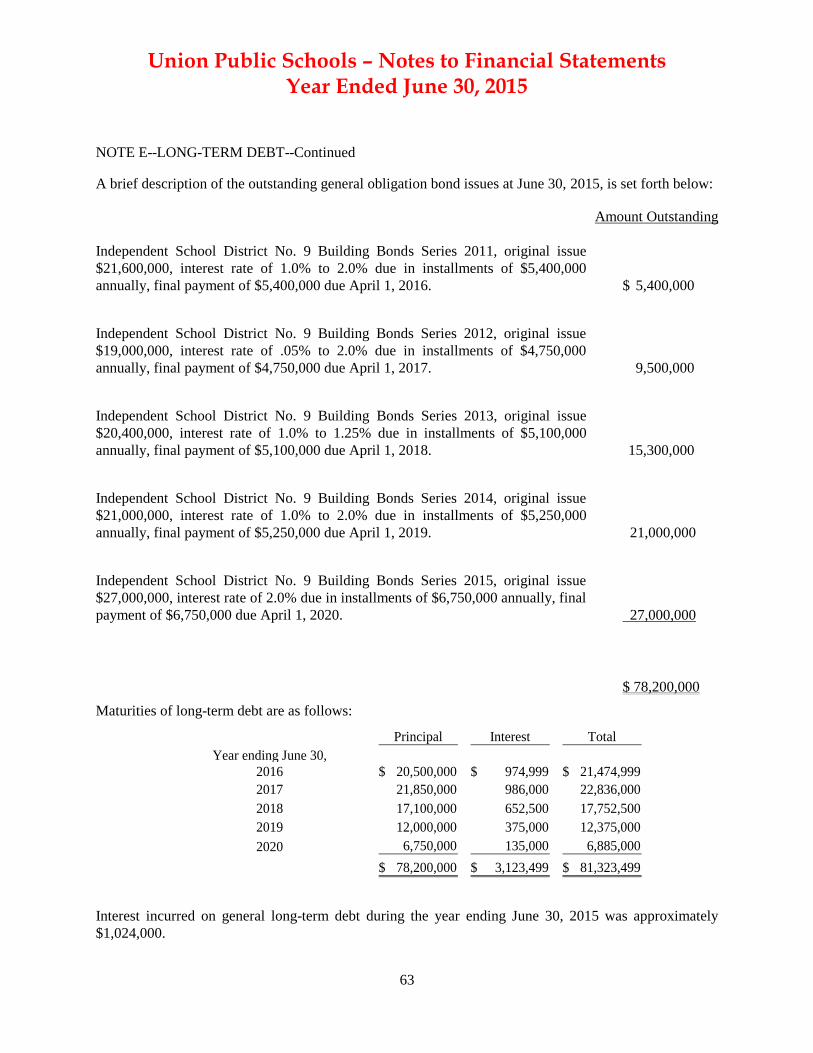
Union Public Schools – Notes to Financial Statements Year Ended June 30, 2015
63
NOTE E--LONG-TERM DEBT--Continued
A brief description of the outstanding general obligation bond issues at June 30, 2015, is set forth below:
Amount Outstanding
Independent School District No. 9 Building Bonds Series 2011, original issue
$21,600,000, interest rate of 1.0% to 2.0% due in installments of $5,400,000
annually, final payment of $5,400,000 due April 1, 2016. $ 5,400,000
Independent School District No. 9 Building Bonds Series 2012, original issue
$19,000,000, interest rate of .05% to 2.0% due in installments of $4,750,000
annually, final payment of $4,750,000 due April 1, 2017. 9,500,000
Independent School District No. 9 Building Bonds Series 2013, original issue
$20,400,000, interest rate of 1.0% to 1.25% due in installments of $5,100,000
annually, final payment of $5,100,000 due April 1, 2018. 15,300,000
Independent School District No. 9 Building Bonds Series 2014, original issue
$21,000,000, interest rate of 1.0% to 2.0% due in installments of $5,250,000
annually, final payment of $5,250,000 due April 1, 2019. 21,000,000
Independent School District No. 9 Building Bonds Series 2015, original issue
$27,000,000, interest rate of 2.0% due in installments of $6,750,000 annually, final
payment of $6,750,000 due April 1, 2020. 27,000,000
$ 78,200,000
Maturities of long-term debt are as follows:
Principal Interest Total
Year ending June 30,
2016 20,500,000$ 974,999$ 21,474,999$
2017 21,850,000 986,000 22,836,000
2018 17,100,000 652,500 17,752,500
2019 12,000,000 375,000 12,375,000
2020 6,750,000 135,000 6,885,000
78,200,000$ 3,123,499$ 81,323,499$
Interest incurred on general long-term debt during the year ending June 30, 2015 was approximately
$1,024,000.
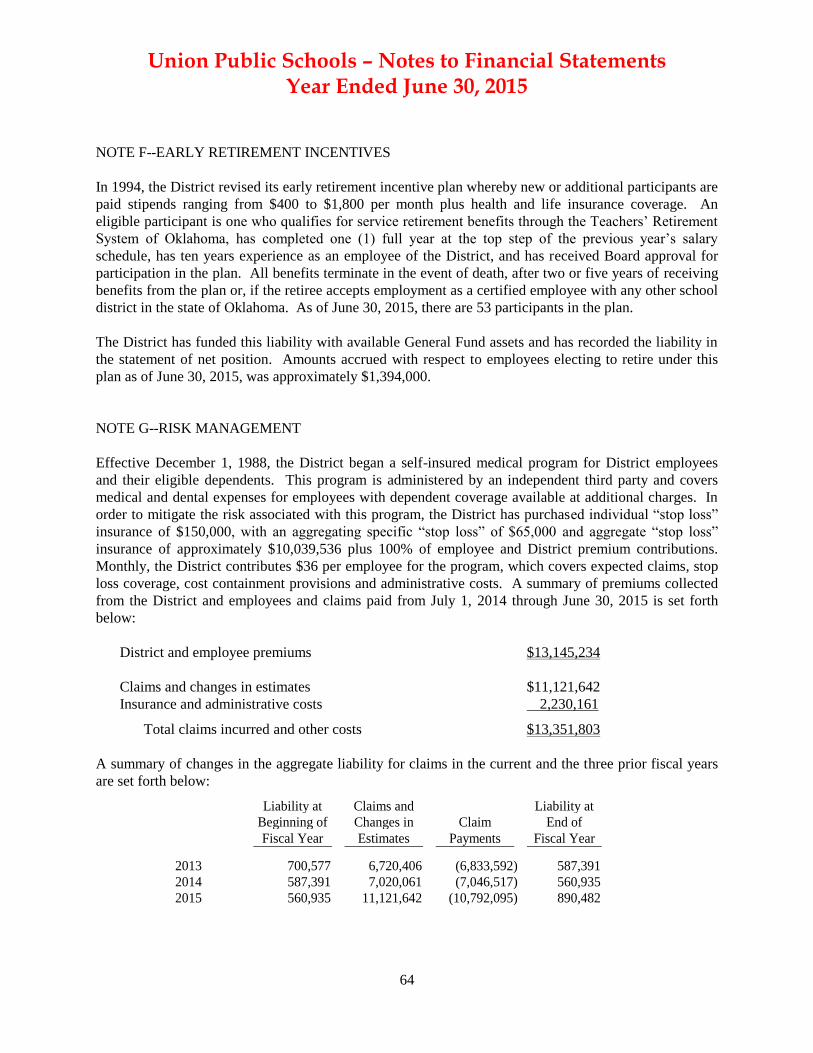
Union Public Schools – Notes to Financial Statements Year Ended June 30, 2015
64
NOTE F--EARLY RETIREMENT INCENTIVES
In 1994, the District revised its early retirement incentive plan whereby new or additional participants are
paid stipends ranging from $400 to $1,800 per month plus health and life insurance coverage. An
eligible participant is one who qualifies for service retirement benefits through the Teachers’ Retirement
System of Oklahoma, has completed one (1) full year at the top step of the previous year’s salary
schedule, has ten years experience as an employee of the District, and has received Board approval for
participation in the plan. All benefits terminate in the event of death, after two or five years of receiving
benefits from the plan or, if the retiree accepts employment as a certified employee with any other school
district in the state of Oklahoma. As of June 30, 2015, there are 53 participants in the plan.
The District has funded this liability with available General Fund assets and has recorded the liability in
the statement of net position. Amounts accrued with respect to employees electing to retire under this
plan as of June 30, 2015, was approximately $1,394,000.
NOTE G--RISK MANAGEMENT
Effective December 1, 1988, the District began a self-insured medical program for District employees
and their eligible dependents. This program is administered by an independent third party and covers
medical and dental expenses for employees with dependent coverage available at additional charges. In
order to mitigate the risk associated with this program, the District has purchased individual “stop loss”
insurance of $150,000, with an aggregating specific “stop loss” of $65,000 and aggregate “stop loss”
insurance of approximately $10,039,536 plus 100% of employee and District premium contributions.
Monthly, the District contributes $36 per employee for the program, which covers expected claims, stop
loss coverage, cost containment provisions and administrative costs. A summary of premiums collected
from the District and employees and claims paid from July 1, 2014 through June 30, 2015 is set forth
below:
District and employee premiums $13,145,234
Claims and changes in estimates $11,121,642
Insurance and administrative costs 2,230,161
Total claims incurred and other costs $13,351,803
A summary of changes in the aggregate liability for claims in the current and the three prior fiscal years
are set forth below:
Liability at Claims and Liability at
Beginning of Changes in Claim End of
Fiscal Year Estimates Payments Fiscal Year
2013 700,577 6,720,406 (6,833,592) 587,391
2014 587,391 7,020,061 (7,046,517) 560,935
2015 560,935 11,121,642 (10,792,095) 890,482
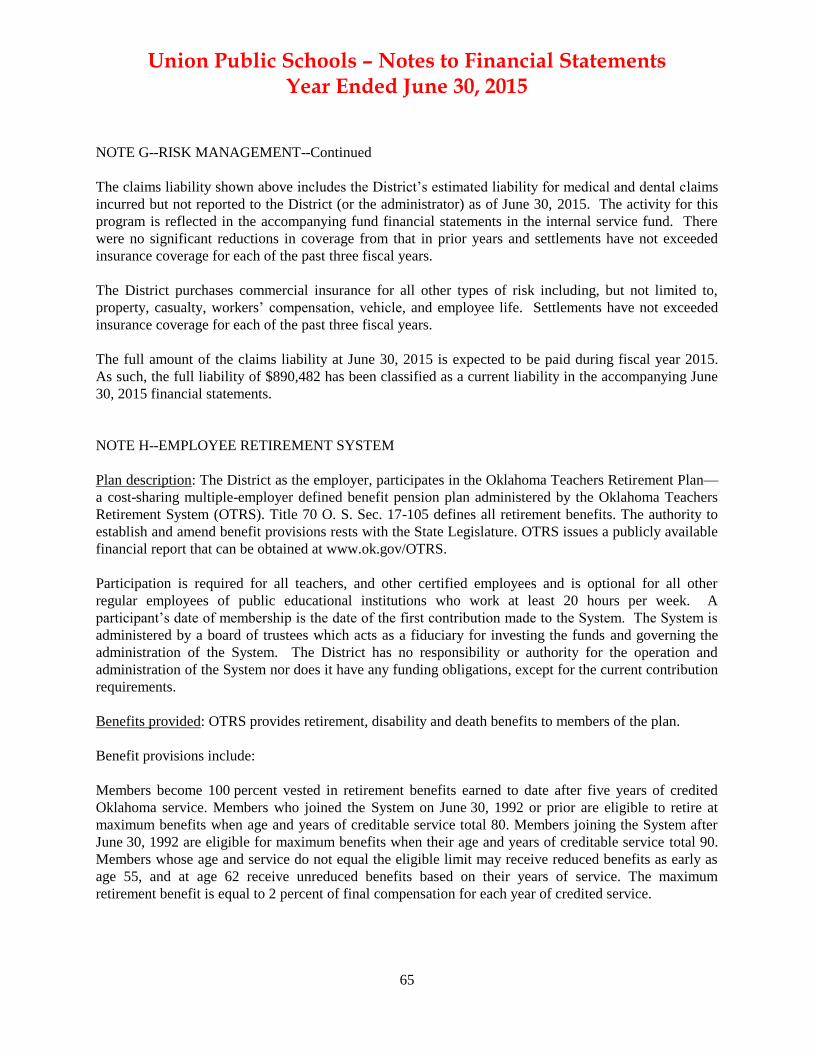
Union Public Schools – Notes to Financial Statements Year Ended June 30, 2015
65
NOTE G--RISK MANAGEMENT--Continued
The claims liability shown above includes the District’s estimated liability for medical and dental claims
incurred but not reported to the District (or the administrator) as of June 30, 2015. The activity for this
program is reflected in the accompanying fund financial statements in the internal service fund. There
were no significant reductions in coverage from that in prior years and settlements have not exceeded
insurance coverage for each of the past three fiscal years.
The District purchases commercial insurance for all other types of risk including, but not limited to,
property, casualty, workers’ compensation, vehicle, and employee life. Settlements have not exceeded
insurance coverage for each of the past three fiscal years.
The full amount of the claims liability at June 30, 2015 is expected to be paid during fiscal year 2015.
As such, the full liability of $890,482 has been classified as a current liability in the accompanying June
30, 2015 financial statements.
NOTE H--EMPLOYEE RETIREMENT SYSTEM
Plan description: The District as the employer, participates in the Oklahoma Teachers Retirement Plan—
a cost-sharing multiple-employer defined benefit pension plan administered by the Oklahoma Teachers
Retirement System (OTRS). Title 70 O. S. Sec. 17-105 defines all retirement benefits. The authority to
establish and amend benefit provisions rests with the State Legislature. OTRS issues a publicly available
financial report that can be obtained at www.ok.gov/OTRS.
Participation is required for all teachers, and other certified employees and is optional for all other
regular employees of public educational institutions who work at least 20 hours per week. A
participant’s date of membership is the date of the first contribution made to the System. The System is
administered by a board of trustees which acts as a fiduciary for investing the funds and governing the
administration of the System. The District has no responsibility or authority for the operation and
administration of the System nor does it have any funding obligations, except for the current contribution
requirements.
Benefits provided: OTRS provides retirement, disability and death benefits to members of the plan.
Benefit provisions include:
Members become 100 percent vested in retirement benefits earned to date after five years of credited
Oklahoma service. Members who joined the System on June 30, 1992 or prior are eligible to retire at
maximum benefits when age and years of creditable service total 80. Members joining the System after
June 30, 1992 are eligible for maximum benefits when their age and years of creditable service total 90.
Members whose age and service do not equal the eligible limit may receive reduced benefits as early as
age 55, and at age 62 receive unreduced benefits based on their years of service. The maximum
retirement benefit is equal to 2 percent of final compensation for each year of credited service.
Union Public Schools – Notes to Financial Statements Year Ended June 30, 2015
66
NOTE H--EMPLOYEE RETIREMENT SYSTEM – Continued
Final compensation for members who joined the System prior to July 1, 1992 is defined as the average
salary for the three highest years of compensation. Final compensation for members joining the System
after June 30, 1992 is defined as the average of the highest five consecutive years of annual
compensation in which contributions have been made. The final average compensation is limited for
service credit accumulated prior to July 1, 1995 to $40,000 or $25,000, depending on the member’s
election. Monthly benefits are 1/12 of this amount. Service credits accumulated after June 30, 1995 are
calculated based on each member’s final average compensation, except for certain employees of the two
comprehensive universities. Upon the death of a member who has not yet retired, the designated
beneficiary shall receive the member’s total contributions plus 100 percent of interest earned through the
end of the fiscal year, with interest rates varying based on time of service. A surviving spouse of a
qualified member may elect to receive, in lieu of the aforementioned benefits, the retirement benefit the
member was entitled to at the time of death as provided under the Joint Survivor Benefit Option.
Upon the death of a retired member, the System will pay $5,000 to the designated beneficiary, in addition
to the benefits provided for the retirement option selected by the member.
A member is eligible for disability benefits after ten years of credited Oklahoma service. The disability
benefit is equal to 2 percent of final average compensation for the applicable years of credited service.
Upon separation from the System, members’ contributions are refundable with interest based on certain
restrictions provided in the plan, or by the IRC.
Members may elect to make additional contributions to a tax-sheltered annuity program up to the
exclusion allowance provided under the IRC under Code Section 403(b).
At the election of each eligible member initiating receipt of retirement benefits, the System remits
between $100 and $105 per month per eligible retiree to Blue Cross Blue Shield of Oklahoma, depending
on the members’ years of service during 2014.
Contributions: The contributions requirements of OTRS are at an established rate determined by
Oklahoma Statute, amended by the Oklahoma Legislature, and are not based on actuarial calculations.
Employees are required to contribute 7 percent of their annual compensation. The District’s contribution
rate is 9.5 percent of the employees’ annual pay and an additional 8.25 percent for any employees’
salaries covered by federal funds for the years ended June 30, 2015. The District’s contributions to
OTRS in 2015 were approximately $5,735,000, equal to the required contributions. In addition, the State
of Oklahoma also contributed 5 percent of State revenues from sales, use and individual income taxes to
OTRS. The amounts contributed on-behalf of the District and recognized in the District’s Statement of
Revenues, Expenses and Changes in Net Position as both revenues and compensation and a component
of pension expense in 2015 was approximately $4,178,000. These on-behalf payments did not meet the
criteria of a special funding situation.
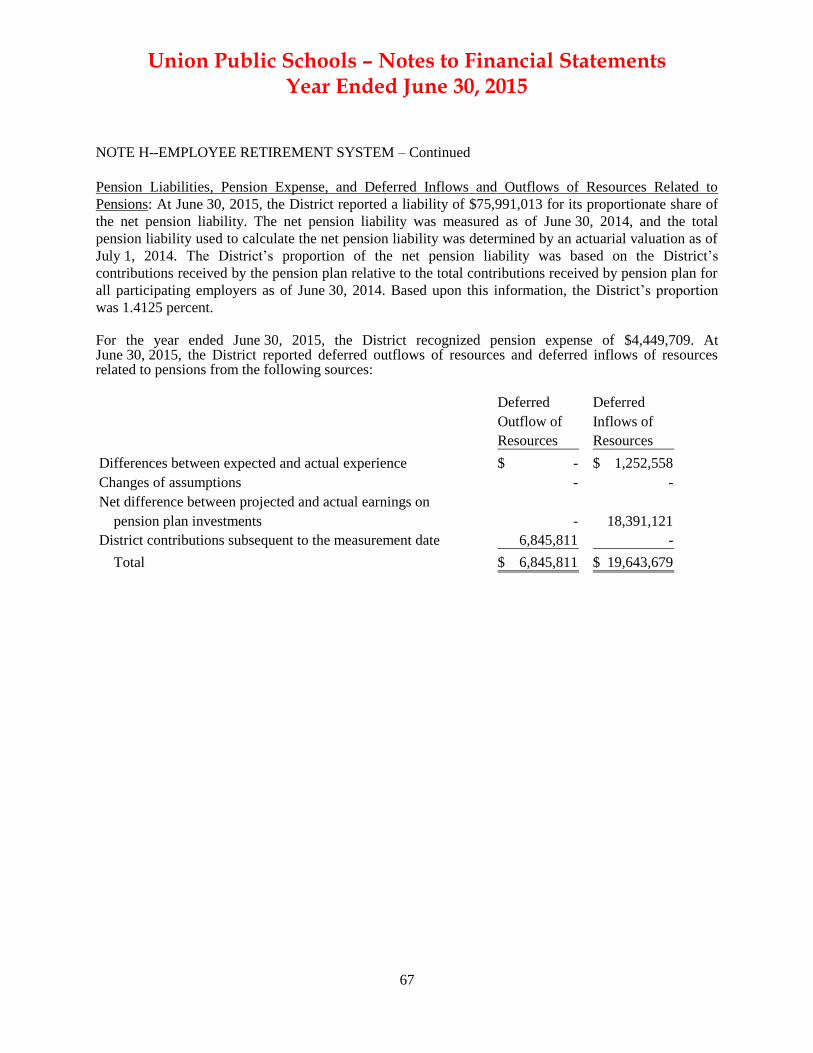
Union Public Schools – Notes to Financial Statements Year Ended June 30, 2015
67
NOTE H--EMPLOYEE RETIREMENT SYSTEM – Continued
Pension Liabilities, Pension Expense, and Deferred Inflows and Outflows of Resources Related to
Pensions: At June 30, 2015, the District reported a liability of $75,991,013 for its proportionate share of
the net pension liability. The net pension liability was measured as of June 30, 2014, and the total
pension liability used to calculate the net pension liability was determined by an actuarial valuation as of
July 1, 2014. The District’s proportion of the net pension liability was based on the District’s
contributions received by the pension plan relative to the total contributions received by pension plan for
all participating employers as of June 30, 2014. Based upon this information, the District’s proportion
was 1.4125 percent.
For the year ended June 30, 2015, the District recognized pension expense of $4,449,709. At June 30, 2015, the District reported deferred outflows of resources and deferred inflows of resources related to pensions from the following sources:
Deferred Deferred
Outflow of Inflows of
Resources Resources
Differences between expected and actual experience -$ 1,252,558$
Changes of assumptions - -
Net difference between projected and actual earnings on
pension plan investments - 18,391,121
District contributions subsequent to the measurement date 6,845,811 -
Total 6,845,811$ 19,643,679$
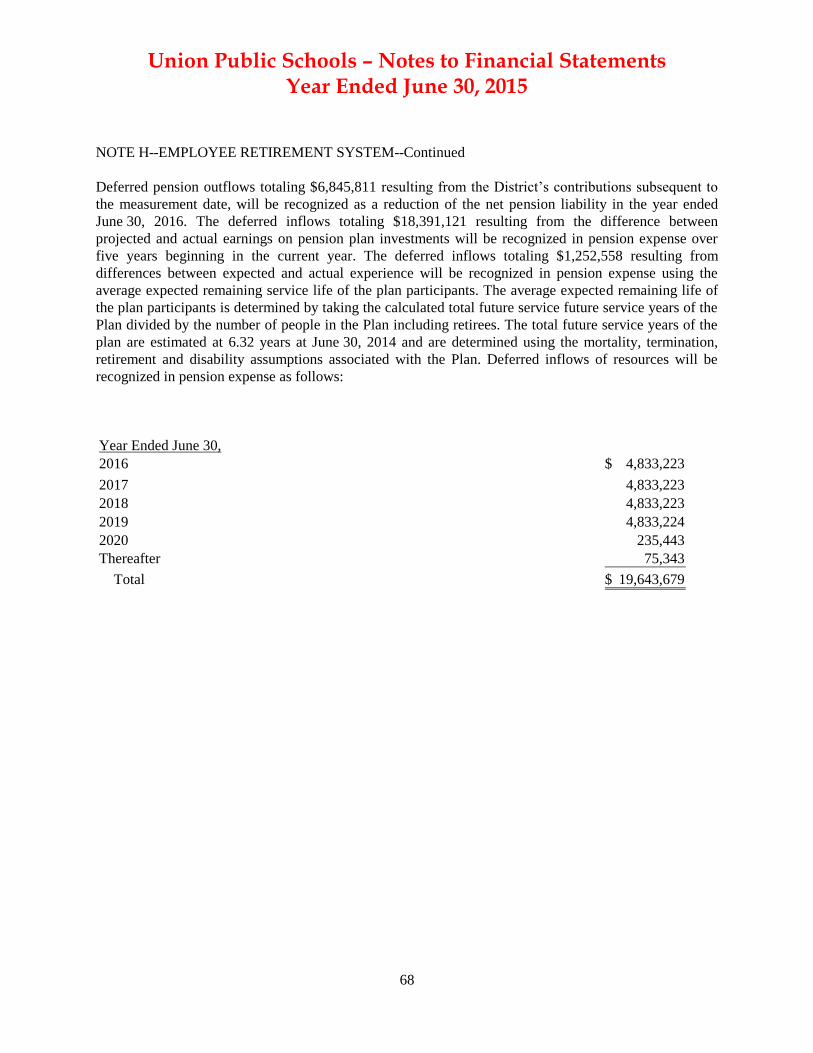
Union Public Schools – Notes to Financial Statements Year Ended June 30, 2015
68
NOTE H--EMPLOYEE RETIREMENT SYSTEM--Continued
Deferred pension outflows totaling $6,845,811 resulting from the District’s contributions subsequent to
the measurement date, will be recognized as a reduction of the net pension liability in the year ended
June 30, 2016. The deferred inflows totaling $18,391,121 resulting from the difference between
projected and actual earnings on pension plan investments will be recognized in pension expense over
five years beginning in the current year. The deferred inflows totaling $1,252,558 resulting from
differences between expected and actual experience will be recognized in pension expense using the
average expected remaining service life of the plan participants. The average expected remaining life of
the plan participants is determined by taking the calculated total future service future service years of the
Plan divided by the number of people in the Plan including retirees. The total future service years of the
plan are estimated at 6.32 years at June 30, 2014 and are determined using the mortality, termination,
retirement and disability assumptions associated with the Plan. Deferred inflows of resources will be
recognized in pension expense as follows:
Year Ended June 30,
2016 4,833,223$
2017 4,833,223
2018 4,833,223
2019 4,833,224
2020 235,443
Thereafter 75,343
Total 19,643,679$
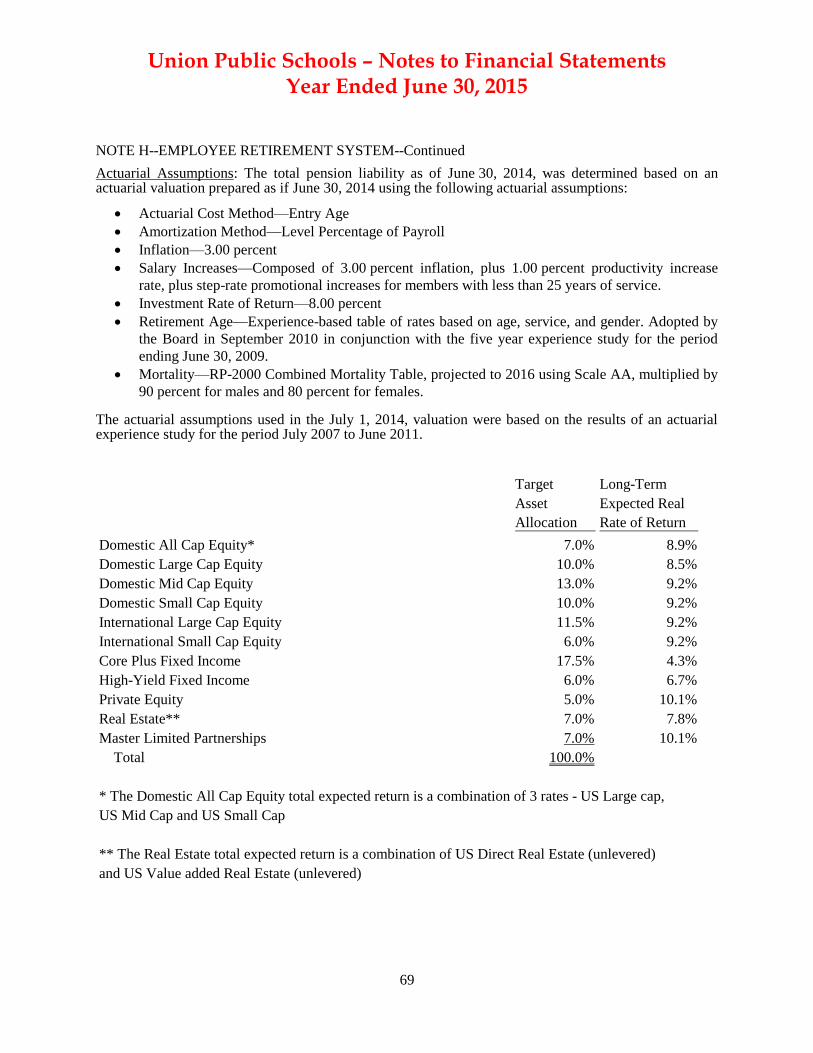
Union Public Schools – Notes to Financial Statements Year Ended June 30, 2015
69
NOTE H--EMPLOYEE RETIREMENT SYSTEM--Continued
Actuarial Assumptions: The total pension liability as of June 30, 2014, was determined based on an actuarial valuation prepared as if June 30, 2014 using the following actuarial assumptions:
Actuarial Cost Method—Entry Age
Amortization Method—Level Percentage of Payroll
Inflation—3.00 percent
Salary Increases—Composed of 3.00 percent inflation, plus 1.00 percent productivity increase
rate, plus step-rate promotional increases for members with less than 25 years of service.
Investment Rate of Return—8.00 percent
Retirement Age—Experience-based table of rates based on age, service, and gender. Adopted by
the Board in September 2010 in conjunction with the five year experience study for the period
ending June 30, 2009.
Mortality—RP-2000 Combined Mortality Table, projected to 2016 using Scale AA, multiplied by
90 percent for males and 80 percent for females.
The actuarial assumptions used in the July 1, 2014, valuation were based on the results of an actuarial experience study for the period July 2007 to June 2011.
Target Long-Term
Asset Expected Real
Allocation Rate of Return
Domestic All Cap Equity* 7.0% 8.9%
Domestic Large Cap Equity 10.0% 8.5%
Domestic Mid Cap Equity 13.0% 9.2%
Domestic Small Cap Equity 10.0% 9.2%
International Large Cap Equity 11.5% 9.2%
International Small Cap Equity 6.0% 9.2%
Core Plus Fixed Income 17.5% 4.3%
High-Yield Fixed Income 6.0% 6.7%
Private Equity 5.0% 10.1%
Real Estate** 7.0% 7.8%
Master Limited Partnerships 7.0% 10.1%
Total 100.0%
* The Domestic All Cap Equity total expected return is a combination of 3 rates - US Large cap,
US Mid Cap and US Small Cap
** The Real Estate total expected return is a combination of US Direct Real Estate (unlevered)
and US Value added Real Estate (unlevered)
Union Public Schools – Notes to Financial Statements Year Ended June 30, 2015
70
NOTE H--EMPLOYEE RETIREMENT SYSTEM--Continued Discount Rate: A single discount rate of 8.00 percent was used to measure the total pension liability as of June 30, 2013 and June 30, 2014. This single discount rate was based solely on the expected rate of return on pension plan investments of 8.00 percent. Based on the stated assumptions and the projection of cash flows, the pension plan’s fiduciary net position and future contributions were projected to be available to finance all projected future benefit payments of current plan members. Therefore, the long-term expected rate of return on pension plan investments was applied to all periods of projected benefit payments to determine the total pension liability. The projection of cash flows used to determine this single discount rate assumed that plan member and employer contributions will be made at the current statutory levels and remain a level percentage of payrolls. The projection of cash flows also assumed that the State’s contribution plus the matching contributions will remain a constant percent of projected member payroll based on the past five years of actual contributions.
Sensitivity of the Net Pension Liability to Changes in the Discount Rate: The following presents the net
pension liability of the employers calculated using the discount rate of 8 percent, as well as what the
Plan's net pension liability would be if it were calculated using a discount rate that is 1-percentage point
lower (7 percent) or 1-percentage-point higher (9 percent) than the current rate:
1% Decrease Current Discount 1% Increase
(7.00%) Rate (8.00%) (9.00%)
Net Pension Liability 107,497,017$ 75,991,013$ 50,369,683$
Pension plan fiduciary net position: Detailed information about the pension plan’s fiduciary net position is available in the separately issued financial report of the OTRS; which can be located at www.ok.gov/OTRS.
NOTE I--OTHER POST-EMPLOYMENT INSURANCE BENEFITS-HEALTH AND DENTAL
INSURANCE PROGRAM
District employees have the option under a single-employer plan of continuing health, vision and dental
coverage at their own expense upon retirement under the Oklahoma Teachers Retirement System if they
are covered by an employment contract that provides for post-retirement benefits and who meet one of
the following requirements:
Age 55 or older with 5 years of service
Rule of 80 if hired before July 1, 1992 (combined age and service years)
Rule of 90 if hired after July 1, 1992 (combined age and service years)
10 years of service and terminating employment
Retired employees may pay the same premium as the District pays for current employees.
Funding Policy - Contribution requirements of the District are established and may be amended by the
Board of Education. All contributions are made by the retirees. Benefits are funded under a “pay as you
go” funding method; however expenses are recorded as benefits accumulate.
Union Public Schools – Notes to Financial Statements Year Ended June 30, 2015
71
NOTE I--OTHER POST-EMPLOYMENT INSURANCE BENEFITS-HEALTH AND DENTAL
INSURANCE PROGRAM--Continued
Annual OPEB cost and net OPEB obligation - The District’s annual OPEB cost is calculated based on
the annual required contribution of the District (“ARC”), an amount actuarially determined in accordance
with GAAP. The ARC represents a level of funding that, if paid on an ongoing basis, is projected to
cover normal cost each year and amortize any unfunded actuarial liabilities over a period not to exceed
thirty (30) years.
The following table shows the components of the District’s net OPEB obligation for the year, the amount
actually contributed, and changes in the District’s net OPEB obligation:
Year Ended
June 30, 2015
Annual required contribution 1,003,001$
Interest on net OPEB obligation 191,219
Adjustment to annual required contribution (276,456)
Annual OPEB cost (expense) 917,764
Contributions made (499,343)
Increase in net OPEB obligation 418,421
Net OPEB obligation at beginning of year 4,780,485
Net OPEB obligation at end of year 5,198,906$
The net OPEB obligation at June 30, 2015 is included in the government-wide statement of net position
as a non-current obligation. The OPEB plan does not issue a stand-alone financial report.
This obligation is currently unfunded. The annual required contribution for 2015 was determined as part
of an actuarial valuation on July 1, 2013, using the projected unit credit actuarial cost method with 30
year amortization of the unfunded liability. The liability is amortized as a level dollar amount over 30
years on an open basis.
The actuarial assumptions included:
(a) discount rate of 4% per year compounded annually,
(b) inflation rate of 3%
(c) salary increases of 4% per year
(d) age-based monthly retiree medical costs
(e) varying participation rates for active and inactive employees, with adjustments made for
persons who terminate prior to retirement.
(f) health trend rates increasing 5%-10% annually
Union Public Schools – Notes to Financial Statements Year Ended June 30, 2015
72
NOTE I--OTHER POST-EMPLOYMENT INSURANCE BENEFITS-HEALTH AND DENTAL
INSURANCE PROGRAM--Continued
Trend Information
Annual OPEB Costs are summarized as follows:
Year Ended Net OPEB % of APC Net OPEB
June 30 Cost Contributed Obligation
2013 872,243$ 61.06% 4,290,013$
2014 902,542$ 45.70% 4,780,485$
2015 917,764$ 54.40% 5,198,906$
Funded Status and Funding Progress
The funded status of the plan as of the most recent actuarial report dated July 1, 2013 is as follows:
Actuarial value of plan assets -
Unfunded actuarial accrued liability (UAAL) 8,091,284$
Funded ratio (actuarial value of plan assets/AAL) 0.0%
Covered payroll (active plan members) 53,210,314$
UAAL as a percentage of covered payroll 15.20%
Actuarial valuation of an ongoing plan involves estimates of the value of reported amounts and
assumptions about the probability of occurrence of events far into the future. Examples include
assumptions about future employment, mortality, and the healthcare cost trend. Amounts determined
regarding the funded status of the plan and the annual required contributions of the employer are subject
to continual revision as actual results are compared with past expectations and new estimates are made
about the future. The schedule of funding progress, presented as required supplementary information
following the notes to the financial statements, will over time provide multi-year trend information that
shows whether the actuarial value of plan assets is increasing or decreasing over time relative to the
actuarial accrued liabilities for benefits.
NOTE J--COMMITMENTS AND CONTINGENCIES
Amounts received or receivable from grantor agencies are subject to audit and adjustment by grantor
agencies. Any disallowed claims, including amounts already collected, may constitute a liability of the
applicable funds. The amount, if any, of expenditures which may be disallowed by the grantor cannot be
determined at this time although the District believes such amounts, if any, would be immaterial.
As of June 30, 2015, the District had outstanding commitments (contracts and purchase orders) of
approximately $20,385,000, primarily for construction projects and equipment.
Union Public Schools – Notes to Financial Statements Year Ended June 30, 2015
73
NOTE J--COMMITMENTS AND CONTINGENCIES
On occasion, the District is party to legal proceedings which arise in the normal course of operations.
Any liability resulting from these proceedings is not believed, by management, to have a material effect
on the financial statements.
NOTE K--NEW PRONOUNCEMENTS
New Accounting Pronouncements Adopted in Fiscal Year 2015: The District adopted the following new
accounting pronouncements during the year ended June 30, 2015:
GASB Statement No. 68, Accounting and Financial Reporting for Pensions, an Amendment of GASB
Statement No. 27 (GASB No. 68) establishes standards for measuring and recognizing liabilities,
deferred outflows of resources, deferred inflows of resources, and pension expenses. GASB No. 68
also details the recognition and disclosure requirements for employers with liabilities to a defined
benefit pension plan and for employers whose employees are provided with defined contribution
pensions. Defined benefit pensions are further classified by GASB No. 68 as single employer plans,
agent employer plans, and cost-sharing plans, and recognition and disclosure requirements are
addressed for each classification. GASB No. 68 was issued in June 2012. The District recorded the
cumulative effect of adopting GASB Statements No. 68 and 71, totaling $92,411,094 for
governmental activities and $2,256,450 for business type activities, as an adjustment of net position
as of July 1, 2014.
GASB Statement No. 71, Pension transition for Contributions Made Subsequent to the Measurement
Date – an amendment of GASB Statement No. 68 (GASB No. 71) amends paragraph 137 of Statement
68 to require that, at transition, a government recognize a beginning deferred outflow of resources for its
pension contributions, if any, made subsequent to the measurement date of the beginning net pension
liability. Statement 68, as amended, continues to require that beginning balances for other deferred
outflows of resources and deferred inflows of resources related to pensions be reported at transition
only if it is practical to determine all such amounts. The provisions of this Statement are required to be
applied simultaneously with the provisions of Statement 68. The adoption of GASB No. 71 resulted in
the recording of a deferred outflow of $6,845,811 for governmental activiites and $108,248 for
business type activities for contributions made after the measurement date of June 30, 2014.
Union Public Schools – Notes to Financial Statements Year Ended June 30, 2015
74
NOTE K--NEW PRONOUNCEMENTS-Continued
New Accounting Pronouncements Issued Not Yet Adopted: The GASB has issued several new accounting
pronouncements which will be effective to District in fiscal years ended June 30, 2016, 2017 and 2018. A
description of the new accounting pronouncements are described below:
GASB Statement No. 72, Fair Value Measurement and Application (GASB No. 72) addresses
accounting and financial reporting issues related to fair value measurements. The definition of fair
value is the price that would be received to sell an asset or paid to transfer a liability in an orderly
transaction between market participants at the measurement date. This Statement provides guidance
for determining a fair value measurement for financial reporting purposes. This Statement also
provides guidance for applying fair value to certain investments and disclosures related to all fair
value measurements. The requirements of this Statement are effective for financial statements for
periods beginning after June 15, 2015. Earlier application is encouraged.
GASB Statement No. 73, Accounting and Financial Reporting for Pensions and Related Assets That
Are Not Within the Scope of GASB Statement 68, and Amendments to Certain Provisions of GASB
Statements 67 and 68 (GASB No. 73) was issued June 2015 and will be effective for the District
beginning with its fiscal year ending June 30, 2016—except those provisions that address employers
and governmental nonemployer contributing entities for pensions that are not within the scope of
Statement No. 68, which are effective for the District beginning with its fiscal year ending June 30,
2017. The Statement establishes requirements for pensions not covered by Statement Nos. 67 and 68
which are essentially the same requirements as Statement No. 68. However, the lack of a pension
plan that is administered through a trust that meets specified criteria is reflected in the measurements.
GASB Statement No. 74, Financial Reporting for Postemployment Benefit Plans Other Than
Pension Plans (GASB No. 74) was issued in June 2015 will be effective for the District beginning
with its fiscal year ending June 30, 2017. The Statement replaces GASB Statement No. 43, Financial
Reporting for Postemployment Benefit Plans Other Than Pension Plans, and addresses the financial
reports of defined benefit OPEB plans that are administered through trusts that meet specified
criteria. The Statement follows the framework for financial reporting of defined benefit OPEB plans
in Statement No. 45 by requiring a statement of fiduciary net position and a statement of changes in
fiduciary net position but requires more extensive note disclosures and Required Supplementary
Information related to the measurement of the OPEB liabilities for which assets have been
accumulated, including information about the annual money-weighted rates of return on plan
investments. The Statement also sets forth note disclosure requirements for defined contribution
OPEB plans.
Union Public Schools – Notes to Financial Statements Year Ended June 30, 2015
75
NOTE K--NEW PRONOUNCEMENTS-Continued
GASB Statement No. 75, Accounting and Financial Reporting for Postemployment Benefits
Other Than Pensions (GASB No. 75) was issued in June 2015 and will be effective for the
District beginning with its fiscal year ending June 30, 2018. The Statement replaces the
requirements of GASB Statement No. 45, Accounting and Financial Reporting by Employers for
Postemployment Benefits Other Than Pensions and requires governments to report a liability on
the face of the financial statements for the OPEB they provide and outlines the reporting
requirements by governments for defined benefit OPEB plans administered through a trust, cost-
sharing OPEB plans administered through a trust and OPEB not provided through a trust. The
Statement also requires governments to present more extensive note disclosures and required
supplementary information about their OPEB liabilities. Some governments are legally
responsible to make contributions directly to an OPEB plan or make benefit payments directly as
OPEB comes due for employees of other governments. In certain circumstances, called special
funding situations, the Statement requires these governments to recognize in their financial
statements a share of the other government’s net OPEB liability.
GASB Statement No. 76, The Hierarchy of Generally Accepted Accounting Principles for State
and Local Governments (GASB No. 76): The objective of GASB No. 76 is to identify—in the
context of the current governmental financial reporting environment—the hierarchy of generally
accepted accounting principles (GAAP). The “GAAP hierarchy” consists of the sources of
accounting principles used to prepare financial statements of state and local governmental
entities in conformity with GAAP and the framework for selecting those principles. This
Statement reduces the GAAP hierarchy to two categories of authoritative GAAP and addresses
the use of authoritative and nonauthoritative literature in the event that the accounting treatment
for a transaction or other event is not specified within a source of authoritative GAAP. This
Statement supersedes Statement No. 55, The Hierarchy of Generally Accepted Accounting
Principles for State and Local Governments. The requirements of this Statement are effective for
financial statements for periods beginning after June 15, 2015, and should be applied
retroactively. Earlier application is permitted.
GASB Statement No. 77, Tax Abatement Disclosures (GASB No. 77) requires governments that
enter into tax abatement agreements to disclose the following information about the agreements:
brief descriptive information, such as the tax being abated, the authority under which tax
abatements are provided, eligibility criteria, the mechanism by which taxes are abated, provisions
for recapturing abated taxes, and the types of commitments made by tax abatement recipients; the
gross dollar amount of taxes abated during the period; and commitments made by a government,
other than to abate taxes, as part of a tax abatement agreement. Governments may disclose
information for individual tax abatement agreements of other governments within the specific tax
being abated. For those tax abatement agreements, a reporting government should disclose: The
names of the governments that entered into the agreements: the specific taxes being abated; and
the gross dollar amount of taxes abated during the period. The requirements of this Statement are
effective for financial statements for periods beginning after December 15, 2015. Earlier
application is encouraged.
The District is currently evaluating the impact that these new standards may have on its financial
statements.

76
This page is intentionally left blank.
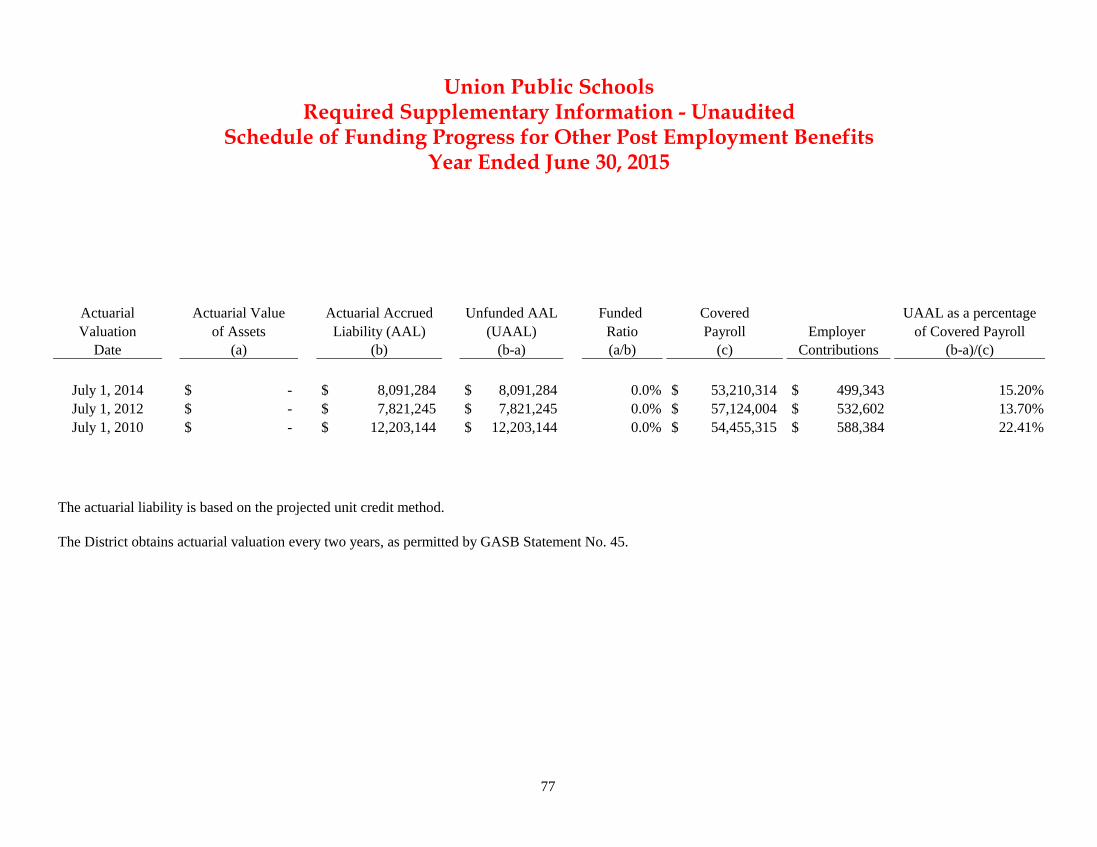
Actuarial Actuarial Value Actuarial Accrued Unfunded AAL Funded Covered UAAL as a percentage
Valuation of Assets Liability (AAL) (UAAL) Ratio Payroll Employer of Covered Payroll
Date (a) (b) (b-a) (a/b) (c) Contributions (b-a)/(c)
July 1, 2014 -$ 8,091,284$ 8,091,284$ 0.0% 53,210,314$ 499,343$ 15.20%
July 1, 2012 -$ 7,821,245$ 7,821,245$ 0.0% 57,124,004$ 532,602$ 13.70%
July 1, 2010 -$ 12,203,144$ 12,203,144$ 0.0% 54,455,315$ 588,384$ 22.41%
The actuarial liability is based on the projected unit credit method.
The District obtains actuarial valuation every two years, as permitted by GASB Statement No. 45.
Union Public SchoolsRequired Supplementary Information - Unaudited
Year Ended June 30, 2015Schedule of Funding Progress for Other Post Employment Benefits
77
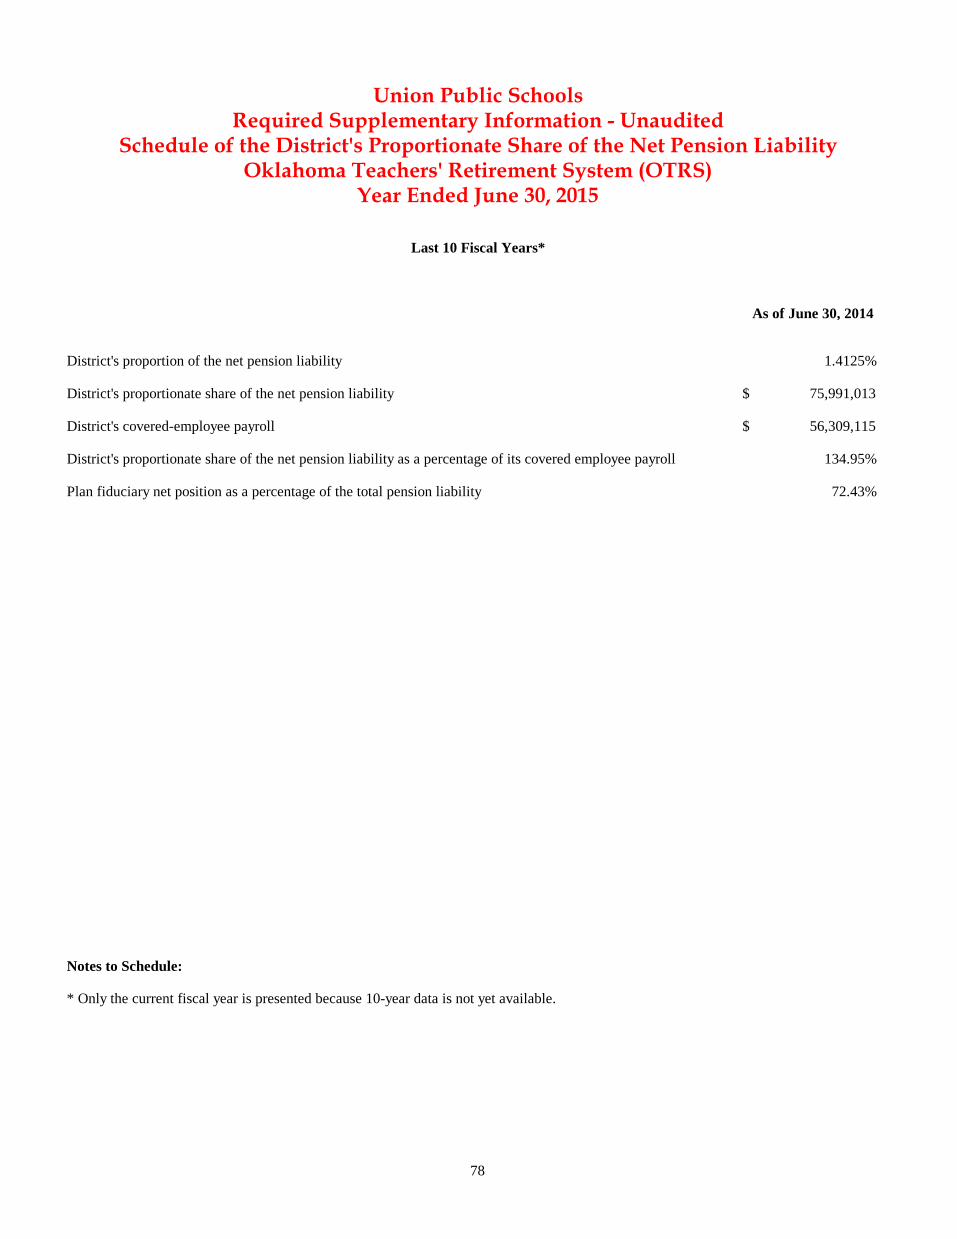
78
As of June 30, 2014
District's proportion of the net pension liability 1.4125%
District's proportionate share of the net pension liability 75,991,013 $
District's covered-employee payroll 56,309,115 $
District's proportionate share of the net pension liability as a percentage of its covered employee payroll 134.95%
Plan fiduciary net position as a percentage of the total pension liability 72.43%
Notes to Schedule:
* Only the current fiscal year is presented because 10-year data is not yet available.
Year Ended June 30, 2015
Last 10 Fiscal Years*
Schedule of the District's Proportionate Share of the Net Pension Liability
Union Public SchoolsRequired Supplementary Information - Unaudited
Oklahoma Teachers' Retirement System (OTRS)
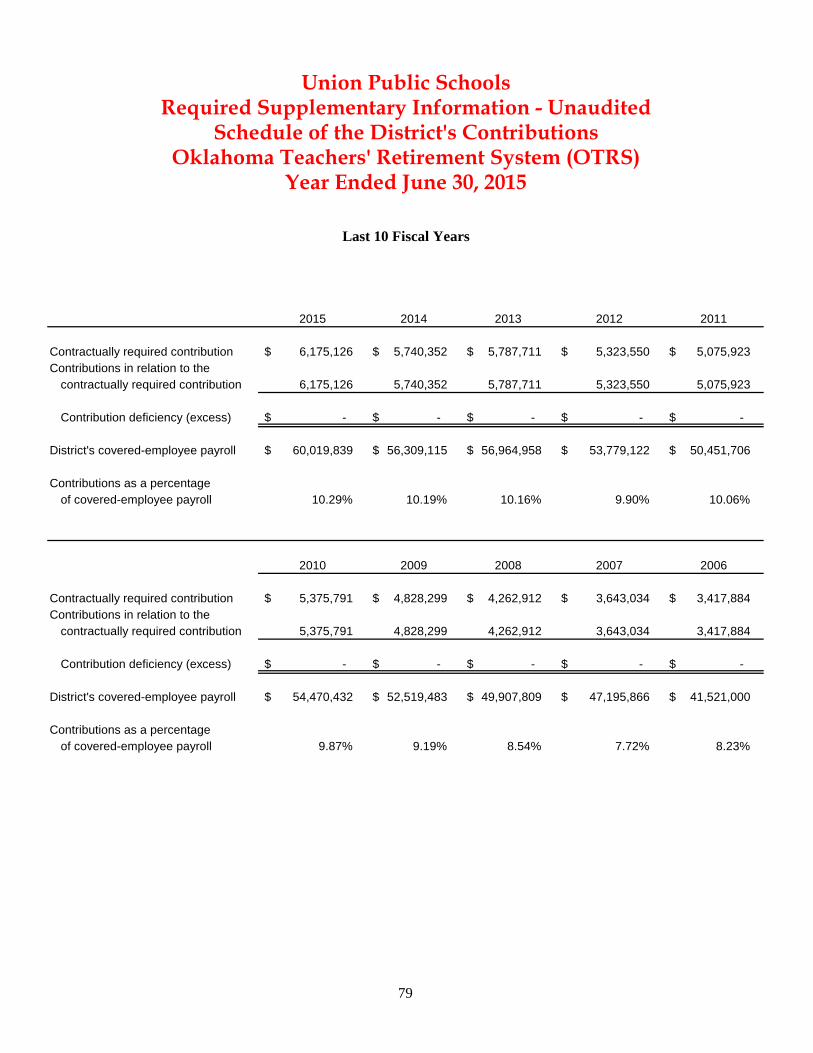
79
2015 2014 2013 2012 2011
Contractually required contribution 6,175,126 $ 5,740,352 $ 5,787,711 $ 5,323,550 $ 5,075,923 $ Contributions in relation to the
contractually required contribution 6,175,126 5,740,352 5,787,711 5,323,550 5,075,923
Contribution deficiency (excess) -$ -$ -$ -$ -$
District's covered-employee payroll 60,019,839 $ 56,309,115 $ 56,964,958 $ 53,779,122 $ 50,451,706 $
Contributions as a percentageof covered-employee payroll 10.29% 10.19% 10.16% 9.90% 10.06%
2010 2009 2008 2007 2006
Contractually required contribution 5,375,791 $ 4,828,299 $ 4,262,912 $ 3,643,034 $ 3,417,884 $ Contributions in relation to the
contractually required contribution 5,375,791 4,828,299 4,262,912 3,643,034 3,417,884
Contribution deficiency (excess) -$ -$ -$ -$ -$
District's covered-employee payroll 54,470,432 $ 52,519,483 $ 49,907,809 $ 47,195,866 $ 41,521,000 $
Contributions as a percentageof covered-employee payroll 9.87% 9.19% 8.54% 7.72% 8.23%
Union Public SchoolsRequired Supplementary Information - Unaudited
Schedule of the District's ContributionsOklahoma Teachers' Retirement System (OTRS)
Year Ended June 30, 2015
Last 10 Fiscal Years
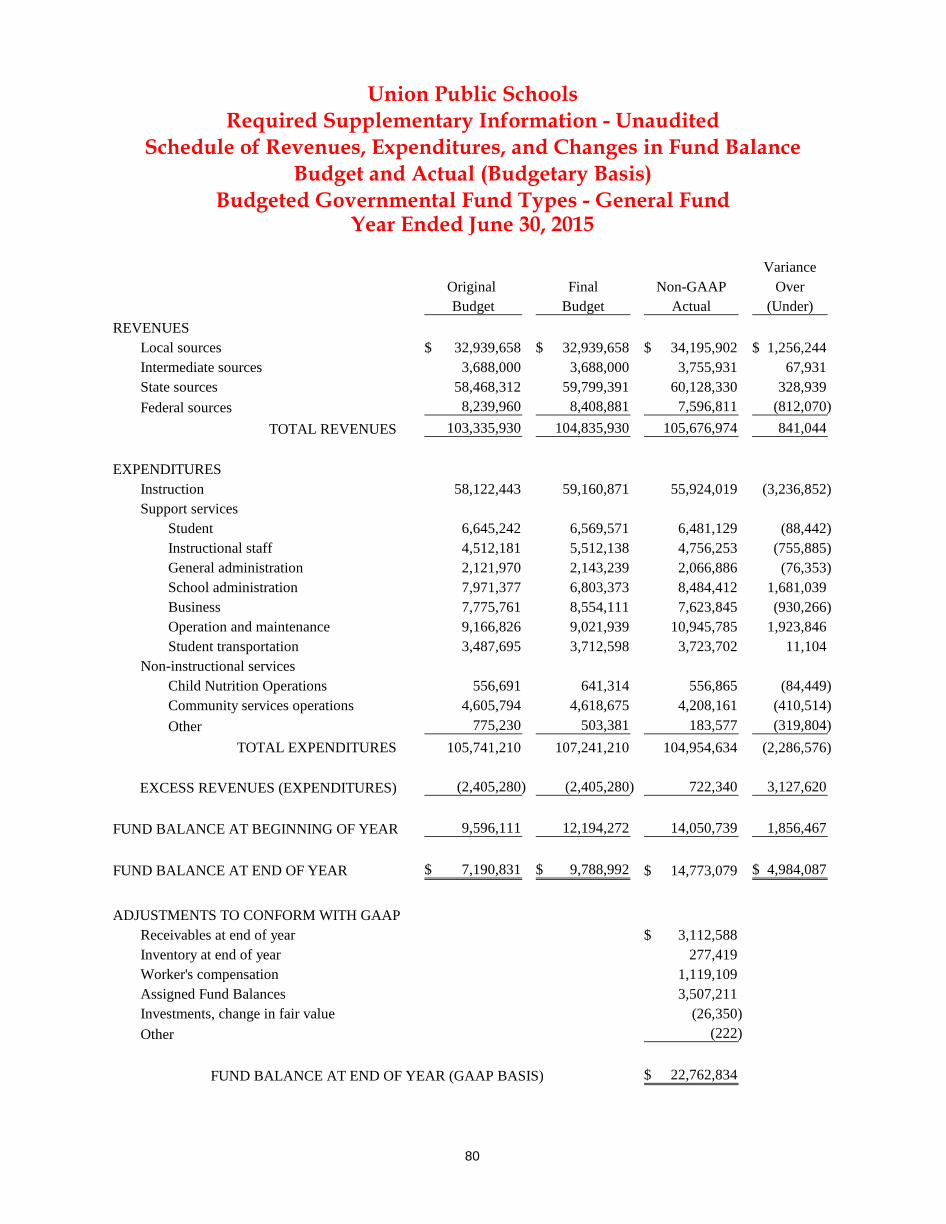
80
VarianceOriginal Final Non-GAAP OverBudget Budget Actual (Under)
REVENUESLocal sources 32,939,658$ 32,939,658$ 34,195,902$ 1,256,244$ Intermediate sources 3,688,000 3,688,000 3,755,931 67,931 State sources 58,468,312 59,799,391 60,128,330 328,939 Federal sources 8,239,960 8,408,881 7,596,811 (812,070)
TOTAL REVENUES 103,335,930 104,835,930 105,676,974 841,044
EXPENDITURESInstruction 58,122,443 59,160,871 55,924,019 (3,236,852) Support services
Student 6,645,242 6,569,571 6,481,129 (88,442) Instructional staff 4,512,181 5,512,138 4,756,253 (755,885) General administration 2,121,970 2,143,239 2,066,886 (76,353) School administration 7,971,377 6,803,373 8,484,412 1,681,039 Business 7,775,761 8,554,111 7,623,845 (930,266) Operation and maintenance 9,166,826 9,021,939 10,945,785 1,923,846 Student transportation 3,487,695 3,712,598 3,723,702 11,104
Non-instructional servicesChild Nutrition Operations 556,691 641,314 556,865 (84,449) Community services operations 4,605,794 4,618,675 4,208,161 (410,514) Other 775,230 503,381 183,577 (319,804)
TOTAL EXPENDITURES 105,741,210 107,241,210 104,954,634 (2,286,576)
EXCESS REVENUES (EXPENDITURES) (2,405,280) (2,405,280) 722,340 3,127,620
FUND BALANCE AT BEGINNING OF YEAR 9,596,111 12,194,272 14,050,739 1,856,467
FUND BALANCE AT END OF YEAR 7,190,831$ 9,788,992$ 14,773,079$ 4,984,087$
ADJUSTMENTS TO CONFORM WITH GAAPReceivables at end of year 3,112,588$ Inventory at end of year 277,419 Worker's compensation 1,119,109 Assigned Fund Balances 3,507,211 Investments, change in fair value (26,350) Other (222)
FUND BALANCE AT END OF YEAR (GAAP BASIS) 22,762,834$
Year Ended June 30, 2015
Union Public Schools
Budget and Actual (Budgetary Basis)Budgeted Governmental Fund Types - General Fund
Schedule of Revenues, Expenditures, and Changes in Fund BalanceRequired Supplementary Information - Unaudited
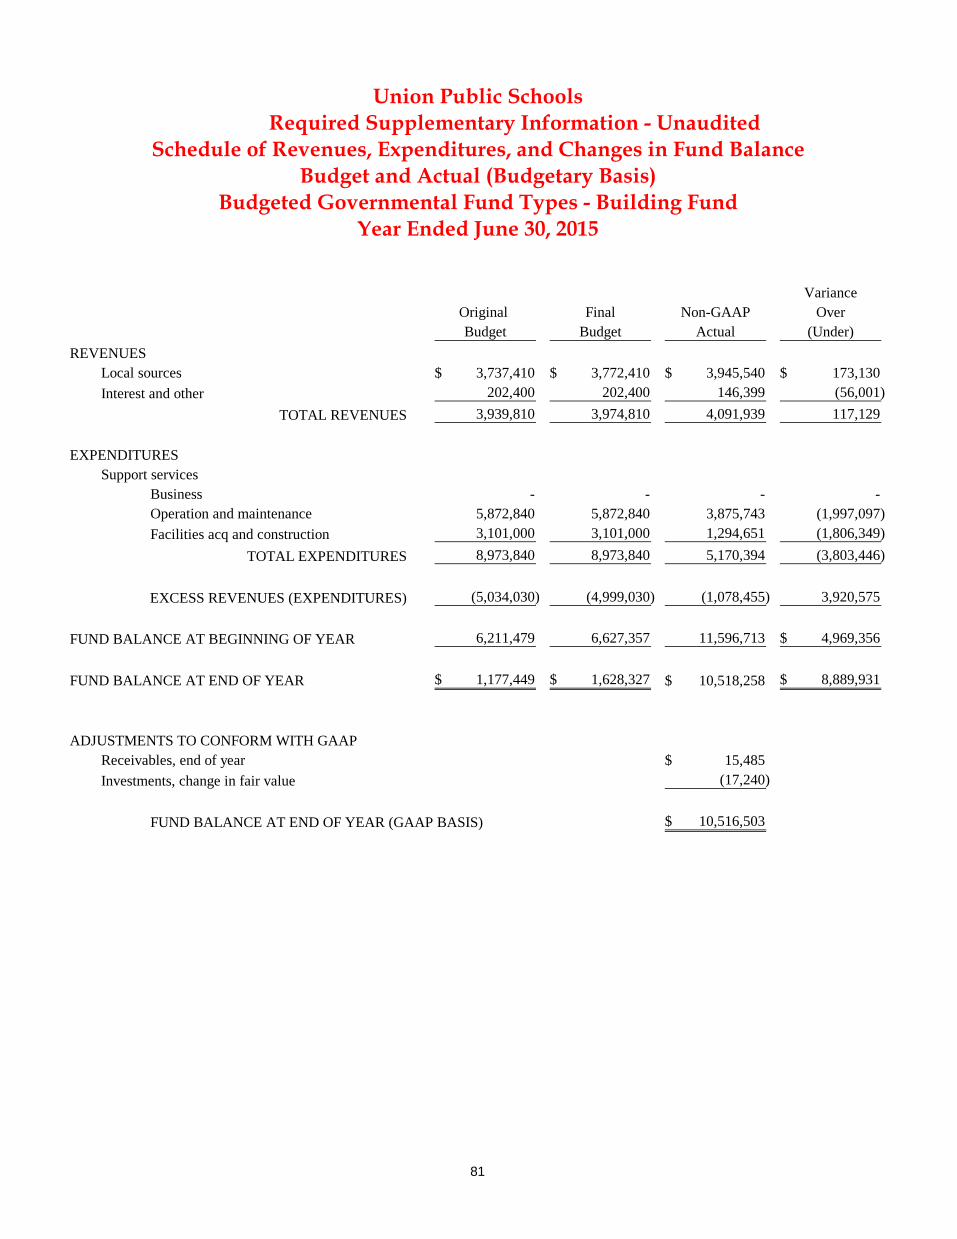
81
VarianceOriginal Final Non-GAAP OverBudget Budget Actual (Under)
REVENUESLocal sources 3,737,410$ 3,772,410$ 3,945,540$ 173,130$ Interest and other 202,400 202,400 146,399 (56,001)
TOTAL REVENUES 3,939,810 3,974,810 4,091,939 117,129
EXPENDITURESSupport services
Business - - - - Operation and maintenance 5,872,840 5,872,840 3,875,743 (1,997,097) Facilities acq and construction 3,101,000 3,101,000 1,294,651 (1,806,349)
TOTAL EXPENDITURES 8,973,840 8,973,840 5,170,394 (3,803,446)
EXCESS REVENUES (EXPENDITURES) (5,034,030) (4,999,030) (1,078,455) 3,920,575
FUND BALANCE AT BEGINNING OF YEAR 6,211,479 6,627,357 11,596,713 4,969,356$
FUND BALANCE AT END OF YEAR 1,177,449$ 1,628,327$ 10,518,258$ 8,889,931$
ADJUSTMENTS TO CONFORM WITH GAAPReceivables, end of year 15,485$ Investments, change in fair value (17,240)
FUND BALANCE AT END OF YEAR (GAAP BASIS) 10,516,503$
Year Ended June 30, 2015
Union Public Schools
Schedule of Revenues, Expenditures, and Changes in Fund BalanceBudget and Actual (Budgetary Basis)
Budgeted Governmental Fund Types - Building Fund
Required Supplementary Information - Unaudited

This page is intentionally left blank.
82
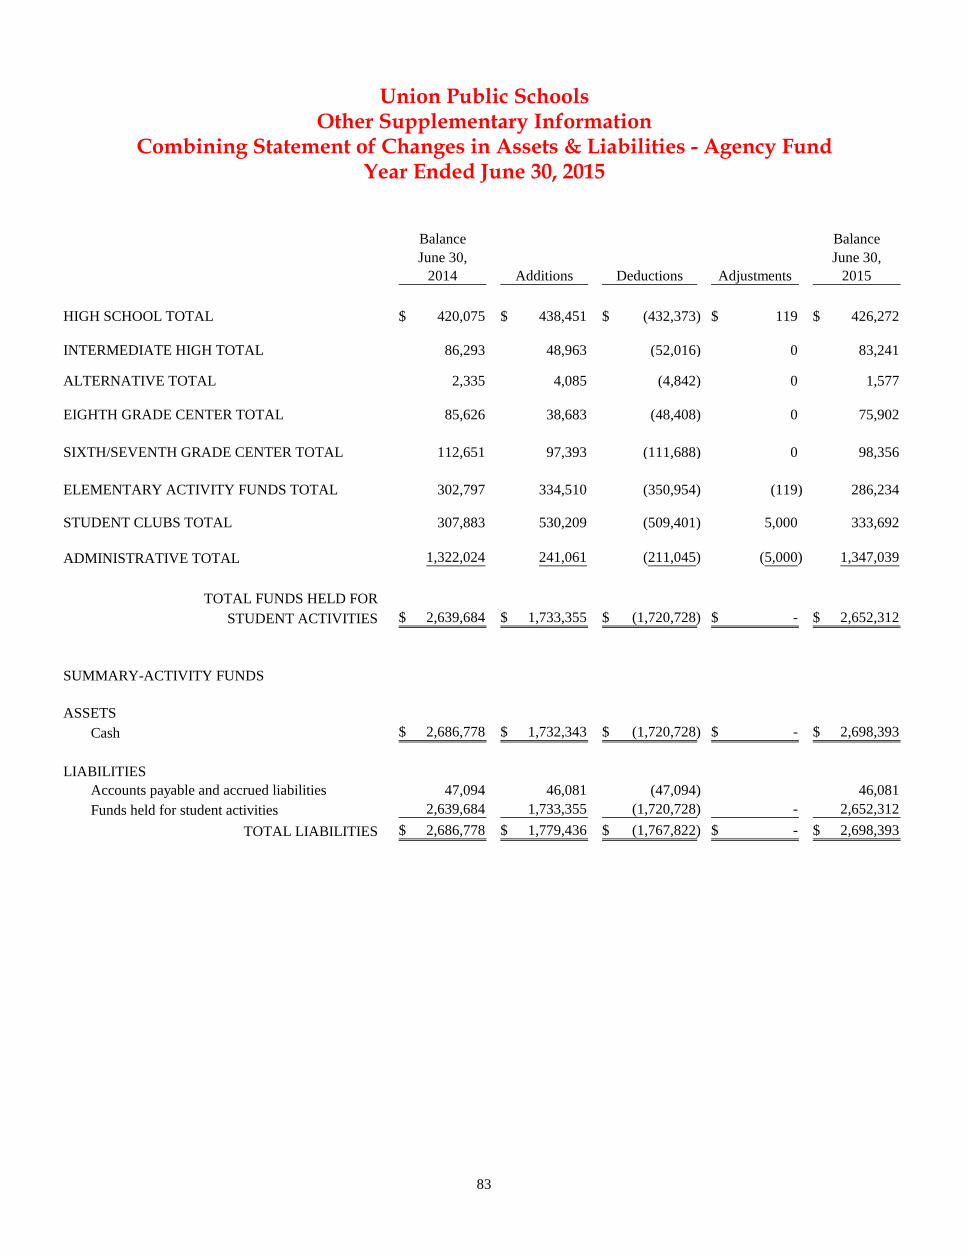
Balance Balance
June 30, June 30,
2014 Additions Deductions Adjustments 2015
HIGH SCHOOL TOTAL 420,075$ 438,451$ (432,373)$ 119$ 426,272$
INTERMEDIATE HIGH TOTAL 86,293 48,963 (52,016) 0 83,241
ALTERNATIVE TOTAL 2,335 4,085 (4,842) 0 1,577
EIGHTH GRADE CENTER TOTAL 85,626 38,683 (48,408) 0 75,902
SIXTH/SEVENTH GRADE CENTER TOTAL 112,651 97,393 (111,688) 0 98,356
ELEMENTARY ACTIVITY FUNDS TOTAL 302,797 334,510 (350,954) (119) 286,234
STUDENT CLUBS TOTAL 307,883 530,209 (509,401) 5,000 333,692
ADMINISTRATIVE TOTAL 1,322,024 241,061 (211,045) (5,000) 1,347,039
TOTAL FUNDS HELD FOR
STUDENT ACTIVITIES 2,639,684$ 1,733,355$ (1,720,728)$ -$ 2,652,312$
SUMMARY-ACTIVITY FUNDS
ASSETS
Cash 2,686,778$ 1,732,343$ (1,720,728)$ -$ 2,698,393$
LIABILITIES
Accounts payable and accrued liabilities 47,094 46,081 (47,094) 46,081
Funds held for student activities 2,639,684 1,733,355 (1,720,728) - 2,652,312
TOTAL LIABILITIES 2,686,778$ 1,779,436$ (1,767,822)$ -$ 2,698,393$
Union Public Schools
Combining Statement of Changes in Assets & Liabilities - Agency FundYear Ended June 30, 2015
Other Supplementary Information
83

This page is intentionally left blank.
84
85
Contents Page
Financial Trends ………………………………………………………………………………………… 87-91
These schedules contain trend information to help the reader understand how theDistrict's financial performance and well-being have changed over time.
Revenue Capacity ………………………………………………………………………………………… 93-96
These schedules contain information to help the reader assess the District's mostsignificant local revenue source, the property tax.
Debt Capacity ………………………………………………………………………………………… 97-100
These schedules present information to help the reader assess the affordability of theDistrict's current levels of outstanding debt and the District's ability toissue additionalthe District's ability to issue additional debt in the future.
Demographic and Economic Information ……………………………………………………… 101-103
These schedules offer demographic and economic indicators to help the reader understandthe environment within which the District's financial activities take place.
Operating Information ……………………………………………………………………………… 105-112
These schedules contain service and other data to help the reader understand how theinformation in the District's financial report relates to the services the District provides andthe activities it performs.
Sources: Unless otherwise noted, the information in these schedules is derived from the comprehensiveannual financial reports (CAFR) for the relevant year.
Union Public Schools - Statistical SectionYear Ended June 30, 2015
Table of Contents
86
This page is intentionally left blank.
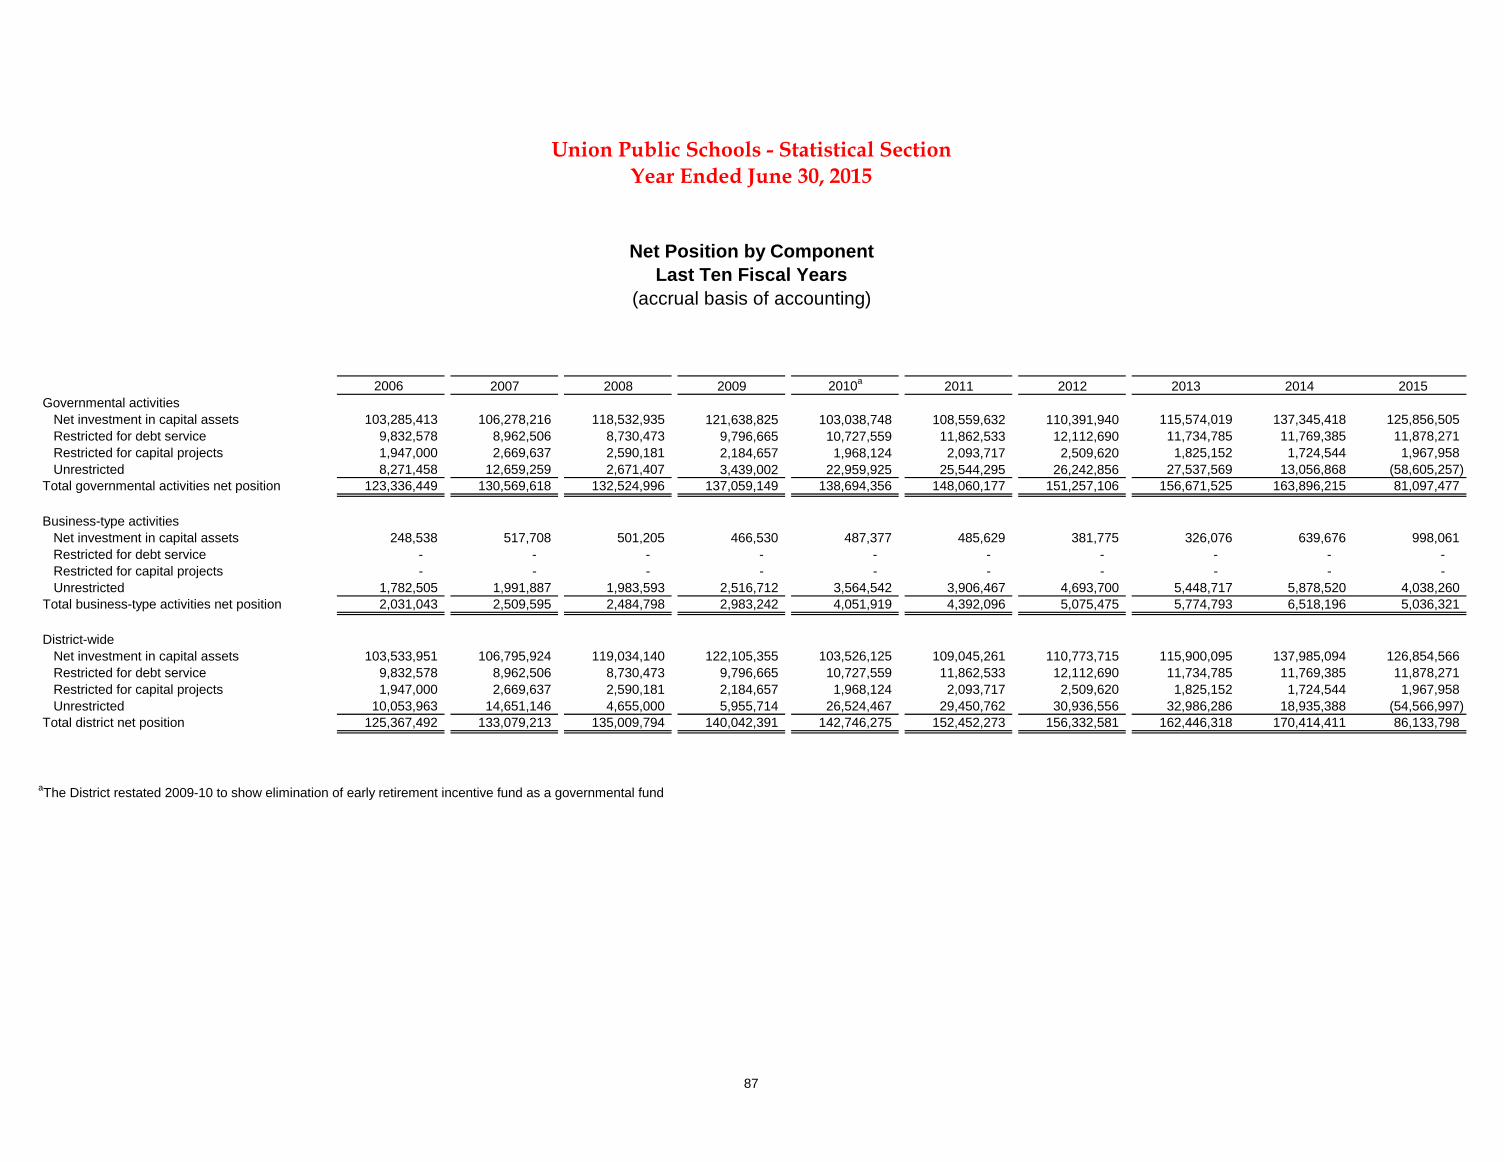
87
2006a 2007 2008 2009 2010a 2011 2012 2013 2014 2015Governmental activities Net investment in capital assets 103,285,413 106,278,216 118,532,935 121,638,825 103,038,748 108,559,632 110,391,940 115,574,019 137,345,418 125,856,505 Restricted for debt service 9,832,578 8,962,506 8,730,473 9,796,665 10,727,559 11,862,533 12,112,690 11,734,785 11,769,385 11,878,271 Restricted for capital projects 1,947,000 2,669,637 2,590,181 2,184,657 1,968,124 2,093,717 2,509,620 1,825,152 1,724,544 1,967,958 Unrestricted 8,271,458 12,659,259 2,671,407 3,439,002 22,959,925 25,544,295 26,242,856 27,537,569 13,056,868 (58,605,257) Total governmental activities net position 123,336,449 130,569,618 132,524,996 137,059,149 138,694,356 148,060,177 151,257,106 156,671,525 163,896,215 81,097,477
Business-type activities Net investment in capital assets 248,538 517,708 501,205 466,530 487,377 485,629 381,775 326,076 639,676 998,061 Restricted for debt service - - - - - - - - - - Restricted for capital projects - - - - - - - - - - Unrestricted 1,782,505 1,991,887 1,983,593 2,516,712 3,564,542 3,906,467 4,693,700 5,448,717 5,878,520 4,038,260 Total business-type activities net position 2,031,043 2,509,595 2,484,798 2,983,242 4,051,919 4,392,096 5,075,475 5,774,793 6,518,196 5,036,321
District-wide Net investment in capital assets 103,533,951 106,795,924 119,034,140 122,105,355 103,526,125 109,045,261 110,773,715 115,900,095 137,985,094 126,854,566 Restricted for debt service 9,832,578 8,962,506 8,730,473 9,796,665 10,727,559 11,862,533 12,112,690 11,734,785 11,769,385 11,878,271 Restricted for capital projects 1,947,000 2,669,637 2,590,181 2,184,657 1,968,124 2,093,717 2,509,620 1,825,152 1,724,544 1,967,958 Unrestricted 10,053,963 14,651,146 4,655,000 5,955,714 26,524,467 29,450,762 30,936,556 32,986,286 18,935,388 (54,566,997) Total district net position 125,367,492 133,079,213 135,009,794 140,042,391 142,746,275 152,452,273 156,332,581 162,446,318 170,414,411 86,133,798
aThe District restated 2009-10 to show elimination of early retirement incentive fund as a governmental fund
Union Public Schools - Statistical Section
(accrual basis of accounting)Last Ten Fiscal Years
Net Position by Component
Year Ended June 30, 2015
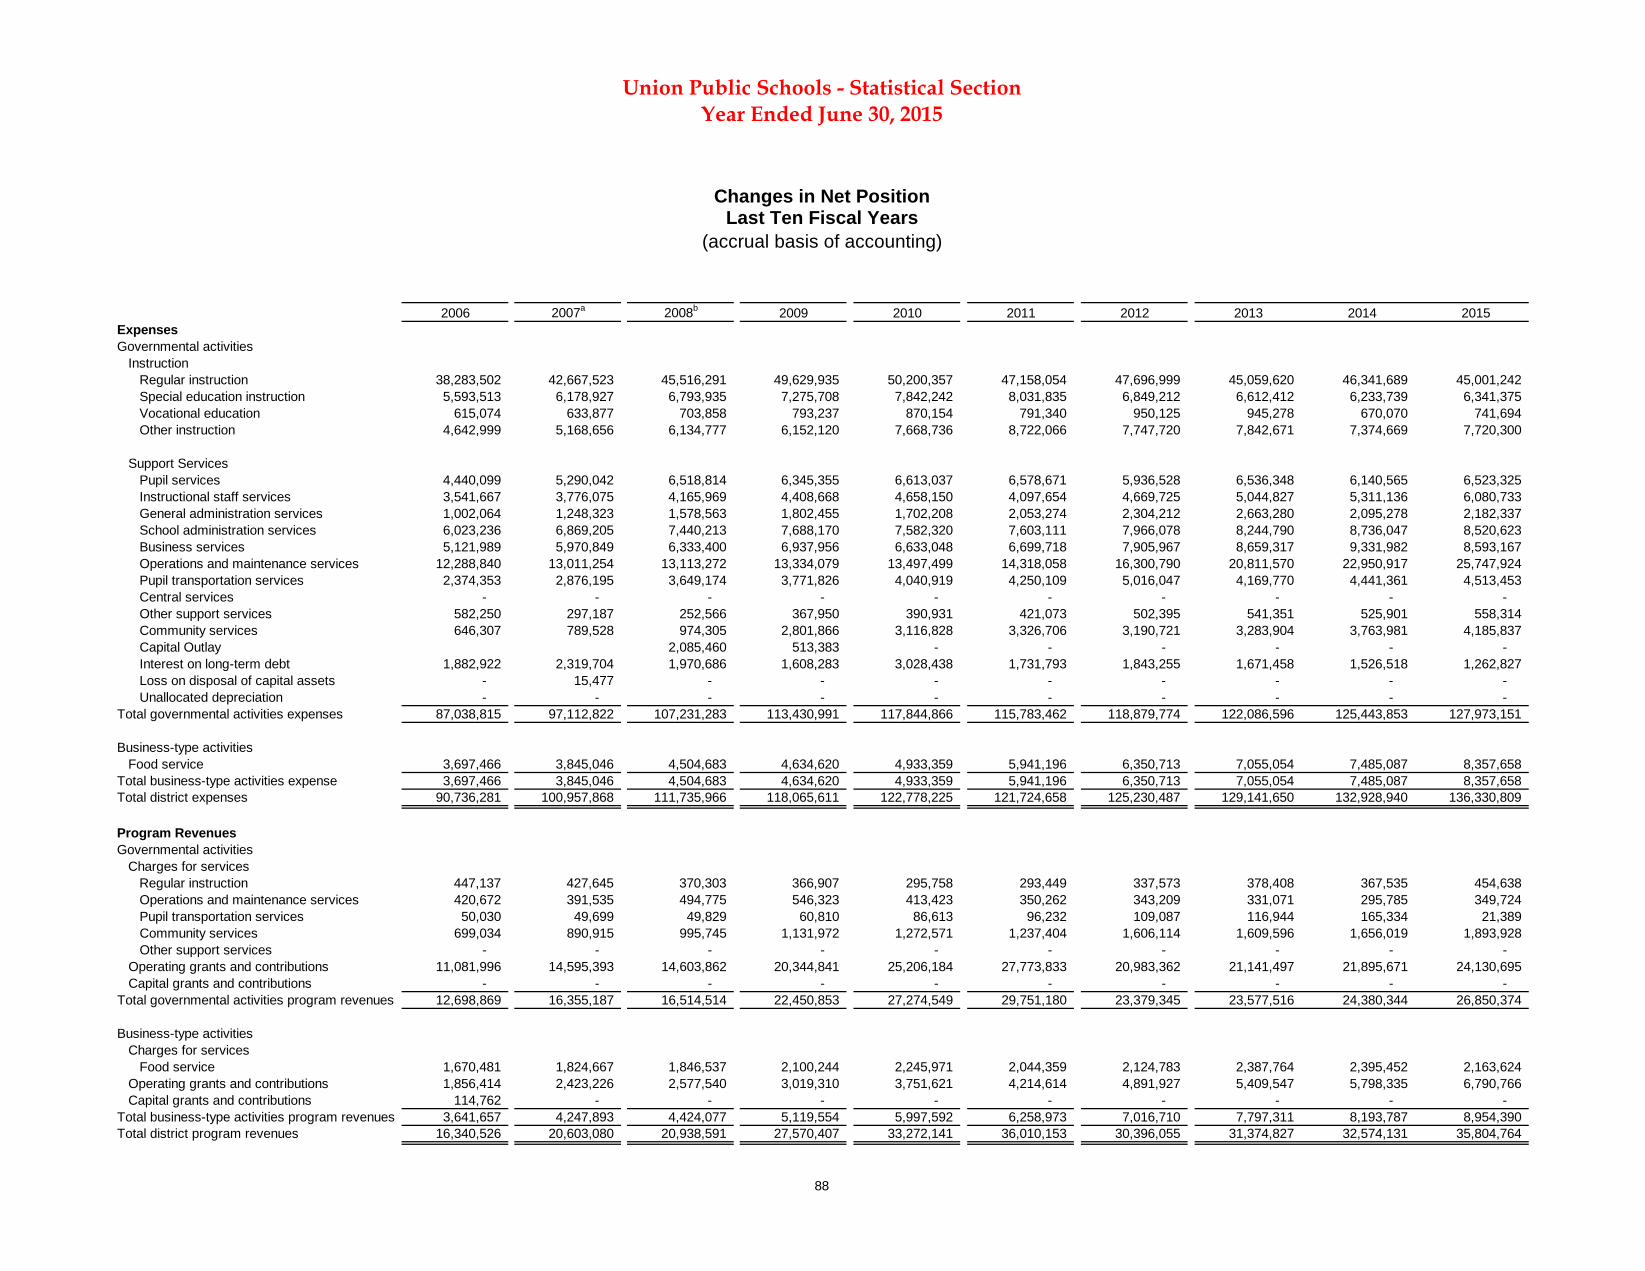
88
2006 2007a 2008b 2009 2010 2011 2012 2013 2014 2015ExpensesGovernmental activities Instruction Regular instruction 38,283,502 42,667,523 45,516,291 49,629,935 50,200,357 47,158,054 47,696,999 45,059,620 46,341,689 45,001,242 Special education instruction 5,593,513 6,178,927 6,793,935 7,275,708 7,842,242 8,031,835 6,849,212 6,612,412 6,233,739 6,341,375 Vocational education 615,074 633,877 703,858 793,237 870,154 791,340 950,125 945,278 670,070 741,694 Other instruction 4,642,999 5,168,656 6,134,777 6,152,120 7,668,736 8,722,066 7,747,720 7,842,671 7,374,669 7,720,300
Support Services Pupil services 4,440,099 5,290,042 6,518,814 6,345,355 6,613,037 6,578,671 5,936,528 6,536,348 6,140,565 6,523,325 Instructional staff services 3,541,667 3,776,075 4,165,969 4,408,668 4,658,150 4,097,654 4,669,725 5,044,827 5,311,136 6,080,733 General administration services 1,002,064 1,248,323 1,578,563 1,802,455 1,702,208 2,053,274 2,304,212 2,663,280 2,095,278 2,182,337 School administration services 6,023,236 6,869,205 7,440,213 7,688,170 7,582,320 7,603,111 7,966,078 8,244,790 8,736,047 8,520,623 Business services 5,121,989 5,970,849 6,333,400 6,937,956 6,633,048 6,699,718 7,905,967 8,659,317 9,331,982 8,593,167 Operations and maintenance services 12,288,840 13,011,254 13,113,272 13,334,079 13,497,499 14,318,058 16,300,790 20,811,570 22,950,917 25,747,924 Pupil transportation services 2,374,353 2,876,195 3,649,174 3,771,826 4,040,919 4,250,109 5,016,047 4,169,770 4,441,361 4,513,453 Central services - - - - - - - - - - Other support services 582,250 297,187 252,566 367,950 390,931 421,073 502,395 541,351 525,901 558,314 Community services 646,307 789,528 974,305 2,801,866 3,116,828 3,326,706 3,190,721 3,283,904 3,763,981 4,185,837 Capital Outlay 2,085,460 513,383 - - - - - - Interest on long-term debt 1,882,922 2,319,704 1,970,686 1,608,283 3,028,438 1,731,793 1,843,255 1,671,458 1,526,518 1,262,827 Loss on disposal of capital assets - 15,477 - - - - - - - - Unallocated depreciation - - - - - - - - - - Total governmental activities expenses 87,038,815 97,112,822 107,231,283 113,430,991 117,844,866 115,783,462 118,879,774 122,086,596 125,443,853 127,973,151 Business-type activities Food service 3,697,466 3,845,046 4,504,683 4,634,620 4,933,359 5,941,196 6,350,713 7,055,054 7,485,087 8,357,658 Total business-type activities expense 3,697,466 3,845,046 4,504,683 4,634,620 4,933,359 5,941,196 6,350,713 7,055,054 7,485,087 8,357,658 Total district expenses 90,736,281 100,957,868 111,735,966 118,065,611 122,778,225 121,724,658 125,230,487 129,141,650 132,928,940 136,330,809
Program RevenuesGovernmental activities Charges for services Regular instruction 447,137 427,645 370,303 366,907 295,758 293,449 337,573 378,408 367,535 454,638 Operations and maintenance services 420,672 391,535 494,775 546,323 413,423 350,262 343,209 331,071 295,785 349,724 Pupil transportation services 50,030 49,699 49,829 60,810 86,613 96,232 109,087 116,944 165,334 21,389 Community services 699,034 890,915 995,745 1,131,972 1,272,571 1,237,404 1,606,114 1,609,596 1,656,019 1,893,928 Other support services - - - - - - - - - - Operating grants and contributions 11,081,996 14,595,393 14,603,862 20,344,841 25,206,184 27,773,833 20,983,362 21,141,497 21,895,671 24,130,695 Capital grants and contributions - - - - - - - - - - Total governmental activities program revenues 12,698,869 16,355,187 16,514,514 22,450,853 27,274,549 29,751,180 23,379,345 23,577,516 24,380,344 26,850,374
Business-type activities Charges for services Food service 1,670,481 1,824,667 1,846,537 2,100,244 2,245,971 2,044,359 2,124,783 2,387,764 2,395,452 2,163,624 Operating grants and contributions 1,856,414 2,423,226 2,577,540 3,019,310 3,751,621 4,214,614 4,891,927 5,409,547 5,798,335 6,790,766 Capital grants and contributions 114,762 - - - - - - - - - Total business-type activities program revenues 3,641,657 4,247,893 4,424,077 5,119,554 5,997,592 6,258,973 7,016,710 7,797,311 8,193,787 8,954,390 Total district program revenues 16,340,526 20,603,080 20,938,591 27,570,407 33,272,141 36,010,153 30,396,055 31,374,827 32,574,131 35,804,764
Union Public Schools - Statistical Section
(accrual basis of accounting)Last Ten Fiscal Years
Changes in Net Position
Year Ended June 30, 2015
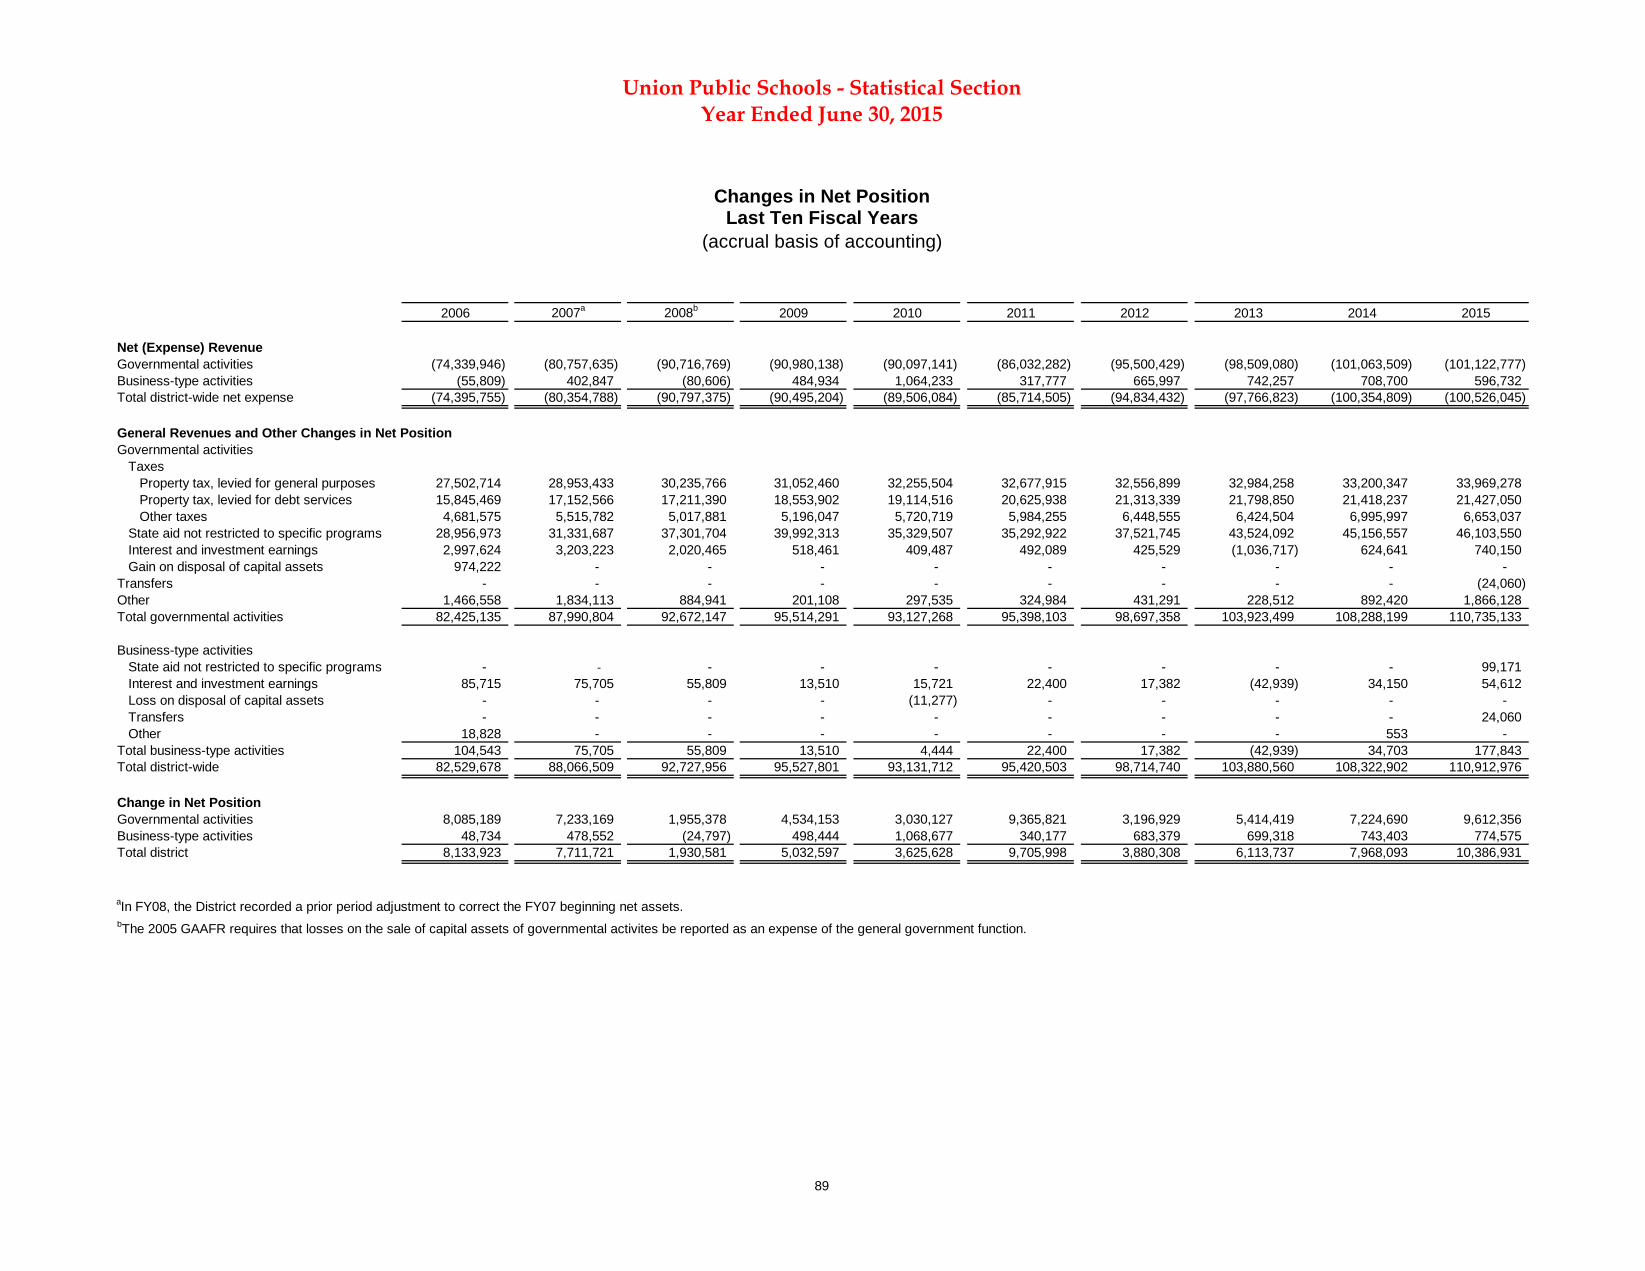
89
2006 2007a 2008b 2009 2010 2011 2012 2013 2014 2015
Union Public Schools - Statistical Section
(accrual basis of accounting)Last Ten Fiscal Years
Changes in Net Position
Year Ended June 30, 2015
Net (Expense) RevenueGovernmental activities (74,339,946) (80,757,635) (90,716,769) (90,980,138) (90,097,141) (86,032,282) (95,500,429) (98,509,080) (101,063,509) (101,122,777) Business-type activities (55,809) 402,847 (80,606) 484,934 1,064,233 317,777 665,997 742,257 708,700 596,732 Total district-wide net expense (74,395,755) (80,354,788) (90,797,375) (90,495,204) (89,506,084) (85,714,505) (94,834,432) (97,766,823) (100,354,809) (100,526,045)
General Revenues and Other Changes in Net PositionGovernmental activities Taxes Property tax, levied for general purposes 27,502,714 28,953,433 30,235,766 31,052,460 32,255,504 32,677,915 32,556,899 32,984,258 33,200,347 33,969,278 Property tax, levied for debt services 15,845,469 17,152,566 17,211,390 18,553,902 19,114,516 20,625,938 21,313,339 21,798,850 21,418,237 21,427,050 Other taxes 4,681,575 5,515,782 5,017,881 5,196,047 5,720,719 5,984,255 6,448,555 6,424,504 6,995,997 6,653,037 State aid not restricted to specific programs 28,956,973 31,331,687 37,301,704 39,992,313 35,329,507 35,292,922 37,521,745 43,524,092 45,156,557 46,103,550 Interest and investment earnings 2,997,624 3,203,223 2,020,465 518,461 409,487 492,089 425,529 (1,036,717) 624,641 740,150 Gain on disposal of capital assets 974,222 - - - - - - - - - Transfers - - - - - - - - - (24,060) Other 1,466,558 1,834,113 884,941 201,108 297,535 324,984 431,291 228,512 892,420 1,866,128 Total governmental activities 82,425,135 87,990,804 92,672,147 95,514,291 93,127,268 95,398,103 98,697,358 103,923,499 108,288,199 110,735,133
Business-type activities State aid not restricted to specific programs - - - - - - - - - 99,171 Interest and investment earnings 85,715 75,705 55,809 13,510 15,721 22,400 17,382 (42,939) 34,150 54,612 Loss on disposal of capital assets - - - - (11,277) - - - - - Transfers - - - - - - - - - 24,060 Other 18,828 - - - - - - - 553 - Total business-type activities 104,543 75,705 55,809 13,510 4,444 22,400 17,382 (42,939) 34,703 177,843 Total district-wide 82,529,678 88,066,509 92,727,956 95,527,801 93,131,712 95,420,503 98,714,740 103,880,560 108,322,902 110,912,976
Change in Net PositionGovernmental activities 8,085,189 7,233,169 1,955,378 4,534,153 3,030,127 9,365,821 3,196,929 5,414,419 7,224,690 9,612,356 Business-type activities 48,734 478,552 (24,797) 498,444 1,068,677 340,177 683,379 699,318 743,403 774,575 Total district 8,133,923 7,711,721 1,930,581 5,032,597 3,625,628 9,705,998 3,880,308 6,113,737 7,968,093 10,386,931
aIn FY08, the District recorded a prior period adjustment to correct the FY07 beginning net assets.bThe 2005 GAAFR requires that losses on the sale of capital assets of governmental activites be reported as an expense of the general government function.
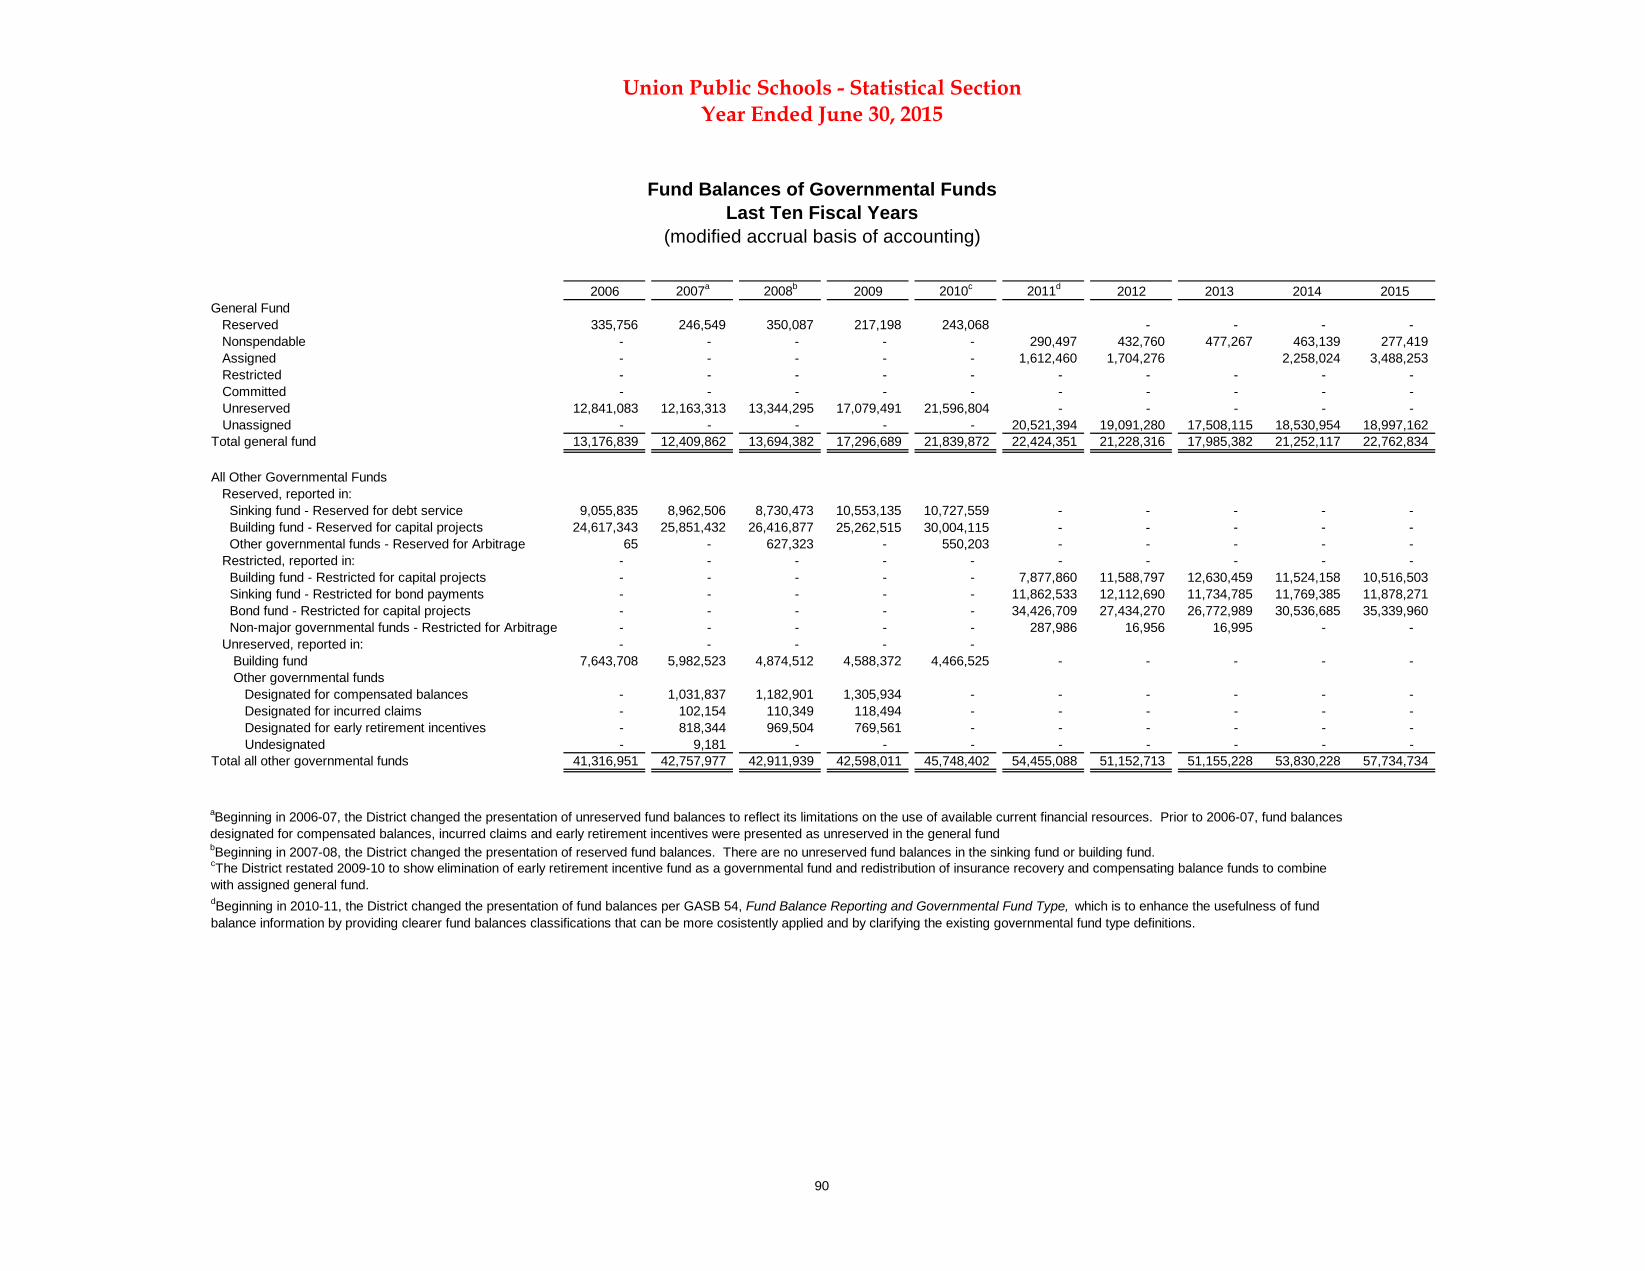
90
2006 2007a 2008b 2009 2010c 2011d 2012 2013 2014 2015General Fund Reserved 335,756 246,549 350,087 217,198 243,068 - - - - Nonspendable - - - - - 290,497 432,760 477,267 463,139 277,419 Assigned - - - - - 1,612,460 1,704,276 2,258,024 3,488,253 Restricted - - - - - - - - - - Committed - - - - - - - - - - Unreserved 12,841,083 12,163,313 13,344,295 17,079,491 21,596,804 - - - - - Unassigned - - - - - 20,521,394 19,091,280 17,508,115 18,530,954 18,997,162 Total general fund 13,176,839 12,409,862 13,694,382 17,296,689 21,839,872 22,424,351 21,228,316 17,985,382 21,252,117 22,762,834
All Other Governmental Funds Reserved, reported in: Sinking fund - Reserved for debt service 9,055,835 8,962,506 8,730,473 10,553,135 10,727,559 - - - - - Building fund - Reserved for capital projects 24,617,343 25,851,432 26,416,877 25,262,515 30,004,115 - - - - - Other governmental funds - Reserved for Arbitrage 65 - 627,323 - 550,203 - - - - - Restricted, reported in: - - - - - - - - - - Building fund - Restricted for capital projects - - - - - 7,877,860 11,588,797 12,630,459 11,524,158 10,516,503 Sinking fund - Restricted for bond payments - - - - - 11,862,533 12,112,690 11,734,785 11,769,385 11,878,271 Bond fund - Restricted for capital projects - - - - - 34,426,709 27,434,270 26,772,989 30,536,685 35,339,960 Non-major governmental funds - Restricted for Arbitrage - - - - - 287,986 16,956 16,995 - - Unreserved, reported in: - - - - - Building fund 7,643,708 5,982,523 4,874,512 4,588,372 4,466,525 - - - - - Other governmental funds Designated for compensated balances - 1,031,837 1,182,901 1,305,934 - - - - - - Designated for incurred claims - 102,154 110,349 118,494 - - - - - - Designated for early retirement incentives - 818,344 969,504 769,561 - - - - - - Undesignated - 9,181 - - - - - - - - Total all other governmental funds 41,316,951 42,757,977 42,911,939 42,598,011 45,748,402 54,455,088 51,152,713 51,155,228 53,830,228 57,734,734
bBeginning in 2007-08, the District changed the presentation of reserved fund balances. There are no unreserved fund balances in the sinking fund or building fund.
Last Ten Fiscal YearsFund Balances of Governmental Funds
Year Ended June 30, 2015Union Public Schools - Statistical Section
dBeginning in 2010-11, the District changed the presentation of fund balances per GASB 54, Fund Balance Reporting and Governmental Fund Type, which is to enhance the usefulness of fund balance information by providing clearer fund balances classifications that can be more cosistently applied and by clarifying the existing governmental fund type definitions.
aBeginning in 2006-07, the District changed the presentation of unreserved fund balances to reflect its limitations on the use of available current financial resources. Prior to 2006-07, fund balances designated for compensated balances, incurred claims and early retirement incentives were presented as unreserved in the general fund
cThe District restated 2009-10 to show elimination of early retirement incentive fund as a governmental fund and redistribution of insurance recovery and compensating balance funds to combine with assigned general fund.
(modified accrual basis of accounting)
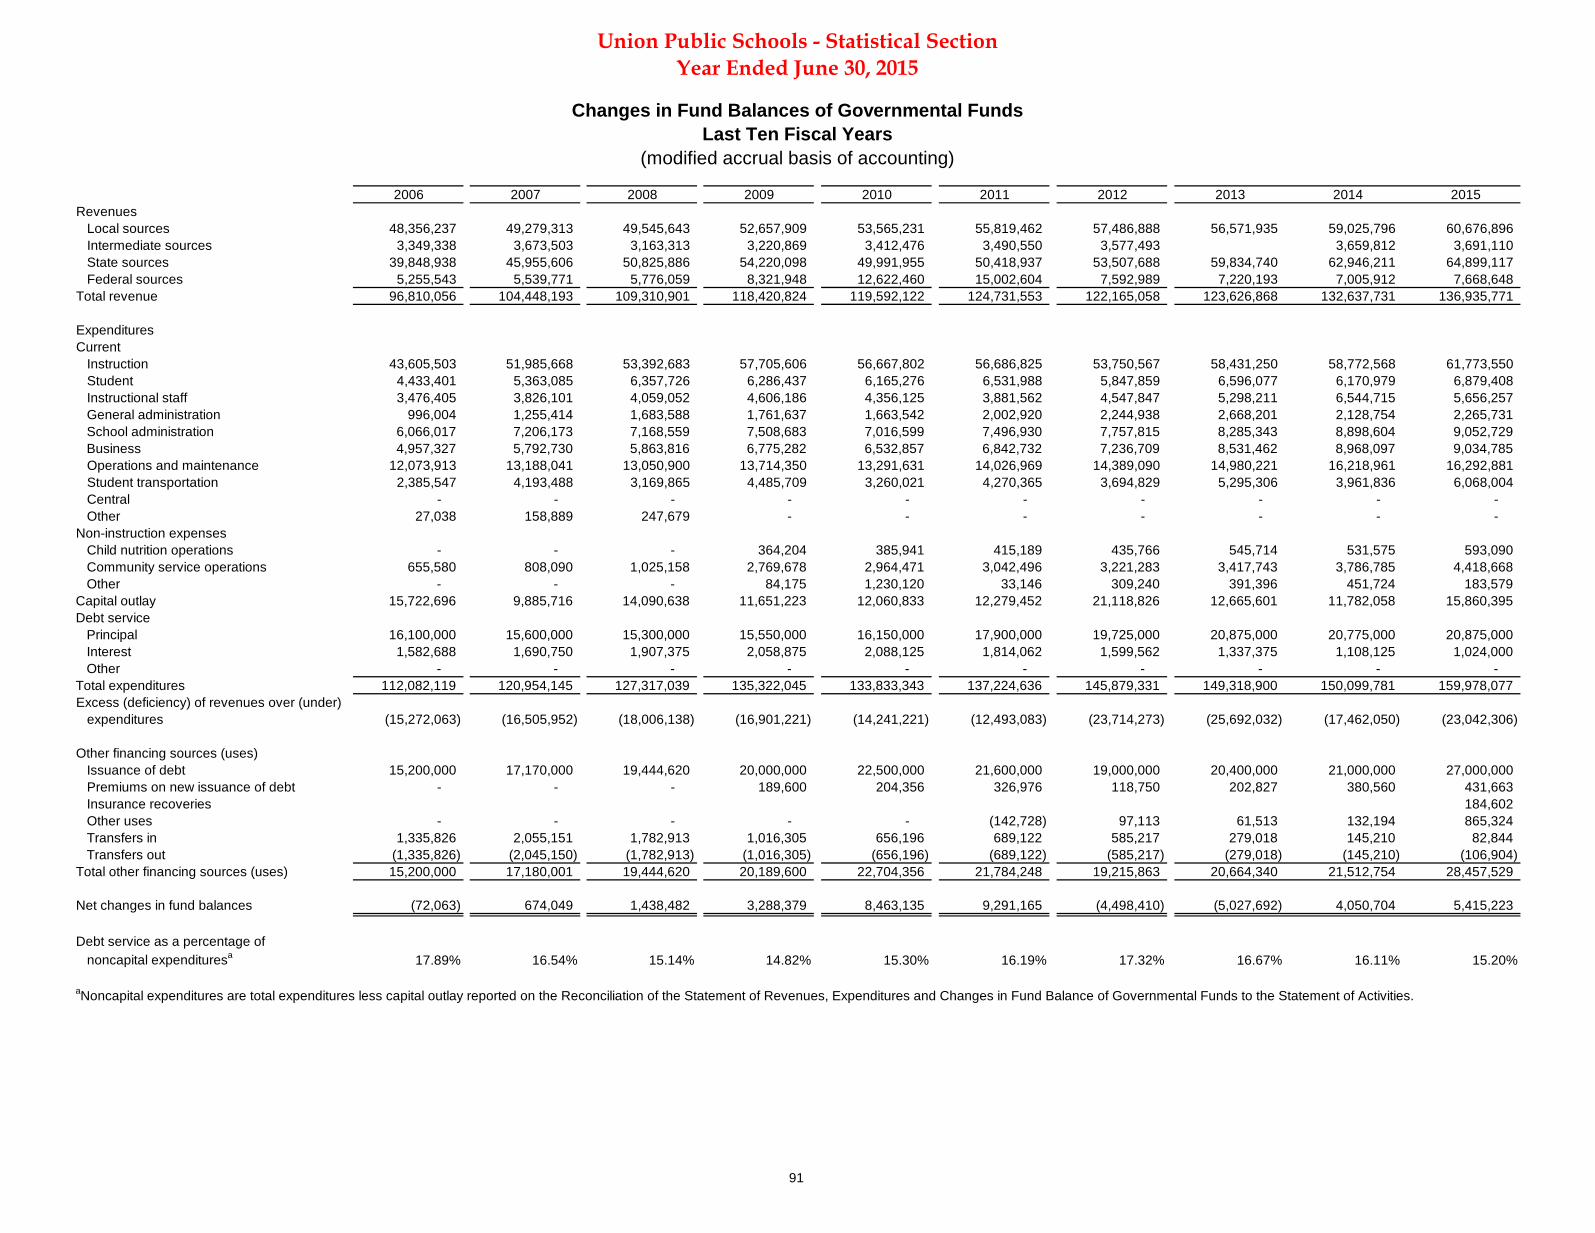
91
2006 2007 2008 2009 2010 2011 2012 2013 2014 2015Revenues Local sources 48,356,237 49,279,313 49,545,643 52,657,909 53,565,231 55,819,462 57,486,888 56,571,935 59,025,796 60,676,896 Intermediate sources 3,349,338 3,673,503 3,163,313 3,220,869 3,412,476 3,490,550 3,577,493 3,659,812 3,691,110 State sources 39,848,938 45,955,606 50,825,886 54,220,098 49,991,955 50,418,937 53,507,688 59,834,740 62,946,211 64,899,117 Federal sources 5,255,543 5,539,771 5,776,059 8,321,948 12,622,460 15,002,604 7,592,989 7,220,193 7,005,912 7,668,648 Total revenue 96,810,056 104,448,193 109,310,901 118,420,824 119,592,122 124,731,553 122,165,058 123,626,868 132,637,731 136,935,771
ExpendituresCurrent Instruction 43,605,503 51,985,668 53,392,683 57,705,606 56,667,802 56,686,825 53,750,567 58,431,250 58,772,568 61,773,550 Student 4,433,401 5,363,085 6,357,726 6,286,437 6,165,276 6,531,988 5,847,859 6,596,077 6,170,979 6,879,408 Instructional staff 3,476,405 3,826,101 4,059,052 4,606,186 4,356,125 3,881,562 4,547,847 5,298,211 6,544,715 5,656,257 General administration 996,004 1,255,414 1,683,588 1,761,637 1,663,542 2,002,920 2,244,938 2,668,201 2,128,754 2,265,731 School administration 6,066,017 7,206,173 7,168,559 7,508,683 7,016,599 7,496,930 7,757,815 8,285,343 8,898,604 9,052,729 Business 4,957,327 5,792,730 5,863,816 6,775,282 6,532,857 6,842,732 7,236,709 8,531,462 8,968,097 9,034,785 Operations and maintenance 12,073,913 13,188,041 13,050,900 13,714,350 13,291,631 14,026,969 14,389,090 14,980,221 16,218,961 16,292,881 Student transportation 2,385,547 4,193,488 3,169,865 4,485,709 3,260,021 4,270,365 3,694,829 5,295,306 3,961,836 6,068,004 Central - - - - - - - - - - Other 27,038 158,889 247,679 - - - - - - - Non-instruction expenses Child nutrition operations - - - 364,204 385,941 415,189 435,766 545,714 531,575 593,090 Community service operations 655,580 808,090 1,025,158 2,769,678 2,964,471 3,042,496 3,221,283 3,417,743 3,786,785 4,418,668 Other - - - 84,175 1,230,120 33,146 309,240 391,396 451,724 183,579 Capital outlay 15,722,696 9,885,716 14,090,638 11,651,223 12,060,833 12,279,452 21,118,826 12,665,601 11,782,058 15,860,395 Debt service Principal 16,100,000 15,600,000 15,300,000 15,550,000 16,150,000 17,900,000 19,725,000 20,875,000 20,775,000 20,875,000 Interest 1,582,688 1,690,750 1,907,375 2,058,875 2,088,125 1,814,062 1,599,562 1,337,375 1,108,125 1,024,000 Other - - - - - - - - - - Total expenditures 112,082,119 120,954,145 127,317,039 135,322,045 133,833,343 137,224,636 145,879,331 149,318,900 150,099,781 159,978,077 Excess (deficiency) of revenues over (under) expenditures (15,272,063) (16,505,952) (18,006,138) (16,901,221) (14,241,221) (12,493,083) (23,714,273) (25,692,032) (17,462,050) (23,042,306)
Other financing sources (uses) Issuance of debt 15,200,000 17,170,000 19,444,620 20,000,000 22,500,000 21,600,000 19,000,000 20,400,000 21,000,000 27,000,000 Premiums on new issuance of debt - - - 189,600 204,356 326,976 118,750 202,827 380,560 431,663 Insurance recoveries 184,602 Other uses - - - - - (142,728) 97,113 61,513 132,194 865,324 Transfers in 1,335,826 2,055,151 1,782,913 1,016,305 656,196 689,122 585,217 279,018 145,210 82,844 Transfers out (1,335,826) (2,045,150) (1,782,913) (1,016,305) (656,196) (689,122) (585,217) (279,018) (145,210) (106,904) Total other financing sources (uses) 15,200,000 17,180,001 19,444,620 20,189,600 22,704,356 21,784,248 19,215,863 20,664,340 21,512,754 28,457,529
Net changes in fund balances (72,063) 674,049 1,438,482 3,288,379 8,463,135 9,291,165 (4,498,410) (5,027,692) 4,050,704 5,415,223
Debt service as a percentage of noncapital expendituresa 17.89% 16.54% 15.14% 14.82% 15.30% 16.19% 17.32% 16.67% 16.11% 15.20%
aNoncapital expenditures are total expenditures less capital outlay reported on the Reconciliation of the Statement of Revenues, Expenditures and Changes in Fund Balance of Governmental Funds to the Statement of Activities.
Changes in Fund Balances of Governmental Funds
Year Ended June 30, 2015Union Public Schools - Statistical Section
(modified accrual basis of accounting)Last Ten Fiscal Years

92
This page is intentionally left blank.
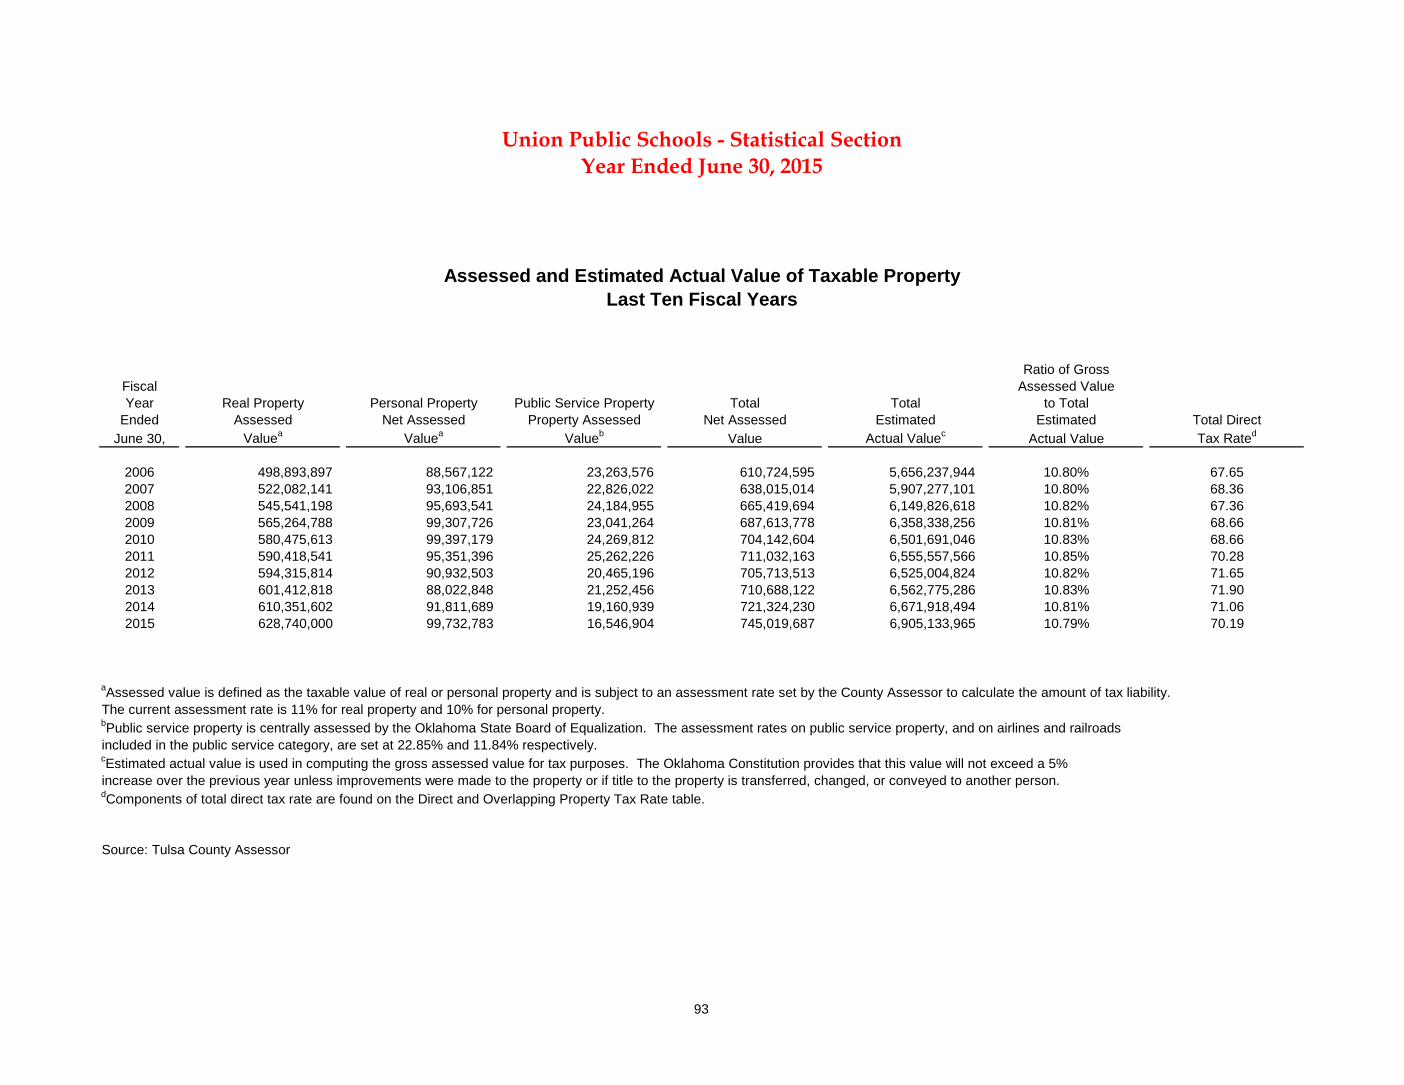
93
Ratio of GrossFiscal Assessed ValueYear Real Property Personal Property Public Service Property Total Total to Total
Ended Assessed Net Assessed Property Assessed Net Assessed Estimated Estimated Total DirectJune 30, Valuea Valuea Valueb Value Actual Valuec Actual Value Tax Rated
2006 498,893,897 88,567,122 23,263,576 610,724,595 5,656,237,944 10.80% 67.652007 522,082,141 93,106,851 22,826,022 638,015,014 5,907,277,101 10.80% 68.362008 545,541,198 95,693,541 24,184,955 665,419,694 6,149,826,618 10.82% 67.362009 565,264,788 99,307,726 23,041,264 687,613,778 6,358,338,256 10.81% 68.662010 580,475,613 99,397,179 24,269,812 704,142,604 6,501,691,046 10.83% 68.662011 590,418,541 95,351,396 25,262,226 711,032,163 6,555,557,566 10.85% 70.282012 594,315,814 90,932,503 20,465,196 705,713,513 6,525,004,824 10.82% 71.652013 601,412,818 88,022,848 21,252,456 710,688,122 6,562,775,286 10.83% 71.902014 610,351,602 91,811,689 19,160,939 721,324,230 6,671,918,494 10.81% 71.062015 628,740,000 99,732,783 16,546,904 745,019,687 6,905,133,965 10.79% 70.19
aAssessed value is defined as the taxable value of real or personal property and is subject to an assessment rate set by the County Assessor to calculate the amount of tax liability. The current assessment rate is 11% for real property and 10% for personal property.bPublic service property is centrally assessed by the Oklahoma State Board of Equalization. The assessment rates on public service property, and on airlines and railroads included in the public service category, are set at 22.85% and 11.84% respectively.cEstimated actual value is used in computing the gross assessed value for tax purposes. The Oklahoma Constitution provides that this value will not exceed a 5%increase over the previous year unless improvements were made to the property or if title to the property is transferred, changed, or conveyed to another person.dComponents of total direct tax rate are found on the Direct and Overlapping Property Tax Rate table.
Source: Tulsa County Assessor
Year Ended June 30, 2015Union Public Schools - Statistical Section
Assessed and Estimated Actual Value of Taxable PropertyLast Ten Fiscal Years
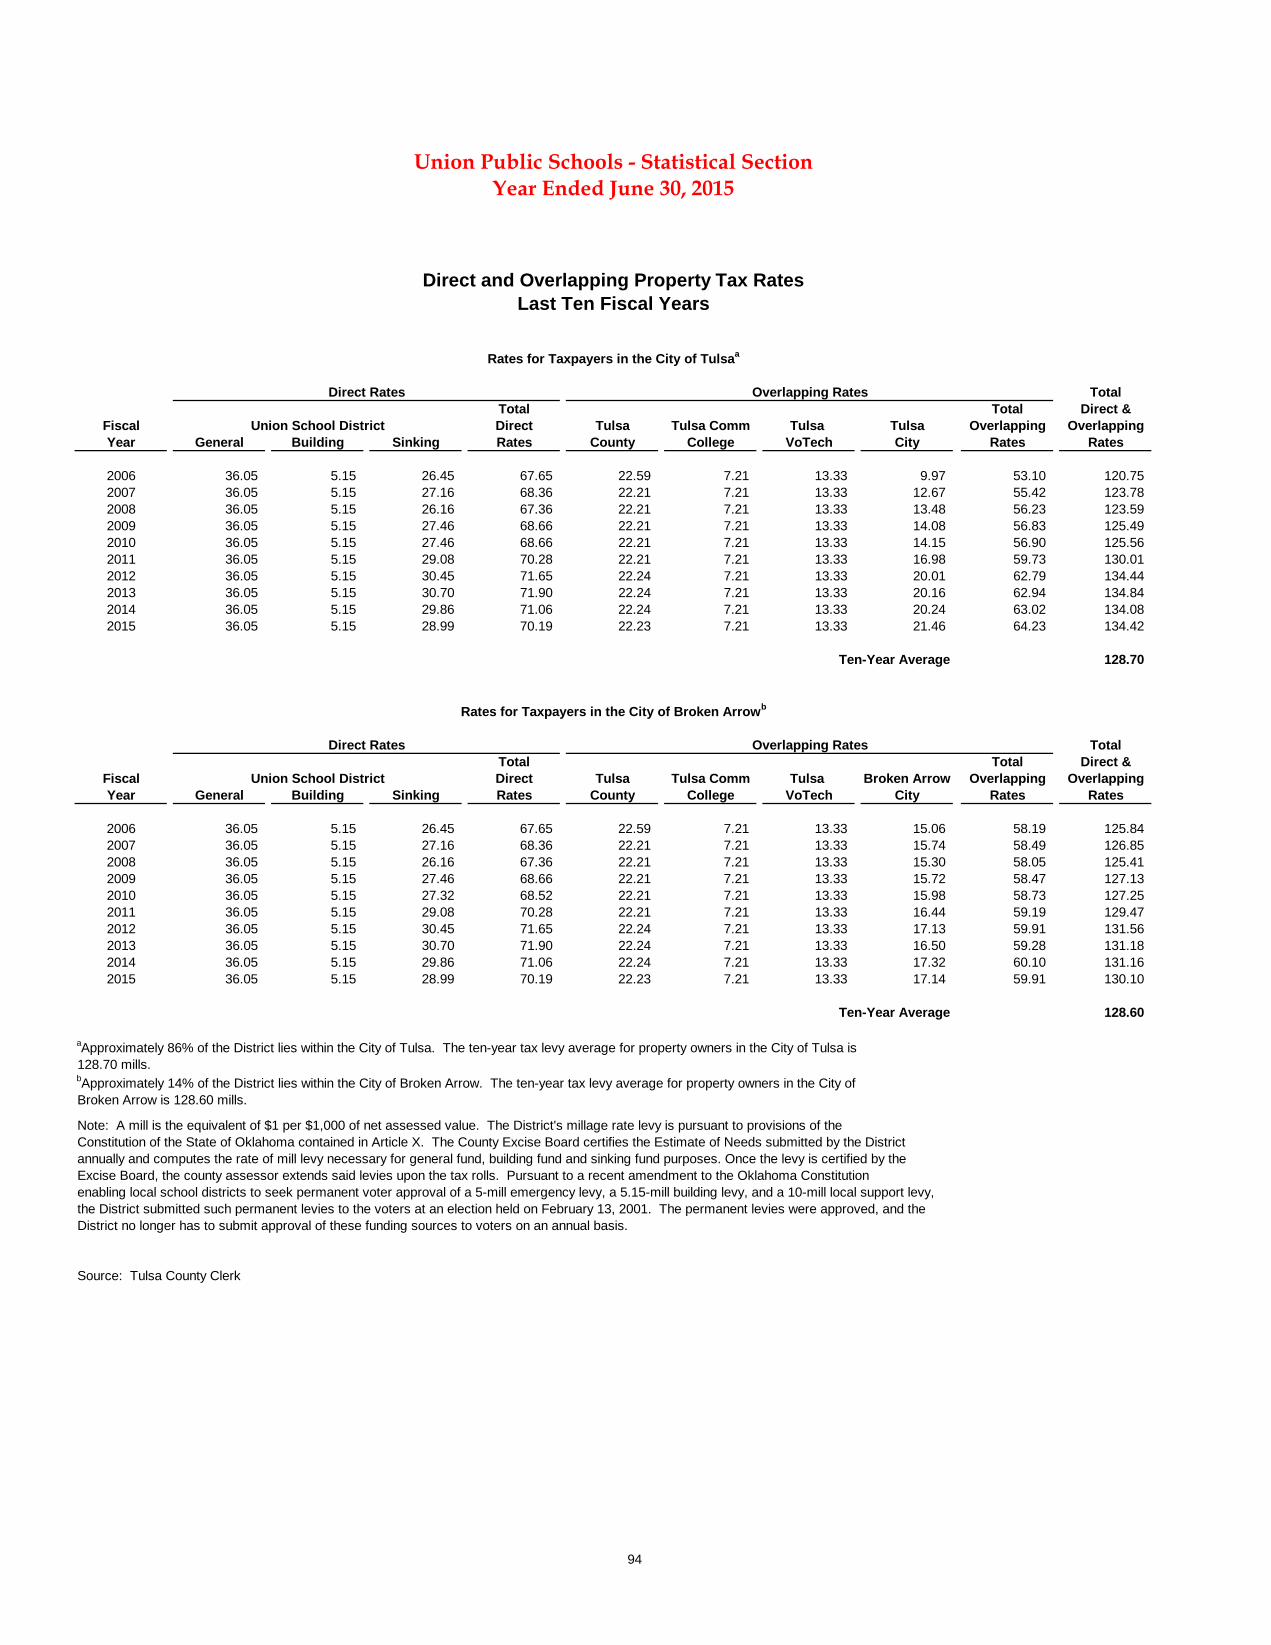
94
TotalTotal Total Direct &
Fiscal Direct Tulsa Tulsa Comm Tulsa Tulsa Overlapping OverlappingYear General Building Sinking Rates County College VoTech City Rates Rates
2006 36.05 5.15 26.45 67.65 22.59 7.21 13.33 9.97 53.10 120.75 2007 36.05 5.15 27.16 68.36 22.21 7.21 13.33 12.67 55.42 123.78 2008 36.05 5.15 26.16 67.36 22.21 7.21 13.33 13.48 56.23 123.59 2009 36.05 5.15 27.46 68.66 22.21 7.21 13.33 14.08 56.83 125.49 2010 36.05 5.15 27.46 68.66 22.21 7.21 13.33 14.15 56.90 125.56 2011 36.05 5.15 29.08 70.28 22.21 7.21 13.33 16.98 59.73 130.01 2012 36.05 5.15 30.45 71.65 22.24 7.21 13.33 20.01 62.79 134.44 2013 36.05 5.15 30.70 71.90 22.24 7.21 13.33 20.16 62.94 134.84 2014 36.05 5.15 29.86 71.06 22.24 7.21 13.33 20.24 63.02 134.08 2015 36.05 5.15 28.99 70.19 22.23 7.21 13.33 21.46 64.23 134.42
128.70
TotalTotal Total Direct &
Fiscal Direct Tulsa Tulsa Comm Tulsa Broken Arrow Overlapping OverlappingYear General Building Sinking Rates County College VoTech City Rates Rates
2006 36.05 5.15 26.45 67.65 22.59 7.21 13.33 15.06 58.19 125.84 2007 36.05 5.15 27.16 68.36 22.21 7.21 13.33 15.74 58.49 126.85 2008 36.05 5.15 26.16 67.36 22.21 7.21 13.33 15.30 58.05 125.41 2009 36.05 5.15 27.46 68.66 22.21 7.21 13.33 15.72 58.47 127.13 2010 36.05 5.15 27.32 68.52 22.21 7.21 13.33 15.98 58.73 127.25 2011 36.05 5.15 29.08 70.28 22.21 7.21 13.33 16.44 59.19 129.47 2012 36.05 5.15 30.45 71.65 22.24 7.21 13.33 17.13 59.91 131.56 2013 36.05 5.15 30.70 71.90 22.24 7.21 13.33 16.50 59.28 131.18 2014 36.05 5.15 29.86 71.06 22.24 7.21 13.33 17.32 60.10 131.16 2015 36.05 5.15 28.99 70.19 22.23 7.21 13.33 17.14 59.91 130.10
128.60
128.70 mills.
Broken Arrow is 128.60 mills.
Note: A mill is the equivalent of $1 per $1,000 of net assessed value. The District's millage rate levy is pursuant to provisions of theConstitution of the State of Oklahoma contained in Article X. The County Excise Board certifies the Estimate of Needs submitted by the District annually and computes the rate of mill levy necessary for general fund, building fund and sinking fund purposes. Once the levy is certified by the Excise Board, the county assessor extends said levies upon the tax rolls. Pursuant to a recent amendment to the Oklahoma Constitutionenabling local school districts to seek permanent voter approval of a 5-mill emergency levy, a 5.15-mill building levy, and a 10-mill local support levy, the District submitted such permanent levies to the voters at an election held on February 13, 2001. The permanent levies were approved, and the District no longer has to submit approval of these funding sources to voters on an annual basis.
Source: Tulsa County Clerk
Union Public Schools - Statistical Section
Direct and Overlapping Property Tax RatesLast Ten Fiscal Years
aApproximately 86% of the District lies within the City of Tulsa. The ten-year tax levy average for property owners in the City of Tulsa is
Union School District
Rates for Taxpayers in the City of Tulsaa
Rates for Taxpayers in the City of Broken Arrowb
Union School District
Ten-Year Average
Ten-Year Average
Year Ended June 30, 2015
bApproximately 14% of the District lies within the City of Broken Arrow. The ten-year tax levy average for property owners in the City of
Direct Rates Overlapping Rates
Direct Rates Overlapping Rates
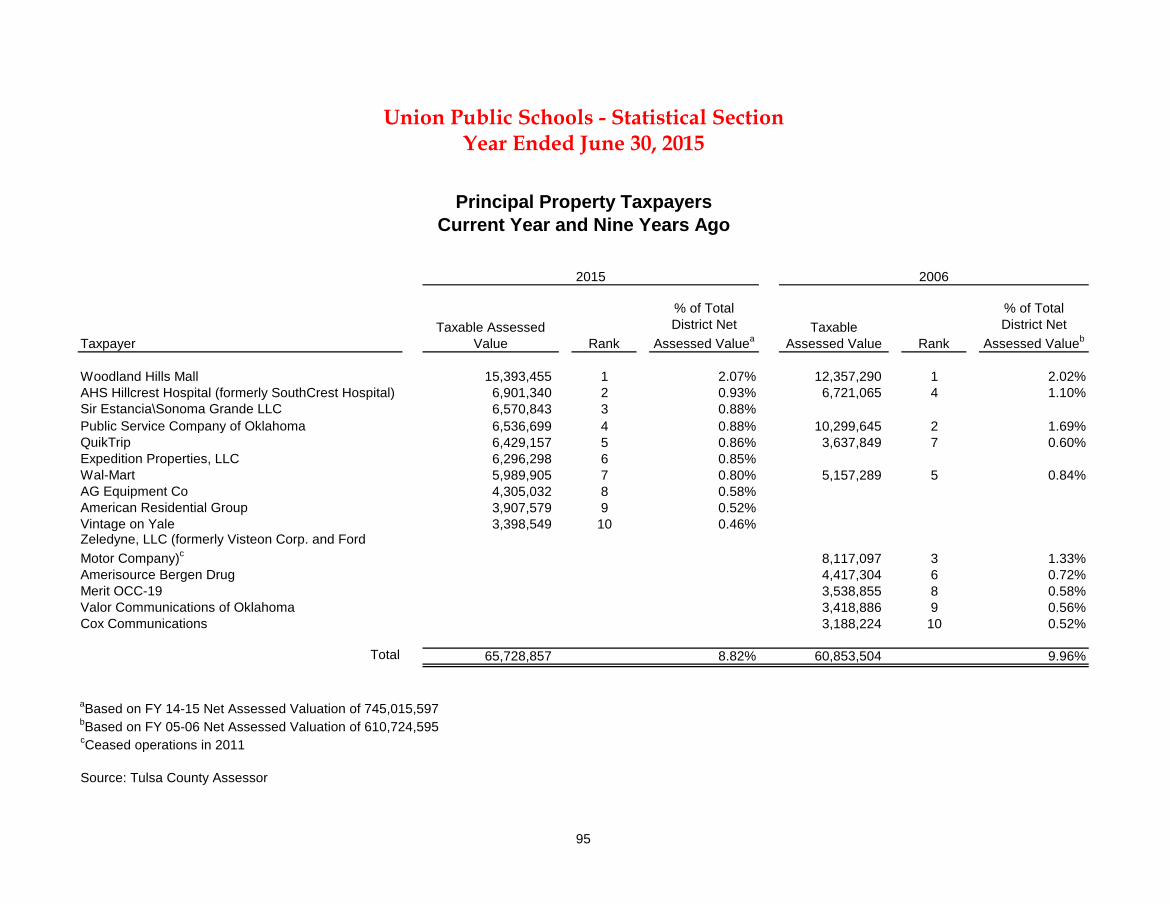
95
TaxpayerTaxable Assessed
Value Rank
% of Total District Net
Assessed ValueaTaxable
Assessed Value Rank
% of Total District Net
Assessed Valueb
Woodland Hills Mall 15,393,455 1 2.07% 12,357,290 1 2.02%AHS Hillcrest Hospital (formerly SouthCrest Hospital) 6,901,340 2 0.93% 6,721,065 4 1.10%Sir Estancia\Sonoma Grande LLC 6,570,843 3 0.88%Public Service Company of Oklahoma 6,536,699 4 0.88% 10,299,645 2 1.69%QuikTrip 6,429,157 5 0.86% 3,637,849 7 0.60%Expedition Properties, LLC 6,296,298 6 0.85%Wal-Mart 5,989,905 7 0.80% 5,157,289 5 0.84%AG Equipment Co 4,305,032 8 0.58%American Residential Group 3,907,579 9 0.52%Vintage on Yale 3,398,549 10 0.46%Zeledyne, LLC (formerly Visteon Corp. and Ford Motor Company)c 8,117,097 3 1.33%Amerisource Bergen Drug 4,417,304 6 0.72%Merit OCC-19 3,538,855 8 0.58%Valor Communications of Oklahoma 3,418,886 9 0.56%Cox Communications 3,188,224 10 0.52%
Total 65,728,857 8.82% 60,853,504 9.96%
aBased on FY 14-15 Net Assessed Valuation of 745,015,597bBased on FY 05-06 Net Assessed Valuation of 610,724,595cCeased operations in 2011
Source: Tulsa County Assessor
Year Ended June 30, 2015
2015 2006
Union Public Schools - Statistical Section
Principal Property TaxpayersCurrent Year and Nine Years Ago
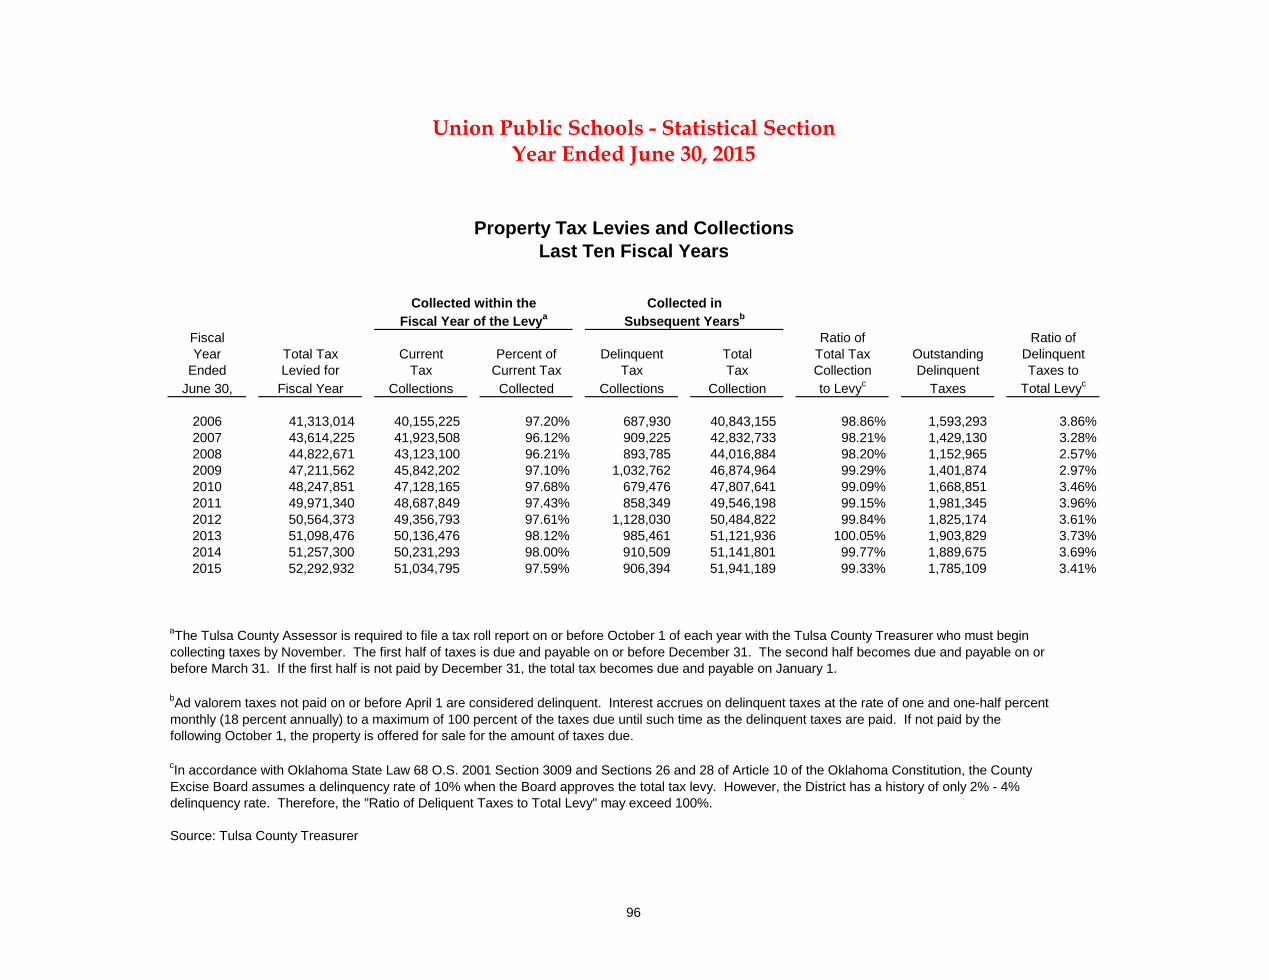
96
Fiscal Ratio of Ratio ofYear Total Tax Current Percent of Delinquent Total Total Tax Outstanding Delinquent
Ended Levied for Tax Current Tax Tax Tax Collection Delinquent Taxes toJune 30, Fiscal Year Collections Collected Collections Collection to Levyc Taxes Total Levyc
2006 41,313,014 40,155,225 97.20% 687,930 40,843,155 98.86% 1,593,293 3.86%2007 43,614,225 41,923,508 96.12% 909,225 42,832,733 98.21% 1,429,130 3.28%2008 44,822,671 43,123,100 96.21% 893,785 44,016,884 98.20% 1,152,965 2.57%2009 47,211,562 45,842,202 97.10% 1,032,762 46,874,964 99.29% 1,401,874 2.97%2010 48,247,851 47,128,165 97.68% 679,476 47,807,641 99.09% 1,668,851 3.46%2011 49,971,340 48,687,849 97.43% 858,349 49,546,198 99.15% 1,981,345 3.96%2012 50,564,373 49,356,793 97.61% 1,128,030 50,484,822 99.84% 1,825,174 3.61%2013 51,098,476 50,136,476 98.12% 985,461 51,121,936 100.05% 1,903,829 3.73%2014 51,257,300 50,231,293 98.00% 910,509 51,141,801 99.77% 1,889,675 3.69%2015 52,292,932 51,034,795 97.59% 906,394 51,941,189 99.33% 1,785,109 3.41%
aThe Tulsa County Assessor is required to file a tax roll report on or before October 1 of each year with the Tulsa County Treasurer who must begincollecting taxes by November. The first half of taxes is due and payable on or before December 31. The second half becomes due and payable on or before March 31. If the first half is not paid by December 31, the total tax becomes due and payable on January 1.
bAd valorem taxes not paid on or before April 1 are considered delinquent. Interest accrues on delinquent taxes at the rate of one and one-half percentmonthly (18 percent annually) to a maximum of 100 percent of the taxes due until such time as the delinquent taxes are paid. If not paid by thefollowing October 1, the property is offered for sale for the amount of taxes due.
cIn accordance with Oklahoma State Law 68 O.S. 2001 Section 3009 and Sections 26 and 28 of Article 10 of the Oklahoma Constitution, the CountyExcise Board assumes a delinquency rate of 10% when the Board approves the total tax levy. However, the District has a history of only 2% - 4% delinquency rate. Therefore, the "Ratio of Deliquent Taxes to Total Levy" may exceed 100%.
Source: Tulsa County Treasurer
Year Ended June 30, 2015Union Public Schools - Statistical Section
Property Tax Levies and CollectionsLast Ten Fiscal Years
Fiscal Year of the Levya Subsequent YearsbCollected within the Collected in
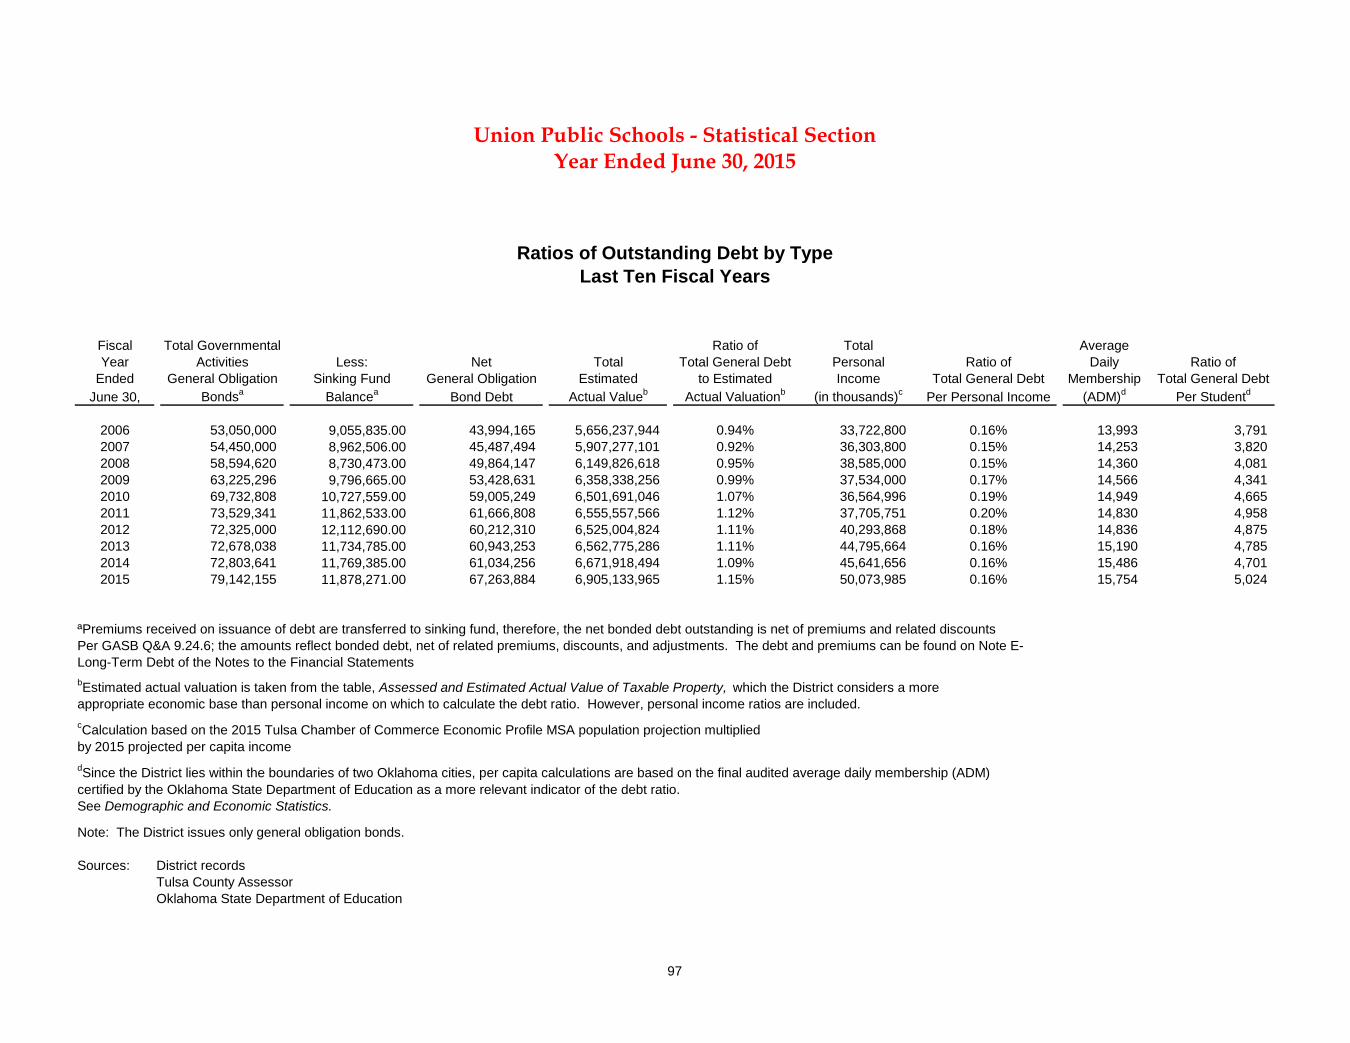
Fiscal Total Governmental Ratio of Total Average
Year Activities Less: Net Total Total General Debt Personal Ratio of Daily Ratio of
Ended General Obligation Sinking Fund General Obligation Estimated to Estimated Income Total General Debt Membership Total General Debt
June 30, Bondsa
Balancea
Bond Debt Actual Valueb
Actual Valuationb
(in thousands)c
Per Personal Income (ADM)d
Per Studentd
2006 53,050,000 9,055,835.00 43,994,165 5,656,237,944 0.94% 33,722,800 0.16% 13,993 3,791
2007 54,450,000 8,962,506.00 45,487,494 5,907,277,101 0.92% 36,303,800 0.15% 14,253 3,820
2008 58,594,620 8,730,473.00 49,864,147 6,149,826,618 0.95% 38,585,000 0.15% 14,360 4,081
2009 63,225,296 9,796,665.00 53,428,631 6,358,338,256 0.99% 37,534,000 0.17% 14,566 4,341
2010 69,732,808 10,727,559.00 59,005,249 6,501,691,046 1.07% 36,564,996 0.19% 14,949 4,665
2011 73,529,341 11,862,533.00 61,666,808 6,555,557,566 1.12% 37,705,751 0.20% 14,830 4,958
2012 72,325,000 12,112,690.00 60,212,310 6,525,004,824 1.11% 40,293,868 0.18% 14,836 4,875
2013 72,678,038 11,734,785.00 60,943,253 6,562,775,286 1.11% 44,795,664 0.16% 15,190 4,785
2014 72,803,641 11,769,385.00 61,034,256 6,671,918,494 1.09% 45,641,656 0.16% 15,486 4,701
2015 79,142,155 11,878,271.00 67,263,884 6,905,133,965 1.15% 50,073,985 0.16% 15,754 5,024
ªPremiums received on issuance of debt are transferred to sinking fund, therefore, the net bonded debt outstanding is net of premiums and related discounts
Per GASB Q&A 9.24.6; the amounts reflect bonded debt, net of related premiums, discounts, and adjustments. The debt and premiums can be found on Note E-
Long-Term Debt of the Notes to the Financial Statements
appropriate economic base than personal income on which to calculate the debt ratio. However, personal income ratios are included.
cCalculation based on the 2015 Tulsa Chamber of Commerce Economic Profile MSA population projection multiplied
by 2015 projected per capita income
dSince the District lies within the boundaries of two Oklahoma cities, per capita calculations are based on the final audited average daily membership (ADM)
certified by the Oklahoma State Department of Education as a more relevant indicator of the debt ratio.
See Demographic and Economic Statistics.
Note: The District issues only general obligation bonds.
Sources: District records
Tulsa County Assessor
Oklahoma State Department of Education
Union Public Schools - Statistical Section
Ratios of Outstanding Debt by Type
Last Ten Fiscal Years
bEstimated actual valuation is taken from the table, Assessed and Estimated Actual Value of Taxable Property, which the District considers a more
Year Ended June 30, 2015
97
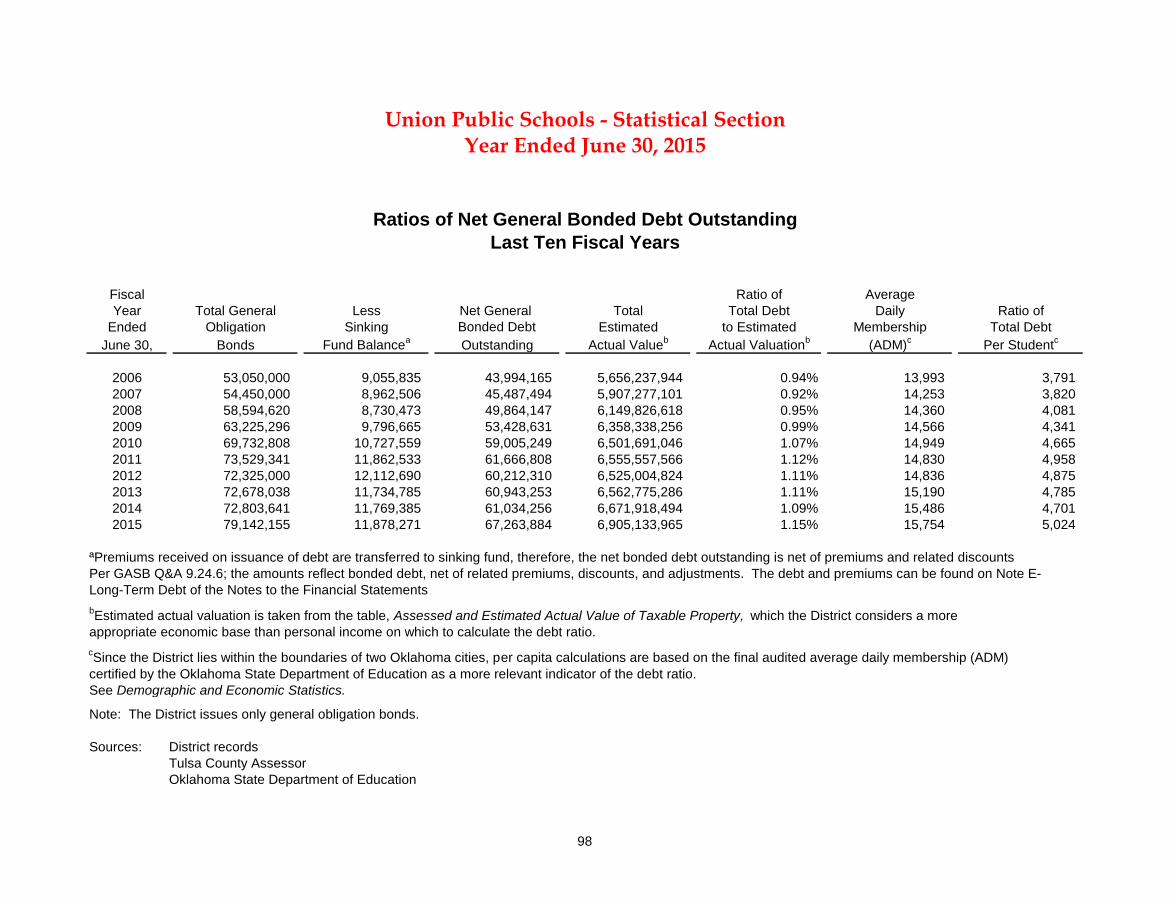
Fiscal Ratio of Average
Year Total General Less Net General Total Total Debt Daily Ratio of
Ended Obligation Sinking Bonded Debt Estimated to Estimated Membership Total Debt
June 30, Bonds Fund Balancea
Outstanding Actual Valueb
Actual Valuationb
(ADM)c
Per Studentc
2006 53,050,000 9,055,835 43,994,165 5,656,237,944 0.94% 13,993 3,791
2007 54,450,000 8,962,506 45,487,494 5,907,277,101 0.92% 14,253 3,820
2008 58,594,620 8,730,473 49,864,147 6,149,826,618 0.95% 14,360 4,081
2009 63,225,296 9,796,665 53,428,631 6,358,338,256 0.99% 14,566 4,341
2010 69,732,808 10,727,559 59,005,249 6,501,691,046 1.07% 14,949 4,665
2011 73,529,341 11,862,533 61,666,808 6,555,557,566 1.12% 14,830 4,958
2012 72,325,000 12,112,690 60,212,310 6,525,004,824 1.11% 14,836 4,875
2013 72,678,038 11,734,785 60,943,253 6,562,775,286 1.11% 15,190 4,785
2014 72,803,641 11,769,385 61,034,256 6,671,918,494 1.09% 15,486 4,701
2015 79,142,155 11,878,271 67,263,884 6,905,133,965 1.15% 15,754 5,024
ªPremiums received on issuance of debt are transferred to sinking fund, therefore, the net bonded debt outstanding is net of premiums and related discounts
Per GASB Q&A 9.24.6; the amounts reflect bonded debt, net of related premiums, discounts, and adjustments. The debt and premiums can be found on Note E-
Long-Term Debt of the Notes to the Financial Statements
cSince the District lies within the boundaries of two Oklahoma cities, per capita calculations are based on the final audited average daily membership (ADM)
certified by the Oklahoma State Department of Education as a more relevant indicator of the debt ratio.
See Demographic and Economic Statistics.
Note: The District issues only general obligation bonds.
Sources: District records
Tulsa County Assessor
Oklahoma State Department of Education
appropriate economic base than personal income on which to calculate the debt ratio.
Union Public Schools - Statistical Section
Ratios of Net General Bonded Debt Outstanding
Last Ten Fiscal Years
bEstimated actual valuation is taken from the table, Assessed and Estimated Actual Value of Taxable Property, which the District considers a more
Year Ended June 30, 2015
98
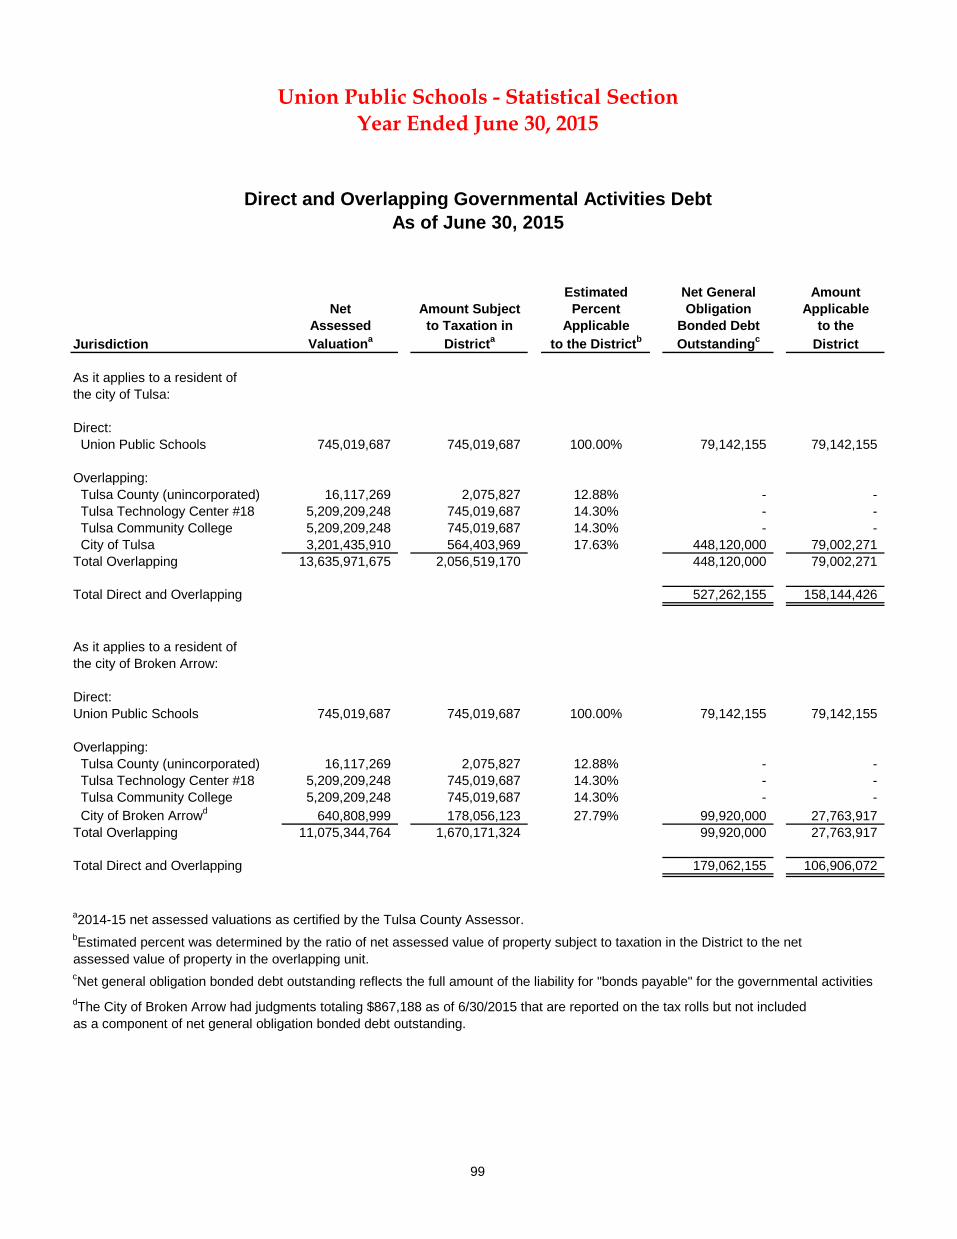
99
Estimated Net General AmountNet Amount Subject Percent Obligation Applicable
Assessed to Taxation in Applicable Bonded Debt to theJurisdiction Valuationa Districta to the Districtb Outstandingc District
As it applies to a resident ofthe city of Tulsa:
Direct: Union Public Schools 745,019,687 745,019,687 100.00% 79,142,155 79,142,155
Overlapping: Tulsa County (unincorporated) 16,117,269 2,075,827 12.88% - - Tulsa Technology Center #18 5,209,209,248 745,019,687 14.30% - - Tulsa Community College 5,209,209,248 745,019,687 14.30% - - City of Tulsa 3,201,435,910 564,403,969 17.63% 448,120,000 79,002,271 Total Overlapping 13,635,971,675 2,056,519,170 448,120,000 79,002,271
Total Direct and Overlapping 527,262,155 158,144,426
As it applies to a resident ofthe city of Broken Arrow:
Direct:Union Public Schools 745,019,687 745,019,687 100.00% 79,142,155 79,142,155
Overlapping: Tulsa County (unincorporated) 16,117,269 2,075,827 12.88% - - Tulsa Technology Center #18 5,209,209,248 745,019,687 14.30% - - Tulsa Community College 5,209,209,248 745,019,687 14.30% - - City of Broken Arrowd 640,808,999 178,056,123 27.79% 99,920,000 27,763,917 Total Overlapping 11,075,344,764 1,670,171,324 99,920,000 27,763,917
Total Direct and Overlapping 179,062,155 106,906,072
a2014-15 net assessed valuations as certified by the Tulsa County Assessor.bEstimated percent was determined by the ratio of net assessed value of property subject to taxation in the District to the net assessed value of property in the overlapping unit.cNet general obligation bonded debt outstanding reflects the full amount of the liability for "bonds payable" for the governmental activitiesdThe City of Broken Arrow had judgments totaling $867,188 as of 6/30/2015 that are reported on the tax rolls but not includedas a component of net general obligation bonded debt outstanding.
Union Public Schools - Statistical Section
Direct and Overlapping Governmental Activities DebtAs of June 30, 2015
Year Ended June 30, 2015
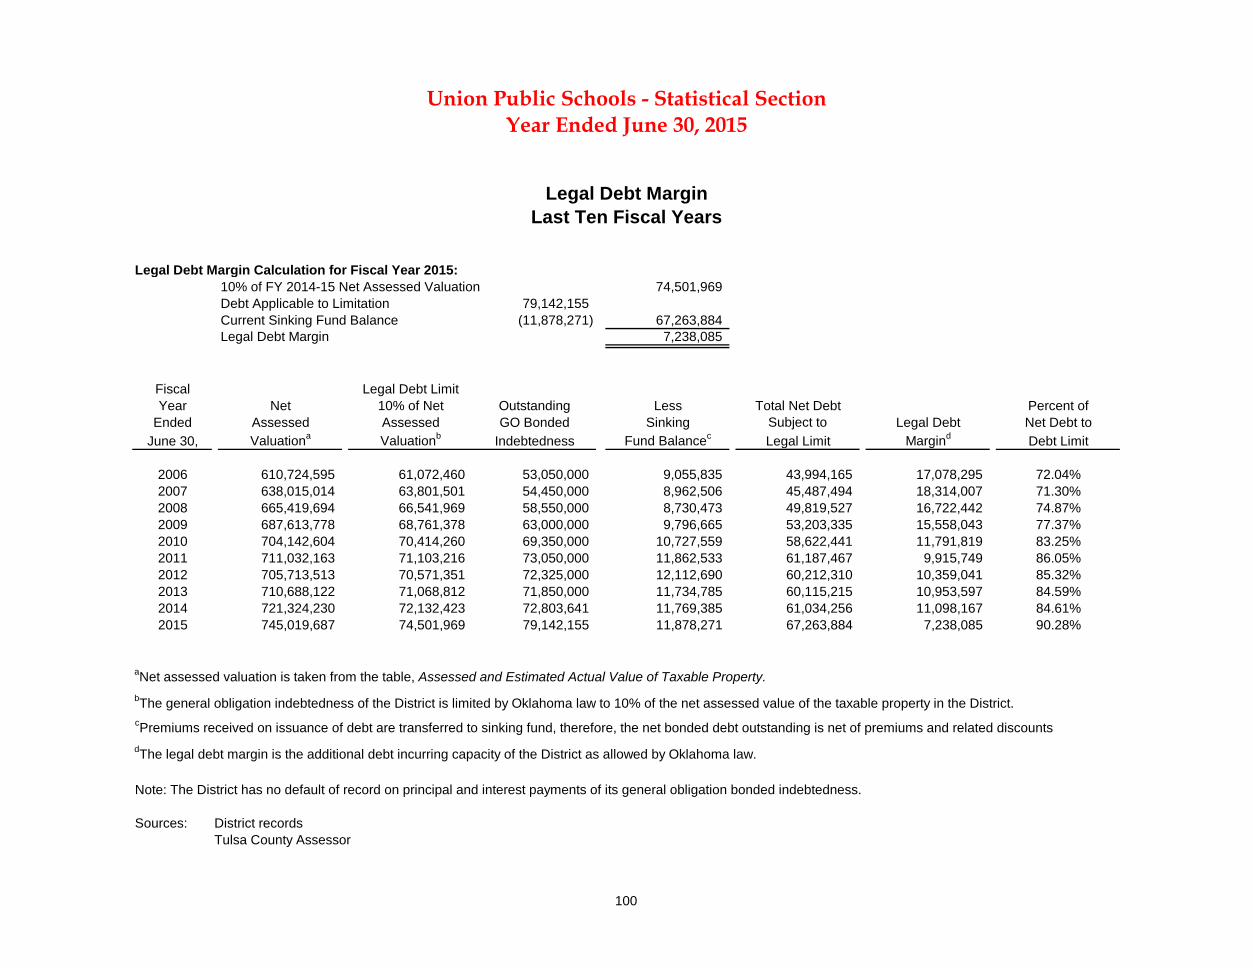
100
Legal Debt Margin Calculation for Fiscal Year 2015:10% of FY 2014-15 Net Assessed Valuation 74,501,969 Debt Applicable to Limitation 79,142,155 Current Sinking Fund Balance (11,878,271) 67,263,884 Legal Debt Margin 7,238,085
Fiscal Legal Debt LimitYear Net 10% of Net Outstanding Less Total Net Debt Percent of
Ended Assessed Assessed GO Bonded Sinking Subject to Legal Debt Net Debt toJune 30, Valuationa Valuationb Indebtedness Fund Balancec Legal Limit Margind Debt Limit
2006 610,724,595 61,072,460 53,050,000 9,055,835 43,994,165 17,078,295 72.04%2007 638,015,014 63,801,501 54,450,000 8,962,506 45,487,494 18,314,007 71.30%2008 665,419,694 66,541,969 58,550,000 8,730,473 49,819,527 16,722,442 74.87%2009 687,613,778 68,761,378 63,000,000 9,796,665 53,203,335 15,558,043 77.37%2010 704,142,604 70,414,260 69,350,000 10,727,559 58,622,441 11,791,819 83.25%2011 711,032,163 71,103,216 73,050,000 11,862,533 61,187,467 9,915,749 86.05%2012 705,713,513 70,571,351 72,325,000 12,112,690 60,212,310 10,359,041 85.32%2013 710,688,122 71,068,812 71,850,000 11,734,785 60,115,215 10,953,597 84.59%2014 721,324,230 72,132,423 72,803,641 11,769,385 61,034,256 11,098,167 84.61%2015 745,019,687 74,501,969 79,142,155 11,878,271 67,263,884 7,238,085 90.28%
aNet assessed valuation is taken from the table, Assessed and Estimated Actual Value of Taxable Property.bThe general obligation indebtedness of the District is limited by Oklahoma law to 10% of the net assessed value of the taxable property in the District.cPremiums received on issuance of debt are transferred to sinking fund, therefore, the net bonded debt outstanding is net of premiums and related discountsdThe legal debt margin is the additional debt incurring capacity of the District as allowed by Oklahoma law.
Note: The District has no default of record on principal and interest payments of its general obligation bonded indebtedness.
Sources: District recordsTulsa County Assessor
Union Public Schools - Statistical Section
Legal Debt MarginLast Ten Fiscal Years
Year Ended June 30, 2015
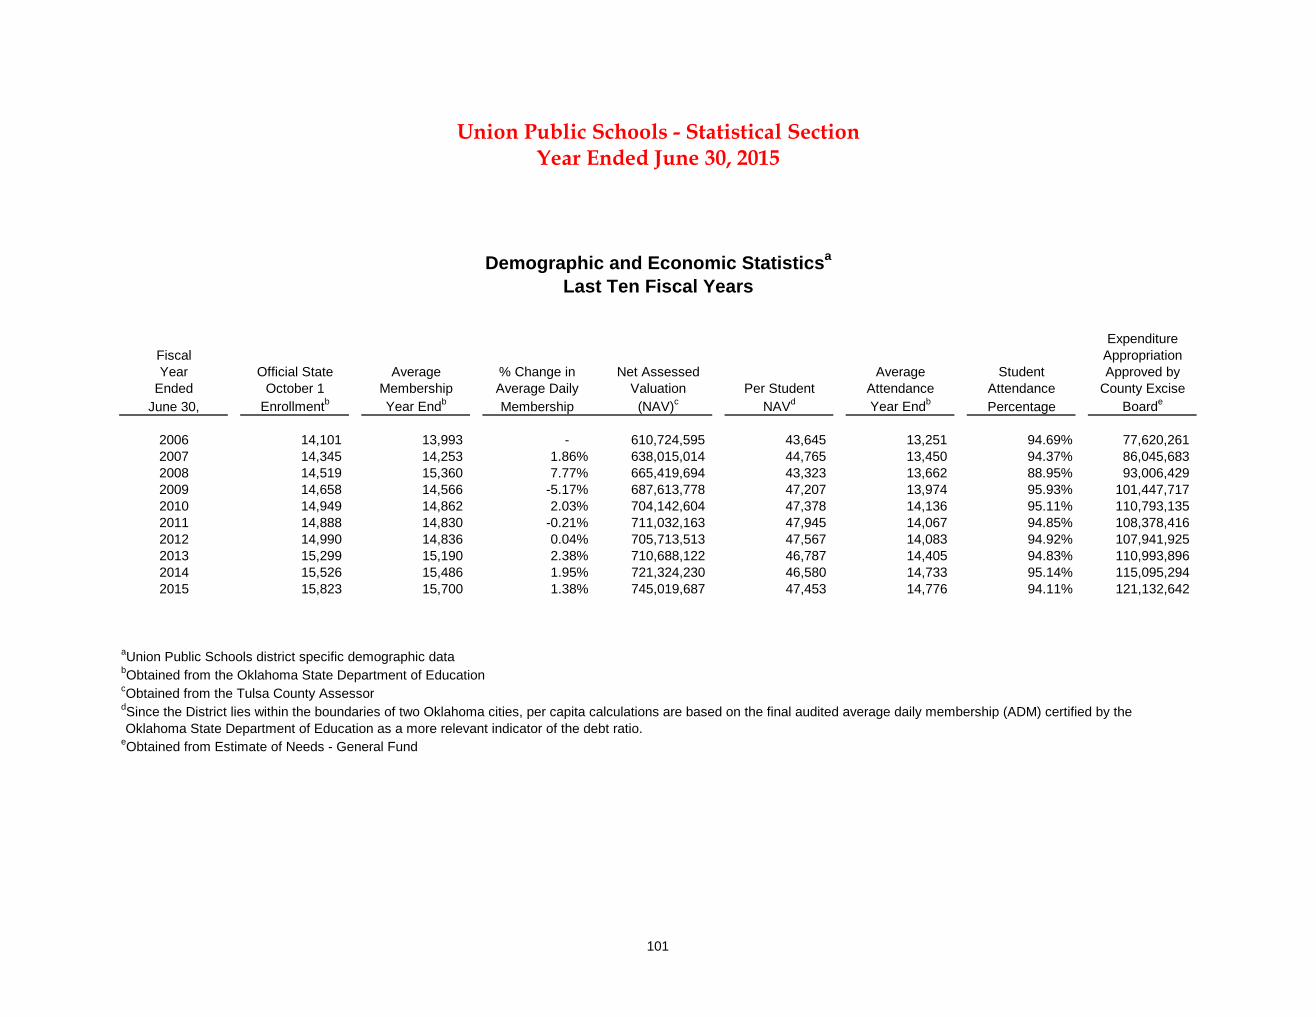
101
ExpenditureFiscal AppropriationYear Official State Average % Change in Net Assessed Average Student Approved by
Ended October 1 Membership Average Daily Valuation Per Student Attendance Attendance County ExciseJune 30, Enrollmentb Year Endb Membership (NAV)c NAVd Year Endb Percentage Boarde
2006 14,101 13,993 - 610,724,595 43,645 13,251 94.69% 77,620,261 2007 14,345 14,253 1.86% 638,015,014 44,765 13,450 94.37% 86,045,683 2008 14,519 15,360 7.77% 665,419,694 43,323 13,662 88.95% 93,006,429 2009 14,658 14,566 -5.17% 687,613,778 47,207 13,974 95.93% 101,447,717 2010 14,949 14,862 2.03% 704,142,604 47,378 14,136 95.11% 110,793,135 2011 14,888 14,830 -0.21% 711,032,163 47,945 14,067 94.85% 108,378,416 2012 14,990 14,836 0.04% 705,713,513 47,567 14,083 94.92% 107,941,925 2013 15,299 15,190 2.38% 710,688,122 46,787 14,405 94.83% 110,993,896 2014 15,526 15,486 1.95% 721,324,230 46,580 14,733 95.14% 115,095,294 2015 15,823 15,700 1.38% 745,019,687 47,453 14,776 94.11% 121,132,642
aUnion Public Schools district specific demographic databObtained from the Oklahoma State Department of EducationcObtained from the Tulsa County AssessordSince the District lies within the boundaries of two Oklahoma cities, per capita calculations are based on the final audited average daily membership (ADM) certified by the Oklahoma State Department of Education as a more relevant indicator of the debt ratio.eObtained from Estimate of Needs - General Fund
Union Public Schools - Statistical Section
Demographic and Economic Statisticsa
Last Ten Fiscal Years
Year Ended June 30, 2015
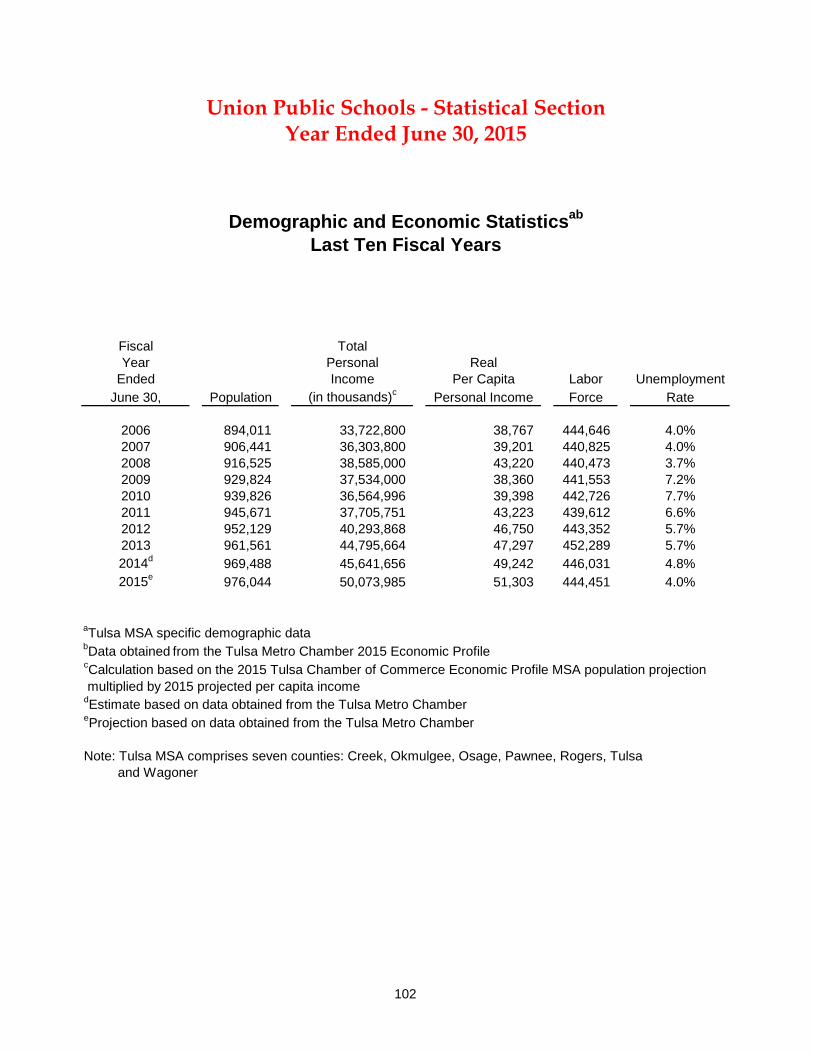
102
Fiscal TotalYear Personal Real
Ended Income Per Capita Labor UnemploymentJune 30, Population (in thousands)c Personal Income Force Rate
2006 894,011 33,722,800 38,767 444,646 4.0%2007 906,441 36,303,800 39,201 440,825 4.0%2008 916,525 38,585,000 43,220 440,473 3.7%2009 929,824 37,534,000 38,360 441,553 7.2%2010 939,826 36,564,996 39,398 442,726 7.7%2011 945,671 37,705,751 43,223 439,612 6.6%2012 952,129 40,293,868 46,750 443,352 5.7%2013 961,561 44,795,664 47,297 452,289 5.7%2014d 969,488 45,641,656 49,242 446,031 4.8%2015e 976,044 50,073,985 51,303 444,451 4.0%
aTulsa MSA specific demographic databData obtained from the Tulsa Metro Chamber 2015 Economic ProfilecCalculation based on the 2015 Tulsa Chamber of Commerce Economic Profile MSA population projection multiplied by 2015 projected per capita incomedEstimate based on data obtained from the Tulsa Metro ChambereProjection based on data obtained from the Tulsa Metro Chamber
Note: Tulsa MSA comprises seven counties: Creek, Okmulgee, Osage, Pawnee, Rogers, Tulsa and Wagoner
Year Ended June 30, 2015Union Public Schools - Statistical Section
Last Ten Fiscal YearsDemographic and Economic Statisticsab
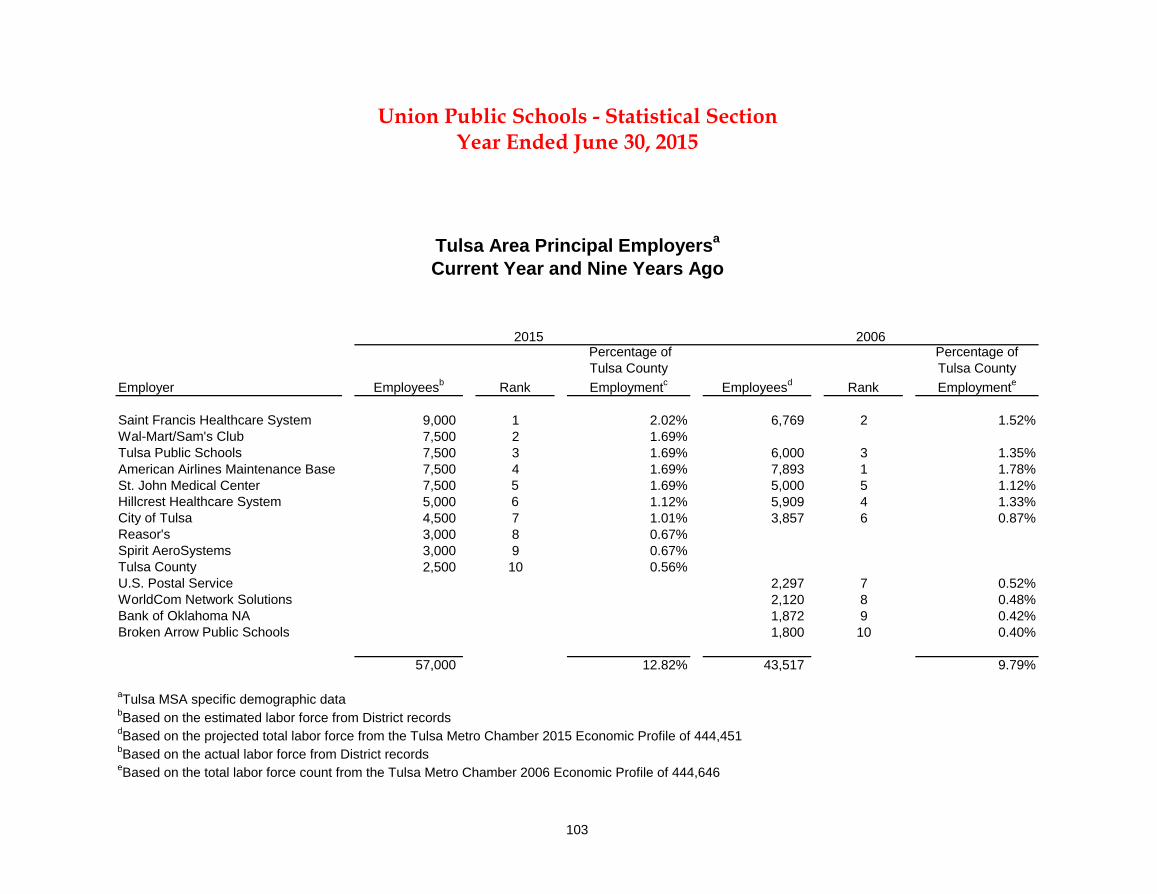
103
Employer Employeesb Rank
Percentage of Tulsa County Employmentc Employeesd Rank
Percentage of Tulsa County Employmente
Saint Francis Healthcare System 9,000 1 2.02% 6,769 2 1.52%Wal-Mart/Sam's Club 7,500 2 1.69%Tulsa Public Schools 7,500 3 1.69% 6,000 3 1.35%American Airlines Maintenance Base 7,500 4 1.69% 7,893 1 1.78%St. John Medical Center 7,500 5 1.69% 5,000 5 1.12%Hillcrest Healthcare System 5,000 6 1.12% 5,909 4 1.33%City of Tulsa 4,500 7 1.01% 3,857 6 0.87%Reasor's 3,000 8 0.67%Spirit AeroSystems 3,000 9 0.67%Tulsa County 2,500 10 0.56%U.S. Postal Service 2,297 7 0.52%WorldCom Network Solutions 2,120 8 0.48%Bank of Oklahoma NA 1,872 9 0.42%Broken Arrow Public Schools 1,800 10 0.40%
57,000 12.82% 43,517 9.79%
aTulsa MSA specific demographic databBased on the estimated labor force from District recordsdBased on the projected total labor force from the Tulsa Metro Chamber 2015 Economic Profile of 444,451
eBased on the total labor force count from the Tulsa Metro Chamber 2006 Economic Profile of 444,646
2015 2006
Union Public Schools - Statistical Section
Tulsa Area Principal Employersa
Current Year and Nine Years Ago
bBased on the actual labor force from District records
Year Ended June 30, 2015

104
This page is intentionally left blank.
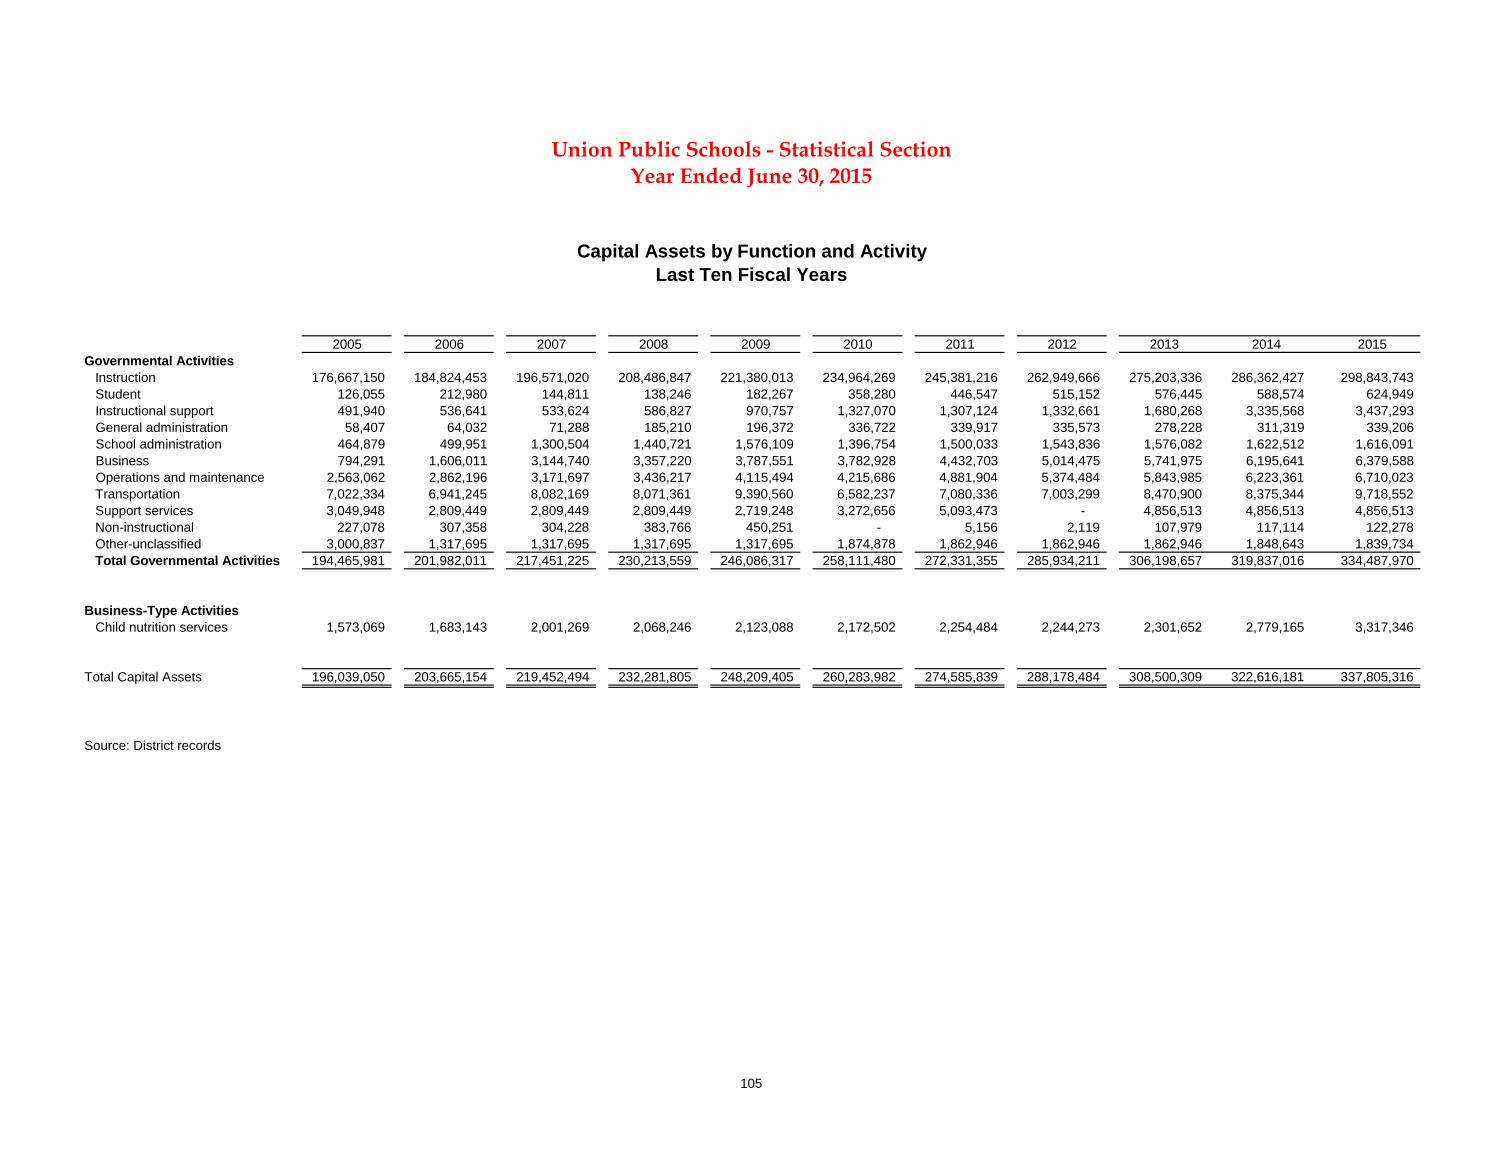
105
2005 2006 2007 2008 2009 2010 2011 2012 2013 2014 2015Governmental Activities Instruction 176,667,150 184,824,453 196,571,020 208,486,847 221,380,013 234,964,269 245,381,216 262,949,666 275,203,336 286,362,427 298,843,743 Student 126,055 212,980 144,811 138,246 182,267 358,280 446,547 515,152 576,445 588,574 624,949 Instructional support 491,940 536,641 533,624 586,827 970,757 1,327,070 1,307,124 1,332,661 1,680,268 3,335,568 3,437,293 General administration 58,407 64,032 71,288 185,210 196,372 336,722 339,917 335,573 278,228 311,319 339,206 School administration 464,879 499,951 1,300,504 1,440,721 1,576,109 1,396,754 1,500,033 1,543,836 1,576,082 1,622,512 1,616,091 Business 794,291 1,606,011 3,144,740 3,357,220 3,787,551 3,782,928 4,432,703 5,014,475 5,741,975 6,195,641 6,379,588 Operations and maintenance 2,563,062 2,862,196 3,171,697 3,436,217 4,115,494 4,215,686 4,881,904 5,374,484 5,843,985 6,223,361 6,710,023 Transportation 7,022,334 6,941,245 8,082,169 8,071,361 9,390,560 6,582,237 7,080,336 7,003,299 8,470,900 8,375,344 9,718,552 Support services 3,049,948 2,809,449 2,809,449 2,809,449 2,719,248 3,272,656 5,093,473 - 4,856,513 4,856,513 4,856,513 Non-instructional 227,078 307,358 304,228 383,766 450,251 - 5,156 2,119 107,979 117,114 122,278 Other-unclassified 3,000,837 1,317,695 1,317,695 1,317,695 1,317,695 1,874,878 1,862,946 1,862,946 1,862,946 1,848,643 1,839,734 Total Governmental Activities 194,465,981 201,982,011 217,451,225 230,213,559 246,086,317 258,111,480 272,331,355 285,934,211 306,198,657 319,837,016 334,487,970
Business-Type Activities Child nutrition services 1,573,069 1,683,143 2,001,269 2,068,246 2,123,088 2,172,502 2,254,484 2,244,273 2,301,652 2,779,165 3,317,346
Total Capital Assets 196,039,050 203,665,154 219,452,494 232,281,805 248,209,405 260,283,982 274,585,839 288,178,484 308,500,309 322,616,181 337,805,316
Source: District records
Last Ten Fiscal YearsCapital Assets by Function and Activity
Year Ended June 30, 2015Union Public Schools - Statistical Section
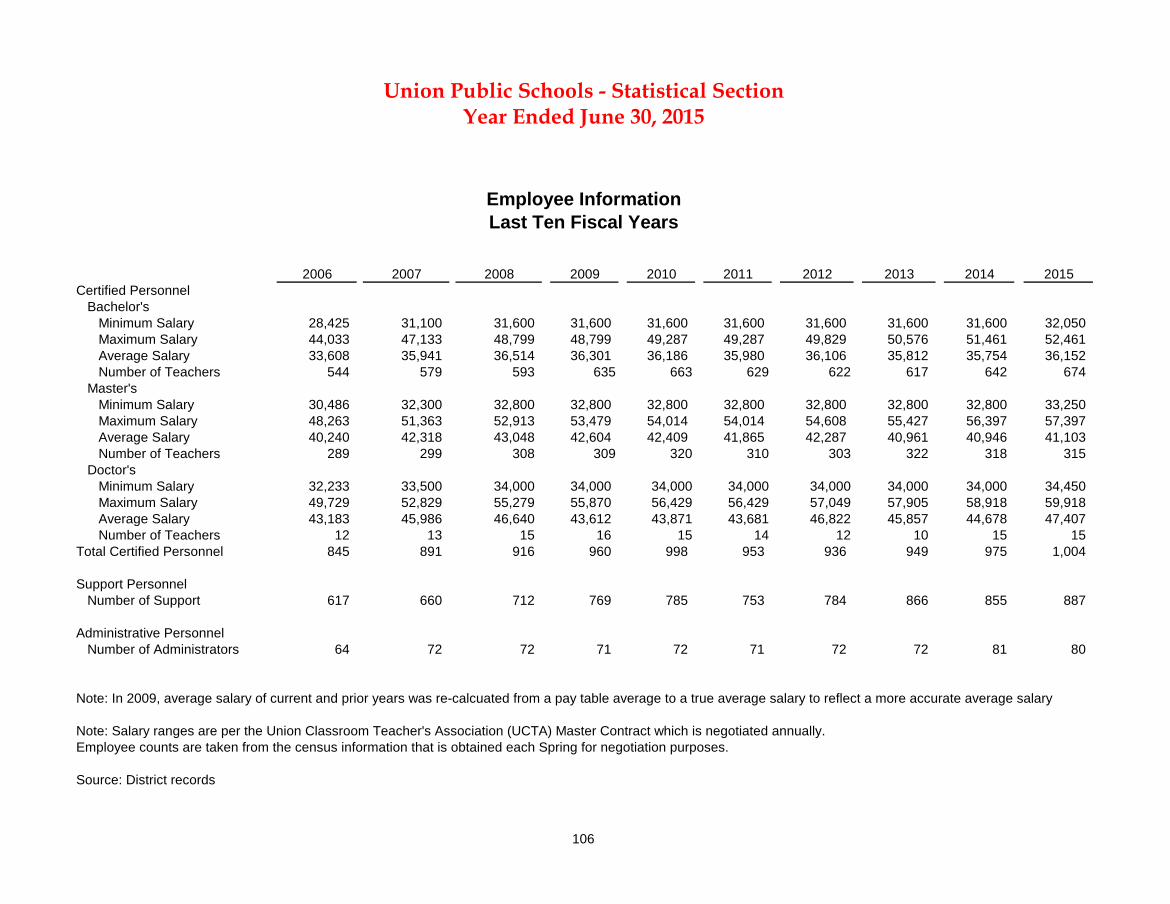
106
2006 2007 2008 2009 2010 2011 2012 2013 2014 2015Certified Personnel Bachelor's Minimum Salary 28,425 31,100 31,600 31,600 31,600 31,600 31,600 31,600 31,600 32,050 Maximum Salary 44,033 47,133 48,799 48,799 49,287 49,287 49,829 50,576 51,461 52,461 Average Salary 33,608 35,941 36,514 36,301 36,186 35,980 36,106 35,812 35,754 36,152 Number of Teachers 544 579 593 635 663 629 622 617 642 674 Master's Minimum Salary 30,486 32,300 32,800 32,800 32,800 32,800 32,800 32,800 32,800 33,250 Maximum Salary 48,263 51,363 52,913 53,479 54,014 54,014 54,608 55,427 56,397 57,397 Average Salary 40,240 42,318 43,048 42,604 42,409 41,865 42,287 40,961 40,946 41,103 Number of Teachers 289 299 308 309 320 310 303 322 318 315 Doctor's Minimum Salary 32,233 33,500 34,000 34,000 34,000 34,000 34,000 34,000 34,000 34,450 Maximum Salary 49,729 52,829 55,279 55,870 56,429 56,429 57,049 57,905 58,918 59,918 Average Salary 43,183 45,986 46,640 43,612 43,871 43,681 46,822 45,857 44,678 47,407 Number of Teachers 12 13 15 16 15 14 12 10 15 15 Total Certified Personnel 845 891 916 960 998 953 936 949 975 1,004
Support Personnel Number of Support 617 660 712 769 785 753 784 866 855 887
Administrative Personnel Number of Administrators 64 72 72 71 72 71 72 72 81 80
Note: In 2009, average salary of current and prior years was re-calcuated from a pay table average to a true average salary to reflect a more accurate average salary
Note: Salary ranges are per the Union Classroom Teacher's Association (UCTA) Master Contract which is negotiated annually.
Source: District records
Employee counts are taken from the census information that is obtained each Spring for negotiation purposes.
Last Ten Fiscal YearsEmployee Information
Year Ended June 30, 2015Union Public Schools - Statistical Section
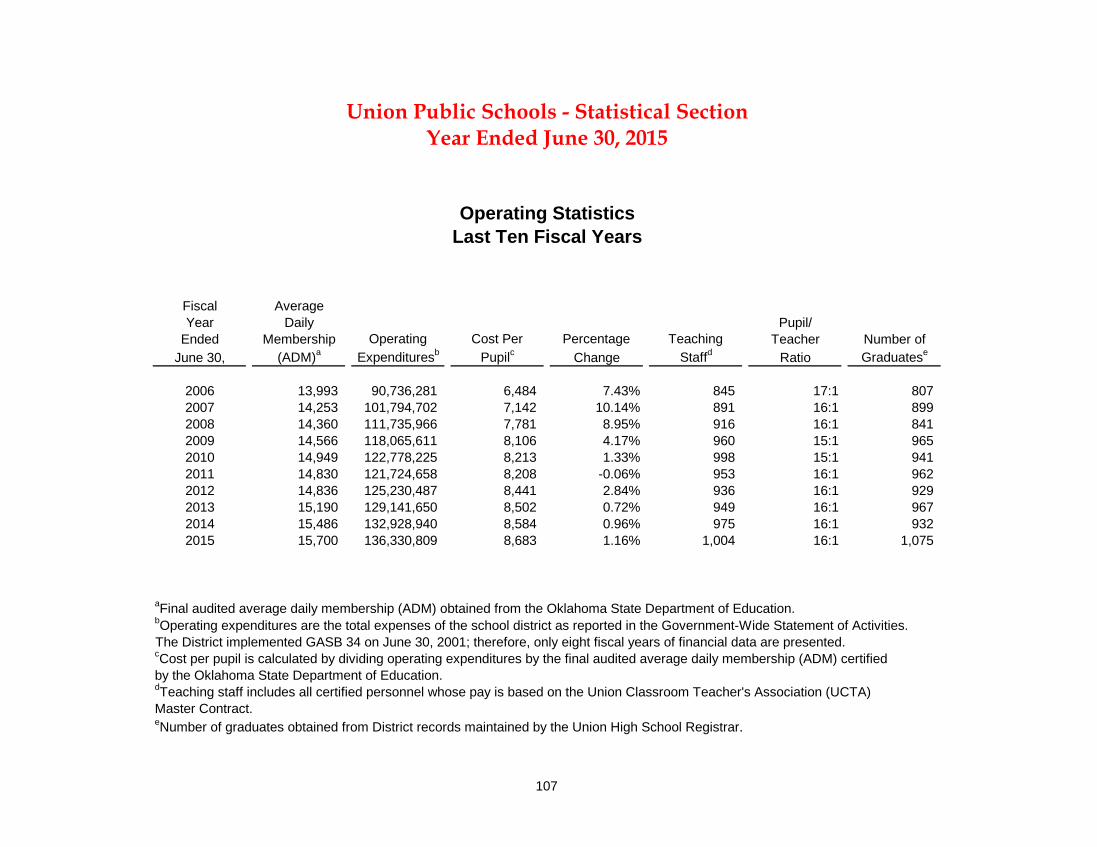
107
Fiscal AverageYear Daily Pupil/
Ended Membership Operating Cost Per Percentage Teaching Teacher Number ofJune 30, (ADM)a Expendituresb Pupilc Change Staffd Ratio Graduatese
2006 13,993 90,736,281 6,484 7.43% 845 17:1 807 2007 14,253 101,794,702 7,142 10.14% 891 16:1 899 2008 14,360 111,735,966 7,781 8.95% 916 16:1 841 2009 14,566 118,065,611 8,106 4.17% 960 15:1 965 2010 14,949 122,778,225 8,213 1.33% 998 15:1 941 2011 14,830 121,724,658 8,208 -0.06% 953 16:1 962 2012 14,836 125,230,487 8,441 2.84% 936 16:1 929 2013 15,190 129,141,650 8,502 0.72% 949 16:1 967 2014 15,486 132,928,940 8,584 0.96% 975 16:1 932 2015 15,700 136,330,809 8,683 1.16% 1,004 16:1 1,075
aFinal audited average daily membership (ADM) obtained from the Oklahoma State Department of Education.
eNumber of graduates obtained from District records maintained by the Union High School Registrar.
dTeaching staff includes all certified personnel whose pay is based on the Union Classroom Teacher's Association (UCTA) Master Contract.
cCost per pupil is calculated by dividing operating expenditures by the final audited average daily membership (ADM) certified by the Oklahoma State Department of Education.
The District implemented GASB 34 on June 30, 2001; therefore, only eight fiscal years of financial data are presented.
Union Public Schools - Statistical Section
Operating StatisticsLast Ten Fiscal Years
bOperating expenditures are the total expenses of the school district as reported in the Government-Wide Statement of Activities.
Year Ended June 30, 2015
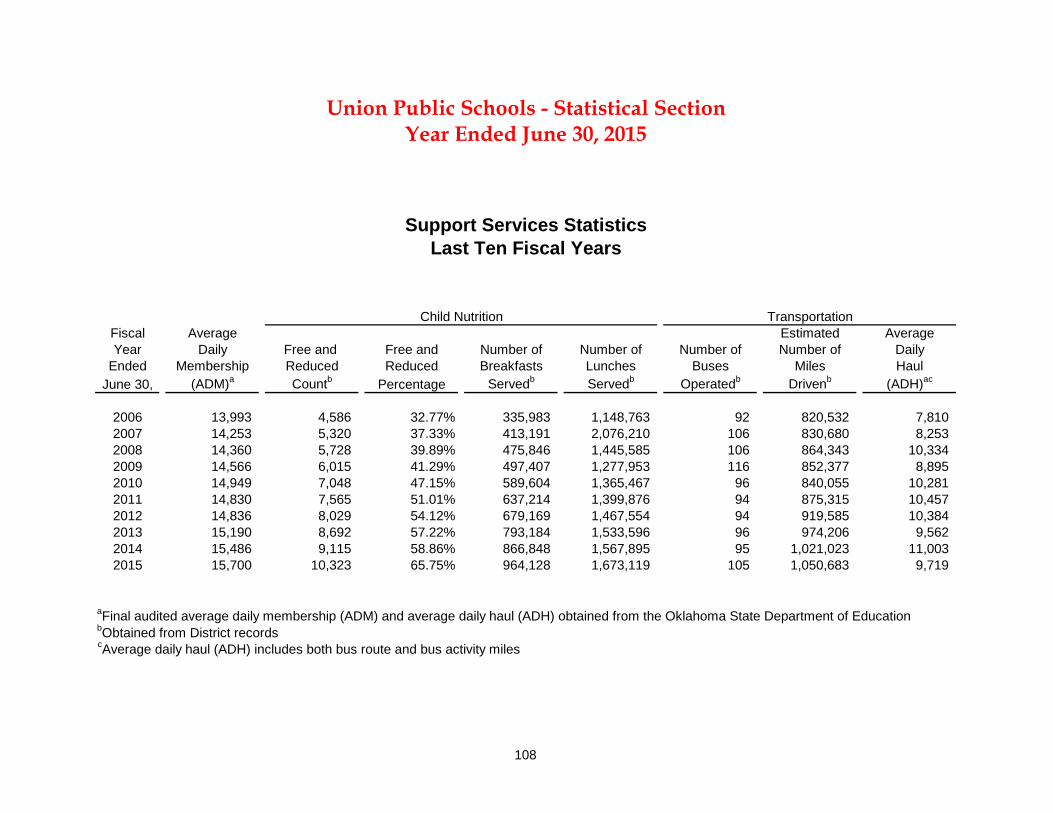
108
Fiscal Average Estimated AverageYear Daily Free and Free and Number of Number of Number of Number of Daily
Ended Membership Reduced Reduced Breakfasts Lunches Buses Miles HaulJune 30, (ADM)a Countb Percentage Servedb Servedb Operatedb Drivenb (ADH)ac
2006 13,993 4,586 32.77% 335,983 1,148,763 92 820,532 7,810 2007 14,253 5,320 37.33% 413,191 2,076,210 106 830,680 8,253 2008 14,360 5,728 39.89% 475,846 1,445,585 106 864,343 10,334 2009 14,566 6,015 41.29% 497,407 1,277,953 116 852,377 8,895 2010 14,949 7,048 47.15% 589,604 1,365,467 96 840,055 10,281 2011 14,830 7,565 51.01% 637,214 1,399,876 94 875,315 10,457 2012 14,836 8,029 54.12% 679,169 1,467,554 94 919,585 10,384 2013 15,190 8,692 57.22% 793,184 1,533,596 96 974,206 9,562 2014 15,486 9,115 58.86% 866,848 1,567,895 95 1,021,023 11,003 2015 15,700 10,323 65.75% 964,128 1,673,119 105 1,050,683 9,719
aFinal audited average daily membership (ADM) and average daily haul (ADH) obtained from the Oklahoma State Department of Education
cAverage daily haul (ADH) includes both bus route and bus activity miles
Union Public Schools - Statistical SectionYear Ended June 30, 2015
bObtained from District records
TransportationChild Nutrition
Last Ten Fiscal YearsSupport Services Statistics
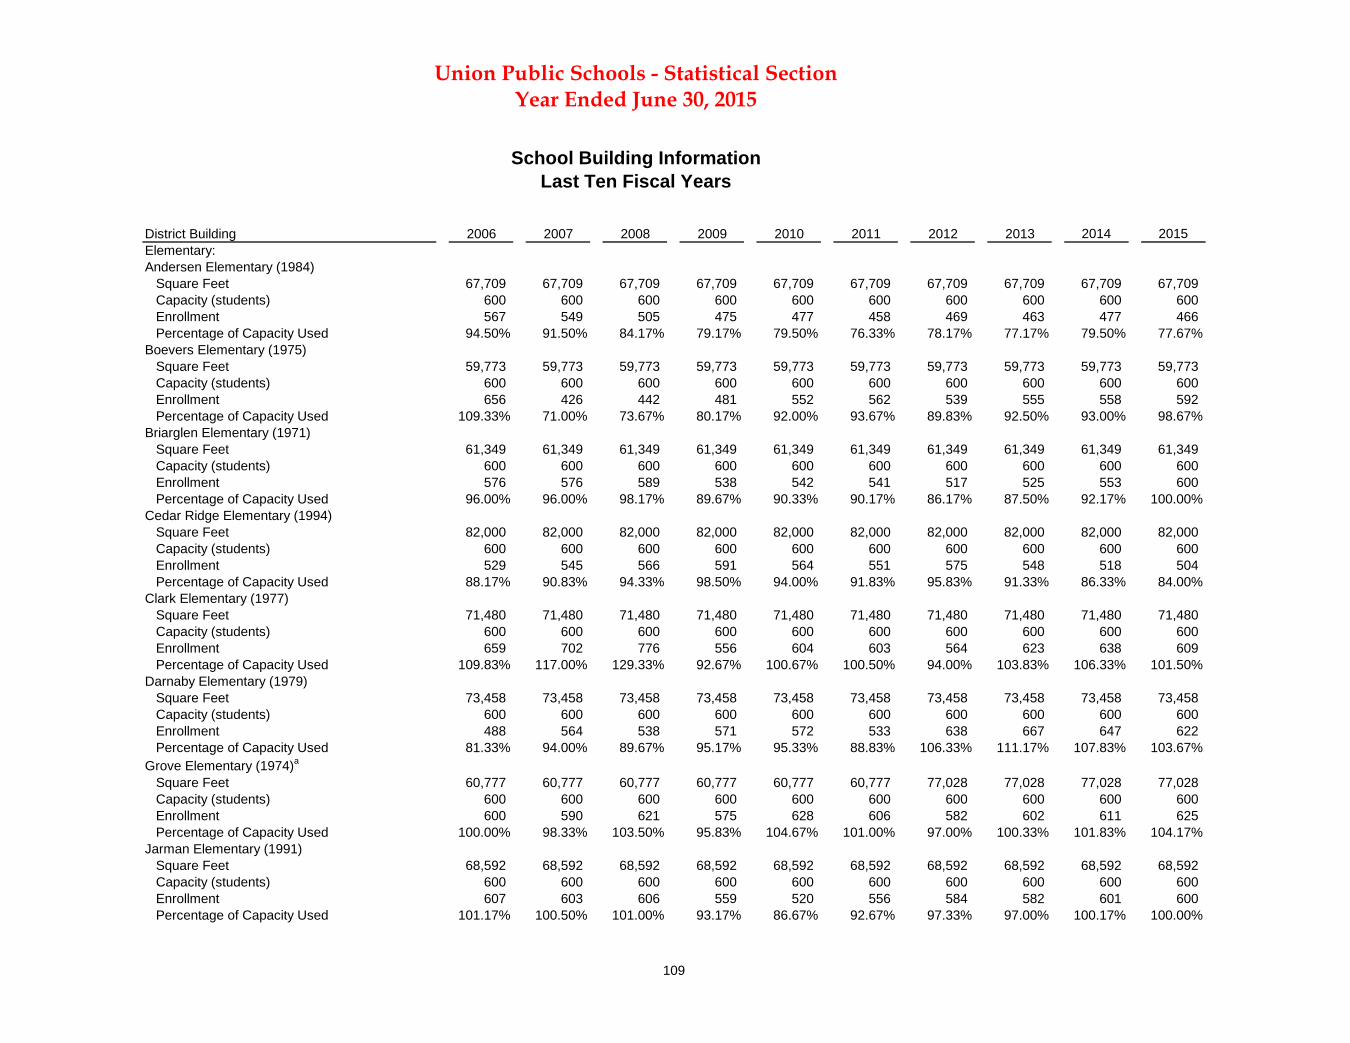
109
District Building 2006 2007 2008 2009 2010 2011 2012 2013 2014 2015Elementary:Andersen Elementary (1984) Square Feet 67,709 67,709 67,709 67,709 67,709 67,709 67,709 67,709 67,709 67,709 Capacity (students) 600 600 600 600 600 600 600 600 600 600 Enrollment 567 549 505 475 477 458 469 463 477 466 Percentage of Capacity Used 94.50% 91.50% 84.17% 79.17% 79.50% 76.33% 78.17% 77.17% 79.50% 77.67%Boevers Elementary (1975) Square Feet 59,773 59,773 59,773 59,773 59,773 59,773 59,773 59,773 59,773 59,773 Capacity (students) 600 600 600 600 600 600 600 600 600 600 Enrollment 656 426 442 481 552 562 539 555 558 592 Percentage of Capacity Used 109.33% 71.00% 73.67% 80.17% 92.00% 93.67% 89.83% 92.50% 93.00% 98.67%Briarglen Elementary (1971) Square Feet 61,349 61,349 61,349 61,349 61,349 61,349 61,349 61,349 61,349 61,349 Capacity (students) 600 600 600 600 600 600 600 600 600 600 Enrollment 576 576 589 538 542 541 517 525 553 600 Percentage of Capacity Used 96.00% 96.00% 98.17% 89.67% 90.33% 90.17% 86.17% 87.50% 92.17% 100.00%Cedar Ridge Elementary (1994) Square Feet 82,000 82,000 82,000 82,000 82,000 82,000 82,000 82,000 82,000 82,000 Capacity (students) 600 600 600 600 600 600 600 600 600 600 Enrollment 529 545 566 591 564 551 575 548 518 504 Percentage of Capacity Used 88.17% 90.83% 94.33% 98.50% 94.00% 91.83% 95.83% 91.33% 86.33% 84.00%Clark Elementary (1977) Square Feet 71,480 71,480 71,480 71,480 71,480 71,480 71,480 71,480 71,480 71,480 Capacity (students) 600 600 600 600 600 600 600 600 600 600 Enrollment 659 702 776 556 604 603 564 623 638 609 Percentage of Capacity Used 109.83% 117.00% 129.33% 92.67% 100.67% 100.50% 94.00% 103.83% 106.33% 101.50%Darnaby Elementary (1979) Square Feet 73,458 73,458 73,458 73,458 73,458 73,458 73,458 73,458 73,458 73,458 Capacity (students) 600 600 600 600 600 600 600 600 600 600 Enrollment 488 564 538 571 572 533 638 667 647 622 Percentage of Capacity Used 81.33% 94.00% 89.67% 95.17% 95.33% 88.83% 106.33% 111.17% 107.83% 103.67%Grove Elementary (1974)a
Square Feet 60,777 60,777 60,777 60,777 60,777 60,777 77,028 77,028 77,028 77,028 Capacity (students) 600 600 600 600 600 600 600 600 600 600 Enrollment 600 590 621 575 628 606 582 602 611 625 Percentage of Capacity Used 100.00% 98.33% 103.50% 95.83% 104.67% 101.00% 97.00% 100.33% 101.83% 104.17%Jarman Elementary (1991) Square Feet 68,592 68,592 68,592 68,592 68,592 68,592 68,592 68,592 68,592 68,592 Capacity (students) 600 600 600 600 600 600 600 600 600 600 Enrollment 607 603 606 559 520 556 584 582 601 600 Percentage of Capacity Used 101.17% 100.50% 101.00% 93.17% 86.67% 92.67% 97.33% 97.00% 100.17% 100.00%
Year Ended June 30, 2015Union Public Schools - Statistical Section
Last Ten Fiscal YearsSchool Building Information
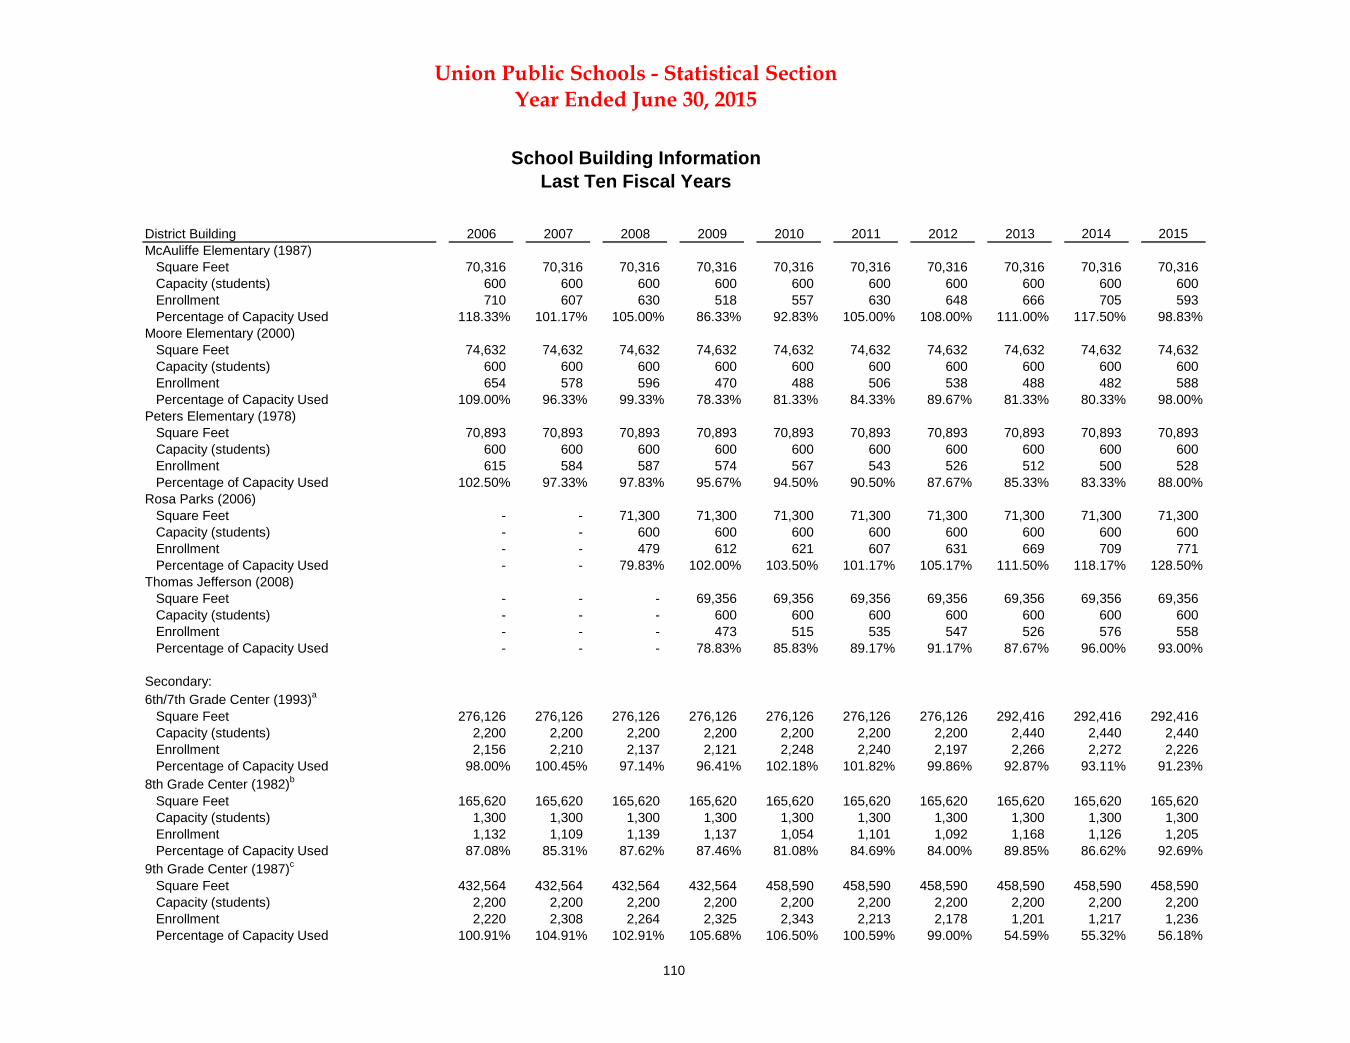
110
District Building 2006 2007 2008 2009 2010 2011 2012 2013 2014 2015
Year Ended June 30, 2015Union Public Schools - Statistical Section
Last Ten Fiscal YearsSchool Building Information
McAuliffe Elementary (1987) Square Feet 70,316 70,316 70,316 70,316 70,316 70,316 70,316 70,316 70,316 70,316 Capacity (students) 600 600 600 600 600 600 600 600 600 600 Enrollment 710 607 630 518 557 630 648 666 705 593 Percentage of Capacity Used 118.33% 101.17% 105.00% 86.33% 92.83% 105.00% 108.00% 111.00% 117.50% 98.83%Moore Elementary (2000) Square Feet 74,632 74,632 74,632 74,632 74,632 74,632 74,632 74,632 74,632 74,632 Capacity (students) 600 600 600 600 600 600 600 600 600 600 Enrollment 654 578 596 470 488 506 538 488 482 588 Percentage of Capacity Used 109.00% 96.33% 99.33% 78.33% 81.33% 84.33% 89.67% 81.33% 80.33% 98.00%Peters Elementary (1978) Square Feet 70,893 70,893 70,893 70,893 70,893 70,893 70,893 70,893 70,893 70,893 Capacity (students) 600 600 600 600 600 600 600 600 600 600 Enrollment 615 584 587 574 567 543 526 512 500 528 Percentage of Capacity Used 102.50% 97.33% 97.83% 95.67% 94.50% 90.50% 87.67% 85.33% 83.33% 88.00%Rosa Parks (2006) Square Feet - - 71,300 71,300 71,300 71,300 71,300 71,300 71,300 71,300 Capacity (students) - - 600 600 600 600 600 600 600 600 Enrollment - - 479 612 621 607 631 669 709 771 Percentage of Capacity Used - - 79.83% 102.00% 103.50% 101.17% 105.17% 111.50% 118.17% 128.50%Thomas Jefferson (2008) Square Feet - - - 69,356 69,356 69,356 69,356 69,356 69,356 69,356 Capacity (students) - - - 600 600 600 600 600 600 600 Enrollment - - - 473 515 535 547 526 576 558 Percentage of Capacity Used - - - 78.83% 85.83% 89.17% 91.17% 87.67% 96.00% 93.00%
Secondary:6th/7th Grade Center (1993)a
Square Feet 276,126 276,126 276,126 276,126 276,126 276,126 276,126 292,416 292,416 292,416 Capacity (students) 2,200 2,200 2,200 2,200 2,200 2,200 2,200 2,440 2,440 2,440 Enrollment 2,156 2,210 2,137 2,121 2,248 2,240 2,197 2,266 2,272 2,226 Percentage of Capacity Used 98.00% 100.45% 97.14% 96.41% 102.18% 101.82% 99.86% 92.87% 93.11% 91.23%8th Grade Center (1982)b
Square Feet 165,620 165,620 165,620 165,620 165,620 165,620 165,620 165,620 165,620 165,620 Capacity (students) 1,300 1,300 1,300 1,300 1,300 1,300 1,300 1,300 1,300 1,300 Enrollment 1,132 1,109 1,139 1,137 1,054 1,101 1,092 1,168 1,126 1,205 Percentage of Capacity Used 87.08% 85.31% 87.62% 87.46% 81.08% 84.69% 84.00% 89.85% 86.62% 92.69%9th Grade Center (1987)c
Square Feet 432,564 432,564 432,564 432,564 458,590 458,590 458,590 458,590 458,590 458,590 Capacity (students) 2,200 2,200 2,200 2,200 2,200 2,200 2,200 2,200 2,200 2,200 Enrollment 2,220 2,308 2,264 2,325 2,343 2,213 2,178 1,201 1,217 1,236 Percentage of Capacity Used 100.91% 104.91% 102.91% 105.68% 106.50% 100.59% 99.00% 54.59% 55.32% 56.18%
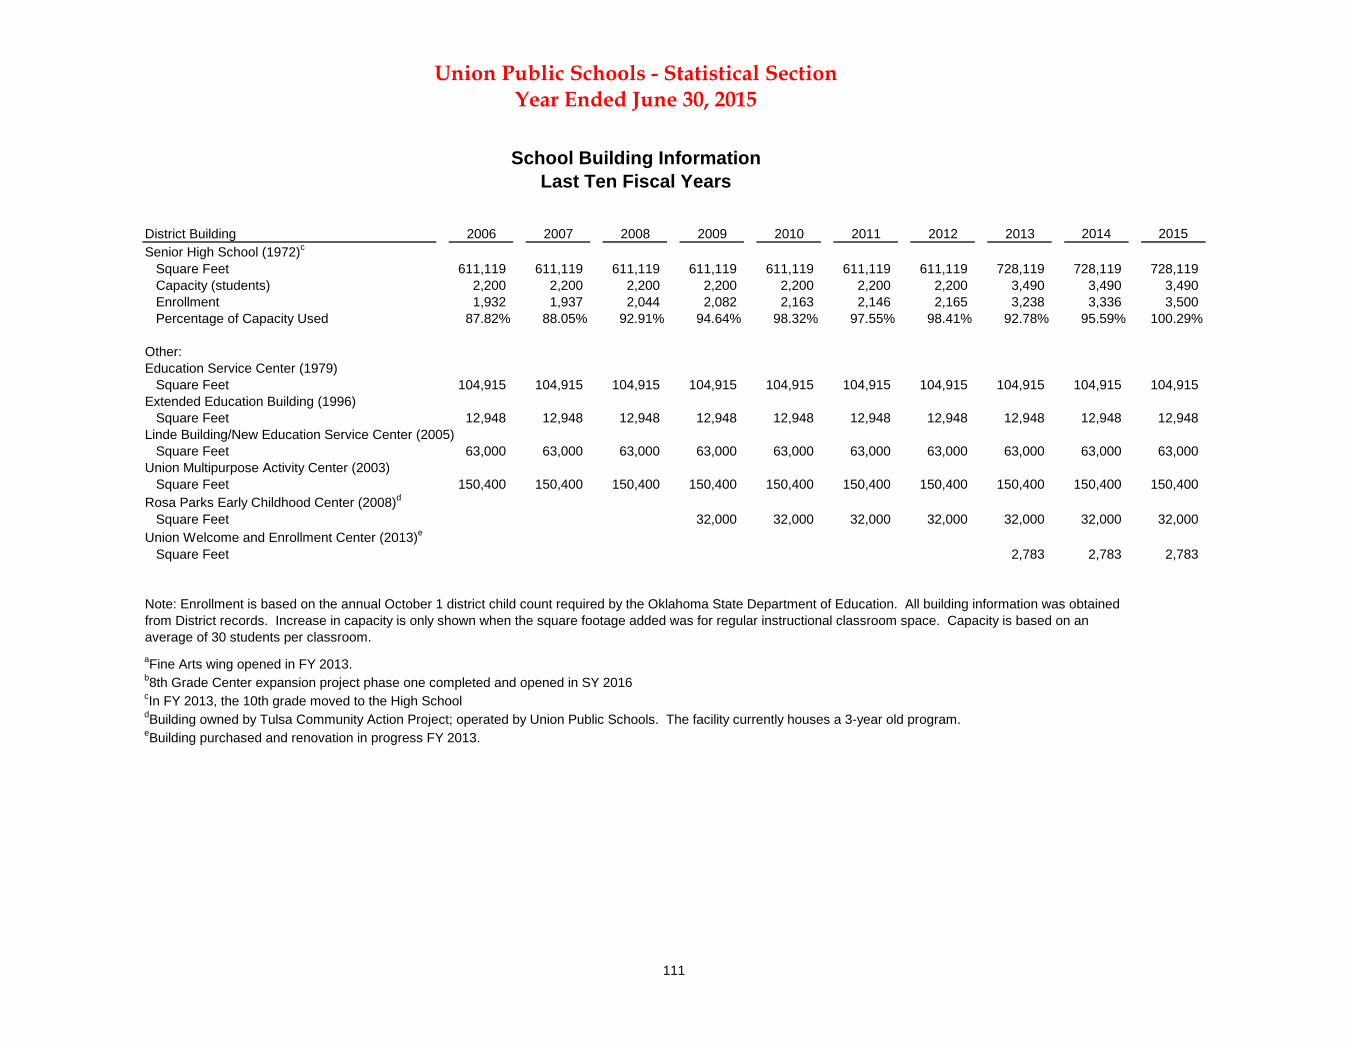
111
District Building 2006 2007 2008 2009 2010 2011 2012 2013 2014 2015
Year Ended June 30, 2015Union Public Schools - Statistical Section
Last Ten Fiscal YearsSchool Building Information
Senior High School (1972)c
Square Feet 611,119 611,119 611,119 611,119 611,119 611,119 611,119 728,119 728,119 728,119 Capacity (students) 2,200 2,200 2,200 2,200 2,200 2,200 2,200 3,490 3,490 3,490 Enrollment 1,932 1,937 2,044 2,082 2,163 2,146 2,165 3,238 3,336 3,500 Percentage of Capacity Used 87.82% 88.05% 92.91% 94.64% 98.32% 97.55% 98.41% 92.78% 95.59% 100.29%
Other:Education Service Center (1979) Square Feet 104,915 104,915 104,915 104,915 104,915 104,915 104,915 104,915 104,915 104,915 Extended Education Building (1996) Square Feet 12,948 12,948 12,948 12,948 12,948 12,948 12,948 12,948 12,948 12,948 Linde Building/New Education Service Center (2005) Square Feet 63,000 63,000 63,000 63,000 63,000 63,000 63,000 63,000 63,000 63,000 Union Multipurpose Activity Center (2003) Square Feet 150,400 150,400 150,400 150,400 150,400 150,400 150,400 150,400 150,400 150,400 Rosa Parks Early Childhood Center (2008)d
Square Feet 32,000 32,000 32,000 32,000 32,000 32,000 32,000 Union Welcome and Enrollment Center (2013)e
Square Feet 2,783 2,783 2,783
aFine Arts wing opened in FY 2013.b8th Grade Center expansion project phase one completed and opened in SY 2016cIn FY 2013, the 10th grade moved to the High SchooldBuilding owned by Tulsa Community Action Project; operated by Union Public Schools. The facility currently houses a 3-year old program.eBuilding purchased and renovation in progress FY 2013.
Note: Enrollment is based on the annual October 1 district child count required by the Oklahoma State Department of Education. All building information was obtained from District records. Increase in capacity is only shown when the square footage added was for regular instructional classroom space. Capacity is based on an average of 30 students per classroom.
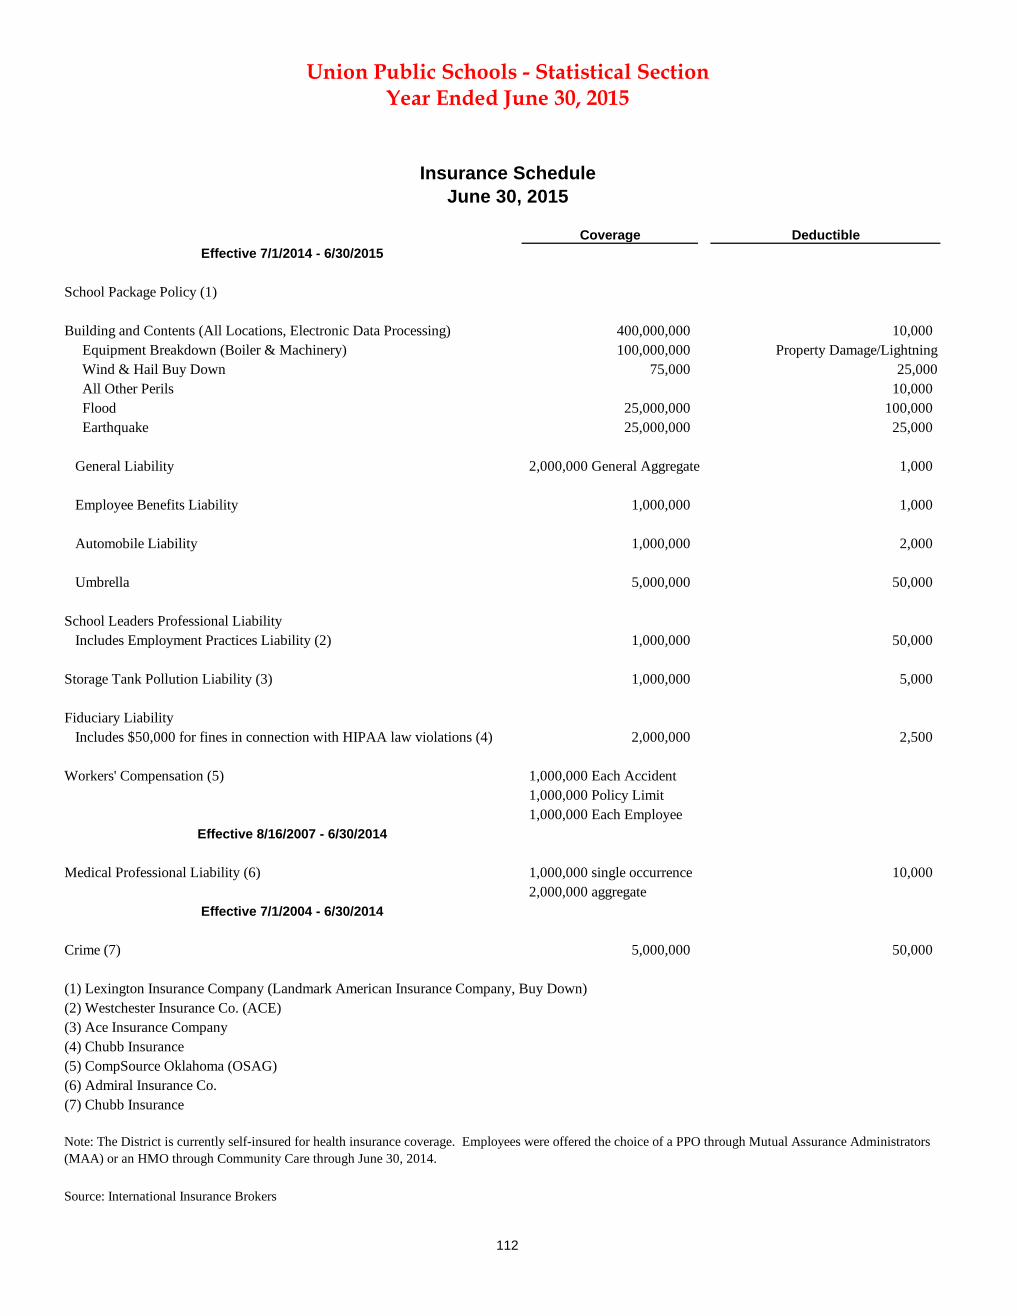
112
Coverage DeductibleEffective 7/1/2014 - 6/30/2015
School Package Policy (1)
Building and Contents (All Locations, Electronic Data Processing) 400,000,000 10,000 Equipment Breakdown (Boiler & Machinery) 100,000,000 Property Damage/Lightning Wind & Hail Buy Down 75,000 25,000 All Other Perils 10,000 Flood 25,000,000 100,000 Earthquake 25,000,000 25,000
General Liability 2,000,000 General Aggregate 1,000
Employee Benefits Liability 1,000,000 1,000
Automobile Liability 1,000,000 2,000
Umbrella 5,000,000 50,000
School Leaders Professional Liability Includes Employment Practices Liability (2) 1,000,000 50,000
Storage Tank Pollution Liability (3) 1,000,000 5,000
Fiduciary Liability Includes $50,000 for fines in connection with HIPAA law violations (4) 2,000,000 2,500
Workers' Compensation (5) 1,000,000 Each Accident1,000,000 Policy Limit1,000,000 Each Employee
Effective 8/16/2007 - 6/30/2014
Medical Professional Liability (6) 1,000,000 single occurrence 10,000 2,000,000 aggregate
Effective 7/1/2004 - 6/30/2014
Crime (7) 5,000,000 50,000
(1) Lexington Insurance Company (Landmark American Insurance Company, Buy Down)(2) Westchester Insurance Co. (ACE)(3) Ace Insurance Company(4) Chubb Insurance(5) CompSource Oklahoma (OSAG)(6) Admiral Insurance Co.(7) Chubb Insurance
Source: International Insurance Brokers
Union Public Schools - Statistical Section
Insurance ScheduleJune 30, 2015
Note: The District is currently self-insured for health insurance coverage. Employees were offered the choice of a PPO through Mutual Assurance Administrators (MAA) or an HMO through Community Care through June 30, 2014.
Year Ended June 30, 2015