Embed Size (px)
Citation preview
P
O A K RIDGE N A T I O N A L LABORATORY operated by
U N I O N CARBIDE CORPORATION for the
U.S. ATOMIC ENERGY COMMISSION
ORNL- TM-2315
COPY NO. -3 85 DATE - 8/27/68
Instrumentation and Controls Division
MEASUREMENT OF HELIUM VOID FRACTION IN THE MSRE
FUEL SALT USING NEUTRON-NOISE ANALYSIS
D. N. Fry R. C. Kryter J. C. Robinson'
ABSTRACT
Investigations were made a t the MSRE to determine i f the amount of helium gas i n the fuel salt could be measured using neutron noise analysis. The neutron power spectral density (NPSD) was measured at different reactor operating conditions and compared with analytical model predictions of the NPSD for the same conditions.
The results of experimental tests and analytical studies have shown that the principal source of small neutron density fluctuation observed in the MSRE i s helium bubbles circulating in the fuel salt. The NPSD was most sensitive to changes in
50 when the average core outlet fuel temperature was decreased from 1225 to 118OOF. The measurements showed that NPSD in the frequency range from 0.5 to 2 cps varies as the square of helium void fraction as predicted by the model, and that the minimum void fraction i s more nearly zero than the previously accepted value of 0.16.
. fuel temperature: the NPSD in the region of 1 cps increased b y a factor of almost
It i s concluded that changes in the circulating void fraction can be inferred with good sensitivity directly from neutron noise measurements, and, consequently, NPSD can complement and enhance the value of the MSRE reactivity balance ca lcula tions.
'Consultant from the Nuclear Engineering Department, University of Tennessee, Knoxville, Tennessee.
NOTlCE This document contains information of a preliminary nature and was prepored primarily for internal use a t the Oak Ridge National Laboratory. I t is subject to revision or correction and therefore does not represent a final report.
I LEGAL This report wos prepared as on account o f Govmrnment sponsored work. Neither the United Stoten,
nor thm Commission, nor any parson acting on bohalf of the Commission:
A. Makes ony warranty or representation, expessed or implied, wi th respect to the occurocy,
complefeness, or usmfulnesr of th. information contained in this report, or that the use of any information. apparatus, method, or process disclosed in th is report moy not infringe
privately owned rights; or 8. Aarumes ony l iobi l i t ies wi th r e s w c t t o the use of, or for damages resulting from the use of
any information, apporatus, method. or process disclosed in th is report.
As used in the above, "parson octing on behalf of the Commission" includes any employee or
contractw of the Comrnissioa, or employe. of such contractor, to the extant that such employes
or contractor of the Commission, or employee of such contractor prepares, disseminotes, or
provides access to, any information pursuant t o his employment or contract wi th the Commission,
or h is employment wi th such contractor.
3
CO NTEN TS
.-
Page
1. INTRODUCTION . . . . . . . . . . . . . . . . . . . . . . . 4
2. DATA ACQUISITION AND REDUCTION . . . . . . . . . . . . . 5 2.1 6 2.2 Data Reduction . . . . . . . . . . . . . . . . . . . . 7
Data Acquisition . . . . . . . . . . . . . . . . . . . .
3. THEORETICAL CALCULATIONS AND MODELING . . . . . . . . 8 3.1 Introduction . . . . . . . . . . . . . . . . . . . . . . 8 3.2 Development of the Model . . . . . . . . . . . , . . . . 9 3.3 Consideration of Possible Driving Functions. . . . . . . . . 12
4. MEASUREMENTS AND RESULTS . . . . . . . . . . . . . . . . 13 4.1 Establishment of Measurement Reproducibilityand . . . . . .
Method of Spectrum interpretation . . . . . . . . . . . 13 4.2 Results of Tests a t 7 M w Reactor Power . . . . . . . . . . 14 4.3 Results of Tests a t 5 M w Reactor Power . . . . . . . . . . 14
4.3.1 Neutron Noise Level vs Pump Bowl Level . . . . . 14 4.3.2 Neutron Noise Level vs Cover G a s Pressure . . . . 15 4.3.3 Neutron Noise Level vs Average Reactor. . . . . .
0 ut I e t Temperature . . . . . . . . . . . . . . 15 4.3.4 Neutron Noise vs N e t Reactivity . . . . . . . . . 15
4.4 Dominant Source of Observed Neutron Noise . . . . . . . . 16
5. CONCLUSIONS . . . . . . . . . . . . . . . . . . . . . . . 18
6. FUTURE INVESTIGATIONS. . . . . . . . . . . . . . . . . . . 18
L E G A L N O T I C E This report was prepared as an account of Government sponsored work. Neither the United States, nor the Commission. nor any person acting on behalf of the Commission:
A. Makes any warranty orrepresentation.expressed or implied, with respect to the accu- racy, completeness, or usefulness of the information contained in this report, or that the use of any information, apparatus, method, or process dlsclosed in this report may not infringe privately owned rights; or
E. Assumes any liabilities with respect to the use of. o r for damages resulting from the use of any information, apparatus, method. or process disclosed in this report.
A s used in the above, "person acting on behalf of the Commission" includes m y em- ployee o r Contractor of the Commission. or employee of such contractor, to the extent that such employee or contractor of the Commission, or employee of such contractor prepares, diaseminates, or provides access to, any mformation pursuant to his employment or contract with the Commission. or his employment with such contractor.
4
1. INTRODUCTION
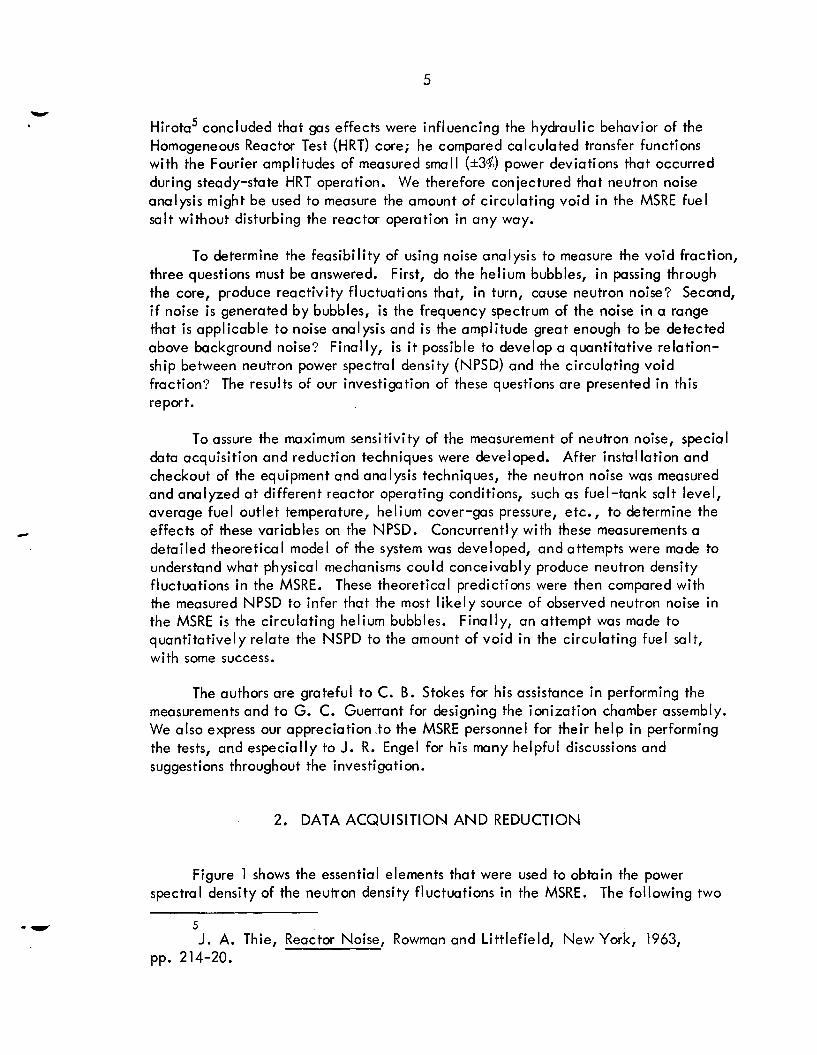
Investigations were made at the MSRE to determine i f the amount of helium g a s in the fuel salt can be measured using neutron noise analysis. In calculations of reactivity balances that have been made by an on-line digital computer at the Molten-Salt Reactor Experiment (MSRE) since the start of power operation, there has been an Uncertainty concerning the concentration of I3%e in the circulating fuel salt and, thus, an uncertainty i n the reactivity balance computations. According to Engel and Prince,* this uncertainty arises because an unknown and changing amount of circulating voids (bubbles of undissolved helium gas believed to be introduced b the xenon-stripping spray ring in the fuel pump tank) affects the
a reactivity effect of -0.18% (A k/k) for 1 vol $ of gas,since such voids affect the neutron leakage and fuel inventory within the core.
amount of 134 e in the system. Besides this uncertainty, these bubbles also introduce
Although measurements at zero power 3,4 had indicated that no circulating 3 voids were present, pressure release tests performed later after operation a t power
showed a small circulating void fraction at normal salt levels i n the pump tank. By comparing calculated and observed transient buildup of I3%e poisoning after step changes in reactor power, Engel and Prince estimated the void fraction to be between 0.1 and 0.15 vol $ and the bubble stripping efficiency to be between 50 and 10%. i s dependent upon other reactor operating conditions, such as fuel pump tank level for one.* Transient tests were performed to infer the void fraction and bubble stripping efficiency, but because such tests interrupted the normal operation of the MSRE, i t seemed desirable to seek a nondisturbing method for determining the helium void fraction and stripping efficiency.
Later experience indicated that the circulating void fraction
Neutron noise analysis has been applied extensively as a nondisturbing method for measuring reactor parameters a t zero power and also for monitoring the dynamic behavior of reactors operating a t power. In an early application of this technique,
L
J. R. Engel and B. E. Prince, The Reactivity Balance i n the MSRE, ORNL-TM-1796 (March 10, 1967).
3 MSRP Semiann. Progr. Rept. Aug. 31, 1965, ORNL-3872, pp. 22-24.
B. E. Prince - e t al., Zero-Power Physics Experiments on the Molten-Salt 4
Reactor Experiment, ORNL-4233 (Feb. 1968).
5
I
c
Hirota’ concluded that gas effects were influencing the hydraulic behavior of the Homogeneous Reactor Test (HRT) core; he compared calculated transfer functions with the Fourier amplitudes of measured sma l l (&3$) power deviations that occurred during steady-state HRT operation. We therefore conjectured that neutron noise analysis might be used to measure the amount of circulating void in the MSRE fuel salt without disturbing the reactor operation in any way.
To determine the feasibility of using noise analysis to measure the void fraction, three questions must be answered. First, do the helium bubbles, i n passing through the core, produce reactivity fluctuations that, in turn, cause neutron noise? Second, i f noise i s generated by bubbles, i s the frequency spectrum of the noise in a range that i s applicable to noise analysis and i s the amplitude great enough to be detected above background noise? Finally, i s i t possible to develop a quantitative relation- ship between neutron power spectral density (NPSD) and the circulating void fraction? The results of our investigation of these questions are presented i n this report.
To assure the maximum sensitivity of the measurement of neutron noise, special data acquisition and reduction techniques were developed. After instal lation and checkout of the equipment and analysis techniques, the neutron noise was measured and analyzed at different reactor operating conditions, such as fuel-tank salt level, average fuel outlet temperature, helium cover-gas pressure, etc., to determine the effects of these variables on the NPSD. Concurrently with these measurements a detailed theoretical model of the system was developed, and attempts were made to understand what physical mechanisms could conceivably produce neutron density fluctuations i n the MSRE. These theoretical predictions were then compared with the measured NPSD to infer that the most l ikely source of observed neutron noise i n the MSRE i s the circulating helium bubbles. Finally, an attempt was made to quantitatively relate the NSPD to the amount of void in the circulating fuel salt, with some success.
The authors are grateful to C. B. Stokes for his assistance in performinq the measurements and to G. C. Guerrant for designing the ionization chamber assembly. We also express our appreciation .to the MSRE personnel for their help in performing the tests, and especially to J. R. Engel for his many helpful discussions and suggestions throughout the investigation.
2. DATA ACQUISITION AND REDUCTION
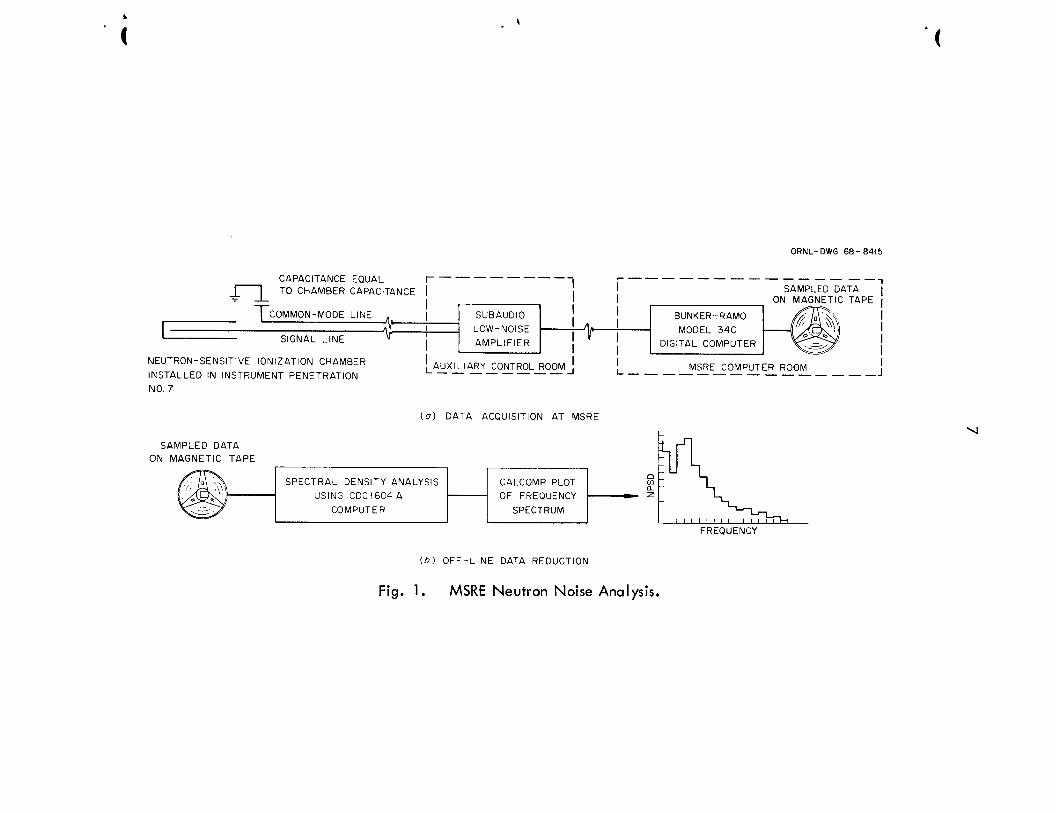
Figure 1 shows the essential elements that were used to obtain the power spectral density of the neutron density fluctuations in the MSRE. The following two
5 J. A. Thie, Reactor Noise, Rowman and Littlefield, New York, 1963,
pp. 214-20.
6
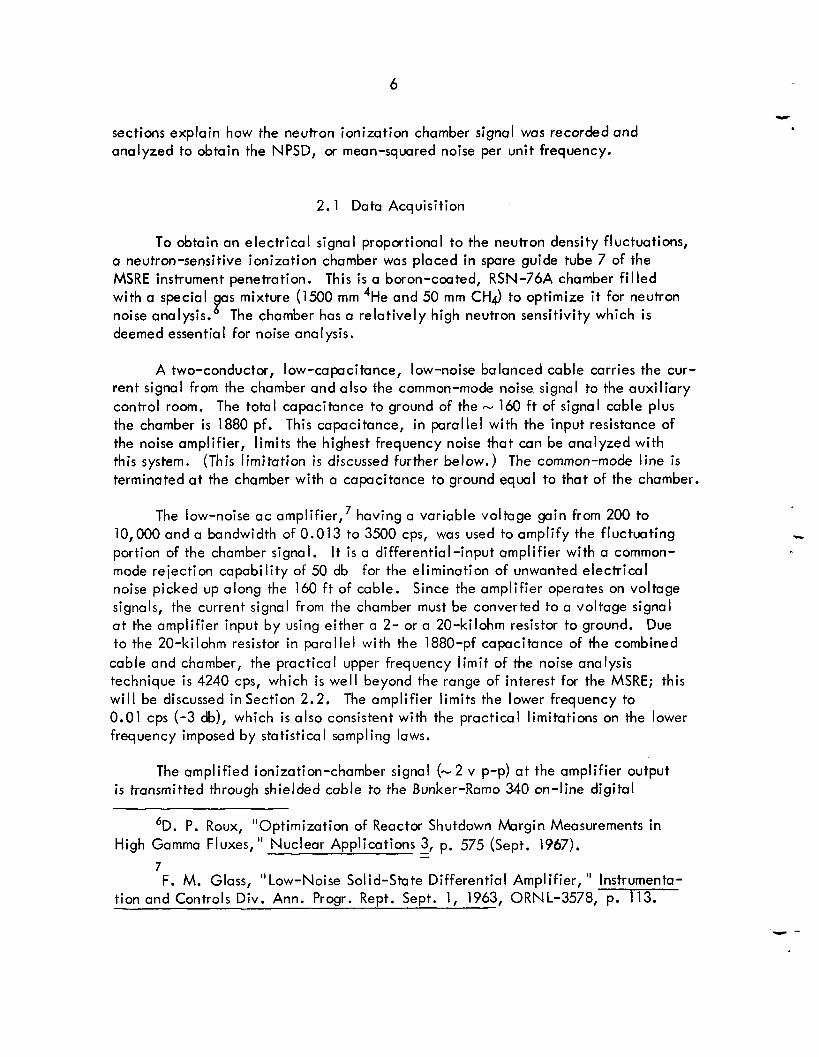
sections explain how the neutron ionization chamber signal was recorded and analyzed to obtain the NPSD, or mean-squared noise per unit frequency.
2. 1 Data Acquisition
To obtain an electrical signal proportional to the neutron density fluctuations, a neutron-sensitive ionization chamber was placed in spare guide tube 7 of the MSRE instrument penetration. This i s a boron-coated, RSN-76A chamber f i l led with a special as mixture (1500 mm 4He and 50 mm CHS to optimize i t for neutron noise analysis.' The chamber has a relatively high neutron sensitivity which i s deemed essential for noise analysis.
A two-conductor, low-capacitance, low-noise balanced cable carries the cur- rent signal from the chamber and also the common-mode noise. signal to the auxiliary control room. The total capacitance to ground of the - 160 ft of signal cable plus the chamber i s 1880 pf. This capacitance, in parallel with the input resistance of the noise amplifier, l imits the highest frequency noise that can be analyzed with t h i s system. terminated a t the chamber with a capacitance to ground equal to that of the chamber.
(This limitation i s discussed further below.) The common-mode line i s
The low-noise ac a m ~ l i f i e r , ~ having a variable voltage gain from 200 to 10,000 and a bandwidth of 0.013 to 3500 cps, was used to amplify the fluctuating portion of the chamber signal. It i s a differential-input amplifier with a common- mode reiection capability of 50 db for the elimination of unwanted electrical noise picked up along the 160 f t of cable. Since the amplifier operates on voltage signals, the current signal from the chamber must be converted to a voltage signal at the amplifier input by using either a 2- or a 20-kilohm resistor to ground. Due to the 20-kilohm resistor in parallel with the 1880-pf capacitance of the combined
cable and chamber, the practical upper frequency l i m i t of the noise analysis technique i s 4240 cps, which i s well beyond the range of interest for the MSRE; this wi l l be discussed in Section 2.2. The amplifier l im i ts the lower frequency to 0.01 cps (-3 db), which i s also consistent with the practical limitations on the lower frequency imposed by statistical sampling laws.
The amplified ionization-chamber signal (- 2 v p-p) at the amplifier output i s transmitted through shielded cable to the Bunker-Ram0 340 on-line digital
6D. P. ROUX, "Optimization of Reactor Shutdown Margin Measurements i n High Gamma Fluxes," Nuclear Applications 2, p. 575 (Sept. 1967). -
7 F. M. Glass, " Low-Noise Solid-state Differential Amplifier, I' Instrumenta-
tion and Controls Div. Ann. Progr. Rept. Sept. l, 1963, ORNL-3578, p. 113.
w -
ORNL-DWG 66- 6445
CAPACITANCE EQUAL r--------- TO CHAMBER CAPACITANCE 1
I COMMON-MODE LINE n SUBAUDIO
nq I LOW-NOISE SIGNAL LINE
I AMPLIFIER
r------------___ SAMPLED DATA
ON MAGNETIC TAPE
BUNKER-RAM0
MODEL 340 I I
DIGITAL COMPUTER
NEUTRON-SENSITIVE IONIZATION CHAMBER ’ AUXILIARY CONTROL I?“““” ’ I ;TALLED IN INSTRUMENT PENETRATION L-------
h”CDC f-nh”Di ,-rrm Clnnhr IN! ‘““‘.’ -I I”IJI\L \.“IvIr” 4 LrY rx”“IVI _- I----------------
NO. 7
(0) DATA ACQUISITION AT MSRE
SAMPLED DATA 1
ON MAGNETIC TAPE
E z
k- FREQUENCY
(6) OFF-LINE DATA REDUCTION
Fig. 1. MSRE Neutron Noise Analysis.
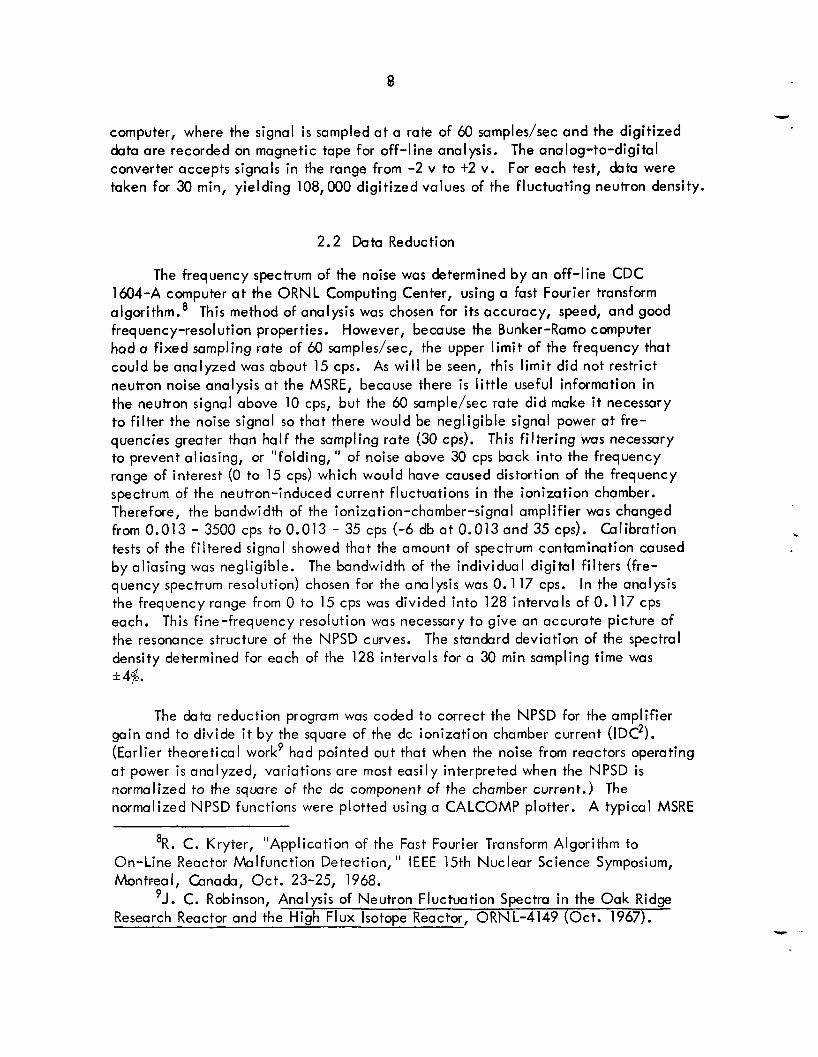
computer, where the signal i s sampled at a rate of 60 samples/sec and the digitized data are recorded on magnetic tape for off-line analysis. The analog-to-digital converter accepts signals in the range from -2 v to +2 v. For each test, data were taken for 30 min, yielding 108,000 digitized values of the fluctuating neutron density.
2.2 Data Reduction
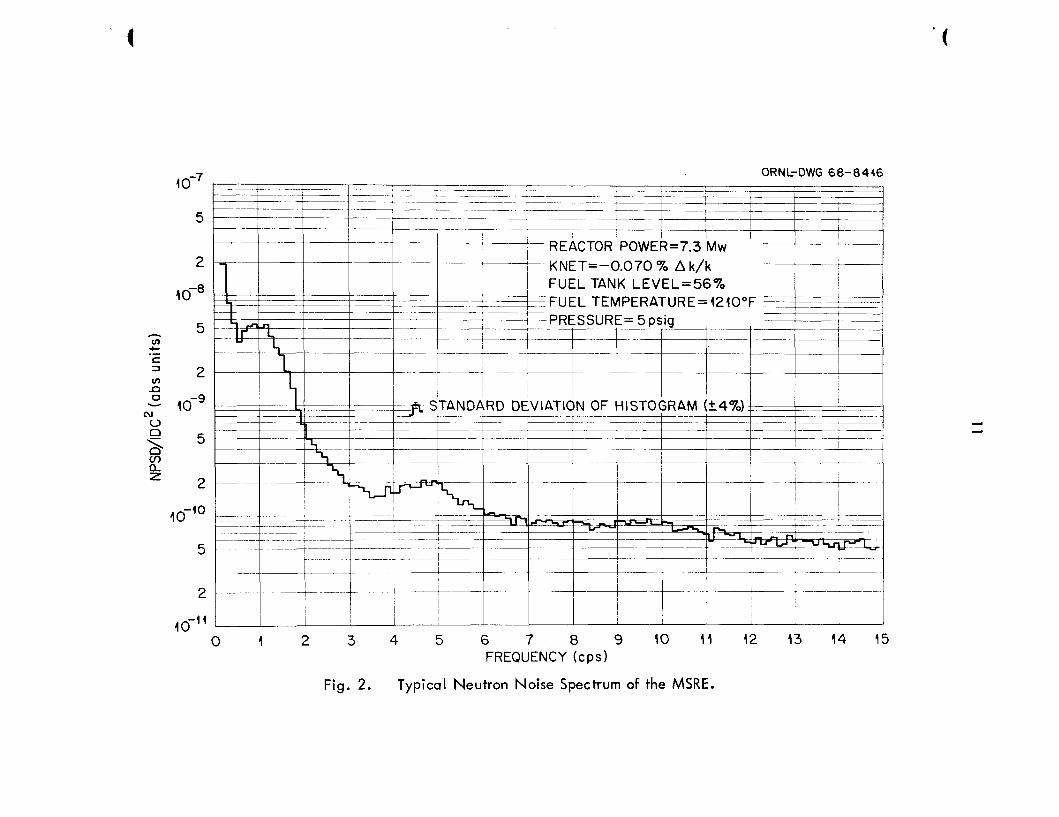
The frequency spectrum of the noise was determined by an off-line CDC 1604-A computer a t the ORNL Computing Center, using a fast Fourier transform algorithm.8 This method of analysis was chosen for i t s accuracy, speed, and good frequency-resolution properties. However, because the Bunker-Ram0 computer had a fixed sampling rate of 60 samples/sec, the upper l imit of the frequency that could be analyzed was about 15 cps. As wi l l be seen, this l im i t did not restrict neutron noise analysis at the MSRE, because there i s l i t t le useful information in the neutron signal above 10 cps, but the 60 sample/sec rate did make i t necessary to filter the noise signal so that there would be negligible signal power at fre- quencies greater than half the sampling rate (30 cps). This filtering was necessary to prevent aliasing, or "folding, I' of noise above 30 cps back into the frequency range of interest (0 to 15 cps) which would have caused distortion of the frequency spectrum of the neutron-induced current fluctuations i n the ionization chamber. Therefore, the bandwidth of the ionization-chamber-signal amplifier was changed from 0.013 - 3500 cps to 0.013 - 35 cps (-6 db at 0.013 and 35 cps). Calibration tests of the filtered signal showed that the amount of spectrum contamination caused by aliasing was negligible. The bandwidth of the individual digital filters (fre- quency spectrum resolution) chosen for the analysis was 0.117 cps. In the analysis the frequency range from 0 to 15 cps was divided into 128 intervals of 0.117 cps each. This fine-frequency resolution was necessary to give an accurate picture of the resonance structure of the NPSD curves. The standard deviation of the spectral density determined for each of the 128 intervals for a 30 min sampling time was *4$.
The data reduction program was coded to correct the NPSD for the amplifier gain and to divide i t by the square of the dc ionization chamber current (IDC2). (Earlier theoretical work9 had pointed out that when the noise from reactors operating at power i s analyzed, variations are most easily interpreted when the NPSD i s normalized to the square of the dc component of the chamber current.) The normalized NPSD functions were plotted using a CALCOMP plotter. A typical MSRE
8R. C. Kryter, "Application of the Fast Fourier Transform Algorithm to On-Line Reactor Malfunction Detection, " IEEE 15th Nuclear Science Symposium, Montreal, Canada, Oct. 23-25, 1968.
9J. C. Robinson, Analysis of Neutron Fluctuation Spectra i n the Oak Ridge Research Reactor and the High Flux Isotope Reactor, ORNL-4149 (Oct. 1967).

c
spectrum (computed in about 4 min on the 1604-A computer) i s shown in Fig. 2. The NPSD i s plotted i n absolute units of fractional mean-square reactor power fluctua- tion per unit frequency interval i n cycles/sec. Since i n the frequency analysis i t i s assumed that the spectral density i s constant over the bandwidth of the effective digital filter, we plotted the results in histogram form. The interpretation of the spectra w i l l be discussed in the next section.
3. THEORETICAL CALCULATIONS AND MODELING
3.1 Introduction
For a linear system driven by a single input, the output PSD, @ (w), i s 00
related to the input PSD, @..(w), b q I I
where output
I G(jw) I i s the modulus of the system frequency response function. Such an PSD, obtained from a neutron-sensitive ionization chamber at the MSRE
(operating at power), was presented i n Fig. 2. To efficiently utilize the PSD measurements i n gaining insight into the dynamic properties of the reactor system, i t i s necessary to understand the nature of the predominant input (driving function) to the system. There are two possible approaches to the identification of this driving funct ion:
1. e.g., cross-correlation measurements or PSD measurements for a range of known reactor conditions where various quantities are purposely modified, etc.
Postulate a driving function and then attempt an experimental verification,
2. transfer function, and then employ Eq. (1) t o produce an expected output PSD which can be compared to experimental results to validate or reject the postulate.
Postulate a driving function, calculate analytically the appropriate system
In principle, the cross-correlation techniques could lead to the unique identi- fica tion of the driving function; however, i n practice most cross-correlation measure- ments are difficult. Therefore we adopted the combined approach of an analytic model for the calculation of the frequency response function, coupled with PSD measurements under control led (as much as possible) reactor conditions.
Before a specific model was selected, the potential driving functions were considered. In addition to potential driving functions commonly encountered, such as coolant temperature fluctuations and rod vibrations,’ i t was known that helium gas could be entrained in the fuel salt. Therefore, i n addition to commonly encountered
10
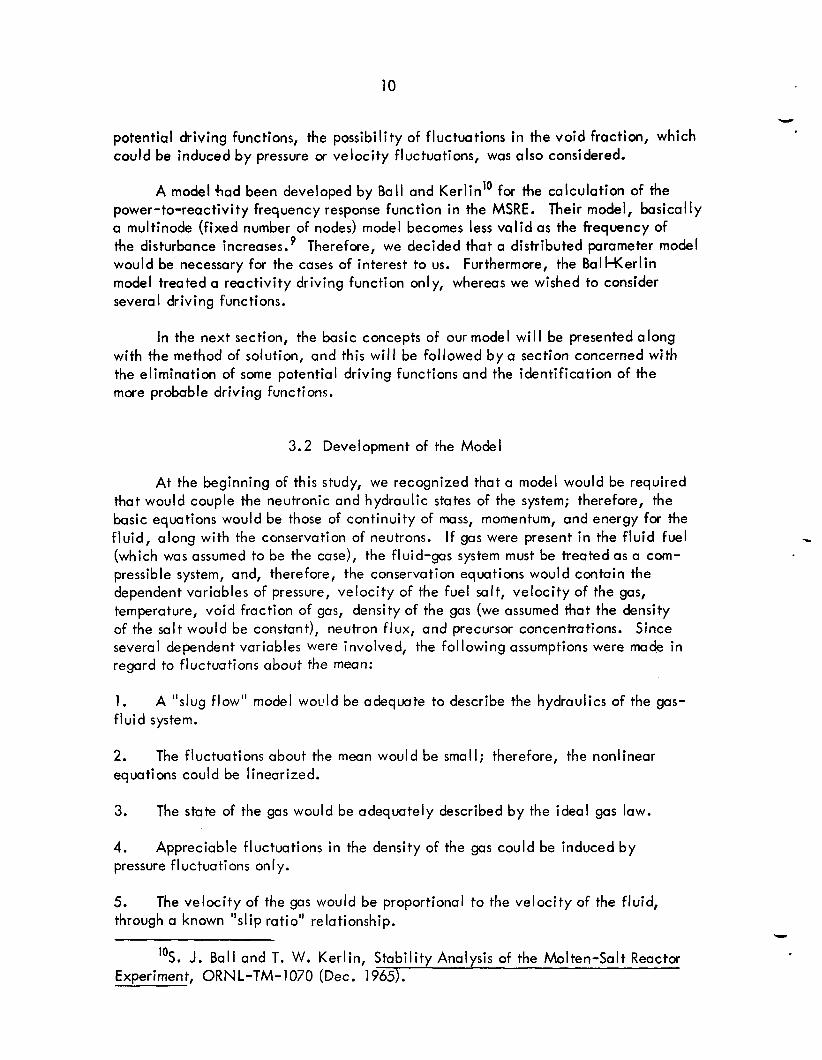
potential driving functions, the possibility of fluctuations i n the void fraction, which could be induced by pressure or velocity fluctuations, was also considered.
A model +ad been developed by Ball and Kerlin" for the calculation of the power-to-reactivity frequency response function in the MSRE. Their model, basically a multinode (fixed number of nodes) model becomes less val id as the frequency of the disturbance increase^.^ Therefore, we decided that a distributed parameter model would be necessary for the cases of interest to us. Furthermore, the BaIWerI in model treated a reactivity driving function only, whereas we wished to consider several driving functions.
In the next section, the basic concepts of our model wi l l be presented along with the method of solution, and this w i l l be followed b y a section concerned with the elimination of some potential driving functions and the identification of the more probable driving functions.
3.2 Development of the Model
At the beginning of this study, we recognized that a model would be required that would couple the neutronic and hydraulic states of the system; therefore, the basic equations would be those of continuity of mass, momentum, and energy for the fluid, along with the conservation of neutrons. If g a s were present i n the f luid fuel (which was assumed to be the case), the fluid-gas system must be treated as a com- pressible system, and, therefore, the conservation equations would contain the dependent variables of pressure, velocity of the fuel salt, velocity of the gas, temperature, void fraction of gas, density of the gas (we assumed that the density of the salt would be constant), neutron flux, and precursor concentrations. Since several dependent variables were involved, the following assumptions were made in regard to fluctuations about the mean:
1 . f luid system.
A ''slug flow" model woLald be adequate to describe the hydraulics of the gas-
2. equations could be linearized.
The fluctuations about the mean would be small; therefore, the nonlinear
3. The state of the gas would be adequately described by the ideal gas law.
4. pressure fluctuations only.
Appreciable fluctuations in the density of the gas could be induced by
5. through a known "slip ratio" relationship.
The velocity of the gas would be proportional to the velocity of the fluid,
'OS. J. Ball and T. W. Kerlin, Stability Analysis of the Molten-Salt Reactor Experiment, ORN L-TM - 1 070 (Dec . 1 965).
I o - ~
5
2
1 o-8
5
2
5
2
10-’O
5
2
I d ’ ’
ORNL-DWG 68-8446
--
FUEL TANK LEVEL=56% PERATURE= 1210°F
+-a *
0 1 2 3 4 5 6 7 8 9 10 1 I 12 13 14 15
Typical Neutron Noise Spectrum of the MSRE.
FREQUENCY (cps)
Fia. 2.
A
A
12
6. accounts for delayed neutrons, would be adequate.
A one-dimensiona1,one-velocity neutron diffusion equation, which expl ici t ly
7. precursor balance equations.
The fluctuations in the f luid velocity could not significantly affect the
With these assumptions, we devided the problem into two parts: a hydraulic model which involves the momentum, m a s s of the gas, and m a s s of the f luid con- servation equations, and a neutronic model which involves the energy, neutrons, and precursor conservation equations. The hydraulic model wi II be discussed first, followed by the neutronic model.
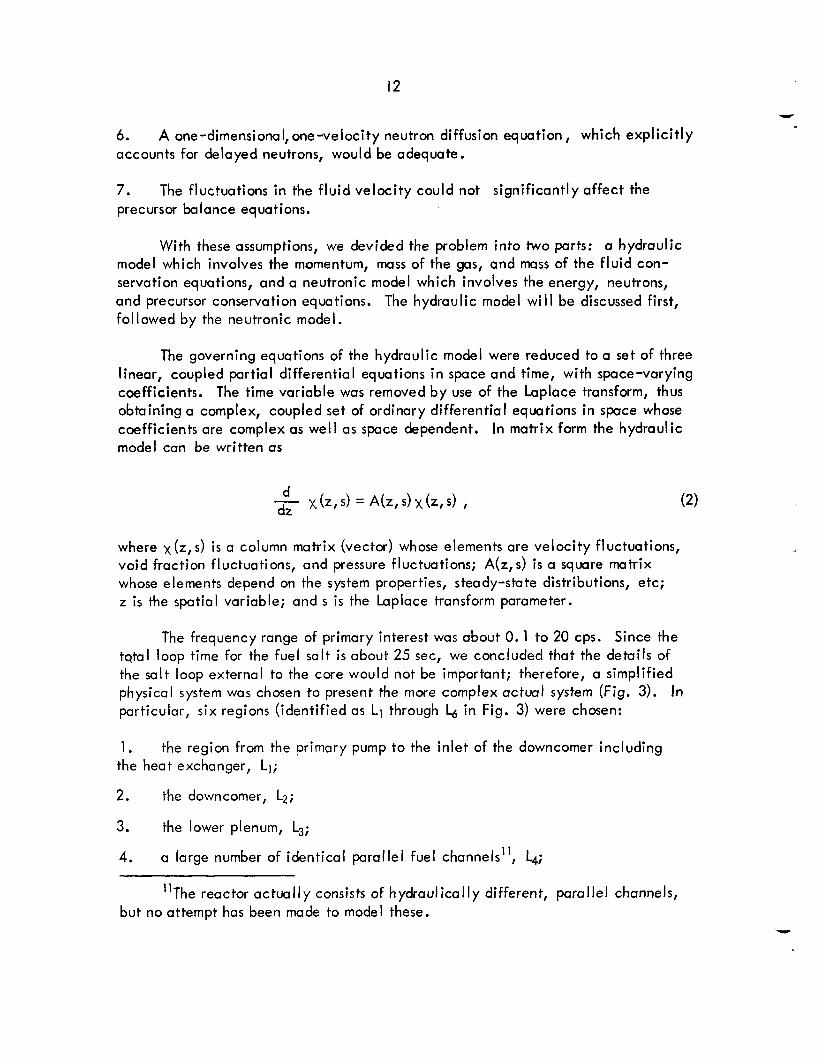
The governing equations of the hydraulic model were reduced to a set of three linear, coupled partial differential equations i n space and time, with space-varying coefficients. The time variable was removed by use of the Laplace transform, thus obtaining a complex, coupled set of ordinary differential equations in space whose coefficients are complex as well as space dependent. In matrix form the hydraulic model can be written as
where x ( z , s ) i s a column matrix (vector) whose elements are velocity fluctuations, void fraction fluctuations, and pressure fluctuations; A(z,s) i s a square matrix whose elements depend on the system properties, steady-state distributions, etc; z i s the spatial variable; and s i s the Laplace transform parameter.
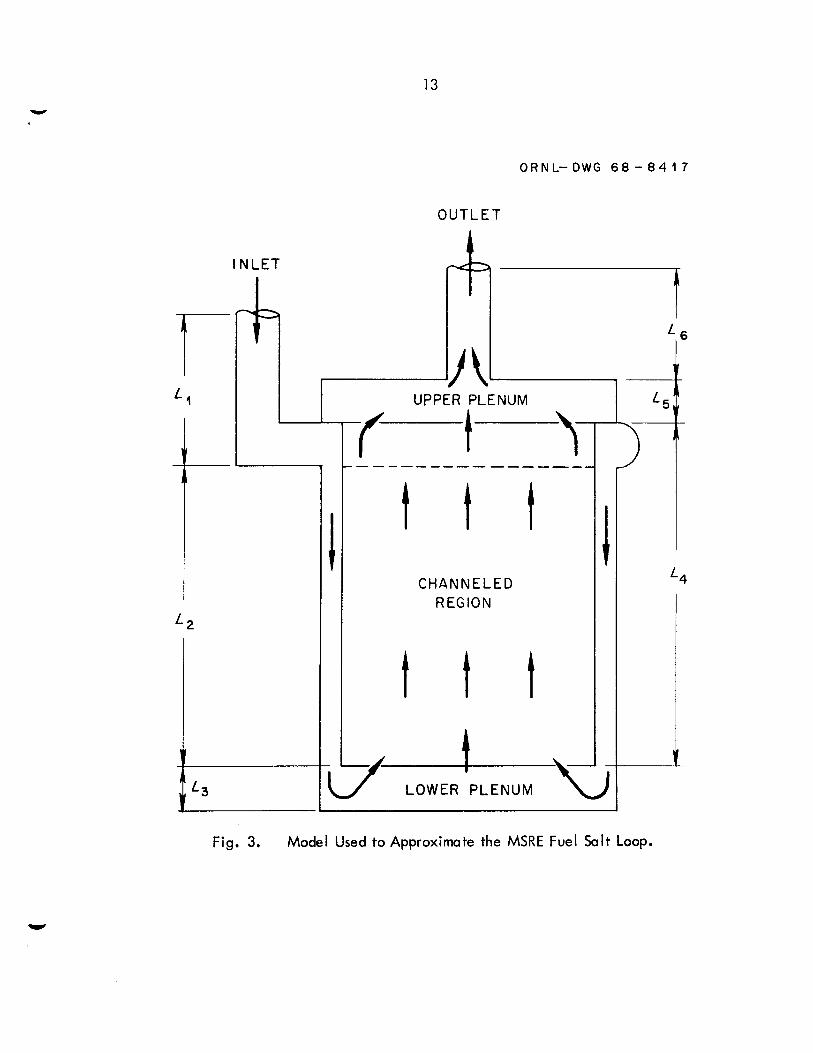
The frequency range of primary interest was about 0.1 to 20 cps. Since the tQtaI loop time for the fuel salt i s about 25 sec, we concluded that the details of the salt loop external to the core would not be important; therefore, a simplified physical system was chosen to present the more complex actual system (Fig. 3). particular, six regions (identified as L, through
In in Fig. 3) were chosen:
1. the heat exchanger, Ll;
the region from the primary pump to the inlet of the downcomer including
2. the downcomer, L2;
3. the lower plenum, L3;
4. a large number of identical parallel fuel channels”, 4;
”The reactor actually consists of hydraulically different, parallel channels, but no attempt has been made to model these.
V
13
LOWER PLENUM
L l
I N L E T
O R N L - D W G 6 8 - 84 1 7
OUTLET
I UPPER PLENUM
- I f )- t t
CHANNELED REGION
t I -
Fig. 3. Model Used to Approximate the MSRE Fuel Salt Loop.
14
5. the upper plenum, Lg;
6. the region from the reactor vessel to the primary pump, b.
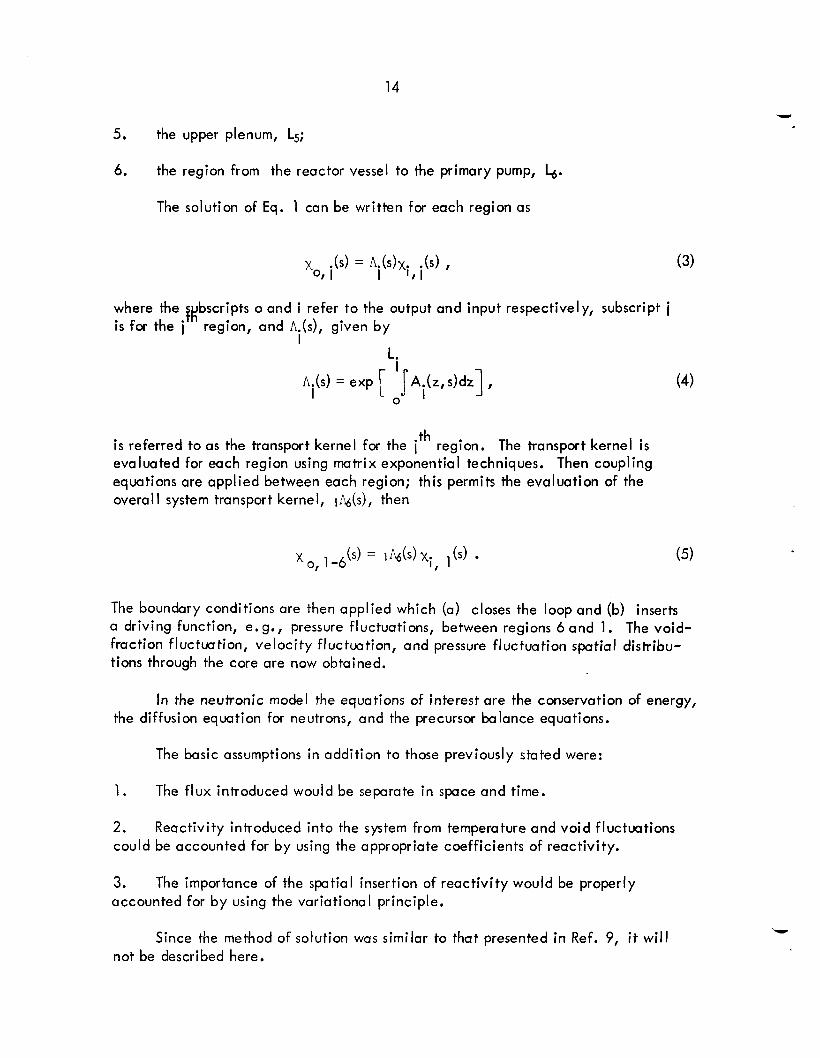
The solution of Eq. 1 can be written for each region as
where the qgbscripts o and i refer to the output and input respectively, subscript i i s for the i
L. region, and A.(s), given by
I
i A.(s) = exp [ fA.(z,s)dz] ,
I 0 I
th i s referred to as the transport kernel for the i region. The transport kernel i s evaluated for each region using matrix exponential techniques. Then coupling equations are applied between each region; this permits the evaluation of the overal I system transport kernel, li&), then
(4)
The boundary conditions are then applied which (a) closes the loop and (b) inserts a driving function, e.g., pressure fluctuations, between regions 6 and 1 . The void- fraction fluctuation, velocity fluctuation, and pressure fluctuation spatial distribu- tions through the core are now obtained.
In the neutronic model the equations of interest are the conservation of energy, the diffusion equation for neutrons, and the precursor balance equations.
The basic assumptions in addition to those previously stated were:
1. The flux introduced would be separate i n space and time.
2. could be accounted for by using the appropriate coefficients of reactivity.
Reactivity introduced into the system from temperature and void fluctuations
3. accounted for by using the variational principle.
The importance of the spatial insertion of reactivity would be properly
Since the method of solution was similar to that presented in Ref. 9, i t wi l l not be described here.
15 Y
3.3 Consideration of Possible Driving Functions
W
The potential driving functions that have been considered are fluctuations i n
1 . the salt temperature a t the entrance to the core region,
2. the void fraction induced by salt velocity fluctuations a t the pump,
3. the salt a t the pump bowl,
the void fraction induced by fluctuations i n the mass flow rate of g a s entering
4. pump or pump bowl.
the void fraction induced by pressure fluctuations introduced a t the primary
5. the reactivity caused by control rod vibrations.
The first three of these driving functions were eliminated because a comparison of observed (experimental) PSD with the calculated (theoretical) PSD showed that experimental PSD decreased about one decade i n magnitude in the frequency range of 0.2 to 1 cps, but the analytical PSD (for an assumed white driving function) decreased about three decades in the Same frequency range for each of these functions. I f any one of them had been primarily responsible for the observed PSD, the magnitude of that particular function would have had to increase with frequency in this frequency range. Physically, this behavior would be unreasonable.
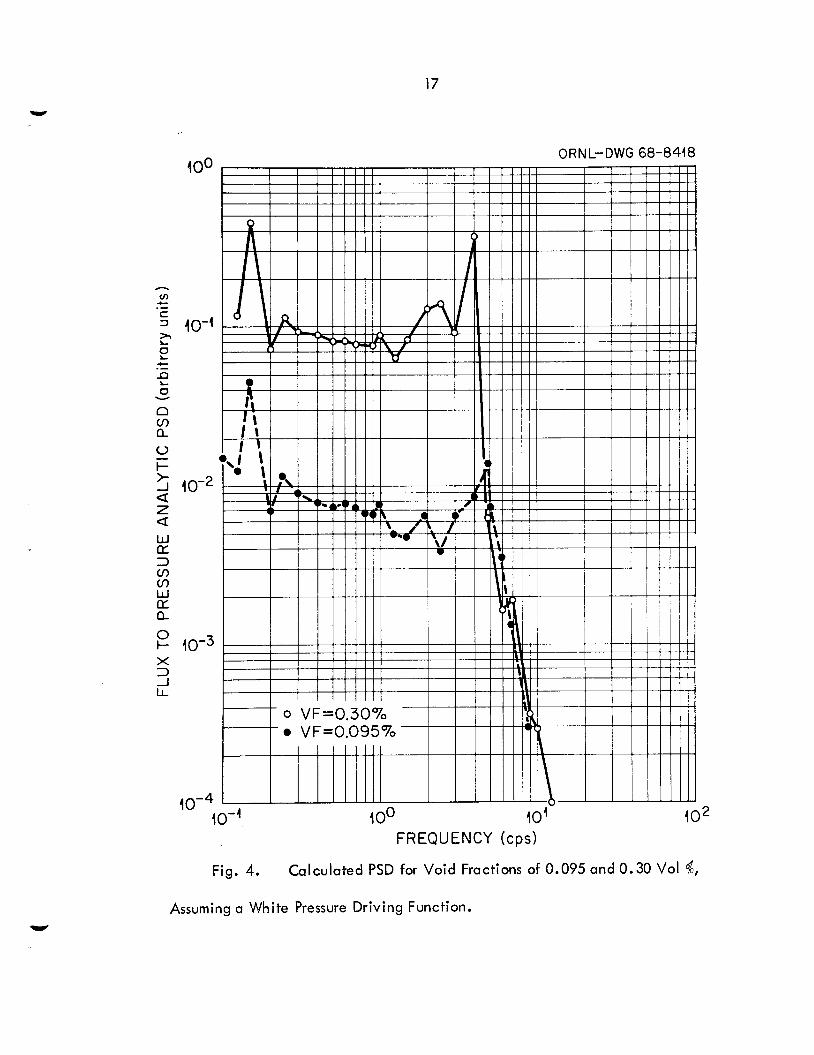
The possibility of rod vibrations could not be eliminated analytically. Like- wise, the fourth driving function could not be eliminated, because calculation shows that a pressure fluctuation of 0.01 to 0.05 psi (which i s physically realizable) would be sufficient to produce the observed noise. The calculated PSD for an assumed pressure driving function of unity magnitude in the frequency domain i s
presented i n Fig. 4 for two different mean steady-state void fractions. Although the shapes of these calculated PSD curves are not precisely the Same as the observed PSD curves, we s t i l l regard pressure fluctuations as a highly probably driving function for the following reasons:
1. The required magnitude of the pressure fluctuations i s not unreasonable.
2. to predict exactly the observed frequency dependence.
The analytical model developed i s not expected to have sufficient detail
As a further point of interest (see Fig. 4), the magnitude of the analytic PSD (due to the fourth driving function possibility listed) i s proportional to the square of the steady-state void fraction existing in the core for frequencies below 4 cps (this observation wi l l be applied in Section 4.4).
16
4. MEASUREMENTS AND RESULTS
4.1 Establishment of Measurement Reproducibility and Method of Spectrum Interpretation
The theoretical studies described i n Sect. 3 suggested several possible driving functions for neutron noise. parameter changes, such as control rod position, etc., we observed the MSRE neutron noise daily for several weeks to determine the reproducibility of the measure- ments and how the shape and magnitude of the noise spectrum changed under normal operating conditions. The results of these tests show that the measurements were reproducible to within the anticipated *5$. However, we did observe small con- sistent changes i n the spectrum, which indicated that the driving function (reactivity fluctuation) was varying slightly from day to day. This variation was most pronounced as an amplitude change i n the vicinity of the 1-cps peak (see Fig. 2).
However, before studying the effects of particular
Because of this localized sensitivity of the spectrum, i n addition to observing the detailed shape and magnitude of the entire 0.1- to 15-cps spectrum, we also computed the noise level NPSD/(IDC)2 - averaged over the interval 0.5 to 2.0 cps. (This averaged noise i s defined as NPSD.) As a result of this averaging, changes i n the noise level were enhanced and the precision of the measurements increased to * l % .
Following these tests to establish confidence in this method of data acquisition and reduction by using known test signals, a series of special tests was performed at nominal reactor powers of 5 and 7 Mw to determine the effect of selected system par- ameters on the neutron noise spectrum, the NPSD, and reactivity balance. (These special tests were performed to better understand the origin of small reactivity changes which had previously been indicated b the reactivity balance. 12) The parameters
helium cover-gas pressure and the fuel-salt level in the pum poisoning was inferred from reactivity balance calculations.' The helium cover-gas pressure i n the fuel pump bowl was measured by a pressure transmitter i n a helium supply line outside the main secondary containment shell, approximately 15 ft from the fuel pump bowl. The average fuel salt temperature at the reactor outlet was calculated by the BR-340 computer from temperature readings from three thermo- couples in the salt loop, duced transient effects, the system was allowed to reach equilibrium (-48 hr) follow- ing a change before noise measurements were made. The results of these tests are presented in the following sections.
studied were: control rod position, 13& e poisoning, average fuel-outlet temperature, tank. The I3%e
Since significant changes i n some of the parameters pro-
12MSRP Semiann. Progr. Rept. Feb. 29, 1968, ORNL-4254, PP. 3-70
17
100
4 0-1
10-2
4 0 - ~
ORNL-DWG 68-8448
IO-^ ~
IO-' IO0 10'- IO2 FREQUENCY (cps)
Fig. 4. Calculated PSD for Void Fractions of 0.095 and 0.30 Vol $,
Assuming a White Pressure Driving Function.
18
4.2 Results of Tests at 7 Mw Reactor Power
Because of previous experience at the HFlR and ORR’, where we concluded that a major pGrtion of the neutron noise was caused by control rod vibration, we speculated that the reactivity fluctuations in the MSRE - might also be dependent on the position of the rods. However, we found that NPSD varied only about 2% for three regulating rod positions of 32.3, 36.4, and 38.6 in. This change borders on significance because the statistical error of the NPSD i s only *l$, but i n practice, other uncertainties either i n equipment calibration or small changes in the reactor system probably l imit the reproducibility to more l ike *5$. Therefore, we conclude that control rod vibration i s not a significant source of neutron noise a t the MSRE in the frequency range of 0.1 to 15 cps.
Another series of tests was conducted to study the effects of equilibrium 135Xe concentration on the NPSD. Following a period of operation a t zero power during which I3%e was stripped out, the power was increased to 7 Mw and noise measure- ments were taken a t %e poisoning levels of -0.012 and -0.261% Ak/k. The NPSD increased by 154, indicating some xenon dependence. the system was s t i l l i n a transient condition due to the increase in power and because of unavoidable changes in other parameterssuch as fuel tank salt level and helium pressure, one cannot validly conclude that a cause and effect relationship exists. We therefore suggest there might be some xenon dependence, but conclude that i t i s not a significant contributor to neutron noise i n the MSRE.
However, because
4.3 Results of Tests a t 5 Mw Reactor Power
The results of tests performed at 5 Mw (to allow a wider range of outlet temperature variation than would have been possible at 7 Mw) show the changes in the NPSD as a function of changes i n the operating conditions of the MSRE. To illustrate the behavior of the noise as a function of each parameter varied, the same data are presented i n several figures. This i s necessary because, in general, we did not have exclusive control of only one variable a t a time since the variables such as fuel temperature, pump bowl level, pressure, etc., were related interdependent1 y.
4.3.1 Neutron Noise Level v s Pump Bowl Level
Most of the time when the MSRE has been operated a t power there has been a small but continuous transfer of salt from the primary loop to the overflow tank, which produceda change in sult level i n the fuel pump bowl. Also, as the salt level i n the pump bowl was decreased below a certain level, considerably more helium bubbles were apparently introduced into the circulating salt. Therefore noise measurements
19
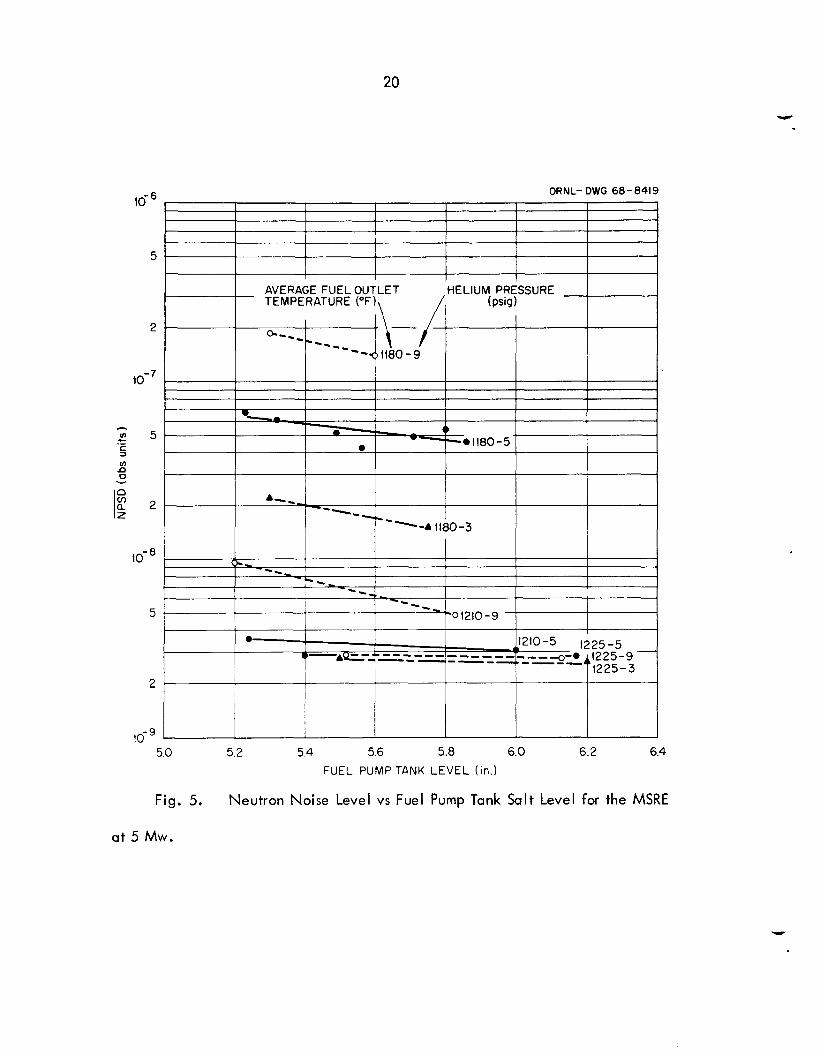
were performed a t different pump bowl levels i n the normal range of operation (5.2 - 6.0 in.) to determine the effect of salt level on noise amplitude. Figure 5 shows that as the salt level i n the bowl decreased the noise level at about 1 .O cps (m) increased. Although this effect was small at the normal operating temperature and pressure (1210OF and 5 psig), i t was reproduced i n many measurements over a long time span. However, this effect almost vanished when the fuel outlet temper- ature was increased to 1225OF, but Fig. 5 shows that when the temperature was decreased to 118OOF the effect was much greater.
4.3.2 Neutron Noise Level vs Cover G a s Pressure
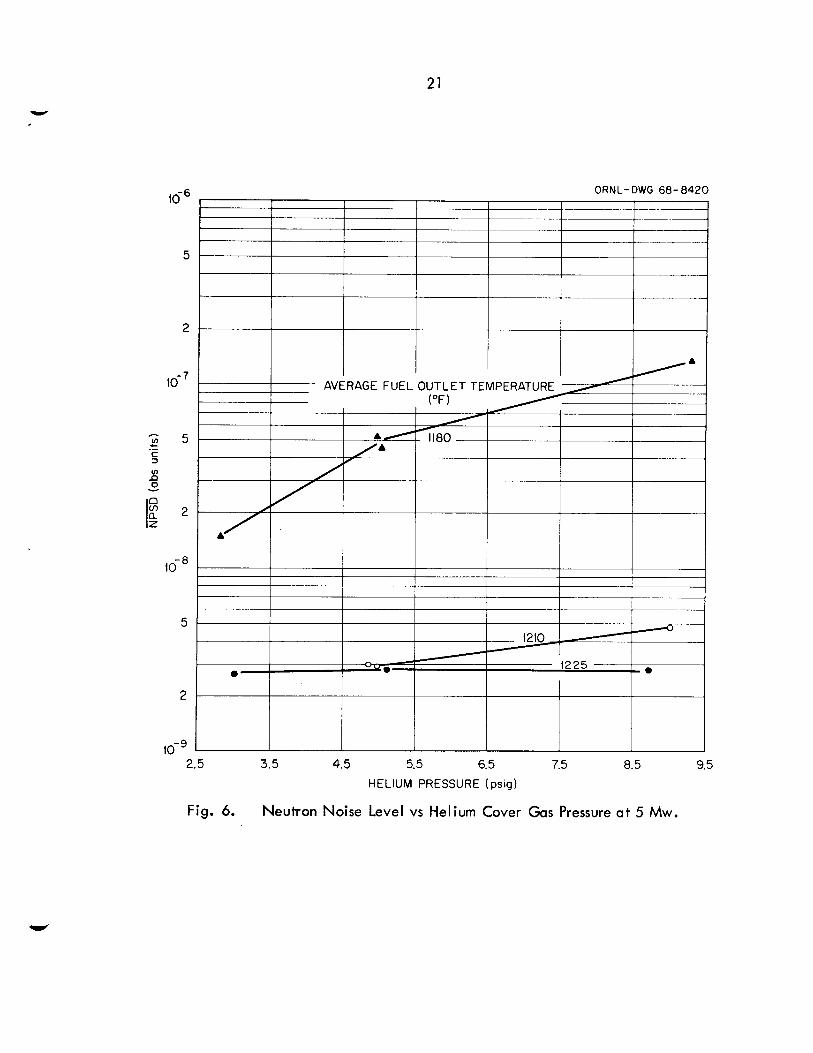
Since the helium pressure in the fuel pump bowl i s also a variable parameter, the effect of the pressure on the NPSD i s presented (Fig. 6). There was no change in the NPSD for pressures between 3 and 9 psig at an operating temperature of 1225OF. A t the normal operating temperature of 121OoF, the NPSD increased with increasing pressure. At the subnormal temperature of 1 18OoF, the NPSD increased markedly at a l l pressures from 3 to 9 psig, with the highest noise occurring a t the highest pressure (9 psig).
4.3.3 Neutron Noise Level vs Average Reactor Outlet Temperature
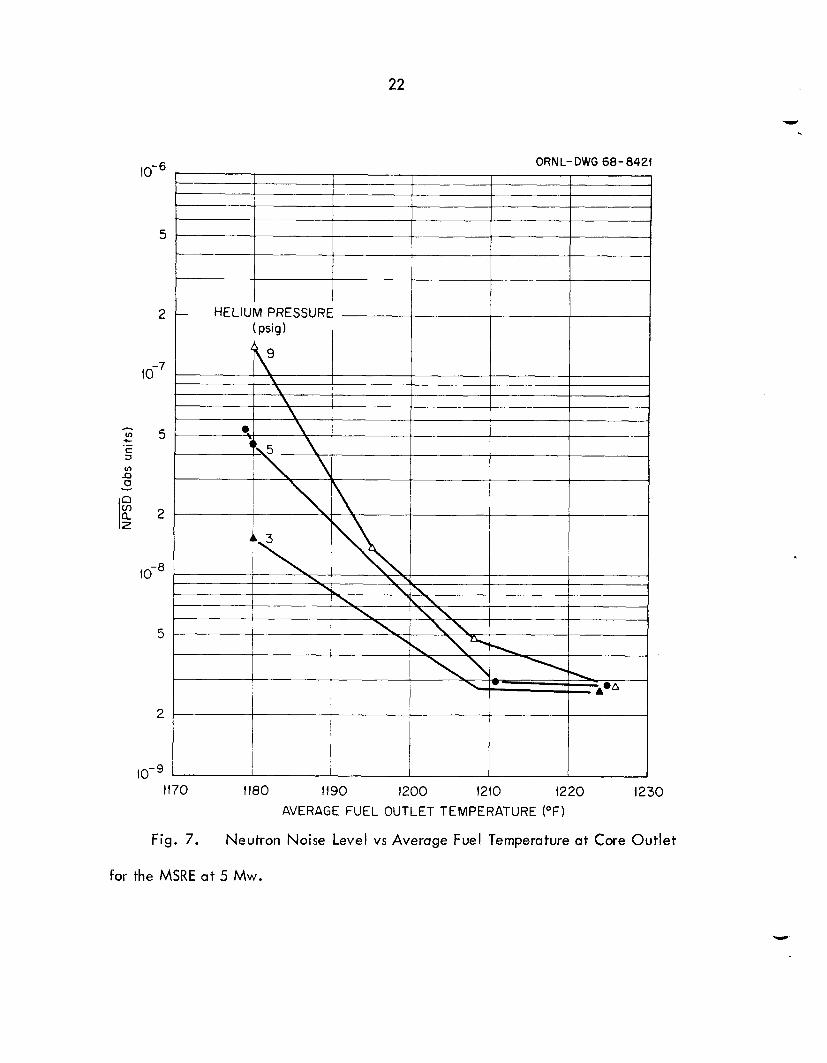
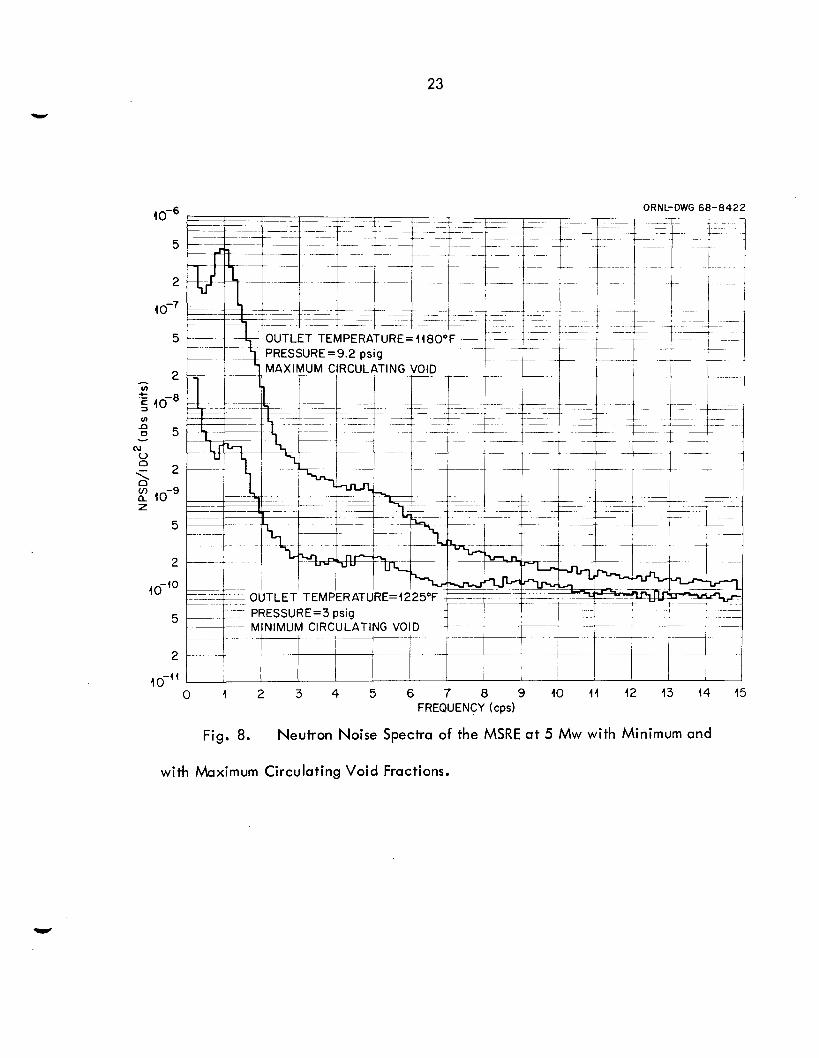
The averaged neutron noise showed the most sensitivity to changes in the reactor outlet temperature (Fig. 7). The largest effect was at the highest pressure of 9 psig, where the NPSD increased by a factor of almost 50 when the temperature was decreased from 1225 to 1 1 8 O O F . A t the normal operating pressure of 5 psig, the noise increased by a factor of 15 for this same change in temperature. Although data were taken only a t 1225 and 1180°F at 3 psig, the trend of increasing noise with decreasing temperature i s seen to be consistent with the results at 5 and 9 psig. As a further illustration, Fig. 8 shows the change in the entire 0.1- to 15-cps noise spectrum i n passing from a minimum to a maximum noise condition.
4.3.4 Neutron Noise vs Net Reactivity
The residual system reactivit$ i s determined by requiring a reactivity balance between the calculated reactivity and the reactivity inserted by a calibrated control rod. The net reactivity i s computed only as a steady-state quantity, although i t does, of course, change slowly as system parameters are varied. As mentioned earlier, the largest uncertainty i n the reactivity calculations i s believed to be the lack of a measure of the circulating void fraction and i t s effect on 13%e poisoning. Therefore the residual reactivity (KNET) i s dependent, among other things, on the void fraction.
20
ORNL- DWG 68- 8419 .--6 IO -
5
2
- c m 5 .- c 3 In 0 n v I f 2
I O 0
5
I I
I
2
i
5.0 5.2 5.4 5.6 5.8 6.0 6.2 6.4 FUEL PUMP TANK LEVEL (in.)
Fig. 5. Neutron Noise Level vs Fuel Pump Tank Salt Level for the MSRE
at 5 Mw.
21
ORNL- DWG 68- 8420
5
2
10-
10-
5
2
2.5 3.5 4.5 5.5 6.5 7.5 HELIUM PRESSURE ( psig)
8.5 9.5
Fig. 6. Neutron Noise Level vs Helium Cover G a s Pressure a t 5 Mw.
22
1u -
5
2
5
2
to-*
5
2
10-
ORNL- DWG 68- 8421
AVERAGE FUEL OUTLET TEMPERATURE (OF)
HELIUM PRESSURE
Fig. 7. Neutron Noise Level vs Average Fuel Temperature a t Core Outlet
for the MSRE a t 5 Mw.
23
40-6
5
2
4 0-7
5
u) n 0 5 Y
2
40-'O
5
ORNL-DWG68-8422
0 I 2 3 4 5 6 7 8 9 1 0 1 1 4 2 1 3 t 4 1 5 FREQUENCY (cps)
Fig. 8. Neutron Noise Spectra of the MSRE at 5 Mw with Minimum and
with Maximum Circulating Void Fractions.
24
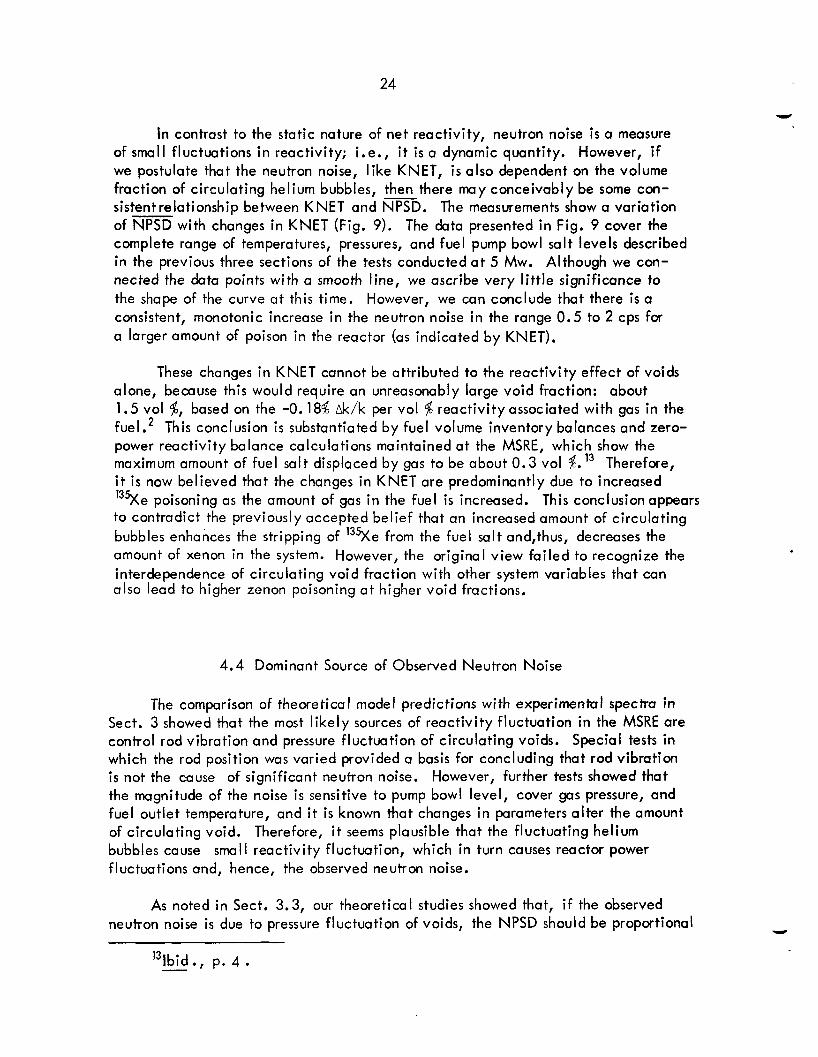
In contrast to the static nature of net reactivity, neutron noise i s a measure of small fluctuations i n reactivity; i.e., i t i s a dynamic quantity. However, if we postulate that the neutron noise, l ike KNET, i s also dependent on the volume fraction of circulating helium bubbles, - then there may conceivably be some con- sistentrelationship between KNET and NPSD. The measurements show a variation of NPSD with changes in KNET (Fig. 9). The data presented i n Fig. 9 cover the complete range of temperatures, pressures, and fuel pump bowl salt levels described in the previous three sections of the tests conducted a t 5 Mw. Although we con- nected the data points with a smooth line, we ascribe very l i t t le significance to the shape of the curve at this time. However, we can conclude that there i s a consistent, monotonic increase in the neutron noise i n the range 0.5 to 2 cps for a larger amount of poison in the reactor (as indicated by KNET).
These changes in KNET cannot be attributed to the reactivity effect of voids alone, because this would require an unreasonably large void fraction: about 1.5 vol 8, based on the -0.18% &/k per vol 4 reactivityassociated with gas i n the fuel.2 This conclusion is substantiated by fuel volume inventory balances and zero- power reactivity balance calculations maintained at the MSRE, which show the maximum amount of fuel salt displaced by gas to be about 0.3 vol $.13 Therefore, i t i s now believed that the changes in KNET are predominantly due to increased I3%e poisoning as the amount of gas i n the fuel i s increased. This conclusionappears to contradict the previously accepted belief that an increased amount of circulating bubbles enhances the stripping of 13%e from the fuel salt and,thus, decreases the amount of xenon in the system. However, the original view failed to recognize the interdependence of circulating void fraction with other system variables that can also lead to higher zenon poisoning a t higher void fractions,
4.4 Dominant Source of Observed Neutron Noise
The comparison of theoretical model predictions with experimental spectra in Sect. 3 showed that the most l ikely sources of reactivity fluctuation in the MSRE are control rod vibration and pressure fluctuation of circulating voids. Special tests in which the rod position was varied provided a b a s i s for concluding that rod vibration i s not the cause of significant neutron noise. the magnitude of the noise i s sensitive to pump bowl level, cover gas pressure, and fuel outlet temperature, and i t i s known that changes i n parameters alter the amount of circulating void. Therefore, i t seems plausible that the fluctuating helium bubbles cause s m a l l reactivity fluctuation, which i n turn causes reactor power fluctuations and, hence, the observed neutron noise.
However, further tests showed that
As noted i n Sect. 3.3, our theoretical studies neutron noise i s due to pressure fluctuation of voids,
showed that, i f the observed the NPSD should be proportional
131bid., - p. 4 .
u)
0 n
14
Fig. 9. Neutron Noise Level vs N e t Reactivity for the MSRE a t 5 Mw.
26
to the void fraction - squared, Therefore, we attempted to compare the measured NPSD (actually NPSD) with the estimated circulating void fraction at the time of the measurement . l4
To make this comparison, we assume an expression of the form
NPSD - y = aV2 , (6)
where NPSD i s NPSD/(IDC)*, averaged over the frequency range 0.5 to 2 cycles/sec; y i s the unavoidable background noise produced by the random neutron detection process; V i s the vol $ of circulating void; and CY i s a proportionality constant. Since the available experimental information i s the NPSD data and the change in void fraction (SV form
V - Vo) relative to some minimal condition Vo, we recast Eq. 6 in the
1 /2 .~
] - v o * N P S D - y
6V=[ Q
In Eq. 7, we must estimate y, cy, and Vo, but we have only six estimates of 6V. Therefore, some of these parameters must be estimated by other means.
(7)
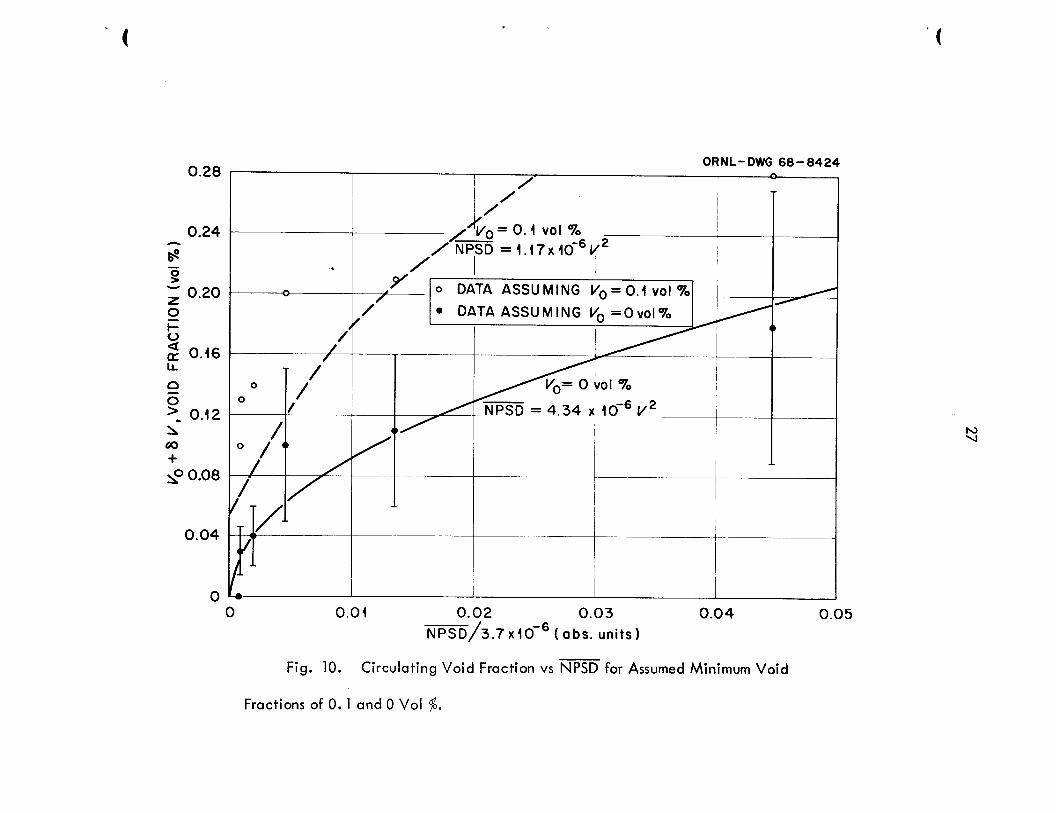
Since y i s very small relative to NPSD, we neglect y, leaving only the two parameters cyand V,. data; however, the 6V data i s estimated15 to be accurate to approximately k50$ only (this i s to be compared with a statistical precision of the NPSD data of 1 4 % ) . Because of t h i s large uncertainty i n 6V, we did not perform the two-parameter f i t but instead we assumed values for VO which probably bracket the real value, and used the experimental data only for the evaluation of cy. Figure 10 shows the results for an assumed Vo of 0.1 and zerovdl $ About a l l we can conclude from Fig. 10 i s (a) the minimal void fraction V, appears to be more nearly zero; and (b) more importantly, the NPSD does appear to have the predicted squared dependence on V, thus giving additional support to our conclusion that the neutron noise i n the MSRE i s caused mainly by pressure-induced variations of the helium volume in the reactor core. Although we have now established with some confidence that a causal relationship exists, we do not attempt to explain how the helium bubbles are introduced into the fuel salt or why the amount of void i n the salt i s so strongly dependent on the fuel pump bowl level, helium cover gas pressure, or fuel salt temperature.
In principle, these can be obtained with a f i t of Eq. 7 to the
"kngel has estimated the amount of circulating void present during the series of tests at 5-Mw power. expresses his estimates i n terms of a change in the void fraction from a minimum
He i s unable to supply an absolute void fraction, but rather
(or base condition) void fraction, -0.1 vol. $ (MSRP Sedann, Progr, Rept. Feb. 29, 1968, ORNL-4254, p. 4). W
I5J. R. Engel, ORNL, private communication.
. 3
0.28
0.24
#
2 r 0.20 0 i= v 2 0.46 IL
9 0.08
0.04
ORNL- DWG 68-8424 ORNL- DWG 68-8424
I /- 0 0
I
,9/ / I
0 DATA /
ASSUMING V, = 0.1 vol %
/ l
I’ DATA ASSUMING V. =Ovol%
/ /
0 o.oi 0.02 0.03 NPSD/3.7 x!Om6 1 obs. units)
Fig. 10. Circulating Void Fraction vs NPSD for Assumed Minimum Void
Fractions of 0.1 and 0 Vol %.
28
5. CONCLUSIONS
The results of experimental tests and analytical studies have shown th3t the principal source of small neutron-density fluctuation observed in the MSRE i s helium bubbles circulating i n the fuel salt.
We conclude from the limited amount of data that the neutron noise &-) in the frequency range from 0.5 to 2 cps varies as the square of the helium void fraction; furthermore, the absolute void fraction corresponding to the minimum noise condition observed i s more nearly zero than the previously accepted value of 0.15. These observations further substantiate that the neutron noise i s extremely sensitive to the helium void in the core. We therefore conclude that changes in the circulating void fraction can be inferred with good sensitivity directly from neutron noise measure- ments in the MSRE. Consequently, NPSD measurements can complement and enhance the value of reactivity balance calculations i n diagnosing residual reactivity i n the reactor by eliminating some of the reactivity uncertainty associated with an unknown amount of circulating void.
Finally, we believe that these results have indicated the usefulness of neutron noise analysis for on-line reactor diagnosis at the MSRE, but further work needs to be done before the method can be fu l ly implemented for measurement of voids.
6. FUTURE INVEST1 GATIONS
Although a l l spectra reported here were computed off-line, the NPSD can be computed on-line by the BR-340 computeband a program similar to that written for the CDC 1604-A computer i s currently being tested. l6 The estimated execution time i s approximately 8 min following acquisition of the ionization chamber data. This on-line data reduction system wi l l be used to repeat the tests described i n this report when the 233U-fueled MSRE reaches full-power operation.
Theoretical studies show that the absolute void fraction could be measured by crosscorrelating the neutron noise signal with a pressure noise signal obtained from a transducer placed in the primary loop of the MSRE. The existing pressure sensor, as pointed out earlier, i s located- 15 ft from the pump bowl i n a helium supply line. This location could make i t insensitive to the small pressure fluctuations that we believe are causing the bubble volume to fluctuate in the core. It is probably not feasible a t this late date to place a pressure sensor i n the primary loop of the MSRE, but such a sensor should be seriously considered when instruments are designed for a scaled-up version of this type reactor.
%. L. Partain, ORNL, private communication.
29
However, lacking the proper pressure signal, there may s t i l l be a way to establish a calibration between the neutron noise level and the absolute void fraction. A deterministic pressure fluctuation experiment i s capable of measuring quantitatively the absolute void fraction. A preliminary experiment of this type has been performed already i n which a sawtooth pressure fluctuation was purposely introduced and i t s effect on neutron level was investigated. l7 If the relationship between neutron noise and absolute void fraction can be calibrated using such a pressure test, then the NPSD should provide a relatively easy, on-line, non- disturbing measurement of the absolute void fraction.
17J. C. Robinson and D. N. Fry, Determination of the Void Fraction i n the MSRE Using Small Induced Pressure Perturbations, ORNL-TM-2318 (to be published).

31
ORN L-TM-23 15
IN TERN A L D I STR I BU TI 0 N
1. 2. 3. 4. 5. 6. 7. 8. 9.
10. 11. 12. 13. 14. 15. 16. 17. 18. 19. 20. 21. 22. 23. 24. 25. 26.
27-36. 37. 38. 39. 40. 41. 42. 43. 44. 45. 46. 47. 48. 49. 50. 51. 52.
R. K. Adams 53. A. 1. Krakoviak J. L. Anderson 54-63. R. C. Kryter S. J. Ball 64. H. G. MacPherson A.E. G. Bates 65. R. E. MacPherson H. F. Bauman 66. C. D. Martin S. E. Beall 67. H. E. McCoy M. Bender 68. R. L. Moore E. S. Bettis 69. E. L. Nicholson 0. S. Billington 70. L. C. Oakes F. T. Binford 71. H. G. O'Brien E. G. Bohlmann 72. G. R. Owens C. J. Borkowski 73. R. W. Peelle G. E. Boyd 74. A. M. Perry R. B. Briggs 75. R. B. Perez J. B. Bullock 76. H. P. Piper T. E. Cole 77. B. E. Prince J. A. Cox 78. J. L. Redford J. L. Crowley 79-80. M. W. Rosenthal F. L. Culler, Jr. 81. D. P. Roux R. A. Dandl 82. G. S. Sadowski H. P. Danforth 83. Dunlap Scott S. J. Ditto 84. M. J. Skinner W. P. Eatherly 85. R. C. Steffy J. R. Engol 86. C. B. Stokes D. E. Ferguson 87. J. R. Tallackson A. P. Fraas 88. R. E. Thoma D. N. Fry 89. D. B. Trauger J. H. Frye, Jr. 90. C. S. Walker C. H. Gabbard 91. J. R. Weir R. B, Gallaher 92. K. W. West W. R. Grimes 93. A. M. Weinberg A. G. Grindell 94. M. E. Whatiey G. C. Guerrant 95. J. C. White R. H. Guymon 96. Gale Young P. H. Harley 97-98. Centra I Research Library C. S. Harrill 99. Document Reference Section P. N. Haubenreich 100-102. Laboratory Records Department A. Houtzeel 103. Laboratory Records, ORNL R. C. T. L. Hudson 104. ORNL Patent Off ice W. H. Jordan 105-1 19. Division of Technical Information P. R. Kasten Extension R. J. Ked1 120. Laboratory and University Division, M. T. Kelley OR0
121. Nuclear Safety Information Center
32
EXTERNAL DISTRIBUTION
122. N. J. Ackermann, University of Tennessee, Knoxville, Tennessee 123. A. Z. Akcasu, University of Michigan, Ann Arbor, Michigan, 124. C. B. Deering, AEC-OSR 125. C. E. Cohn, Argonne National Laboratory, Argonne, Illinois 126. E. P. Epler, Oak Ridge, Tennessee 127. A. Giambusso, AEC-Washington 128. S. H. Hanauer, University of Tennessee, Knoxville, Tennessee 129. T. W. Kerlin, University of Tennessee, Knoxville, Tennessee 130. A. E. Klickman, Atomic Power Development Association, Detroit,
131. 8. R. Lawrence, Australian AEC (UKAEA, Risley, England) 132. F. C. Legler, Atomic Energy Commission, Washington, D. C. 133. G. H. McCright, Black and Veatch, Kansas City, Missouri
136. M. N. Moore, Sun Fernando Valley State College, Northridge,
137. R. K. Osborne, University of Michigan, Ann Arbor, Michigan 138. C. L. Partain, University of Missouri, Columbia, Missouri 139. J. R. Penland, University of Tennessee, Knoxville, Tennessee 140. Joseph Pidkowicz, USAEC, Oak Ridge, Tennessee 141. C. A. Preskitt, Gulf General Atomic, Sun Diego, California 142. V. Rajagopal, Westinghouse Atomic Power Division, Pittsburgh,
143. R. L. Randall, Atomics International, Canoga Park, California 144. C. W. Ricker, Albion College, Albion, Michigan
145-154, J. C. Robinson, University of Tennessee, Knoxville, Tennessee 155. H. M. Roth, AEC-OR0 156. R. F. Saxe, North Carolina State University, Raleigh, North Carolina 157. M. A. Schul tz, Pennsylvania State University, University Park,
158. K. J. Serdula, Atomic Energy of Canada, Ltd, Chalk River, Ontario 159. J. R. Sheff, Battel le-Pacific Northwest Laboratory, Richland,
160, W. L. Smalley, AEC-OR0 161. J. A. Thie, Consultant, Chicago, Illinois 1 6 2 J. R. Trinko, Jr., EBR-II Argonne National Laboratory, Idaho Falls, Idaho 163. C. 0. Thomas, University of Tennessee, Knoxville, Tennessee 164, R. E. Uhrig, University of Florida, Gainesville, Florida 165, P. J. Wood, MIT Practice School
Mi ch i gan
134-135. T. W. McIntosh, AEC-Washington
California
Pennsylvania
Pen ns y I vu n ia
Wash i ng ton