Embed Size (px)
Citation preview
1
Union Budget ANALYSIS 2017-18
ANALYSIS 2017 - 18
Credit Analysis & Research Ltd.
UNION BUDGET
1
Union Budget ANALYSIS 2017-18
Airlines............................................................ 15
Airports........................................................... 16
Auto Ancillaries .............................................. 17
Automobiles .............................................. 18-19
BFSI ............................................................ 20-21
Cement ........................................................... 22
Construction .............................................. 23-24
Education ........................................................ 25
Engineering & Capital Goods ..................... 26-28
Fertilizers ................................................... 29-30
FMCG ............................................................. 31
Non-ferrous Metals ........................................ 32
Oil and Gas ..................................................... 33
Petrochemicals ............................................... 34
Pharmaceuticals ........................................ 35-36
Pipes .......................................................... 37-38
Ports ............................................................... 39
Power ........................................................ 40-41
Real Estate ...................................................... 42
Roads ........................................................ 43-44
Steel ........................................................... 45-46
Telecom Services ............................................ 47
TABLE OF CONTENTSForeword .........................................................2
Macro Economic Backdrop ...........................3-5
Union Budget 2017-18 ...............................6-14
Industry Allocation Sectors
Impact Symbols
PositiveNegativeNeutral
2
Union Budget ANALYSIS 2017-18
The Union Budget for FY18 has been presented against the background of the global economy facing considerable
uncertainty and in the aftermath of major economic development during the last few months. On the domestic
front, the economy was impacted by the outcomes following demonetization which has affected growth prospects
as presented by the Economic Survey. Hence the budget was expected to make announcements to spur growth and
ensure that the economy is back on the path of sustained growth. In this regard, the Budget does not disappoint and
provides the right thrust for growth essentially through infrastructure spending.
The Budget also continued on the steady path of fiscal consolidation with a 3.2% fiscal target for FY18; gliding
towards the 3% target in the next three years. The Finance Minister took the stance to not do anything significant
on the indirect taxes front as we move towards GST during the course of FY18. On direct taxes, the thrust was to
widen the tax base with benefits provided for both individuals and smaller corporates. For individuals there is
relaxation of income tax for income levels between Rs 2.5 to 5 lakh. I case of SME sector there would be benefits
under corporate tax. On the whole, it can be termed as being a balanced budget which works within the confines to
the fiscal prudence while meeting the objective of growth and distribution with focus on social programmes.
Based on the thrust provided by the government on spending, several sectors will witness an impetus on account of
various announcements made to boost economic growth such as cement, steel, metal products etc.
Going forward, the major challenge faced by the economy includes GST. This policy initiative would transform the
way in which business is conducted. Implementation of GST would be advantageous in terms of spurring growth,
competitiveness, indirect tax simplification and greater transparency.
We are confident that the Government will meet all the challenges and put the economy in a strong position and
the economy will be posed for higher growth in future. .
With best wishes
Rajesh Mokashi
MD & CEO - CARE Ratings
Foreword
3
Union Budget ANALYSIS 2017-18
India’s Economic performance in 2016-17, in the backdrop of significant developments and disturbances in the global and domestic economic environment has moderated as highlighted in the Economic Survey. Economic growth is however expected to revive in 2017-18 with the expected normalization in the economy as the cash crunch eases. This is indicative of the relative stability of the economy.
In terms of fiscal position, there has been an improvement in the government’s fiscal management in 2016-17 aided by the buoyancy in revenue collections.
The performance of key economic indicators and the major policy developments of 2016-17 along with the outlook for 2017-18 is given below.
Macroeconomic Performance• Real GDP in the H1FY17 was 7.2% as compared to 7.6% in H2FY16 on account of weaker investments from the corporates.
On the other hand, there was an increase in government consumption as 7th Pay Commission recommendations were implemented and there was an increase in demand from advanced economies that helped exports to raise that further helped the economy to stay on its growth path.
• CPI inflation increased for the first few months of 2016-17 on account of rise in the prices of pulses and vegetables but declined subsequently and stood at 3.4% in Dec’16 aided by the decline in food prices.
• On the other hand, WPI inflation increased from -5.1% from August 2015 to 3.4% at the end of December. This increase is attributed to increase in international oil prices. It is expected that CPI inflation will remain below the RBI’s target of 5% for the year as demonetization has led to a decrease in demand for commodities.
• The trade deficit has declined by 23.5 % in April -December 2016 vis-à-vis same period last year. This is attributed to two time period .This is attributed to the contraction in imports that were more than the contraction in exports in H1FY16 and improvement in exports in October –Dec 2016 on account of an increase in demand from US and Germany led by better growth results.
• The Current account deficit (CAD) has declined to 0.3% of GDP IN H1FY17.
• As per the first advance estimates of the CSO, growth rate of the industrial sector comprising mining & quarrying, manufacturing, electricity and construction is projected to decline from 7.4% in FY16 to 5.2% in FY17. During April-November FY17, a modest growth of 0.4% has been observed in IIP. This was the composite effect of a strong growth in electricity generation and moderation in mining and manufacturing. In terms of use-based classification, basic goods, intermediate goods and consumer durable goods attained moderate growth. Conversely, the production of capital goods declined steeply and consumer non-durable goods sectors suffered a modest contraction during April-November FY17
Macro-Economic Backdrop
4
Union Budget ANALYSIS 2017-18
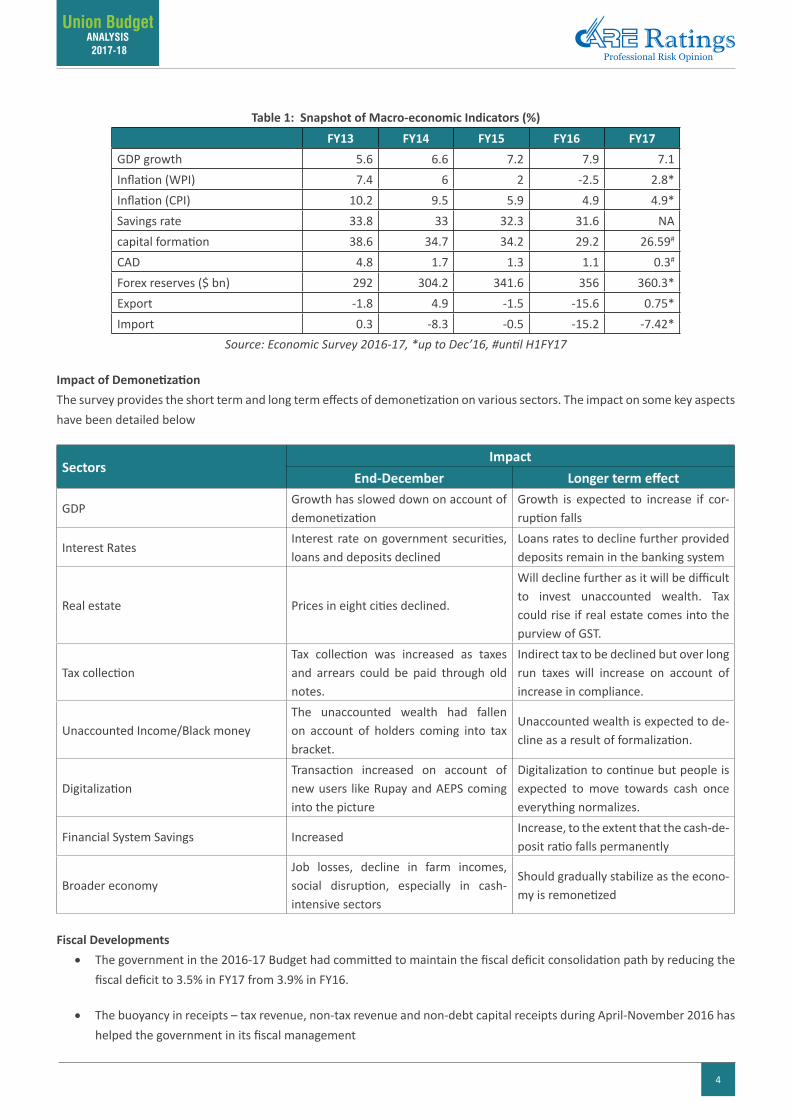
Table 1: Snapshot of Macro-economic Indicators (%) FY13 FY14 FY15 FY16 FY17
GDP growth 5.6 6.6 7.2 7.9 7.1Inflation (WPI) 7.4 6 2 -2.5 2.8*Inflation (CPI) 10.2 9.5 5.9 4.9 4.9*Savings rate 33.8 33 32.3 31.6 NAcapital formation 38.6 34.7 34.2 29.2 26.59#
CAD 4.8 1.7 1.3 1.1 0.3#
Forex reserves ($ bn) 292 304.2 341.6 356 360.3*Export -1.8 4.9 -1.5 -15.6 0.75*Import 0.3 -8.3 -0.5 -15.2 -7.42*
Source: Economic Survey 2016-17, *up to Dec’16, #until H1FY17
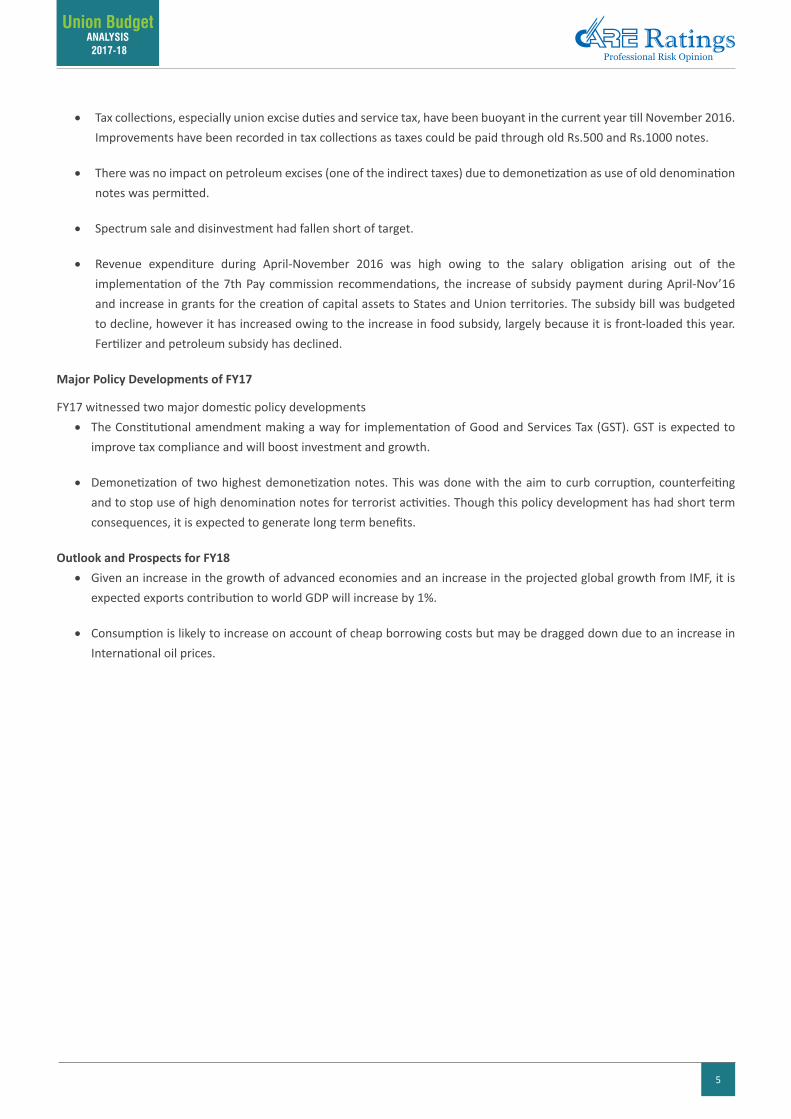
Impact of Demonetization The survey provides the short term and long term effects of demonetization on various sectors. The impact on some key aspects have been detailed below
SectorsImpact
End-December Longer term effect
GDPGrowth has slowed down on account of demonetization
Growth is expected to increase if cor-ruption falls
Interest RatesInterest rate on government securities, loans and deposits declined
Loans rates to decline further provided deposits remain in the banking system
Real estate Prices in eight cities declined.
Will decline further as it will be difficult to invest unaccounted wealth. Tax could rise if real estate comes into the purview of GST.
Tax collection Tax collection was increased as taxes and arrears could be paid through old notes.
Indirect tax to be declined but over long run taxes will increase on account of increase in compliance.
Unaccounted Income/Black moneyThe unaccounted wealth had fallen on account of holders coming into tax bracket.
Unaccounted wealth is expected to de-cline as a result of formalization.
DigitalizationTransaction increased on account of new users like Rupay and AEPS coming into the picture
Digitalization to continue but people is expected to move towards cash once everything normalizes.
Financial System Savings IncreasedIncrease, to the extent that the cash-de-posit ratio falls permanently
Broader economyJob losses, decline in farm incomes, social disruption, especially in cash-intensive sectors
Should gradually stabilize as the econo-my is remonetized
Fiscal Developments • The government in the 2016-17 Budget had committed to maintain the fiscal deficit consolidation path by reducing the
fiscal deficit to 3.5% in FY17 from 3.9% in FY16.
• The buoyancy in receipts – tax revenue, non-tax revenue and non-debt capital receipts during April-November 2016 has helped the government in its fiscal management
5
Union Budget ANALYSIS 2017-18
• Tax collections, especially union excise duties and service tax, have been buoyant in the current year till November 2016. Improvements have been recorded in tax collections as taxes could be paid through old Rs.500 and Rs.1000 notes.
• There was no impact on petroleum excises (one of the indirect taxes) due to demonetization as use of old denomination notes was permitted.
• Spectrum sale and disinvestment had fallen short of target.
• Revenue expenditure during April-November 2016 was high owing to the salary obligation arising out of the implementation of the 7th Pay commission recommendations, the increase of subsidy payment during April-Nov’16 and increase in grants for the creation of capital assets to States and Union territories. The subsidy bill was budgeted to decline, however it has increased owing to the increase in food subsidy, largely because it is front-loaded this year. Fertilizer and petroleum subsidy has declined.
Major Policy Developments of FY17
FY17 witnessed two major domestic policy developments• The Constitutional amendment making a way for implementation of Good and Services Tax (GST). GST is expected to
improve tax compliance and will boost investment and growth.
• Demonetization of two highest demonetization notes. This was done with the aim to curb corruption, counterfeiting and to stop use of high denomination notes for terrorist activities. Though this policy development has had short term consequences, it is expected to generate long term benefits.
Outlook and Prospects for FY18• Given an increase in the growth of advanced economies and an increase in the projected global growth from IMF, it is
expected exports contribution to world GDP will increase by 1%.
• Consumption is likely to increase on account of cheap borrowing costs but may be dragged down due to an increase in International oil prices.
6
Union Budget ANALYSIS 2017-18
The Union Budget for 2017-18 can be seen as being a pragmatic Budget, having its agenda outlined towards investments, rural development, skill enhancement, welfare programs and boost to consumption by way of tax relief and social sector schemes, all the while keeping its eye on the fiscal consolidation roadmap.
Although the Budget did not lower the much anticipated corporate tax rates, the higher infrastructure spends and thrust towards affordable housing would help provide the much needed stimulus for industrial output and private investment. The anticipated lift in consumption that is anticipated with the tax rate cut and welfare measures too would further help improve industrial output.
Key Features of the Union Budget 2017-18
Fiscal Prudence Maintained: • The government has made good its commitment to adhere to the Fiscal consolidation roadmap of progressively
lowering the fiscal deficit.
• The fiscal deficit for FY17 at 3.2% of GDP is lower than the FRBM (Fiscal Responsibility and Budget Management) committee target of 3.5% for the year.
• Although, the FRBM target for FY18 and the subsequent 2 years is 3%, given the spending requirement towards public investment, fiscal deficit for FY18 is targeted at 3.2% and 3% in FY19.
Agriculture and Rural economy at the fore: • The increased access to funds, interest waiver, higher insurance coverage, allocations to improve infrastructure and
increased coverage of National agriculture markets announced in the Budget and by the Prime Minister on 31 Dec’16 are all steps towards achieving the government aim of doubling farmers’ economy in 5 years.
• For poverty alleviation and improving civic infrastructure in rural areas various programs have been announced and higher allocation have been made in the FY18 Budget.
• Allocations towards rural development have been budgeted to increase by 10% in FY18 from that in FY17(RE) and 36% from that in FY16. Allocation towards MGNREGA at Rs. 48,000/- is to be highest ever in FY18.
Emphasis on Skill Development for employment opportunities:
• Plans to introduce quality higher education and moves to accord higher autonomy to good quality educational institutions are some of the measures along with higher allocation towards developing market relevant employment skills.
Increased allocations towards Social welfare: • To strengthen healthcare facilities the Budget has proposed increasing the number of post graduate medical seats as well
as set up 2 AIIMS (Jharkhand and Gujarat).
• Allocations towards schedule castes and scheduled tribes has been increased by 35% in FY18 compared to FY17 Budget estimate.
• Higher allocation and infrastructure status accorded to affordable housing. This will boost the realty sector as well as sectors that have backward linkages with realty such as cement, steel etc.
Union Budget 2017-18
7
Union Budget ANALYSIS 2017-18
Investment Revival and Impetus to Industrial Production: • The capital expenditure budgeted for FY18 is the highest at Rs. 3.09 lakh crore.
• The focus of this investment is on creating transport infrastructure – rail, road and shipping.
• This public investment would help crowd in private investment, albeit at a gradual pace given the weakness in corporate and bank balance sheets.
Government Borrowings - Lower Future Liability: • The fiscal consolidation adopted by the government and the consequent reduced borrowing lowers the debt of the
government and thereby the resultant future interest payment liability.
• Interest payments have been accounting for 33- 35% of the Revenue Receipts in the last 5 years, thereby constraining the ability of the government to undertake productive/developmental expenditure.
• The net government borrowings for FY18 are budgeted lower at Rs. 3.48 lakh crs, lower than the Rs. 4.25 lakh crs budgeted in FY17.
Boost to Foreign Investments: • Foreign Investment Promotion Board to be abolished in 2017-18 and further liberalization of FDI policy is under
consideration.
• The withholding tax concession of 5% on interest earned by foreign entities in external commercial borrowings or in bonds and Government securities and Masala bonds is extended to June’2020. Foreign Portfolio Investor (FPI) Category I & II exempted from indirect transfer provision. All this will bode well for foreign investments into the country.
Relief to banks: • Allowable provision for Non-Performing Asset of Banks increased from 7.5% to 8.5%.
• Interest taxable on actual receipt instead of accrual basis in respect of NPA accounts of all non-scheduled cooperative banks also to be treated at par with scheduled banks.
Tax benefits for MSME: • In order to make MSME companies more viable, income tax for companies with annual turnover up to Rs.50 crore is
reduced to 25%.
Personal Income Tax – Rate Reduction and Simplification of tax filing:
• Tax rate for individual assesses between income of Rs.2.5 lakhs to 5 lakhs reduced to 5% from the present rate of 10%.
• Surcharge of 10% of tax payable on categories of individuals whose annual taxable income is between Rs.50 lakhs and Rs. 1 crore.
• Simple one-page form to be filed as Income Tax Return for the category of individuals having taxable income up to Rs 5 lakhs other than business income.
• New pension scheme for senior citizens introduced that will pay 8% interest per annum.
Promoting Digital Economy : • No transaction above Rs.3 lakh would be permitted in cash subject to certain exceptions. Presumptive income for small
and medium tax payers whose turnover is up to Rs. 2 crores has been reduced from 8% of turnover to 6% of turnover for turnover that in by non-cash means.
8
Union Budget ANALYSIS 2017-18
• Manufacture of devices used towards digital payments exempt from BCD, Excise/CV duty and SAD.
Fiscal Situation
Rs Crore FY14 FY15 FY16 FY17(RE) FY18(BE)
Revenue Receipts 10,14,724 11,01,472 11,95,025 14,23,562 15,15,771
Tax Revenue 8,15,854 9,03,615 9,43,765 10,88,792 12,27,014
Non tax revenue 1,98,870 1,97,857 2,51,260 3,34,770 2,88,757
Capital Receipts 5,44,723 5,62,201 5,95,748 5,90,845 6,30,964
Total Receipts 15,59,447 16,63,674 17,90,773 20,14,408 21,46,735
Revenue Expenditure 13,71,772 14,66,992 15,37,761 17,34,560 18,36,934
Capital Expenditure 1,87,675 1,96,681 2,53,022 2,79,847 3,09,801
Total Expenditure 15,59,447 16,63,673 17,90,783 20,14,407 21,46,735
Revenue Deficit 3,57,048 3,65,519 3,42,736 3,10,998 3,21,163
Fiscal Deficit 5,02,858 5,10,725 5,32,791 5,34,274 5,46,532
Primary Deficit 1,28,604 1,08,281 91,132 51,205 23,454
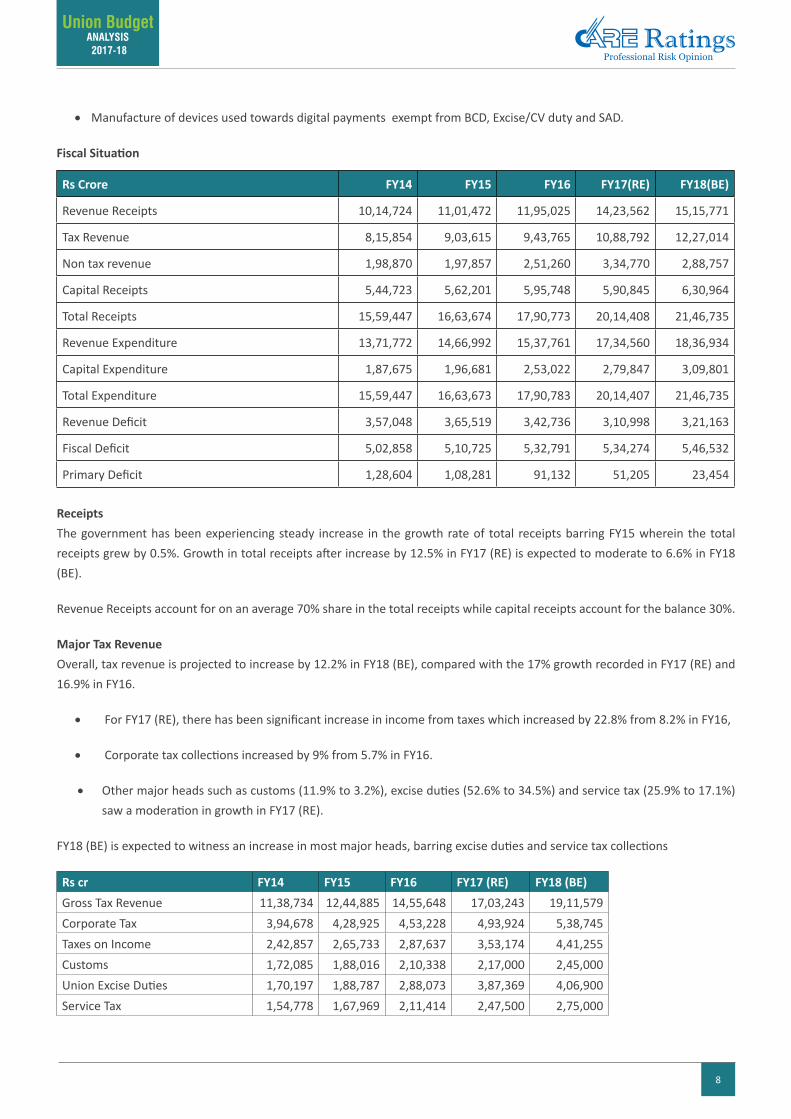
ReceiptsThe government has been experiencing steady increase in the growth rate of total receipts barring FY15 wherein the total receipts grew by 0.5%. Growth in total receipts after increase by 12.5% in FY17 (RE) is expected to moderate to 6.6% in FY18 (BE).
Revenue Receipts account for on an average 70% share in the total receipts while capital receipts account for the balance 30%.
Major Tax RevenueOverall, tax revenue is projected to increase by 12.2% in FY18 (BE), compared with the 17% growth recorded in FY17 (RE) and 16.9% in FY16.
• For FY17 (RE), there has been significant increase in income from taxes which increased by 22.8% from 8.2% in FY16,
• Corporate tax collections increased by 9% from 5.7% in FY16.
• Other major heads such as customs (11.9% to 3.2%), excise duties (52.6% to 34.5%) and service tax (25.9% to 17.1%) saw a moderation in growth in FY17 (RE).
FY18 (BE) is expected to witness an increase in most major heads, barring excise duties and service tax collections
Rs cr FY14 FY15 FY16 FY17 (RE) FY18 (BE)Gross Tax Revenue 11,38,734 12,44,885 14,55,648 17,03,243 19,11,579Corporate Tax 3,94,678 4,28,925 4,53,228 4,93,924 5,38,745Taxes on Income 2,42,857 2,65,733 2,87,637 3,53,174 4,41,255Customs 1,72,085 1,88,016 2,10,338 2,17,000 2,45,000Union Excise Duties 1,70,197 1,88,787 2,88,073 3,87,369 4,06,900Service Tax 1,54,778 1,67,969 2,11,414 2,47,500 2,75,000
9
Union Budget ANALYSIS 2017-18
Our viewIncrease in tax revenue is premised on higher growth in GDP resulting in higher collections from excise and corporate tax. Also higher income tax collections would result from better compliance with demonetization migrating some part of the black economy into the formal segment which can be taxed. Higher customs would depend on the growth in imports which are implicitly expected to increase.
These numbers do not overtly take into account any receipts from IDS or the implications of GST which is to come in July 2017. S
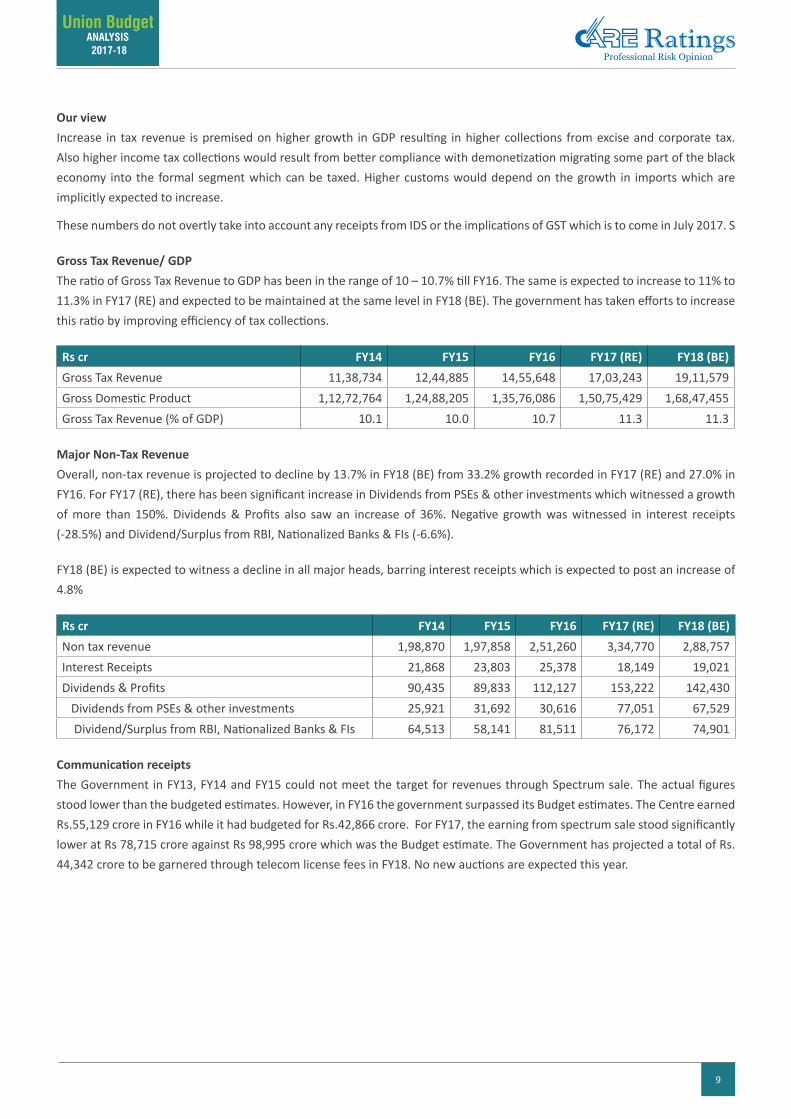
Gross Tax Revenue/ GDPThe ratio of Gross Tax Revenue to GDP has been in the range of 10 – 10.7% till FY16. The same is expected to increase to 11% to 11.3% in FY17 (RE) and expected to be maintained at the same level in FY18 (BE). The government has taken efforts to increase this ratio by improving efficiency of tax collections.
Rs cr FY14 FY15 FY16 FY17 (RE) FY18 (BE)Gross Tax Revenue 11,38,734 12,44,885 14,55,648 17,03,243 19,11,579Gross Domestic Product 1,12,72,764 1,24,88,205 1,35,76,086 1,50,75,429 1,68,47,455Gross Tax Revenue (% of GDP) 10.1 10.0 10.7 11.3 11.3
Major Non-Tax RevenueOverall, non-tax revenue is projected to decline by 13.7% in FY18 (BE) from 33.2% growth recorded in FY17 (RE) and 27.0% in FY16. For FY17 (RE), there has been significant increase in Dividends from PSEs & other investments which witnessed a growth of more than 150%. Dividends & Profits also saw an increase of 36%. Negative growth was witnessed in interest receipts (-28.5%) and Dividend/Surplus from RBI, Nationalized Banks & FIs (-6.6%).
FY18 (BE) is expected to witness a decline in all major heads, barring interest receipts which is expected to post an increase of 4.8%
Rs cr FY14 FY15 FY16 FY17 (RE) FY18 (BE)Non tax revenue 1,98,870 1,97,858 2,51,260 3,34,770 2,88,757Interest Receipts 21,868 23,803 25,378 18,149 19,021Dividends & Profits 90,435 89,833 112,127 153,222 142,430 Dividends from PSEs & other investments 25,921 31,692 30,616 77,051 67,529 Dividend/Surplus from RBI, Nationalized Banks & FIs 64,513 58,141 81,511 76,172 74,901
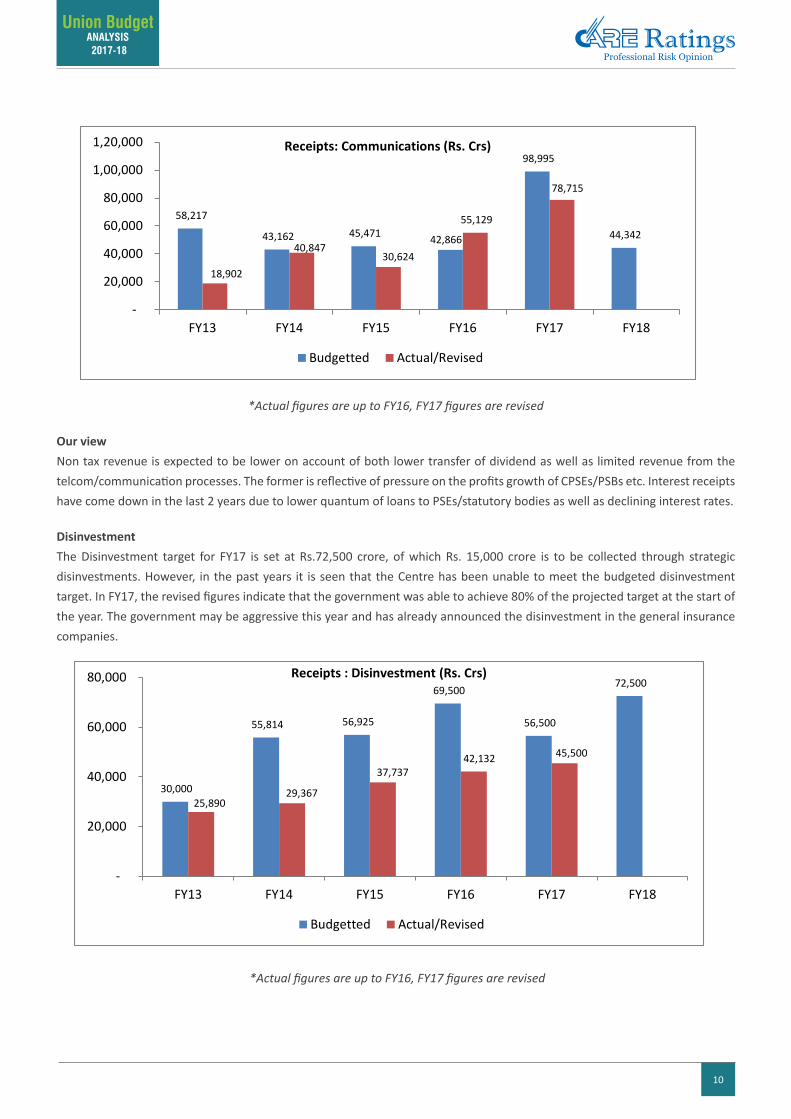
Communication receiptsThe Government in FY13, FY14 and FY15 could not meet the target for revenues through Spectrum sale. The actual figures stood lower than the budgeted estimates. However, in FY16 the government surpassed its Budget estimates. The Centre earned Rs.55,129 crore in FY16 while it had budgeted for Rs.42,866 crore. For FY17, the earning from spectrum sale stood significantly lower at Rs 78,715 crore against Rs 98,995 crore which was the Budget estimate. The Government has projected a total of Rs. 44,342 crore to be garnered through telecom license fees in FY18. No new auctions are expected this year.
10
Union Budget ANALYSIS 2017-18
58,217
43,162 45,471 42,866
98,995
44,342
18,902
40,847 30,624
55,129
78,715
-
20,000
40,000
60,000
80,000
1,00,000
1,20,000
FY13 FY14 FY15 FY16 FY17 FY18
Receipts: Communications (Rs. Crs)
Budgetted Actual/Revised
30,000
55,814 56,925
69,500
56,500
72,500
25,890 29,367
37,737 42,132 45,500
-
20,000
40,000
60,000
80,000
FY13 FY14 FY15 FY16 FY17 FY18
Receipts : Disinvestment (Rs. Crs)
Budgetted Actual/Revised
0
10000
20000
30000
40000
50000
60000
Atom
ic E
nerg
y
Civi
l Avi
atio
n
Defe
nce
(Misc
)
Exte
rnal
Affa
irs
Fina
ncia
l Ser
vice
s
Pow
er
Railw
ays
Road
, Tra
nspo
rt a
ndHi
ghw
ays Sp
ace
Urb
an D
evel
opm
ent
Capital Expediture (Rs. Cr.)
FY16 FY17(RE) FY18(BE)
*Actual figures are up to FY16, FY17 figures are revised
Our viewNon tax revenue is expected to be lower on account of both lower transfer of dividend as well as limited revenue from the telcom/communication processes. The former is reflective of pressure on the profits growth of CPSEs/PSBs etc. Interest receipts have come down in the last 2 years due to lower quantum of loans to PSEs/statutory bodies as well as declining interest rates.
DisinvestmentThe Disinvestment target for FY17 is set at Rs.72,500 crore, of which Rs. 15,000 crore is to be collected through strategic disinvestments. However, in the past years it is seen that the Centre has been unable to meet the budgeted disinvestment target. In FY17, the revised figures indicate that the government was able to achieve 80% of the projected target at the start of the year. The government may be aggressive this year and has already announced the disinvestment in the general insurance companies.
58,217
43,162 45,471 42,866
98,995
44,342
18,902
40,847 30,624
55,129
78,715
-
20,000
40,000
60,000
80,000
1,00,000
1,20,000
FY13 FY14 FY15 FY16 FY17 FY18
Receipts: Communications (Rs. Crs)
Budgetted Actual/Revised
30,000
55,814 56,925
69,500
56,500
72,500
25,890 29,367
37,737 42,132 45,500
-
20,000
40,000
60,000
80,000
FY13 FY14 FY15 FY16 FY17 FY18
Receipts : Disinvestment (Rs. Crs)
Budgetted Actual/Revised
0
10000
20000
30000
40000
50000
60000
Atom
ic E
nerg
y
Civi
l Avi
atio
n
Defe
nce
(Misc
)
Exte
rnal
Affa
irs
Fina
ncia
l Ser
vice
s
Pow
er
Railw
ays
Road
, Tra
nspo
rt a
ndHi
ghw
ays Sp
ace
Urb
an D
evel
opm
ent
Capital Expediture (Rs. Cr.)
FY16 FY17(RE) FY18(BE)
*Actual figures are up to FY16, FY17 figures are revised
11
Union Budget ANALYSIS 2017-18
Our viewsThis is one area of concern and there could be a slippage in case this target is not met. A lot will depend on the state of the capital market as well as the performance of these companies as ‘valuation’ will be important at the time of stake sale. This is particularly because the dividends from these enterprises have not been projected to increase this year. Disinvesting insurance companies would be for the first time and would probably also be the leading stake sales this year.
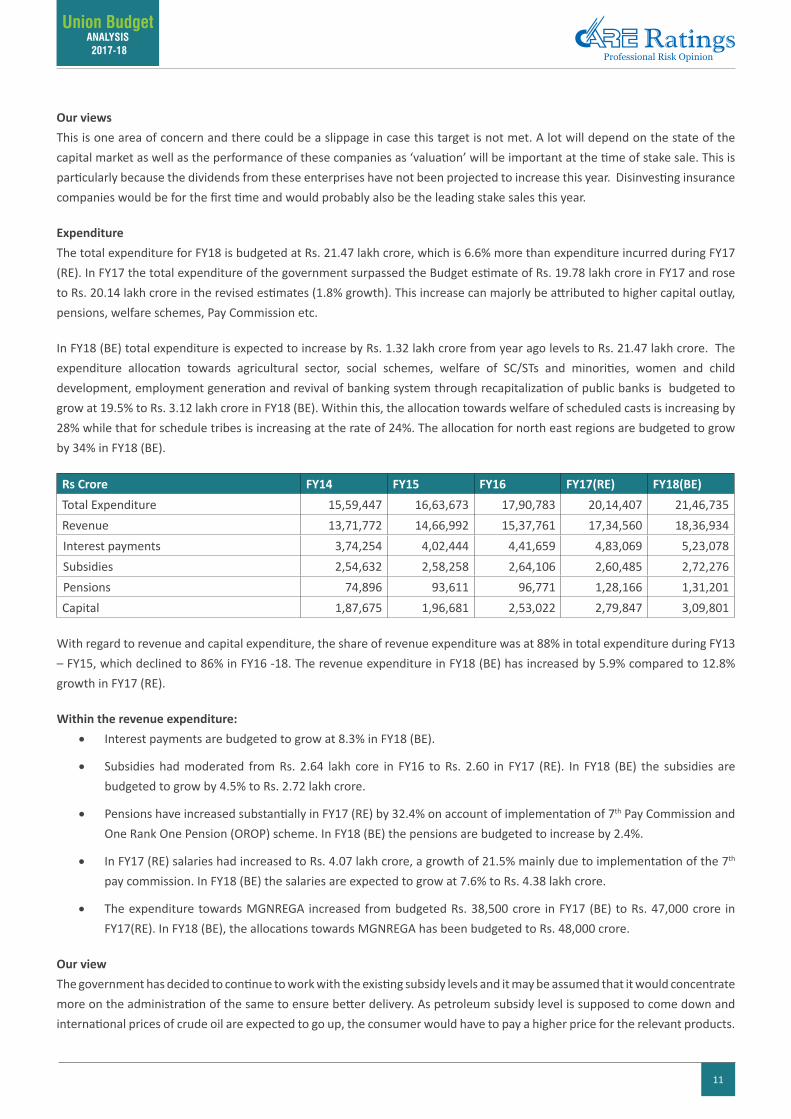
ExpenditureThe total expenditure for FY18 is budgeted at Rs. 21.47 lakh crore, which is 6.6% more than expenditure incurred during FY17 (RE). In FY17 the total expenditure of the government surpassed the Budget estimate of Rs. 19.78 lakh crore in FY17 and rose to Rs. 20.14 lakh crore in the revised estimates (1.8% growth). This increase can majorly be attributed to higher capital outlay, pensions, welfare schemes, Pay Commission etc.
In FY18 (BE) total expenditure is expected to increase by Rs. 1.32 lakh crore from year ago levels to Rs. 21.47 lakh crore. The expenditure allocation towards agricultural sector, social schemes, welfare of SC/STs and minorities, women and child development, employment generation and revival of banking system through recapitalization of public banks is budgeted to grow at 19.5% to Rs. 3.12 lakh crore in FY18 (BE). Within this, the allocation towards welfare of scheduled casts is increasing by 28% while that for schedule tribes is increasing at the rate of 24%. The allocation for north east regions are budgeted to grow by 34% in FY18 (BE).
Rs Crore FY14 FY15 FY16 FY17(RE) FY18(BE)Total Expenditure 15,59,447 16,63,673 17,90,783 20,14,407 21,46,735Revenue 13,71,772 14,66,992 15,37,761 17,34,560 18,36,934Interest payments 3,74,254 4,02,444 4,41,659 4,83,069 5,23,078Subsidies 2,54,632 2,58,258 2,64,106 2,60,485 2,72,276Pensions 74,896 93,611 96,771 1,28,166 1,31,201Capital 1,87,675 1,96,681 2,53,022 2,79,847 3,09,801
With regard to revenue and capital expenditure, the share of revenue expenditure was at 88% in total expenditure during FY13 – FY15, which declined to 86% in FY16 -18. The revenue expenditure in FY18 (BE) has increased by 5.9% compared to 12.8% growth in FY17 (RE).
Within the revenue expenditure:• Interest payments are budgeted to grow at 8.3% in FY18 (BE).
• Subsidies had moderated from Rs. 2.64 lakh core in FY16 to Rs. 2.60 in FY17 (RE). In FY18 (BE) the subsidies are budgeted to grow by 4.5% to Rs. 2.72 lakh crore.
• Pensions have increased substantially in FY17 (RE) by 32.4% on account of implementation of 7th Pay Commission and One Rank One Pension (OROP) scheme. In FY18 (BE) the pensions are budgeted to increase by 2.4%.
• In FY17 (RE) salaries had increased to Rs. 4.07 lakh crore, a growth of 21.5% mainly due to implementation of the 7th pay commission. In FY18 (BE) the salaries are expected to grow at 7.6% to Rs. 4.38 lakh crore.
• The expenditure towards MGNREGA increased from budgeted Rs. 38,500 crore in FY17 (BE) to Rs. 47,000 crore in FY17(RE). In FY18 (BE), the allocations towards MGNREGA has been budgeted to Rs. 48,000 crore.
Our viewThe government has decided to continue to work with the existing subsidy levels and it may be assumed that it would concentrate more on the administration of the same to ensure better delivery. As petroleum subsidy level is supposed to come down and international prices of crude oil are expected to go up, the consumer would have to pay a higher price for the relevant products.
12
Union Budget ANALYSIS 2017-18
In particular LPG prices would move up.
Lower growth in interest payments is a positive sign as net borrowings for the year has come down combined with an expected lower interest rate regime.
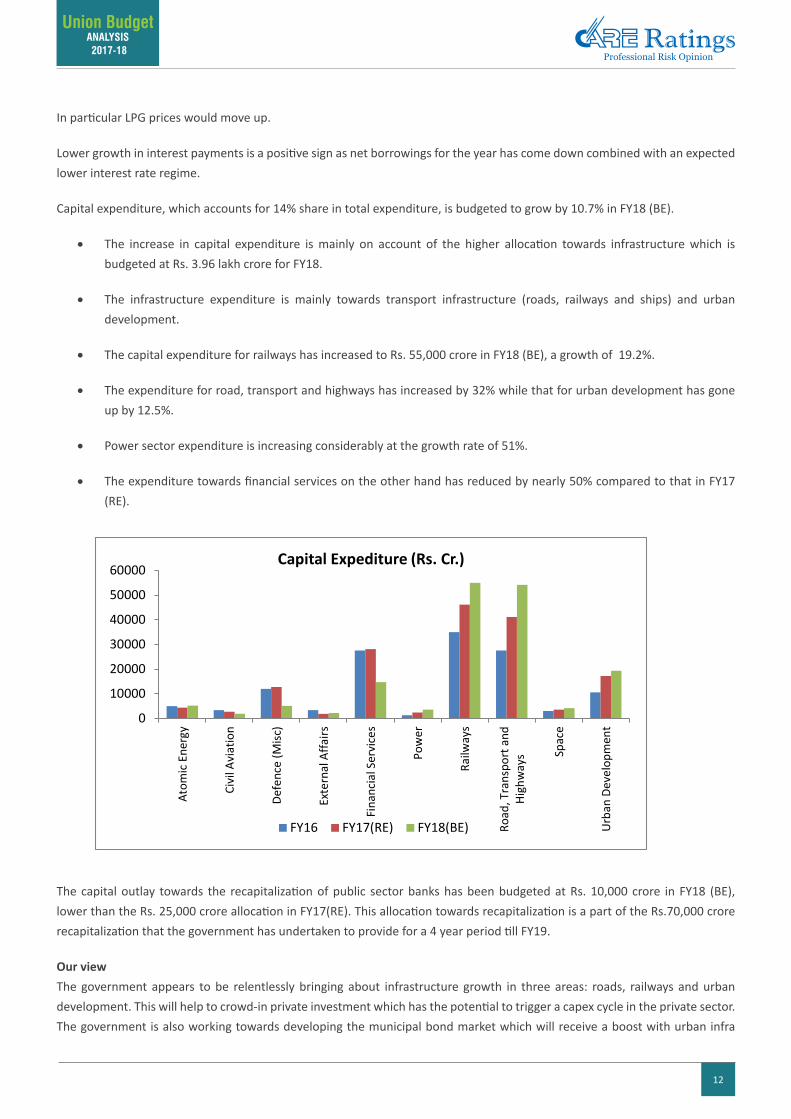
Capital expenditure, which accounts for 14% share in total expenditure, is budgeted to grow by 10.7% in FY18 (BE).
• The increase in capital expenditure is mainly on account of the higher allocation towards infrastructure which is budgeted at Rs. 3.96 lakh crore for FY18.
• The infrastructure expenditure is mainly towards transport infrastructure (roads, railways and ships) and urban development.
• The capital expenditure for railways has increased to Rs. 55,000 crore in FY18 (BE), a growth of 19.2%.
• The expenditure for road, transport and highways has increased by 32% while that for urban development has gone up by 12.5%.
• Power sector expenditure is increasing considerably at the growth rate of 51%.
• The expenditure towards financial services on the other hand has reduced by nearly 50% compared to that in FY17 (RE).
58,217
43,162 45,471 42,866
98,995
44,342
18,902
40,847 30,624
55,129
78,715
-
20,000
40,000
60,000
80,000
1,00,000
1,20,000
FY13 FY14 FY15 FY16 FY17 FY18
Receipts: Communications (Rs. Crs)
Budgetted Actual/Revised
30,000
55,814 56,925
69,500
56,500
72,500
25,890 29,367
37,737 42,132 45,500
-
20,000
40,000
60,000
80,000
FY13 FY14 FY15 FY16 FY17 FY18
Receipts : Disinvestment (Rs. Crs)
Budgetted Actual/Revised
0
10000
20000
30000
40000
50000
60000
Atom
ic E
nerg
y
Civi
l Avi
atio
n
Defe
nce
(Misc
)
Exte
rnal
Affa
irs
Fina
ncia
l Ser
vice
s
Pow
er
Railw
ays
Road
, Tra
nspo
rt a
ndHi
ghw
ays Sp
ace
Urb
an D
evel
opm
ent
Capital Expediture (Rs. Cr.)
FY16 FY17(RE) FY18(BE)
The capital outlay towards the recapitalization of public sector banks has been budgeted at Rs. 10,000 crore in FY18 (BE), lower than the Rs. 25,000 crore allocation in FY17(RE). This allocation towards recapitalization is a part of the Rs.70,000 crore recapitalization that the government has undertaken to provide for a 4 year period till FY19.
Our viewThe government appears to be relentlessly bringing about infrastructure growth in three areas: roads, railways and urban development. This will help to crowd-in private investment which has the potential to trigger a capex cycle in the private sector. The government is also working towards developing the municipal bond market which will receive a boost with urban infra
13
Union Budget ANALYSIS 2017-18
projects picking up. The AMRUT and Smart City projects would be the focus of attention.
Interest PaymentsRs Cr FY14 FY15 FY16 FY17(RE) FY18(BE)Interest Payment 3,74,254 4,02,444 4,41,659 4,83,069 5,23,078
The interest payments accounts for 25% of the total expenditure of the central government. The growth in interest payments has been declining consistently since FY16. After increasing at 9.7% in FY16 from 7.5% in FY15, the growth in interest payments decreased to 9.4% in FY17 (RE). In FY18 (BE) it is expected to fall further to 8.3%.
Subsidies
Rs Cr FY14 FY15 FY16 FY17(RE) FY18(BE)
Subsidies 2,54,632 2,58,258 2,64,106 2,60,485 2,72,276
Major Subsidies 2,44,717 2,49,016 2,41,833 2,32,705 2,40,339
Food Subsidy 92,000 1,17,671 1,39,419 1,35,173 1,45,339
Fertilizer Subsidy 67,339 71,076 72,415 70,000 70,000
Petroleum Subsidy 85,378 60,269 29,999 27,532 25,000
Interest Subsidy 8137 7632 16,730 19,425 23,204
Other Subsidy 1778 1610 5542 8356 8733
• The expenditure on subsidies is expected to increase in FY18.
• The expenditure on subsidies declined by (-)1.4% in FY17(RE) from 2.3% growth in FY16. However, in FY18 (BE) subsidies are expected to increase by 4.5%.
• This increase in subsidy could be ascribed to increased subsidies towards food and interest subsidy.
• The food subsidy that comprises nearly 52% of the total subsidies has decreased by (-)3% in FY17 (RE). In FY18 (BE) it is budgeted to grow substantially at 7.5%.
• The fertilizer subsidy has been kept constant in the Budget at Rs. 70,000 crore while the petroleum subsidy has decreased by Rs. 2,532 crore in FY18 (BE).
• The interest subsidy is expected to grow at 19.5% in FY18 (BE). This could be attributed to government’s initiative to ease loan burden of farmers through interest subvention and new interest rate subvention scheme introduced by Prime Minister for housing loan for poor in his December speech.
Defense expenditureRs Cr FY14 FY15 FY16 FY17(RE) FY18(BE)Defense Expenditure 2,03,499 2,18,694 2,25,895 2,48,005 2,62,390
The defense expenditure, which comprises 12% of the total expenditure, increased substantially by 9.8% in FY17 (RE) from 3.3% growth recorded in FY16. In FY18 (BE) the defense expenditure is expected to increase at 5.8% growth. The increase in expenditure can be attributed to increased allocation towards capital expenditure of defense services.
Gross Borrowing ProgrammeThe Gross Borrowing Programme for FY18 is expected to decline by 2.8% with the Government projected to borrow Rs.6.05 lakh
14
Union Budget ANALYSIS 2017-18
crore with net borrowing of Rs 3.48 lakh crore. The net borrowing for FY17 (RE) stands at 3.72 lakh crore which is lower than Rs.4.25 lakh crore which was budgeted.
Rs cr FY14 FY15 FY16 FY17 (RE) FY18 (BE)Gross Borrowing Programme 5,64,147 5,90,345 6,23,300 6,22,510 6,05,000Repayments 1,10,597 1,45,208 2,19,250 2,75,292 2,56,774Net Market Borrowing 4,53,550 4,45,137 4,04,050 3,47,218 3,48,226
Our viewGiven the comfortable state of liquidity it is unlikely to exert pressure on interest rates. Also the RBI will be able to take a call on interest rates based on the inflation target without being unduly concerned about the government borrowing programme. Assuming inflation to remain at a lower level in the next few months, we do expect interest rates to be cut by 25 bps by the RBI.
DebtRs Cr FY13 FY14 FY15 FY16 FY17(RE) FY18(BE)Public Debt 39,41,855 44,25,348 49,35,805 55,15,098 59,56,527 64,20,951 Internal Debt 37,64,566 42,40,767 47,38,291 53,04,835 57,31,392 61,80,027 External Debt 1,77,289 1,84,581 1,97,514 2,10,262 2,25,135 2,40,924Other Liabilities 11,28,747 12,44,833 13,06,716 13,86,874 14,84,347 15,42,055Total Debt 50,70,601 56,70,181 62,42,221 69,01,971 74,40,874 79,63,006Debt/GDP (%) 51.0% 50.3% 50.0% 50.8% 49.4% 47.3%
Public debt for FY18 is estimated to increase by 7.8% to Rs.64,20,951 crore lower than 8% growth in FY17 (RE). Of the total public debt, the internal debt accounts for more than 96% at Rs. 61,80,027 crore. The share of external debt has been moderating gradually from 4.2% in FY14 to 3.8% in FY17 (RE). In FY18, the outstanding external debt stock is estimated to grow by 7.0% to Rs.240,924 crore. The other liabilities are estimated to increase by 3.9% to Rs.1542055 crore in FY18 (BE).
Our viewThe debt to GDP ratio has been increasing gradually over the past few years, rising to a high 50.8% in FY16. It is targeted to decline to 47.3% in FY18 (BE) with an expectation of improving Gross domestic product. The medium term target is to reduce this number to 40% and it does appear that it will be achieved in the next 2-3 years.
15
Union Budget ANALYSIS 2017-18
Industry Synopsis
Currently, Air India, Jet Airways, Spice Jet, GoAir, Indigo, Air Costa, Air Asia, Vistara, Air Pegasus, Trujet and Air Carnival control the entire market share of domestic airlines in India.
As per DGCA, in CY16, Indigo had a market share of 39.3% in the domestic market (in terms of passengers carried) followed by Jet Airways which commanded 19.00% market share, while Air India and Spice Jet had a market share of 14.60% and 12.7%, respectively.
The total air passenger traffic including domestic and international passengers for FY16 showed a significant jump of 17.50% on a y-o-y basis and a further jump of 18.94% on a y-o-y basis for April 2016-November 2016 period.
Duty Structure
Service Tax (%) Before After ImpactUnder the Regional Connectivity Scheme (RCS), exemption from service tax is being provided in respect of the amount of viability gap funding (VGF) payable to the airline operator for providing the services of transport of passengers by air, embarking from or terminating in a Regional Connectivity Scheme (RCS) airport, for a period of one year from the date of commencement of operations of the Regional Connectivity Scheme (RCS) airport as notified by Ministry of Civil Aviation.
14% Nil +
Proposal and Impact
Budget proposals Impact on the Industry• Key schemes announced
1) Proposal to set up five Special Tourism Zones 2) Proposal to launch of Incredible India 2
The various measures announced are expected to have positive impact on the passenger traffic going ahead.
Impact on Companies
Company Impact Comments
Jet Airways + The various measures announced are expected to have positive impact on the passenger traffic going ahead thereby positively impacting the revenue of scheduled airline companies.
Spice Jet +Interglobe Aviation Ltd. +
Airlines
16
Union Budget ANALYSIS 2017-18
Industry SynopsisThe opening up of airport infrastructure to the private sector has fuelled growth in passenger handling and cargo handling
capacity in India. Total passenger handling capacity of airports increased from 72 mn in FY06 to about 272 mn in FY16, while total cargo handling capacity was at 6.2 mn tonnes per annum in FY16.
The total air passenger traffic including domestic and international passenger for FY16 showed a significant jump of 17.50% on a y-o-y basis and a jump of 18.94% on a y-o-y basis for April 2016-November 2016 period.
Proposal and Impact
Budget proposals Impact on the Industry• Key schemes announced
Proposal to take up selected airports in Tier 2 cities for operation and maintenance under PPP mode. Accordingly, to amend Airport Authority of India Act to enable effective monetisation of land assets.
This is expected to have positive impact on the airport infrastructure development in Tier II cities.
Impact on Companies
Company Impact Comments
GMR Infrastructure Ltd. +Provide opportunity for existing airport operators to expand their geographic presence.GVK Power &
Infrastructure Ltd. +
Airports
17
Union Budget ANALYSIS 2017-18
Industry Snapshot
The automobile component sales grew by 8.8 per cent on YoY in FY16 to Rs.2.56 lakh crore, largely on account of improvement in two/three-wheeler and passenger vehicle segments post subdued period across the segments over FY11-FY16. The revival is likely to continue albeit at slower pace in FY17 on account of increase in demand of commercial vehicles and a reasonable uptick in sales of passenger cars which are the key demand drivers for auto components from automobile manufacturers. Additionally, the increase in localisation levels in the vehicles manufactured in India is likely to reduce costs thereby auguring well for auto component manufacturers. The demand from the replacement market is expected to remain weak for the organized sector since the replacement market is dominated by the counterfeit auto parts from unorganised sector and cheap imports. With the likely adoption of new standards of emission norms, substantial investment shall be required by auto ancillaries segment to complement the Original Equipment Manufacturers (OEMs).
Duty Structure
Customs Duty (%) Before After Impact Excise Duty (%) Before After Impact
Engine & engine parts, except the below mentioned
7.5 7.5 = Engine & engine parts 12 12 =
Silencer, exhaust pipes &radiators
10 10 = Drive transmission, steering, suspension & braking parts
12 12 =Drive transmission, steering, suspension & braking parts, except the below mentioned:
10 10 = Spark plug, distributors, ignition coils & starter motors
12 12 =Couplings & seals, Spark plug, ignition coils & starter motors
7.5 7.5 =Spark plug, distributors, ignition coils & starter motors
7.5 7.5 =
Proposal and Impact
Budget proposals Impact on the Industry• Key schemes announced- Nil -
Impact on Companies
Company Impact Comments
Bharat Forge Ltd. =Since there were no major announcements pertaining to the in-dustry, the budget would have a marginally positive impact on component suppliers. Growth for the component industry would be driven by factors discussed for Automobile Original Equipment Manufacturers (OEMs)
Bosch Ltd. =Sona Koyo Steering Systems Ltd. =Exide Industries Ltd. =Motherson Sumi Ltd =
Auto Ancillaries
18
Union Budget ANALYSIS 2017-18
AutomobilesIndustry Snapshot
Indian auto industry is one of the largest in the world with an annual production of 23.96 million vehicles in FY16. Growth of the Indian auto industry was sluggish at 2.6 per cent YoY. This was mainly driven by growth in Commercial Vehicles segments, which grew by 12% YoY. Besides, India is also a prominent auto exporter and growth was also on account of increase in export to a certain extent. CY16 has been an eventful year for the auto industry. The early part of the year saw a revival trend in the automobile sales which was plagued due to massive demand fall in the rural market owing to uneven and delayed monsoon. The ban on diesel cars hurt the automobile industry. Second half of 2016 had started witnessing strong positive sentiment this was backed by factors such as improved consumer sentiments post the seventh pay commission, normal monsoon after two successive years of deficit rainfall, lower financing costs and fuel prices and healthy replacement demand due to diesel car ban. However, as soon as the industry was about to catch the pace, demonetization was announced by the government in November 2016. This led to a de-growth in the auto industry during December 2016. The overall growth in FY17 is likely to remain flat with the exception of few segments such as commercial vehicle which is likely to witness uptick on account of expected improvement in the overall macroeconomic conditions. Besides, the investment in order to develop vehicles with improved emission standards and competitive market is likely to pose a challenge for the players.
Duty Structure
Customs Duty (%) Before After Impact Excise Duty (%) Before After Impact
Passenger Cars Small Cars* 12.5 12.5 =Old 105 105 = Mid-size Cars@ 24 24 =New 100 100 = Large Cars# 27 27 =Two Wheeler SUV 30 30 =Old 105 105 = Buses 12.5 12.5 =New 60 (75^) 60 (75^) = Trucks 12.5 12.5 =Commercial Vehicles Two-wheeler 12.5 12.5 =Old 40 40 = Three-wheeler 12.5 12.5 =New 40 40 = Hybrid Vehicles 5 5 =
Note:*Indicates cars which have engine capacity less than 1,500cc in case of diesel and 1,200cc in case of petrol and length less than 4 meters.
@ Indicates cars which have engine capacity less than 1,500cc in case of diesel and 1,200cc in case of petrol and length more than 4 meters.
#indicates cars having engine capacity more than 1,500cc in case of diesel cars and 1,200cc in case of petrol and length exceeding 4 meters.
Definition of SUV as per central excise department is a vehicle with engine capacity greater than 1,500cc, length exceeding 4000mm and ground clearance 170 mm and above
^75% Custom duty is applicable for two-wheeler having engine capacity greater than 800cc
19
Union Budget ANALYSIS 2017-18
Proposal and Impact
Budget proposals Impact on the Industry•Key schemes announced
While there are no specific budget announcements pertaining to the automobile industry, Automobile & Auto ancillary sector demand may still pick up due to factors listed below:
1) Higher outlay for Infrastructure & Transportation Segment
Positive for Commercial Vehicle Demand.
2) Higher allocation for farm creditShall fuel the demand for farm equipment & Tractors segment;
3) Reduction in tax burden for individuals (on income of upto Rs.5 lakhs )
Likely to stir up demand for Two Wheelers and small car segment.
Impact on Companies
Company Impact CommentsMaruti Suzuki Ltd =
Various measures announced are expected to have marginally positive impact on the Automobile Original Equipment Manufacturers (OEMs).
Ashok Leyland Ltd =Hero Motocorp Ltd =Bajaj Auto Ltd. =Mahindra & Mahindra Ltd =
20
Union Budget ANALYSIS 2017-18
BFSIIndustry Snapshot
Banking - Overall slowdown in the domestic economy, asset quality stress on the banks’ loan book and capital constraints for PSU banks all contributed for low advances growth during FY16. Significant slippages from restructured assets and the Asset Quality Review mandated by RBI resulted in increased provisioning by banks which impacted their profitability. The regulatory guidelines formulated by RBI to assist banks in dealing with stressed assets would help in effective resolution of these assets. However, the improvement would be gradual. On the capital adequacy front, there is substantial requirement of capital especially for PSU banks given the significant deterioration in their asset quality. The government’s plan of infusing equity capital as per the Indradhanush scheme would help banks; however they may require further capital to strengthen their balance sheet. Going forward, the revival in the banking sector hinges on economic revival which would lead to improvement in asset quality and profitability.
Housing Finance - The housing finance segment in India has emerged as one of the most secured and resilient asset classes witnessing healthy growth rates and low delinquencies. As a result, housing finance has continued to be a focus segment for both banks as well as housing finance companies registering a robust CAGR growth of roughly 19% during 2011-2016. Although banks continue to dominate the housing finance space in India given their extensive reach and access to low cost funds which has resulted into a rise in balance transfers from HFCs to banks; HFCs continue to mark their presence with their focus, systems as well as specialization in their target segment and geographies. Over the last few years, many new HFCs backed by private equity players and strong promoters with a focus on affordable housing have started operations. Recent initiatives such as lowering of risk weights for housing loans upto Rs.75 lakh (risk weight for individual housing loans of upto Rs.30 lakh and having LTVs of upto 80% has been reduced from 50% to 35%), revision in interest rates and on-lending spread caps under Rural Housing Fund by NHB in addition to Housing for All by 2022 are expected to boost credit growth in the affordable housing segment. Furthermore, initiatives such as Real Estate Act, 2016, 100% tax exemption to developers on profits from building affordable housing and services tax exemption are expected to help transparency and supply side issues.
Rising competition and the resultant possible dilution in credit underwriting norms, long-term funding and asset quality are the key challenges for the sector.
NBFCs - Over the last few years, the NBFC sector has gained systemic importance with increase in share of NBFC total assets to bank total assets. The same has resulted in the Reserve Bank of India (RBI) taking various policy actions resulting in NBFCs attracting higher support and regulatory scrutiny. The RBI has revised the regulatory framework for NBFCs which broadly focuses on strengthening the structural profile of the NBFC sector, wherein focus is more on safeguarding depositors’ money and regulating NBFCs which have increased their asset-size over time and gained systemic importance. On the asset quality front, gradual change in the NPA recognition norms would lead to deterioration in asset quality parameters during the transition phase. Overall the revised regulations are positive for the NBFC sector making it structurally stronger, increase transparency and improve their ability to withstand asset quality shocks in the long run. Due to subdued economic environment, the last few years have been a challenging period for the NBFCs with moderation in growth and rising delinquencies resulting in higher provisioning thereby impacting profitability. However, comfortable capitalization levels and liquidity management continue to provide comfort to the credit profile of NBFCs in spite of impact on profitability.
21
Union Budget ANALYSIS 2017-18
Proposal and Impact
Budget proposals Impact on the IndustryKey schemes announced
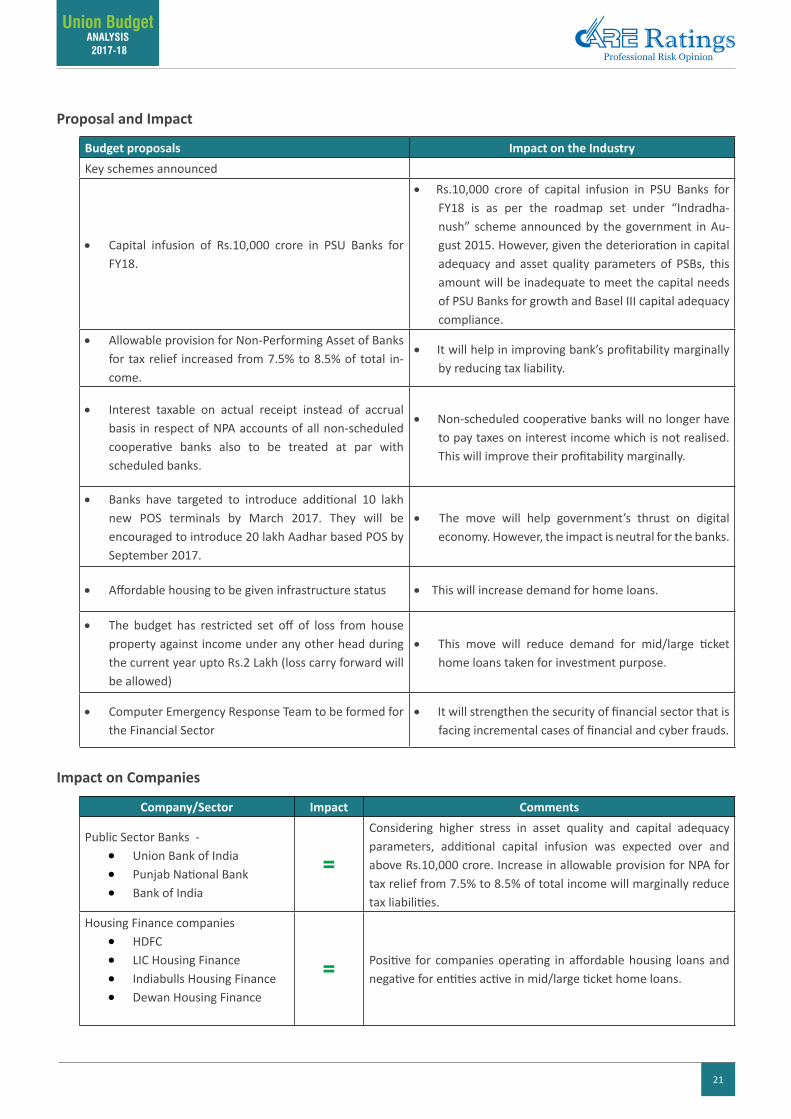
• Capital infusion of Rs.10,000 crore in PSU Banks for FY18.
• Rs.10,000 crore of capital infusion in PSU Banks for FY18 is as per the roadmap set under “Indradha-nush” scheme announced by the government in Au-gust 2015. However, given the deterioration in capital adequacy and asset quality parameters of PSBs, this amount will be inadequate to meet the capital needs of PSU Banks for growth and Basel III capital adequacy compliance.
• Allowable provision for Non-Performing Asset of Banks for tax relief increased from 7.5% to 8.5% of total in-come.
• It will help in improving bank’s profitability marginally by reducing tax liability.
• Interest taxable on actual receipt instead of accrual basis in respect of NPA accounts of all non-scheduled cooperative banks also to be treated at par with scheduled banks.
• Non-scheduled cooperative banks will no longer have to pay taxes on interest income which is not realised. This will improve their profitability marginally.
• Banks have targeted to introduce additional 10 lakh new POS terminals by March 2017. They will be encouraged to introduce 20 lakh Aadhar based POS by September 2017.
• The move will help government’s thrust on digital economy. However, the impact is neutral for the banks.
• Affordable housing to be given infrastructure status • This will increase demand for home loans.
• The budget has restricted set off of loss from house property against income under any other head during the current year upto Rs.2 Lakh (loss carry forward will be allowed)
• This move will reduce demand for mid/large ticket home loans taken for investment purpose.
• Computer Emergency Response Team to be formed for the Financial Sector
• It will strengthen the security of financial sector that is facing incremental cases of financial and cyber frauds.
Impact on Companies
Company/Sector Impact Comments
Public Sector Banks - • Union Bank of India• Punjab National Bank • Bank of India
=
Considering higher stress in asset quality and capital adequacy parameters, additional capital infusion was expected over and above Rs.10,000 crore. Increase in allowable provision for NPA for tax relief from 7.5% to 8.5% of total income will marginally reduce tax liabilities.
Housing Finance companies • HDFC• LIC Housing Finance • Indiabulls Housing Finance • Dewan Housing Finance
= Positive for companies operating in affordable housing loans and negative for entities active in mid/large ticket home loans.
22
Union Budget ANALYSIS 2017-18
CementIndustry Snapshot
India is the second-largest cement producer in the world after China. Cement production increased at a CAGR of 5.5% from 210 million tonnes in FY11 to 274 million tonnes in FY16. Housing and real estate sector is considered to be the largest driver of cement demand in India, which held approximately two-third total cement consumption, followed by the infrastructure sector. Cement production grew by 4.7% in FY16 as compared with 5.6% in FY15. The growth was impacted by slower-than-envisaged economic and infrastructural activity, weakness in rural demand due to subdued monsoon and slowdown in real estate activity in large cities. Though, during the period April-October 2016, the demand improved on account of relatively better and widespread monsoon this year (cement production increased by 4.8% for the period April-October 2016 as against 2.9% for the same period last year), ban on high currency denomination notes in November 2016 has impacted the demand growth of the industry negatively.
Going forward, focus of the Government on strengthening infrastructure including road sector, development of smart cities and promotion of low-cost housing and expected revival in the overall economic growth is expected to result in improved growth prospects for the cement sector. However, increase in diesel, coal and pet coke prices may pose a challenge on cost front.
As cement is one of the highly taxed commodities, post implementation of GST indirect tax rates for the cement sector are expected to come down which would benefit the sector positively.
Proposal and Impact
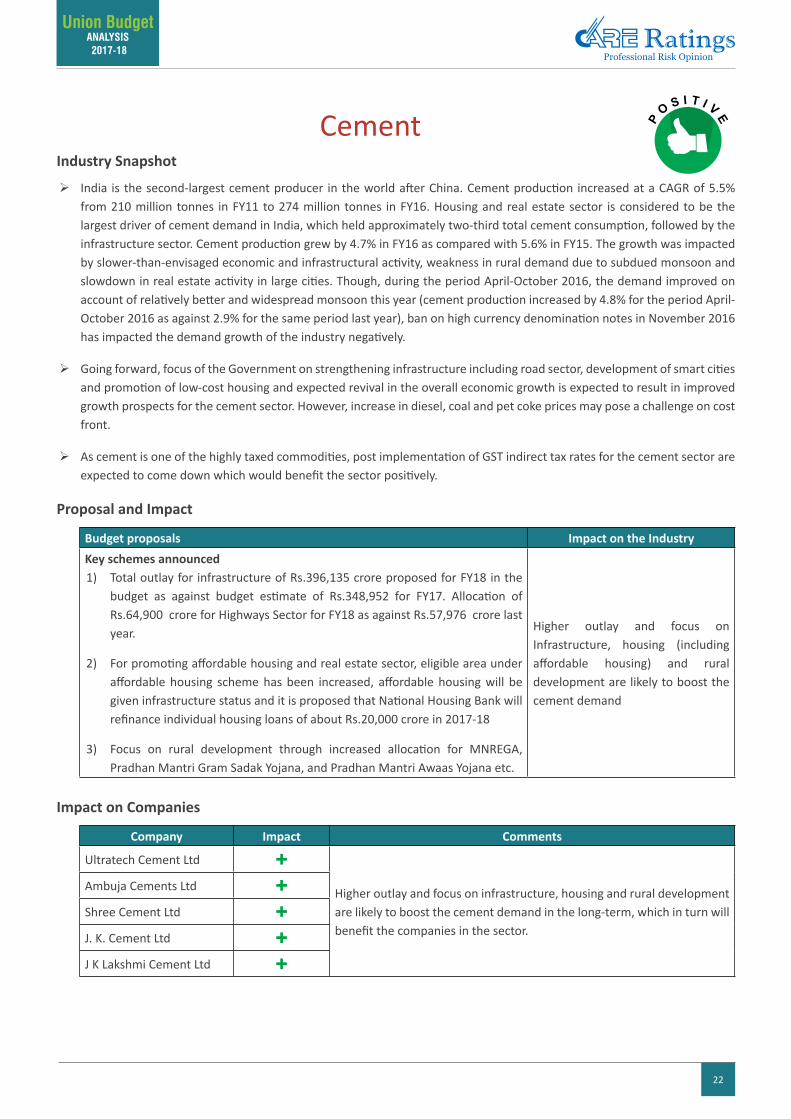
Budget proposals Impact on the IndustryKey schemes announced1) Total outlay for infrastructure of Rs.396,135 crore proposed for FY18 in the
budget as against budget estimate of Rs.348,952 for FY17. Allocation of Rs.64,900 crore for Highways Sector for FY18 as against Rs.57,976 crore last year.
2) For promoting affordable housing and real estate sector, eligible area under affordable housing scheme has been increased, affordable housing will be given infrastructure status and it is proposed that National Housing Bank will refinance individual housing loans of about Rs.20,000 crore in 2017-18
3) Focus on rural development through increased allocation for MNREGA, Pradhan Mantri Gram Sadak Yojana, and Pradhan Mantri Awaas Yojana etc.
Higher outlay and focus on Infrastructure, housing (including affordable housing) and rural development are likely to boost the cement demand
Impact on Companies
Company Impact Comments
Ultratech Cement Ltd +Higher outlay and focus on infrastructure, housing and rural development are likely to boost the cement demand in the long-term, which in turn will benefit the companies in the sector.
Ambuja Cements Ltd +Shree Cement Ltd +J. K. Cement Ltd +J K Lakshmi Cement Ltd +
23
Union Budget ANALYSIS 2017-18
ConstructionIndustry Snapshot
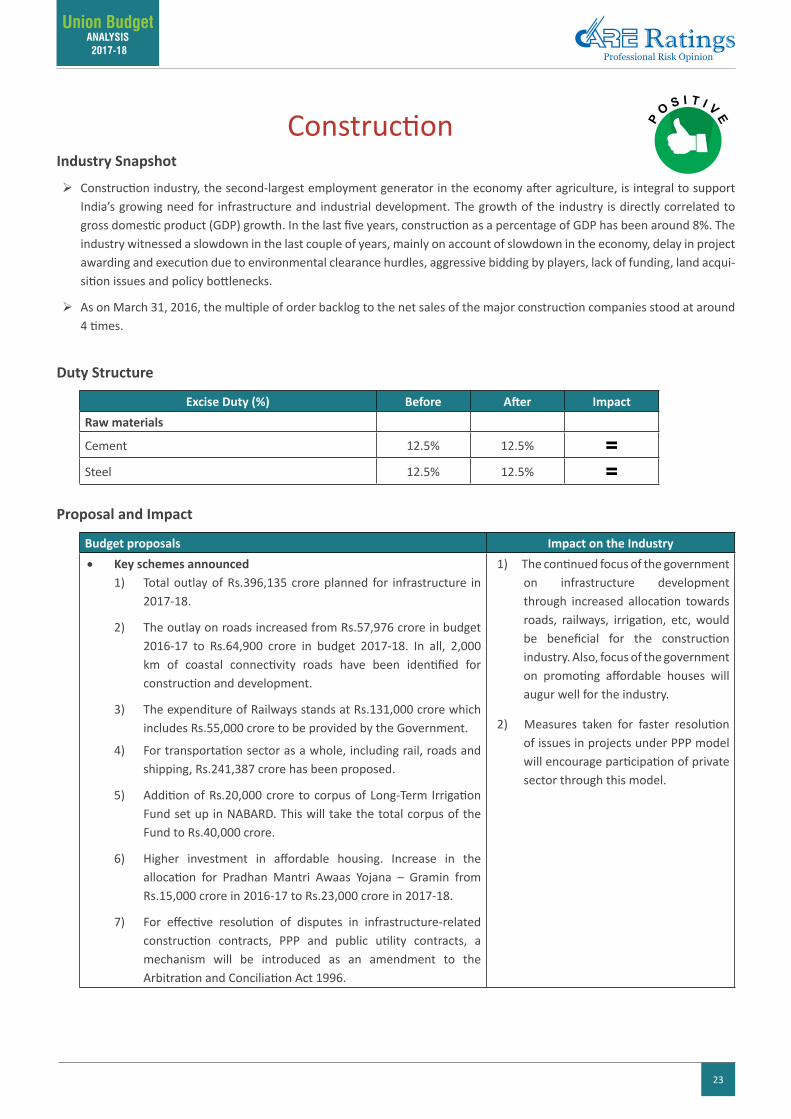
Construction industry, the second-largest employment generator in the economy after agriculture, is integral to support India’s growing need for infrastructure and industrial development. The growth of the industry is directly correlated to gross domestic product (GDP) growth. In the last five years, construction as a percentage of GDP has been around 8%. The industry witnessed a slowdown in the last couple of years, mainly on account of slowdown in the economy, delay in project awarding and execution due to environmental clearance hurdles, aggressive bidding by players, lack of funding, land acqui-sition issues and policy bottlenecks.
As on March 31, 2016, the multiple of order backlog to the net sales of the major construction companies stood at around 4 times.
Duty Structure
Excise Duty (%) Before After ImpactRaw materials
Cement 12.5% 12.5% =Steel 12.5% 12.5% =
Proposal and Impact
Budget proposals Impact on the Industry• Key schemes announced
1) Total outlay of Rs.396,135 crore planned for infrastructure in 2017-18.
2) The outlay on roads increased from Rs.57,976 crore in budget 2016-17 to Rs.64,900 crore in budget 2017-18. In all, 2,000 km of coastal connectivity roads have been identified for construction and development.
3) The expenditure of Railways stands at Rs.131,000 crore which includes Rs.55,000 crore to be provided by the Government.
4) For transportation sector as a whole, including rail, roads and shipping, Rs.241,387 crore has been proposed.
5) Addition of Rs.20,000 crore to corpus of Long-Term Irrigation Fund set up in NABARD. This will take the total corpus of the Fund to Rs.40,000 crore.
6) Higher investment in affordable housing. Increase in the allocation for Pradhan Mantri Awaas Yojana – Gramin from Rs.15,000 crore in 2016-17 to Rs.23,000 crore in 2017-18.
7) For effective resolution of disputes in infrastructure-related construction contracts, PPP and public utility contracts, a mechanism will be introduced as an amendment to the Arbitration and Conciliation Act 1996.
1) The continued focus of the government on infrastructure development through increased allocation towards roads, railways, irrigation, etc, would be beneficial for the construction industry. Also, focus of the government on promoting affordable houses will augur well for the industry.
2) Measures taken for faster resolution of issues in projects under PPP model will encourage participation of private sector through this model.
24
Union Budget ANALYSIS 2017-18
Impact on Companies
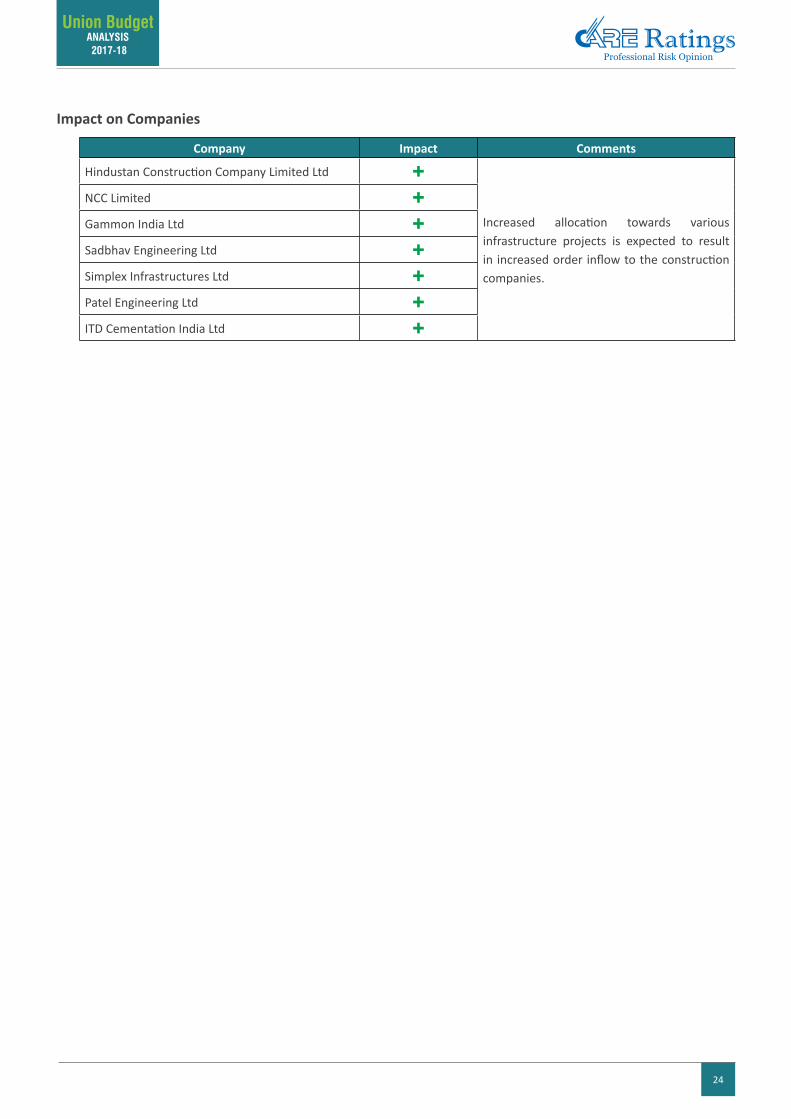
Company Impact Comments
Hindustan Construction Company Limited Ltd +
Increased allocation towards various infrastructure projects is expected to result in increased order inflow to the construction companies.
NCC Limited +Gammon India Ltd +Sadbhav Engineering Ltd +Simplex Infrastructures Ltd +Patel Engineering Ltd +ITD Cementation India Ltd +
25
Union Budget ANALYSIS 2017-18
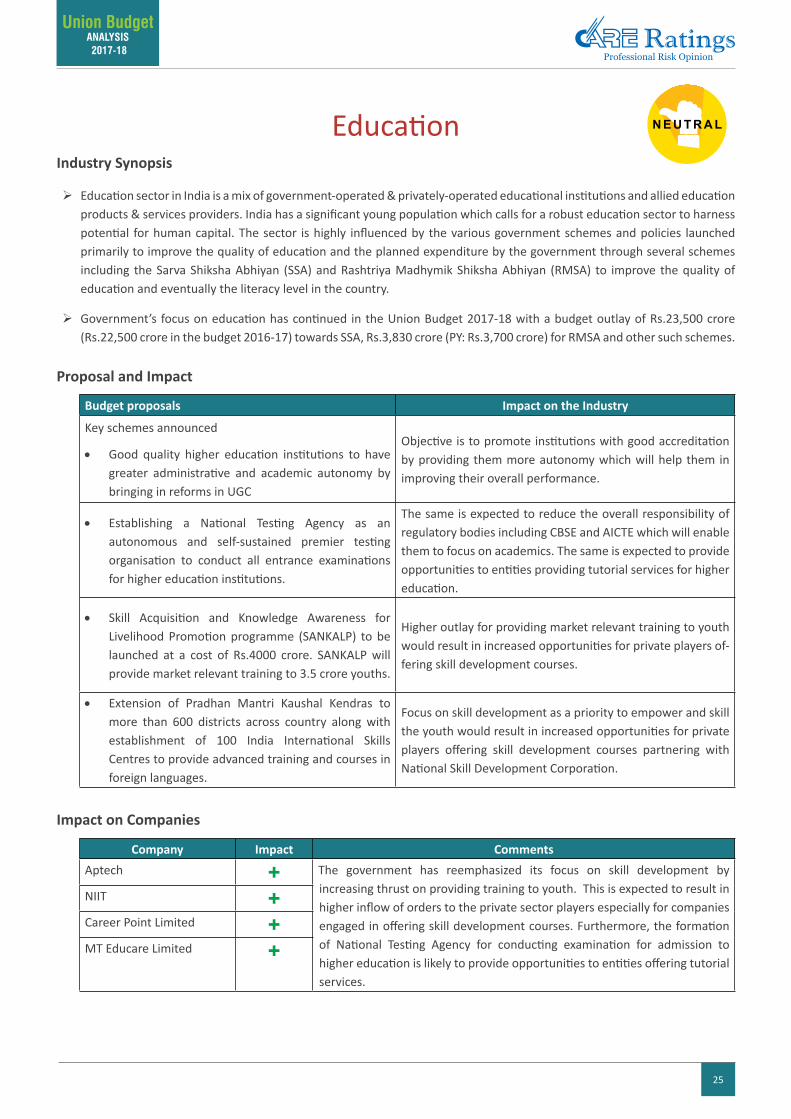
EducationIndustry Synopsis
Education sector in India is a mix of government-operated & privately-operated educational institutions and allied education products & services providers. India has a significant young population which calls for a robust education sector to harness potential for human capital. The sector is highly influenced by the various government schemes and policies launched primarily to improve the quality of education and the planned expenditure by the government through several schemes including the Sarva Shiksha Abhiyan (SSA) and Rashtriya Madhymik Shiksha Abhiyan (RMSA) to improve the quality of education and eventually the literacy level in the country.
Government’s focus on education has continued in the Union Budget 2017-18 with a budget outlay of Rs.23,500 crore (Rs.22,500 crore in the budget 2016-17) towards SSA, Rs.3,830 crore (PY: Rs.3,700 crore) for RMSA and other such schemes.
Proposal and Impact
Budget proposals Impact on the Industry
Key schemes announced
• Good quality higher education institutions to have greater administrative and academic autonomy by bringing in reforms in UGC
Objective is to promote institutions with good accreditation by providing them more autonomy which will help them in improving their overall performance.
• Establishing a National Testing Agency as an autonomous and self-sustained premier testing organisation to conduct all entrance examinations for higher education institutions.
The same is expected to reduce the overall responsibility of regulatory bodies including CBSE and AICTE which will enable them to focus on academics. The same is expected to provide opportunities to entities providing tutorial services for higher education.
• Skill Acquisition and Knowledge Awareness for Livelihood Promotion programme (SANKALP) to be launched at a cost of Rs.4000 crore. SANKALP will provide market relevant training to 3.5 crore youths.
Higher outlay for providing market relevant training to youth would result in increased opportunities for private players of-fering skill development courses.
• Extension of Pradhan Mantri Kaushal Kendras to more than 600 districts across country along with establishment of 100 India International Skills Centres to provide advanced training and courses in foreign languages.
Focus on skill development as a priority to empower and skill the youth would result in increased opportunities for private players offering skill development courses partnering with National Skill Development Corporation.
Impact on Companies
Company Impact CommentsAptech + The government has reemphasized its focus on skill development by
increasing thrust on providing training to youth. This is expected to result in higher inflow of orders to the private sector players especially for companies engaged in offering skill development courses. Furthermore, the formation of National Testing Agency for conducting examination for admission to higher education is likely to provide opportunities to entities offering tutorial services.
NIIT +Career Point Limited +MT Educare Limited +
26
Union Budget ANALYSIS 2017-18
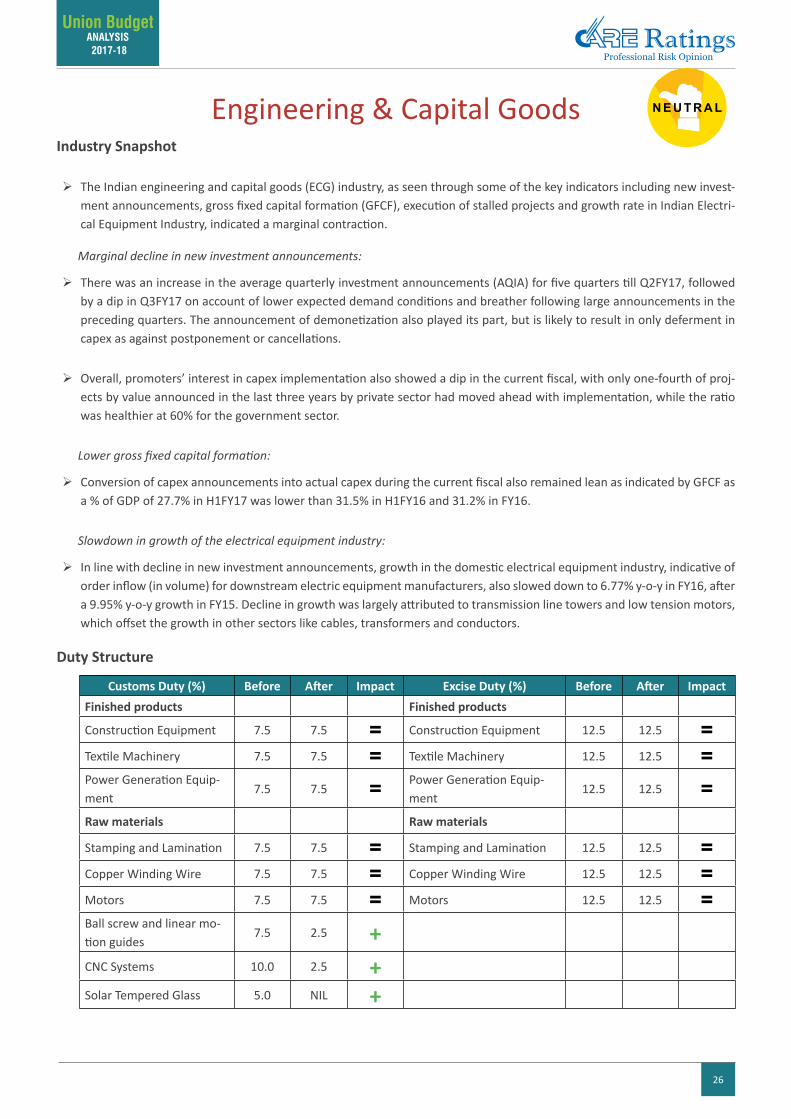
Engineering & Capital Goods Industry Snapshot
The Indian engineering and capital goods (ECG) industry, as seen through some of the key indicators including new invest-ment announcements, gross fixed capital formation (GFCF), execution of stalled projects and growth rate in Indian Electri-cal Equipment Industry, indicated a marginal contraction.
Marginal decline in new investment announcements:
There was an increase in the average quarterly investment announcements (AQIA) for five quarters till Q2FY17, followed by a dip in Q3FY17 on account of lower expected demand conditions and breather following large announcements in the preceding quarters. The announcement of demonetization also played its part, but is likely to result in only deferment in capex as against postponement or cancellations.
Overall, promoters’ interest in capex implementation also showed a dip in the current fiscal, with only one-fourth of proj-ects by value announced in the last three years by private sector had moved ahead with implementation, while the ratio was healthier at 60% for the government sector.
Lower gross fixed capital formation:
Conversion of capex announcements into actual capex during the current fiscal also remained lean as indicated by GFCF as a % of GDP of 27.7% in H1FY17 was lower than 31.5% in H1FY16 and 31.2% in FY16.
Slowdown in growth of the electrical equipment industry:
In line with decline in new investment announcements, growth in the domestic electrical equipment industry, indicative of order inflow (in volume) for downstream electric equipment manufacturers, also slowed down to 6.77% y-o-y in FY16, after a 9.95% y-o-y growth in FY15. Decline in growth was largely attributed to transmission line towers and low tension motors, which offset the growth in other sectors like cables, transformers and conductors.
Duty Structure
Customs Duty (%) Before After Impact Excise Duty (%) Before After ImpactFinished products Finished products
Construction Equipment 7.5 7.5 = Construction Equipment 12.5 12.5 =Textile Machinery 7.5 7.5 = Textile Machinery 12.5 12.5 =Power Generation Equip-ment
7.5 7.5 = Power Generation Equip-ment
12.5 12.5 =Raw materials Raw materials
Stamping and Lamination 7.5 7.5 = Stamping and Lamination 12.5 12.5 =Copper Winding Wire 7.5 7.5 = Copper Winding Wire 12.5 12.5 =Motors 7.5 7.5 = Motors 12.5 12.5 =Ball screw and linear mo-tion guides
7.5 2.5 +CNC Systems 10.0 2.5 +Solar Tempered Glass 5.0 NIL +
27
Union Budget ANALYSIS 2017-18
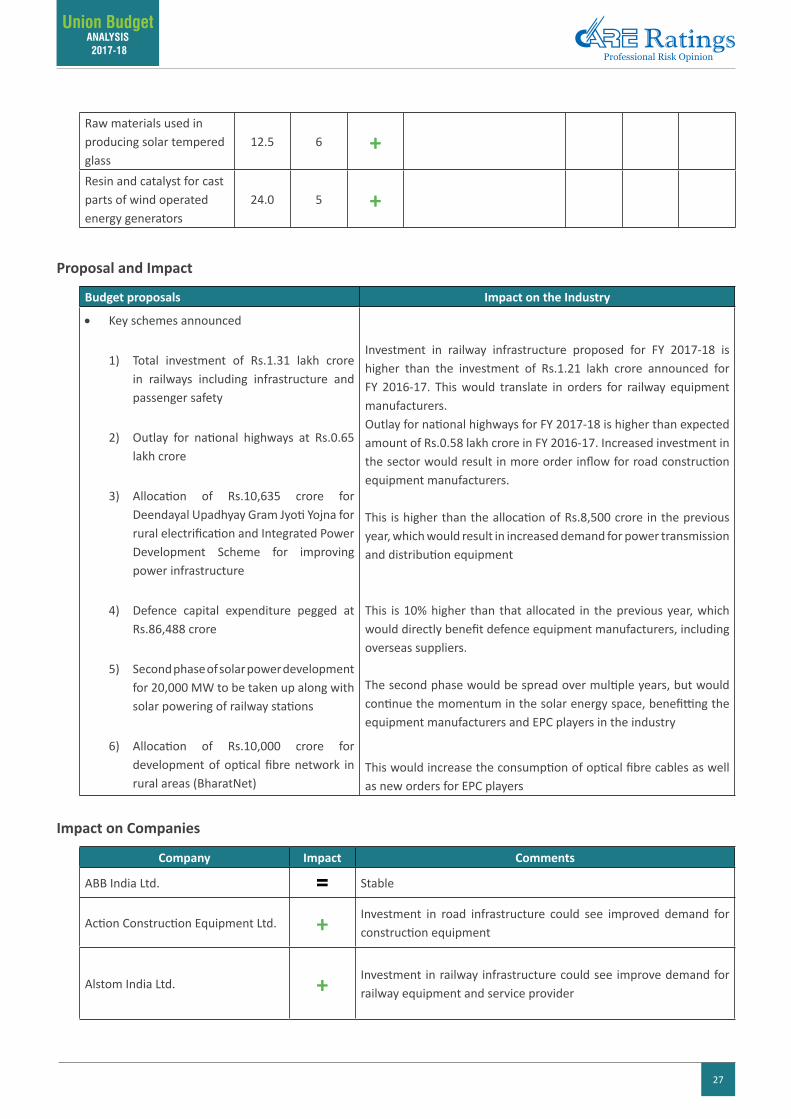
Raw materials used in producing solar tempered glass
12.5 6 +Resin and catalyst for cast parts of wind operated energy generators
24.0 5 +
Proposal and Impact
Budget proposals Impact on the Industry
• Key schemes announced
1) Total investment of Rs.1.31 lakh crore in railways including infrastructure and passenger safety
2) Outlay for national highways at Rs.0.65 lakh crore
3) Allocation of Rs.10,635 crore for Deendayal Upadhyay Gram Jyoti Yojna for rural electrification and Integrated Power Development Scheme for improving power infrastructure
4) Defence capital expenditure pegged at Rs.86,488 crore
5) Second phase of solar power development for 20,000 MW to be taken up along with solar powering of railway stations
6) Allocation of Rs.10,000 crore for development of optical fibre network in rural areas (BharatNet)
Investment in railway infrastructure proposed for FY 2017-18 is higher than the investment of Rs.1.21 lakh crore announced for FY 2016-17. This would translate in orders for railway equipment manufacturers.Outlay for national highways for FY 2017-18 is higher than expected amount of Rs.0.58 lakh crore in FY 2016-17. Increased investment in the sector would result in more order inflow for road construction equipment manufacturers.
This is higher than the allocation of Rs.8,500 crore in the previous year, which would result in increased demand for power transmission and distribution equipment
This is 10% higher than that allocated in the previous year, which would directly benefit defence equipment manufacturers, including overseas suppliers.
The second phase would be spread over multiple years, but would continue the momentum in the solar energy space, benefitting the equipment manufacturers and EPC players in the industry
This would increase the consumption of optical fibre cables as well as new orders for EPC players
Impact on Companies
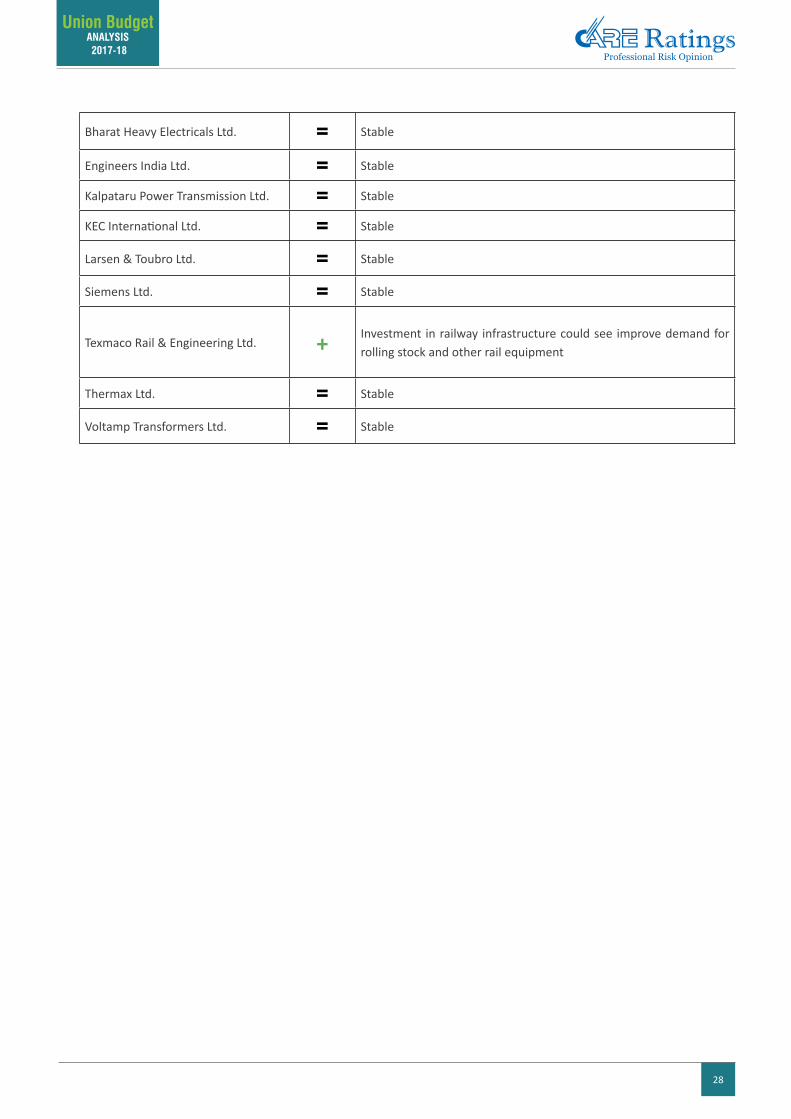
Company Impact Comments
ABB India Ltd. = Stable
Action Construction Equipment Ltd. + Investment in road infrastructure could see improved demand for construction equipment
Alstom India Ltd. + Investment in railway infrastructure could see improve demand for railway equipment and service provider
28
Union Budget ANALYSIS 2017-18
Bharat Heavy Electricals Ltd. = Stable
Engineers India Ltd. = Stable
Kalpataru Power Transmission Ltd. = Stable
KEC International Ltd. = Stable
Larsen & Toubro Ltd. = Stable
Siemens Ltd. = Stable
Texmaco Rail & Engineering Ltd. + Investment in railway infrastructure could see improve demand for rolling stock and other rail equipment
Thermax Ltd. = Stable
Voltamp Transformers Ltd. = Stable
29
Union Budget ANALYSIS 2017-18
FertilizersIndustry Snapshot
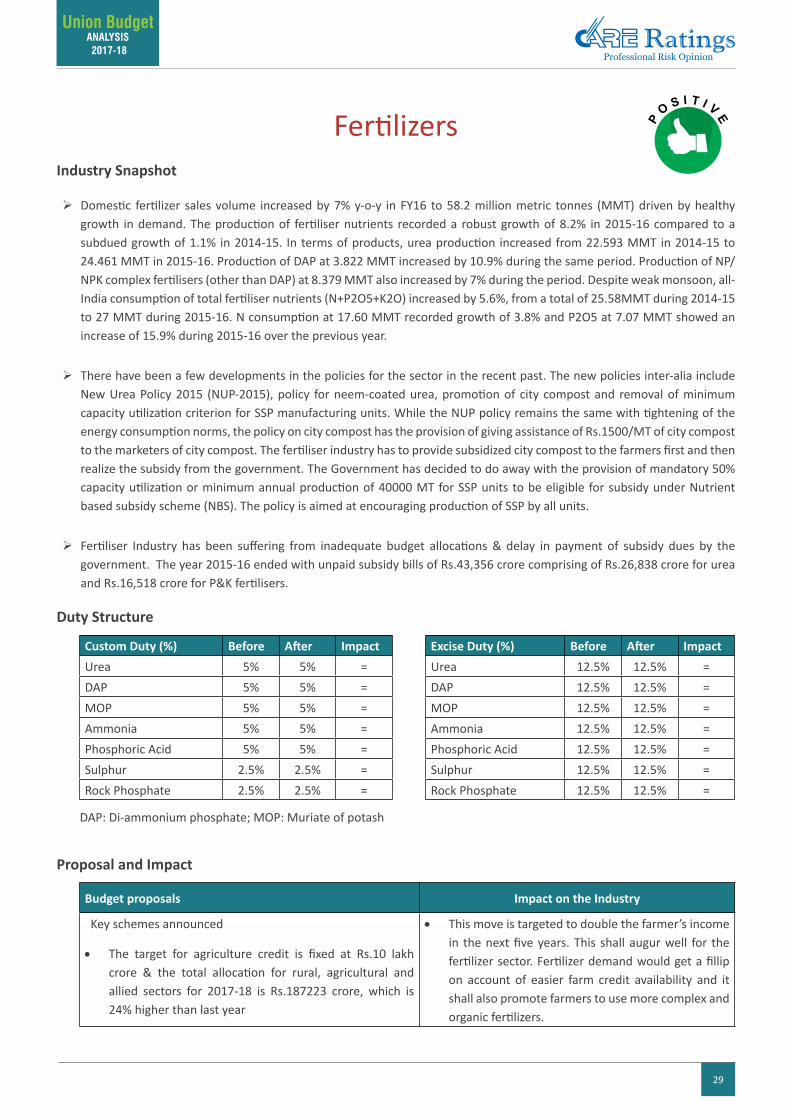
Domestic fertilizer sales volume increased by 7% y-o-y in FY16 to 58.2 million metric tonnes (MMT) driven by healthy growth in demand. The production of fertiliser nutrients recorded a robust growth of 8.2% in 2015-16 compared to a subdued growth of 1.1% in 2014-15. In terms of products, urea production increased from 22.593 MMT in 2014-15 to 24.461 MMT in 2015-16. Production of DAP at 3.822 MMT increased by 10.9% during the same period. Production of NP/NPK complex fertilisers (other than DAP) at 8.379 MMT also increased by 7% during the period. Despite weak monsoon, all- India consumption of total fertiliser nutrients (N+P2O5+K2O) increased by 5.6%, from a total of 25.58MMT during 2014-15 to 27 MMT during 2015-16. N consumption at 17.60 MMT recorded growth of 3.8% and P2O5 at 7.07 MMT showed an increase of 15.9% during 2015-16 over the previous year.
There have been a few developments in the policies for the sector in the recent past. The new policies inter-alia include New Urea Policy 2015 (NUP-2015), policy for neem-coated urea, promotion of city compost and removal of minimum capacity utilization criterion for SSP manufacturing units. While the NUP policy remains the same with tightening of the energy consumption norms, the policy on city compost has the provision of giving assistance of Rs.1500/MT of city compost to the marketers of city compost. The fertiliser industry has to provide subsidized city compost to the farmers first and then realize the subsidy from the government. The Government has decided to do away with the provision of mandatory 50% capacity utilization or minimum annual production of 40000 MT for SSP units to be eligible for subsidy under Nutrient based subsidy scheme (NBS). The policy is aimed at encouraging production of SSP by all units.
Fertiliser Industry has been suffering from inadequate budget allocations & delay in payment of subsidy dues by the government. The year 2015-16 ended with unpaid subsidy bills of Rs.43,356 crore comprising of Rs.26,838 crore for urea and Rs.16,518 crore for P&K fertilisers.
Duty Structure
Custom Duty (%) Before After Impact Excise Duty (%) Before After ImpactUrea 5% 5% = Urea 12.5% 12.5% =DAP 5% 5% = DAP 12.5% 12.5% =MOP 5% 5% = MOP 12.5% 12.5% =Ammonia 5% 5% = Ammonia 12.5% 12.5% =Phosphoric Acid 5% 5% = Phosphoric Acid 12.5% 12.5% =Sulphur 2.5% 2.5% = Sulphur 12.5% 12.5% =Rock Phosphate 2.5% 2.5% = Rock Phosphate 12.5% 12.5% =
DAP: Di-ammonium phosphate; MOP: Muriate of potash
Proposal and Impact
Budget proposals Impact on the Industry
Key schemes announced
• The target for agriculture credit is fixed at Rs.10 lakh crore & the total allocation for rural, agricultural and allied sectors for 2017-18 is Rs.187223 crore, which is 24% higher than last year
• This move is targeted to double the farmer’s income in the next five years. This shall augur well for the fertilizer sector. Fertilizer demand would get a fillip on account of easier farm credit availability and it shall also promote farmers to use more complex and organic fertilizers.
30
Union Budget ANALYSIS 2017-18
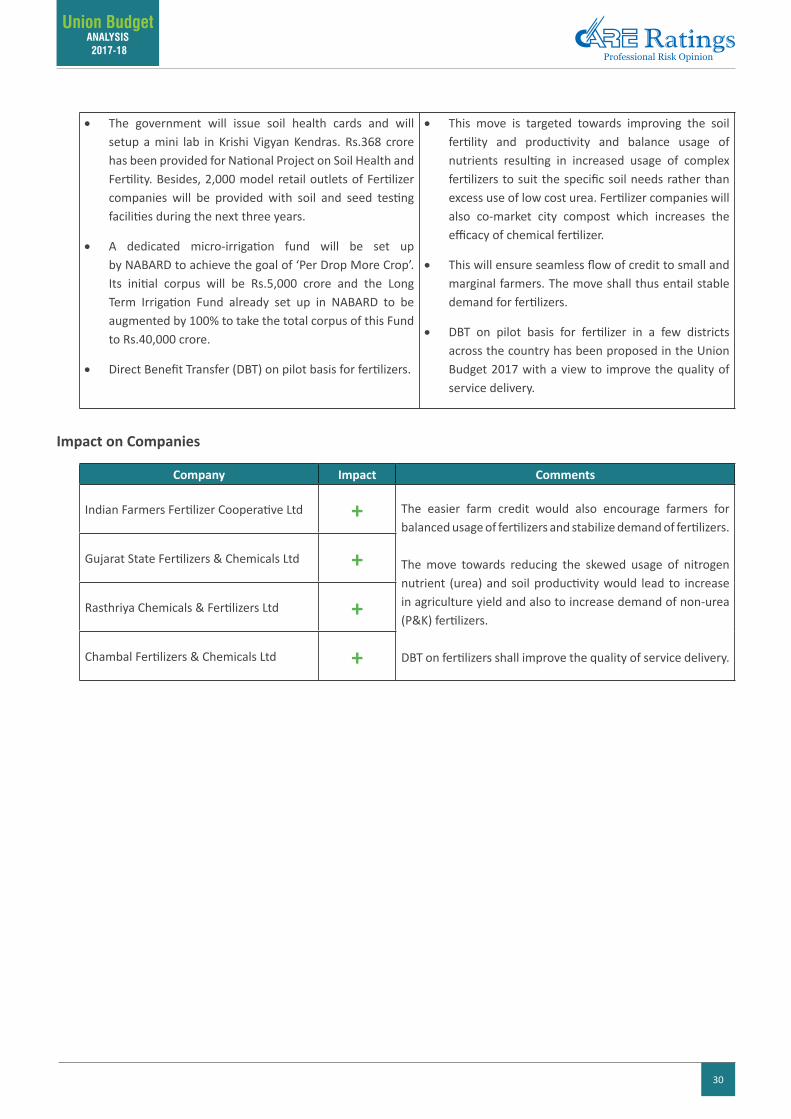
• The government will issue soil health cards and will setup a mini lab in Krishi Vigyan Kendras. Rs.368 crore has been provided for National Project on Soil Health and Fertility. Besides, 2,000 model retail outlets of Fertilizer companies will be provided with soil and seed testing facilities during the next three years.
• A dedicated micro-irrigation fund will be set up by NABARD to achieve the goal of ‘Per Drop More Crop’. Its initial corpus will be Rs.5,000 crore and the Long Term Irrigation Fund already set up in NABARD to be augmented by 100% to take the total corpus of this Fund to Rs.40,000 crore.
• Direct Benefit Transfer (DBT) on pilot basis for fertilizers.
• This move is targeted towards improving the soil fertility and productivity and balance usage of nutrients resulting in increased usage of complex fertilizers to suit the specific soil needs rather than excess use of low cost urea. Fertilizer companies will also co-market city compost which increases the efficacy of chemical fertilizer.
• This will ensure seamless flow of credit to small and marginal farmers. The move shall thus entail stable demand for fertilizers.
• DBT on pilot basis for fertilizer in a few districts across the country has been proposed in the Union Budget 2017 with a view to improve the quality of service delivery.
Impact on Companies
Company Impact Comments
Indian Farmers Fertilizer Cooperative Ltd + The easier farm credit would also encourage farmers for balanced usage of fertilizers and stabilize demand of fertilizers.
The move towards reducing the skewed usage of nitrogen nutrient (urea) and soil productivity would lead to increase in agriculture yield and also to increase demand of non-urea (P&K) fertilizers.
DBT on fertilizers shall improve the quality of service delivery.
Gujarat State Fertilizers & Chemicals Ltd +
Rasthriya Chemicals & Fertilizers Ltd +
Chambal Fertilizers & Chemicals Ltd +
31
Union Budget ANALYSIS 2017-18
FMCGIndustry Snapshot
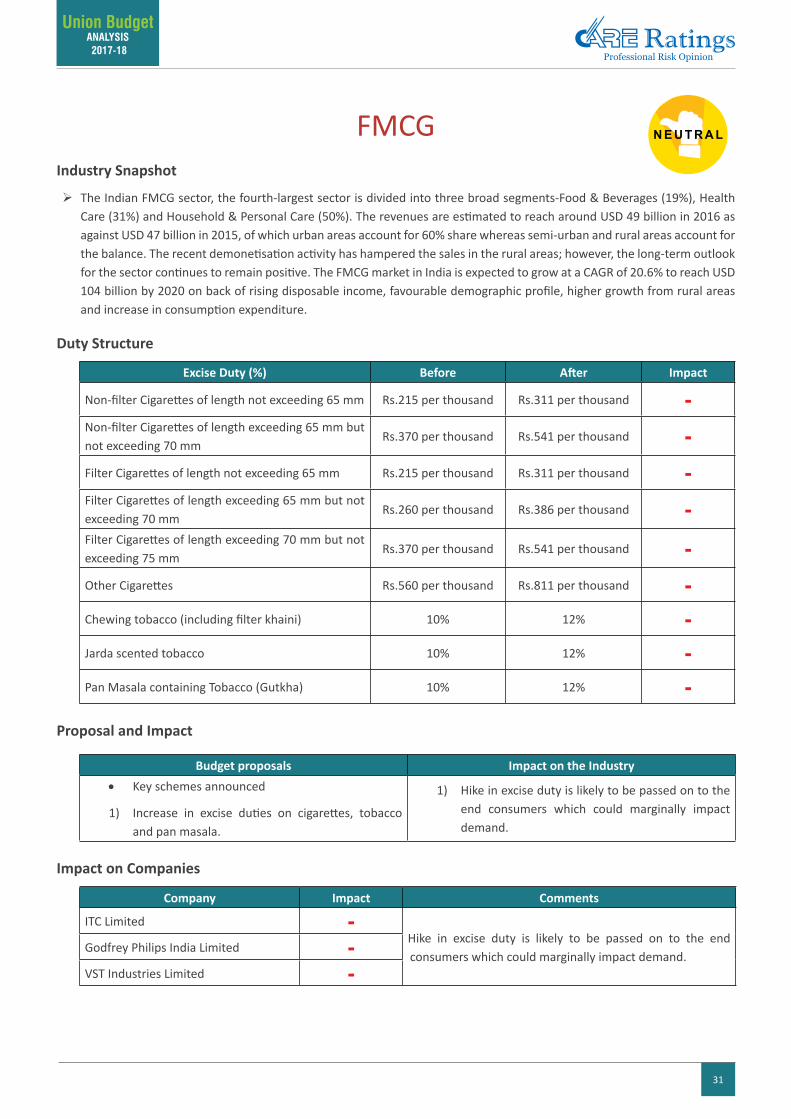
The Indian FMCG sector, the fourth-largest sector is divided into three broad segments-Food & Beverages (19%), Health Care (31%) and Household & Personal Care (50%). The revenues are estimated to reach around USD 49 billion in 2016 as against USD 47 billion in 2015, of which urban areas account for 60% share whereas semi-urban and rural areas account for the balance. The recent demonetisation activity has hampered the sales in the rural areas; however, the long-term outlook for the sector continues to remain positive. The FMCG market in India is expected to grow at a CAGR of 20.6% to reach USD 104 billion by 2020 on back of rising disposable income, favourable demographic profile, higher growth from rural areas and increase in consumption expenditure.
Duty Structure
Excise Duty (%) Before After Impact
Non-filter Cigarettes of length not exceeding 65 mm Rs.215 per thousand Rs.311 per thousand -Non-filter Cigarettes of length exceeding 65 mm but not exceeding 70 mm
Rs.370 per thousand Rs.541 per thousand -Filter Cigarettes of length not exceeding 65 mm Rs.215 per thousand Rs.311 per thousand -Filter Cigarettes of length exceeding 65 mm but not exceeding 70 mm
Rs.260 per thousand Rs.386 per thousand -Filter Cigarettes of length exceeding 70 mm but not exceeding 75 mm
Rs.370 per thousand Rs.541 per thousand -Other Cigarettes Rs.560 per thousand Rs.811 per thousand -Chewing tobacco (including filter khaini) 10% 12% -Jarda scented tobacco 10% 12% -Pan Masala containing Tobacco (Gutkha) 10% 12% -
Proposal and Impact
Budget proposals Impact on the Industry• Key schemes announced
1) Increase in excise duties on cigarettes, tobacco and pan masala.
1) Hike in excise duty is likely to be passed on to the end consumers which could marginally impact demand.
Impact on Companies
Company Impact Comments
ITC Limited -Hike in excise duty is likely to be passed on to the end consumers which could marginally impact demand.
Godfrey Philips India Limited -VST Industries Limited -
32
Union Budget ANALYSIS 2017-18
Non-Ferrous MetalsIndustry Snapshot
International prices of all the metals have strengthened in FY17. The prices of aluminium and copper have increased by about 23% & 28% ending December 2016 (y-o-y) while zinc prices have increased at a steeper rate by around 81% during the same period. The increase in the prices was on account of demand supply mismatch in the global market. With move-ment of base metals on the upper side, Indian base metal manufacturers have been the beneficiary in the process, which is evident with improvement in the profitability.
With majority of the non-ferrous metals being met by imports, India is ramping up its production capacity to meet the domestic demand and curb the imports with increase in pricing.
Duty Structure
Customs Duty (%) Before After Impact Export Duty (%) Before After
Bauxite 5.0 5.0 = Aluminium Ore 0.0 15.0
Aluminium Scrap 7.5 7.5 =Alumina 5.0 5.0 =Caustic Soda 2.5 2.5 =Aluminium Ingots 5.0 5.0 =Copper Concentrates 2.5 2.5 =Copper Scrap 5.0 5.0 =Refined Copper 5.0 5.0 =Zinc Concentrates 2.5 2.5 =Refined Zinc 5.0 5.0 =Lead Concentrates 2.5 2.5 =Refined Lead 5.0 5.0 =Petroleum Coke 2.5 2.5 =Calcined Petroleum Coke 2.5 2.5 =
Proposal and impact
Budget proposal Impact on IndustryExport duty on ‘Other aluminium ores, including laterite’ has been revised from nil to 15%.
Marginally Positive for the Aluminium Producers
Impact on Companies
Company Impact CommentsHindalco Industries Limited +
The rise in the export duty would ensure its domestic availability for higher aluminium production.
Vedanta Limited +National Aluminum Company Limited +
33
Union Budget ANALYSIS 2017-18
Oil and GasIndustry Synopsis
Oil and gas industry is globally divided into three major sectors viz (1) Upstream (involves exploring and production of crude oil) (2) Midstream (stores oil, gas and refined products as well as transports them to refineries) and (3) Downstream (includes all refineries and petrochemical plants which converts the crude oil into various petroleum products). India de-pends on imports for more than 80 per cent of its domestic crude oil needs.
Duty Structure
Customs Duty (%) Before After Impact
Liquefied Natural Gas (LNG) 5% 2.5% +
Proposal and Impact
Budget proposals Impact on the IndustryReduction in the basic customs duty on import of LNG (Liquefied Natural Gas) from existing 5% to 2.5%.
In view of the deficit domestic gas production, the decrease in the duty is likely to benefit petrochemical industry wherein LNG is used as a feed stock.
Creation of an integrated public sector ‘oil major’ which will be able to match the performance of international and domestic private sector oil and gas companies.
The integrated ‘oil major’ will likely have strong bargaining power and will be the likes of one of the bigger oil companies globally.
Setting up of Strategic Crude Oil Reserves. Highly beneficial for companies based out of energy-starved country like India. Especially during the higher crude oil prices.
Impact on Companies
Company Impact CommentsPetronet LNG Ltd + In view of the deficit domestic gas production, the decrease
in the duty is likely to benefit petrochemical industry and consequently, it is expected to increase demand for imported LNG.
Indian Oil Corporation Ltd =Oil India Ltd =Oil and Natural Gas Corporation Ltd =Reliance Industries Ltd =
34
Union Budget ANALYSIS 2017-18
PetrochemicalsIndustry Synopsis
Petrochemicals are downstream hydrocarbons derived from crude oil and natural gas. The petrochemical industry is primarily divided into basic products including olefins, ethane, propane, aromatic compounds (such as benzene, toluene), intermediate petrochemicals, end products, polymers, synthetic fibers and synthetic rubber. The industry is the main stay of industrial and agricultural development of the country and provides building blocks for several downstream industries, such as textiles, papers, paints, soaps, detergents, pharmaceuticals, etc.
Duty StructureCustoms Duty (%) Before After Impact
Medium Quality Terephthalic Acid (MTA) & Qualified Terephthalic Acid (QTA)
7.5% 5.0% +
o-Xylene 2.5% Nil +
2-Ethyl Anthraquinone [2914 69 90] for use in manufacture of hydrogen peroxide, subject to actual user condition
7.5% 2.5% +
Vinyl Polyethylene Glycol (VPEG) for use in manufacture of Poly Carboxylate Ether, subject to actual user condition
10.0% 7.5% +
Proposal and Impact
Budget proposals Impact on the IndustryReduction in custom duties It is expected to reduce the input cost of raw materials for the
petrochemical companies
35
Union Budget ANALYSIS 2017-18
PharmaceuticalsIndustry Snapshot
The Indian Pharmaceutical Industry (IPI) globally ranks third in terms of volume and thirteenth in terms of value. The lower market share in terms of value can be attributed to the predominance of generic medicines which command lower prices. As per estimates, the domestic market size of Active Pharmaceuticals Ingredients (API), formulations and Contract Research and Manufacturing Services (CRAMS) is estimated at about USD 21.50 billion and the export market for the same is estimat-ed at about USD 16.9 billion.
India’s drugs and pharmaceutical exports have increased by about 60% during the last five years and accounted for about 54-58% of the total industry sales during FY16 compared with around 40-45% during FY11. Export market has grown at a CAGR of about ~10% in the past five years ended FY16; this can be attributed to a growing trend in outsourcing of pharma-ceutical production by global pharmaceutical companies to low cost destinations like India and increasing penetration of generic drugs in the regulated markets on the back of patent expiries in the regulated markets.
The IPI industry is expected to grow at a CAGR of about 15% from USD over 36 billion in 2016 to USD 55 billion by 2020 given the huge export potential coupled with steady growth in the domestic formulation market. Growth in the domestic pharma market is expected to be driven by increase in the penetration of health insurance, improving access to healthcare facilities, rising prevalence of chronic diseases and rising per capita income. The export growth is expected to be led by increasing generic penetration in the regulated markets on the back of enhanced focus on the niche and complex product segments, patent expiries and growing demand from semi-regulated pharma markets. In the long term, growth in the ex-ports market will be sustained by emerging markets such as Russia, Brazil, South Africa, etc.
Duty Structure
Customs Duty (%) Before After Impact Excise Duty (%) Before After Impact
API - - - API 12.5 12.5 =Formulation - - - Formulation 6.0 6.0 =
Proposal and Impact
Budget proposals Impact on the Industry
• Key schemes announced
1) Amend the Drugs and Cosmetics Rules to ensure availability of medicines at reasonable prices and also formulate new norms for the medical devices sector to bring in investments.
• With NLEM (National List of Essential Medicine) 2015 and DPCO (Drug Price Control Order) 2016 already in place, some more drugs are likely to come under price control but this is not likely to impact growth of the pharmaceutical industry. Indian Pharmaceutical Industry (IPI), which derives growth primarily from export market, is expected to continue to see similar growth trend in line with last three years.
• Though India is well placed in the pharmaceutical drug manufacturing, it is in nascent stage when it comes to medical devices manufacturing segment. Presently, 100% FDI is already allowed through automatic route in medical devices sector. The proposed amendment should aid in attracting investment in this space. However, their contribution to IPI is expected to continue to be insignificant.
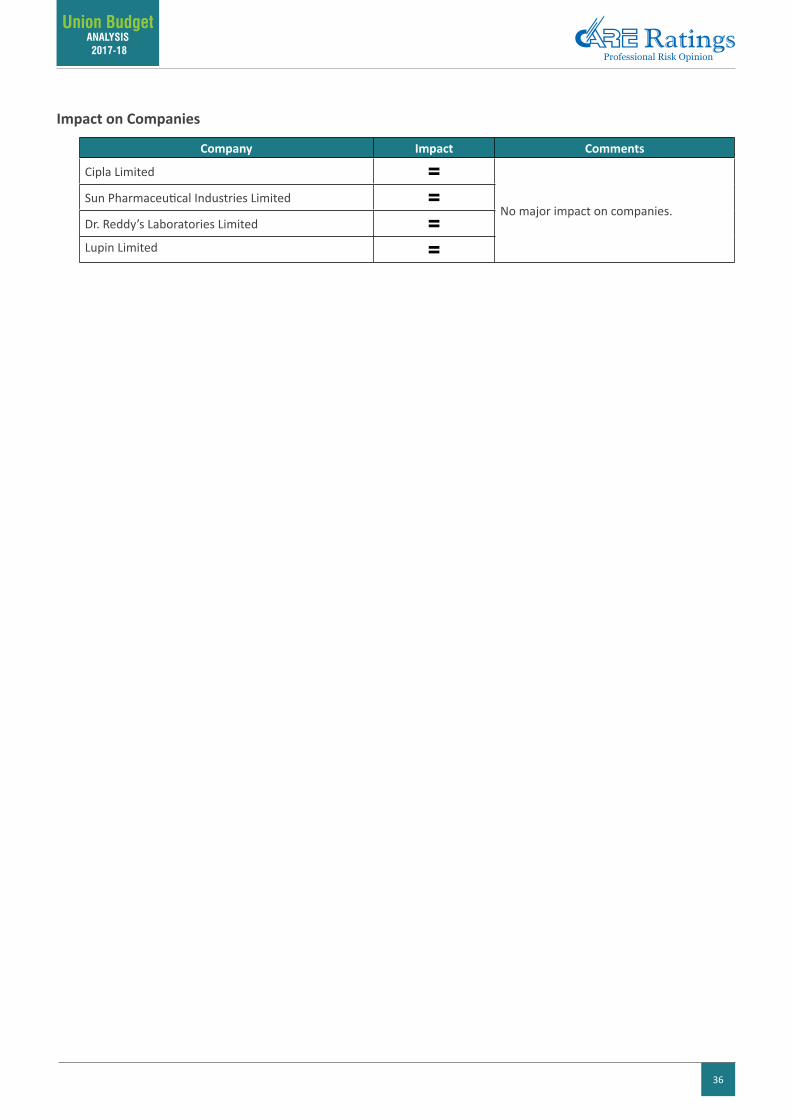
36
Union Budget ANALYSIS 2017-18
Impact on Companies
Company Impact Comments
Cipla Limited =No major impact on companies.
Sun Pharmaceutical Industries Limited =Dr. Reddy’s Laboratories Limited =Lupin Limited =
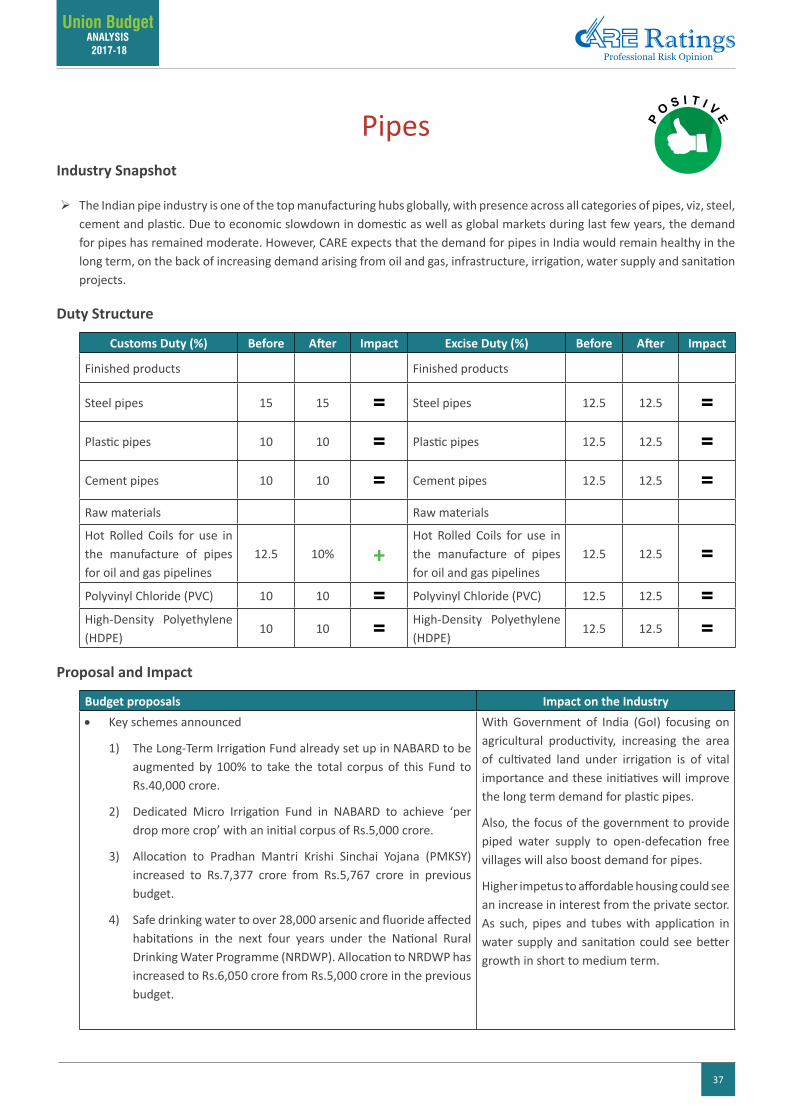
37
Union Budget ANALYSIS 2017-18
PipesIndustry Snapshot
The Indian pipe industry is one of the top manufacturing hubs globally, with presence across all categories of pipes, viz, steel, cement and plastic. Due to economic slowdown in domestic as well as global markets during last few years, the demand for pipes has remained moderate. However, CARE expects that the demand for pipes in India would remain healthy in the long term, on the back of increasing demand arising from oil and gas, infrastructure, irrigation, water supply and sanitation projects.
Duty Structure
Customs Duty (%) Before After Impact Excise Duty (%) Before After Impact
Finished products Finished products
Steel pipes 15 15 = Steel pipes 12.5 12.5 =Plastic pipes 10 10 = Plastic pipes 12.5 12.5 =Cement pipes 10 10 = Cement pipes 12.5 12.5 =Raw materials Raw materials
Hot Rolled Coils for use in the manufacture of pipes for oil and gas pipelines
12.5 10% +Hot Rolled Coils for use in the manufacture of pipes for oil and gas pipelines
12.5 12.5 =
Polyvinyl Chloride (PVC) 10 10 = Polyvinyl Chloride (PVC) 12.5 12.5 =High-Density Polyethylene (HDPE)
10 10 = High-Density Polyethylene (HDPE)
12.5 12.5 =
Proposal and Impact
Budget proposals Impact on the Industry• Key schemes announced
1) The Long-Term Irrigation Fund already set up in NABARD to be augmented by 100% to take the total corpus of this Fund to Rs.40,000 crore.
2) Dedicated Micro Irrigation Fund in NABARD to achieve ‘per drop more crop’ with an initial corpus of Rs.5,000 crore.
3) Allocation to Pradhan Mantri Krishi Sinchai Yojana (PMKSY) increased to Rs.7,377 crore from Rs.5,767 crore in previous budget.
4) Safe drinking water to over 28,000 arsenic and fluoride affected habitations in the next four years under the National Rural Drinking Water Programme (NRDWP). Allocation to NRDWP has increased to Rs.6,050 crore from Rs.5,000 crore in the previous budget.
With Government of India (GoI) focusing on agricultural productivity, increasing the area of cultivated land under irrigation is of vital importance and these initiatives will improve the long term demand for plastic pipes.
Also, the focus of the government to provide piped water supply to open-defecation free villages will also boost demand for pipes.
Higher impetus to affordable housing could see an increase in interest from the private sector. As such, pipes and tubes with application in water supply and sanitation could see better growth in short to medium term.
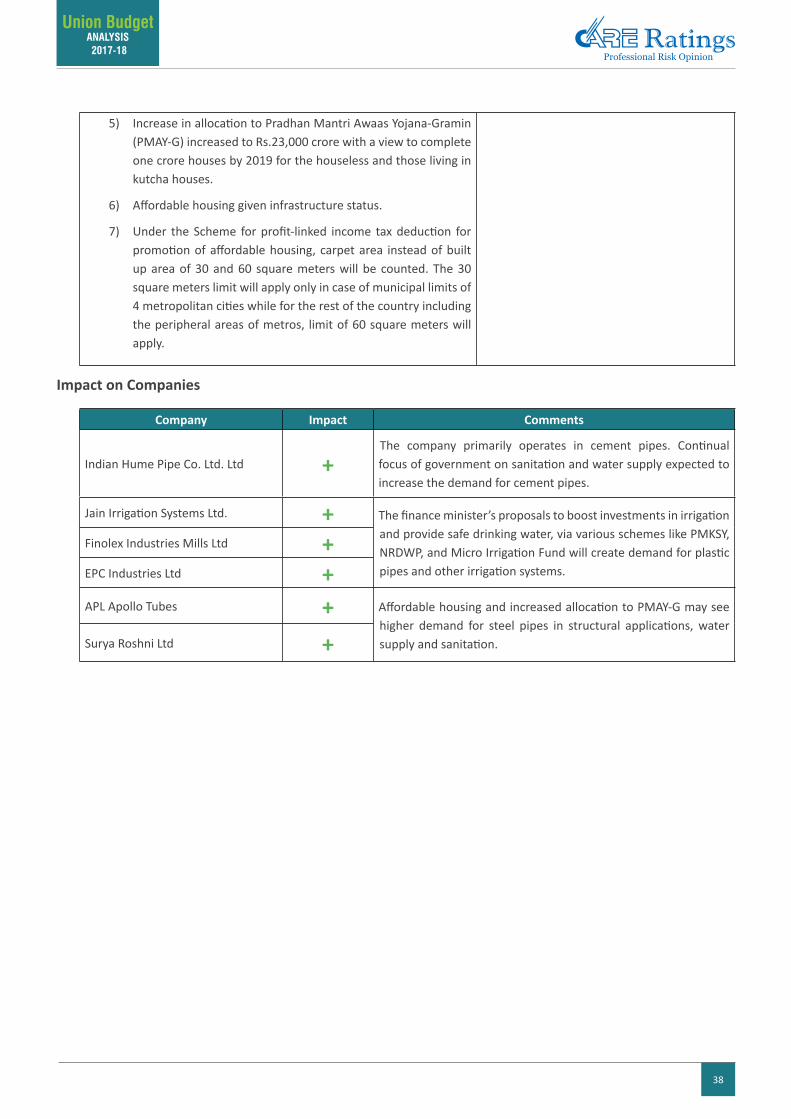
38
Union Budget ANALYSIS 2017-18
5) Increase in allocation to Pradhan Mantri Awaas Yojana-Gramin (PMAY-G) increased to Rs.23,000 crore with a view to complete one crore houses by 2019 for the houseless and those living in kutcha houses.
6) Affordable housing given infrastructure status.
7) Under the Scheme for profit-linked income tax deduction for promotion of affordable housing, carpet area instead of built up area of 30 and 60 square meters will be counted. The 30 square meters limit will apply only in case of municipal limits of 4 metropolitan cities while for the rest of the country including the peripheral areas of metros, limit of 60 square meters will apply.
Impact on Companies
Company Impact Comments
Indian Hume Pipe Co. Ltd. Ltd +The company primarily operates in cement pipes. Continual focus of government on sanitation and water supply expected to increase the demand for cement pipes.
Jain Irrigation Systems Ltd. + The finance minister’s proposals to boost investments in irrigation and provide safe drinking water, via various schemes like PMKSY, NRDWP, and Micro Irrigation Fund will create demand for plastic pipes and other irrigation systems.
Finolex Industries Mills Ltd +EPC Industries Ltd +APL Apollo Tubes + Affordable housing and increased allocation to PMAY-G may see
higher demand for steel pipes in structural applications, water supply and sanitation.Surya Roshni Ltd +
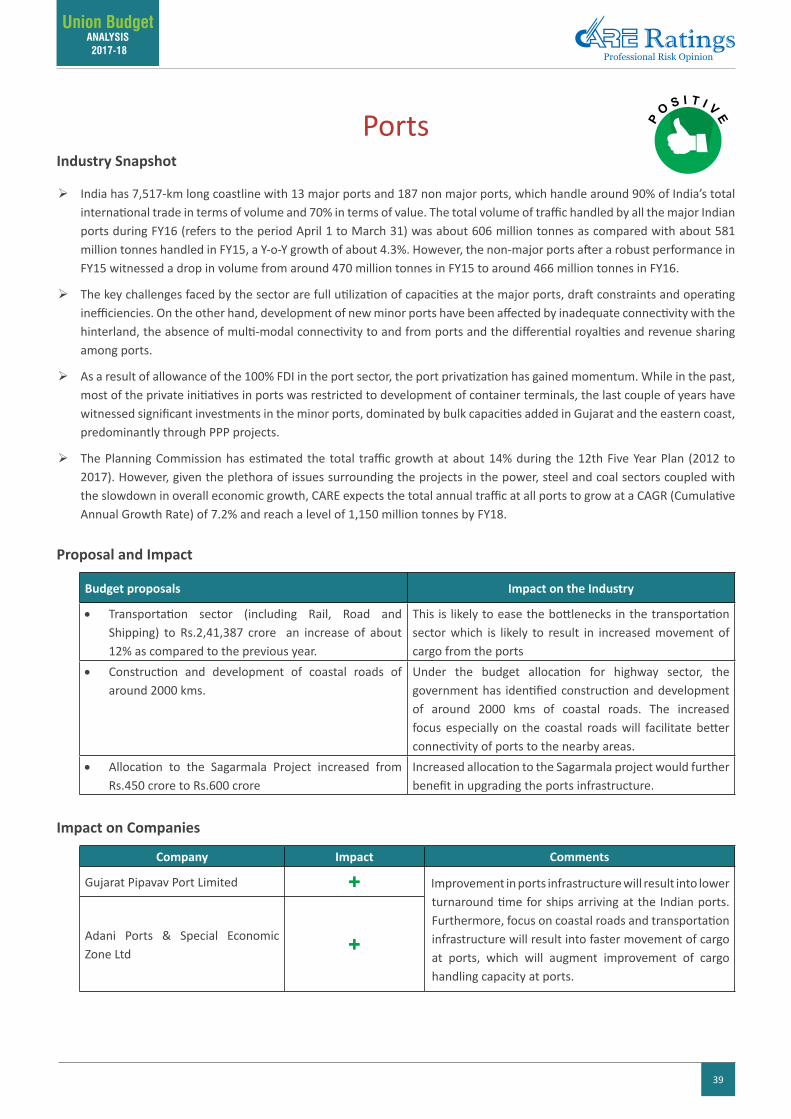
39
Union Budget ANALYSIS 2017-18
PortsIndustry Snapshot
India has 7,517-km long coastline with 13 major ports and 187 non major ports, which handle around 90% of India’s total international trade in terms of volume and 70% in terms of value. The total volume of traffic handled by all the major Indian ports during FY16 (refers to the period April 1 to March 31) was about 606 million tonnes as compared with about 581 million tonnes handled in FY15, a Y-o-Y growth of about 4.3%. However, the non-major ports after a robust performance in FY15 witnessed a drop in volume from around 470 million tonnes in FY15 to around 466 million tonnes in FY16.
The key challenges faced by the sector are full utilization of capacities at the major ports, draft constraints and operating inefficiencies. On the other hand, development of new minor ports have been affected by inadequate connectivity with the hinterland, the absence of multi-modal connectivity to and from ports and the differential royalties and revenue sharing among ports.
As a result of allowance of the 100% FDI in the port sector, the port privatization has gained momentum. While in the past, most of the private initiatives in ports was restricted to development of container terminals, the last couple of years have witnessed significant investments in the minor ports, dominated by bulk capacities added in Gujarat and the eastern coast, predominantly through PPP projects.
The Planning Commission has estimated the total traffic growth at about 14% during the 12th Five Year Plan (2012 to 2017). However, given the plethora of issues surrounding the projects in the power, steel and coal sectors coupled with the slowdown in overall economic growth, CARE expects the total annual traffic at all ports to grow at a CAGR (Cumulative Annual Growth Rate) of 7.2% and reach a level of 1,150 million tonnes by FY18.
Proposal and Impact
Budget proposals Impact on the Industry
• Transportation sector (including Rail, Road and Shipping) to Rs.2,41,387 crore an increase of about 12% as compared to the previous year.
This is likely to ease the bottlenecks in the transportation sector which is likely to result in increased movement of cargo from the ports
• Construction and development of coastal roads of around 2000 kms.
Under the budget allocation for highway sector, the government has identified construction and development of around 2000 kms of coastal roads. The increased focus especially on the coastal roads will facilitate better connectivity of ports to the nearby areas.
• Allocation to the Sagarmala Project increased from Rs.450 crore to Rs.600 crore
Increased allocation to the Sagarmala project would further benefit in upgrading the ports infrastructure.
Impact on Companies
Company Impact Comments
Gujarat Pipavav Port Limited + Improvement in ports infrastructure will result into lower turnaround time for ships arriving at the Indian ports. Furthermore, focus on coastal roads and transportation infrastructure will result into faster movement of cargo at ports, which will augment improvement of cargo handling capacity at ports.
Adani Ports & Special Economic Zone Ltd +
40
Union Budget ANALYSIS 2017-18
PowerIndustry Snapshot
The all-India installed capacity on December 31, 2016, was 310 Giga-Watts (GW). In FY15, the base power deficit was 3.6%, which declined to 2.1% in FY16, while peak deficit also declined from 4.7% in FY15 to 3.2% in FY16. During 9MFY17, base deficit has further declined to 0.7% and peak power deficit to 1.6%.
The sector is still plagued by weak health of power distribution companies, fuel-related issues and transmission constraints resulting in delays in payments, delays in signing PPAs, and curtailment. However, effective implementation of UDAY scheme can improve the financial profile of power distribution companies.
Encouraging policy framework in the renewable energy (RE) sector has resulted in rising share of RE capacity from 5.9% (7.7 GW) as on March 31, 2007, to 15% (46.67 GW) as on December 31, 2016. In 9MFY17, RE capacity addition was 4.34 GW compared with 3 GW in 9MFY16. The government has set a target of augmenting the renewable power capacity to 175 GW (including solar capacity of 100 GW) by 2022.
Duty Structure
Customs Duty (%) Before After Impact CVD (%) Before After ImpactItems of machinery required for fuel cell based power generating systems to be set up in the country or for demonstration purposes
10%/7.5% 5% +
Items of machinery required for fuel cell based power generating systems to be set up in the country or for demonstration purposes
12.5% 6% +
Items of machinery required for BoS operating on biogas/b i o - m e t h a n e / b y -product hydrogen
10%/7.5% 5% +
Items of machinery required for BoS operating on biogas/bio-methane/by-product hydrogen
12.5% 6% +
Solar tempered glass for use in the manufacture of solar cells/panels/modules
5% Nil + - - - -
- - - -
Parts/RMs for use in the manufacture of solar tempered glass for use in solar PV cells/modules, solar power generating equipment or systems, flat plate solar collector, solar PV module and panel for water pumping and other applications
12.5% 6% +
41
Union Budget ANALYSIS 2017-18
Resin & catalyst for use in the manufacture of cast components for Wind Operated Energy Generators (WOEG)
7.5% 5% +
Resin & catalyst for use in the manufacture of cast components for Wind Operated Energy Generators (WOEG)
12.5%4%(SAD)
Nil +
Proposal and Impact
Budget proposals Impact on the Industry• Key schemes announced
1) No change in the MAT rates. Also, there is no extension of tax benefits under Sec 80IA applicable for projects commissioned on or after April 1, 2017. However, extension of MAT credit is now allowed to be carried forward up to a period of 15 years instead of present applicable 10 years.
2) Commitment for 100% village electrification by May 2018 and pro-viding solar power (1000 MW) to 7000 railway stations.
3) Second phase of 20,000 MW of solar power park development is to be taken up.
4) Reduction in various duties for solar tempered glass and parts/RMs used in the manufacture of solar tempered glass for use in solar PV cells/modules, solar power generating equipment or systems, etc.
Overall neutral.
Present opportunity for players in the transmission, off-grid/decentralized power segment.
Solar parks would continue to attract interest of developers, including international players.
Overall neutral since most of the solar modules are imported.
Impact on Companies
Company Impact Comments
Various Power IPPs (such as Tata Power Ltd, NTPC Ltd, etc.)
=Tax benefit under 80IA will not be available for the sector and also accelerated depreciation benefit will be reduced for the renewable power projects with effect from April 1, 2017 at 40% as announced in the budget of 2016-17.
42
Union Budget ANALYSIS 2017-18
Real EstateIndustry Snapshot
The Indian real estate industry is the second-largest employment-generating sector after agriculture, contributing about 5-6% to India’s GDP. Not only does it generate a high level of direct employment (it employs around 7.6 million people), but it also stimulates the demand in over 250 ancillary industries such as cement, steel, paint, brick, building materials, consumer durables, etc. The sector has been witnessing demand slowdown due to high inflation, higher borrowing cost and weak economic sentiments affecting buyer’s confidence.
In October 2014, the Government relaxed the FDI conditions mainly to promote FDI in affordable housing. Projects committing at least 30% of the total project cost for affordable housing are exempted from minimum built-up area and capitalization requirements, with the condition of three-year lock-in. Also, the built-up area criteria for investments were reduced to 20,000 square meter (sq.m) from the earlier 50,000 sq.m and minimum capitalization requirement was reduced to $5 mn from $10 mn. On account of continued slowdown in the sector, the government further eased the FDI norms in November 2015. The built-up criteria of 20,000 sqm and minimum capitalization of $5 million to be brought in within the period of six months of the commencement of business have been removed. However, FDI inflows to real estate sector were very low during FY16 at just Rs.727 crore, which is a decline of 84% over FY15 inflows. The Real Estate (Regulation and Development) Bill, 2016, which will help both the developers and the buyers by instituting transparency and accountability, has been passed March 2016.
Proposal and Impact
Budget proposals Impact on the Industry
• Infrastructure status to affordable housing
This would increase the private participation in this segment and also lending to this segment will be a priority lending for banks. This will allow developers to access funds at lower rates.
• Under the scheme for profit-linked income tax deduction for promotion of affordable housing, carpet area instead of built-up area of 30 and 60 square meters will be counted. The 30 square meters limit will apply only in case of municipal limits of 4 metropolitan cities while for the rest of the country including in the peripheral areas of metros, limit of 60 square meters will apply.
These would enable purchasers to get more spacious homes and affordable housing segment will be more lucrative for the developers.
• Capital gains on Joint Development Agreement to be taxed only at product completion
• 1 year tax exemption from notional rental income from unsold inventory.
These would provide tax relief to developers in the residential sector holding inventory.
• Reduction of long-term capital gains tax period from 3 years to 2 years.
This might lead to increase in demand since this may increase the secondary sales as well.
Impact on CompaniesCompany Impact Sobha Developers Ltd = Overall, companies with focus on affordable housing
development will have a positive impact.Kolte Patil Developers Ltd =Ashiana Housing Limited +Godrej Properties Ltd =
43
Union Budget ANALYSIS 2017-18
RoadsIndustry Snapshot
The Indian road network carries around 65% of the total freight traffic and plays a vital role in the economic development. Over the years, both central and state governments have increased their budgetary allocation to expedite the pace of road construction. Recently, the sector has witnessed series of government initiatives to tackle execution hurdles, facilitate fund raising through stake sale, infrastructure investment trust (InVIT), permit refinance of debt for operational projects, release 75% of arbitration claim, launch of new credit rating system and award of hybrid annuity projects. National Highway Au-thority of India (NHAI) has awarded the highest number of projects on net length basis (i.e length awarded minus length terminated) in FY16. Projects went for termination after award and before receipt of appointed date reduced to nil during FY16. NHAI’s focus has also been shifted to hybrid annuity projects with 45% share in total award during 8MFY17. The pace of execution has also improved from 4.11 km per day during FY15 to 5.53 km per day during FY16. It further increased from 4.96 km per day during 8MFY16 to 5.66 km per day during 8MFY17 indicating 14% growth. Although actual award and execution during FY17 is expected to remain behind ambitious target set initially, reforms initiated by NHAI and GoI are expected to have a positive impact in the medium term.
Duty Structure
Excise Duty (%) Before After Impact
Cement 12.50 12.50 =Steel 12.50 12.50 =
Proposal and Impact
Budget proposals Impact on the Industry
• Key schemes announced
1) Increase in budgetary allocation from Rs.57,976 crore during the last budget to Rs.64,900 crore for 2017-18 is expected to provide further opportunity for the road developers.
2) Proposal to enhance coastal connectivity through road construction of 2,000 km
3) A mechanism to streamline institutional arrangements for resolution of disputes in infrastructure projects is going to be introduced as an amendment to the Arbitration and Conciliation Act 1996.
4) Extending carry forward of Minimum Alternative Tax (MAT) from current limit of up to 10 years to a limit up to 15 years
Increased budgetary allocation is expected to boost the sector and increase award and execution of new projects.
The new projects are expected to offer investment opportunity of around Rs.24,000 crore for the sector assuming four laning of identified stretches.
Effective introduction of stated mechanism and its implementation thereof in 2017-18 can help in addressing the hurdles faced by the sector.
Expected to provide tax benefits to special purpose vehicles (SPVs) of road projects for a longer period while improving the project returns.
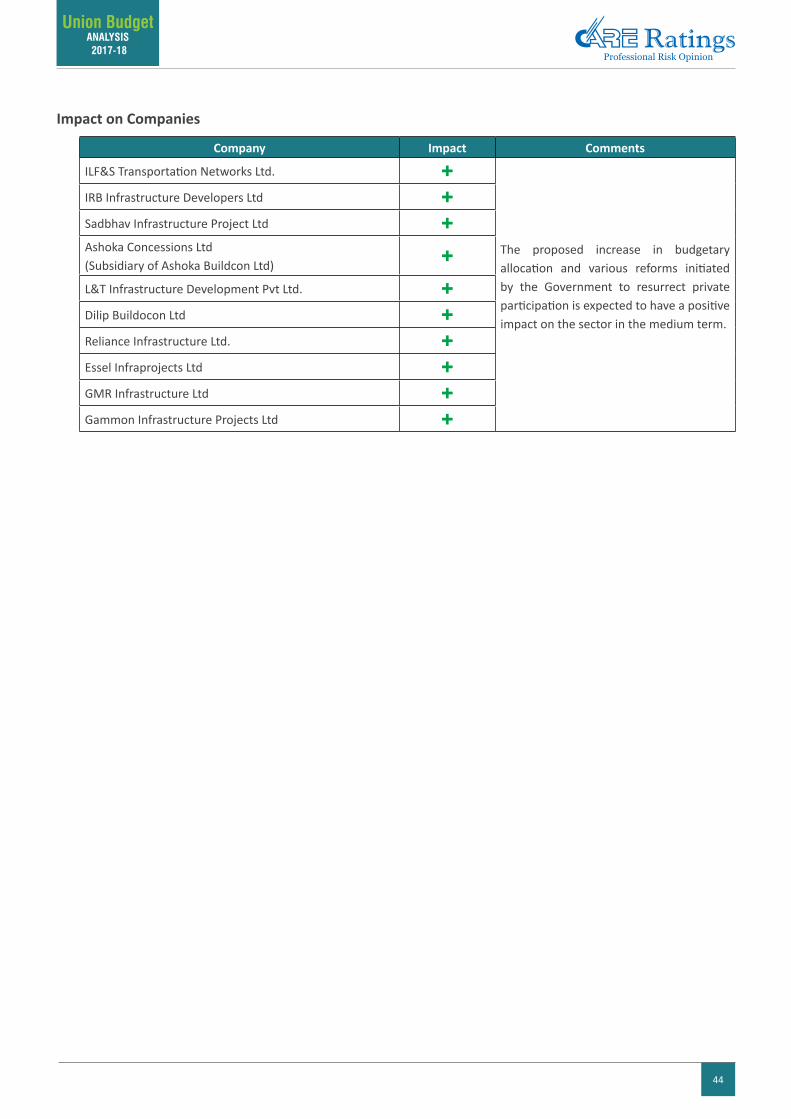
44
Union Budget ANALYSIS 2017-18
Impact on Companies
Company Impact Comments
ILF&S Transportation Networks Ltd. +
The proposed increase in budgetary allocation and various reforms initiated by the Government to resurrect private participation is expected to have a positive impact on the sector in the medium term.
IRB Infrastructure Developers Ltd +Sadbhav Infrastructure Project Ltd +Ashoka Concessions Ltd (Subsidiary of Ashoka Buildcon Ltd) +L&T Infrastructure Development Pvt Ltd. +Dilip Buildocon Ltd +Reliance Infrastructure Ltd. +Essel Infraprojects Ltd +GMR Infrastructure Ltd +Gammon Infrastructure Projects Ltd +
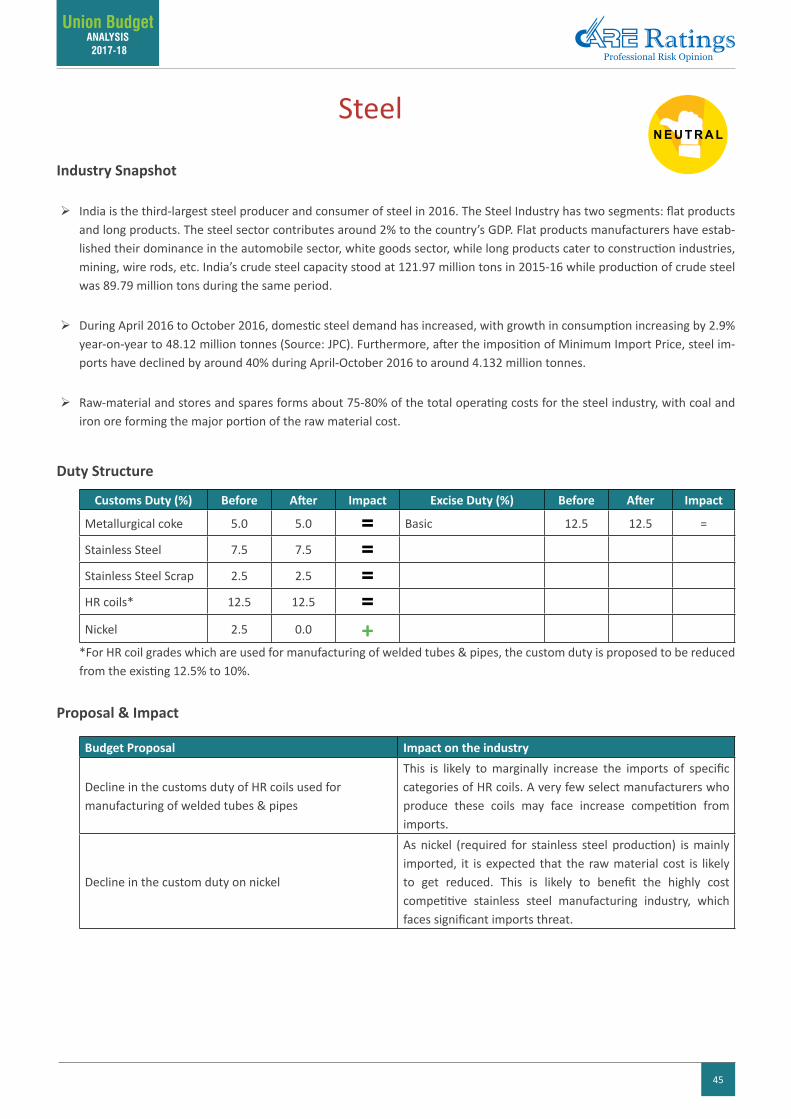
45
Union Budget ANALYSIS 2017-18
Steel
Industry Snapshot
India is the third-largest steel producer and consumer of steel in 2016. The Steel Industry has two segments: flat products and long products. The steel sector contributes around 2% to the country’s GDP. Flat products manufacturers have estab-lished their dominance in the automobile sector, white goods sector, while long products cater to construction industries, mining, wire rods, etc. India’s crude steel capacity stood at 121.97 million tons in 2015-16 while production of crude steel was 89.79 million tons during the same period.
During April 2016 to October 2016, domestic steel demand has increased, with growth in consumption increasing by 2.9% year-on-year to 48.12 million tonnes (Source: JPC). Furthermore, after the imposition of Minimum Import Price, steel im-ports have declined by around 40% during April-October 2016 to around 4.132 million tonnes.
Raw-material and stores and spares forms about 75-80% of the total operating costs for the steel industry, with coal and iron ore forming the major portion of the raw material cost.
Duty Structure
Customs Duty (%) Before After Impact Excise Duty (%) Before After Impact
Metallurgical coke 5.0 5.0 = Basic 12.5 12.5 =
Stainless Steel 7.5 7.5 =Stainless Steel Scrap 2.5 2.5 =HR coils* 12.5 12.5 =Nickel 2.5 0.0 +
*For HR coil grades which are used for manufacturing of welded tubes & pipes, the custom duty is proposed to be reduced from the existing 12.5% to 10%.
Proposal & Impact
Budget Proposal Impact on the industry
Decline in the customs duty of HR coils used for manufacturing of welded tubes & pipes
This is likely to marginally increase the imports of specific categories of HR coils. A very few select manufacturers who produce these coils may face increase competition from imports.
Decline in the custom duty on nickel
As nickel (required for stainless steel production) is mainly imported, it is expected that the raw material cost is likely to get reduced. This is likely to benefit the highly cost competitive stainless steel manufacturing industry, which faces significant imports threat.
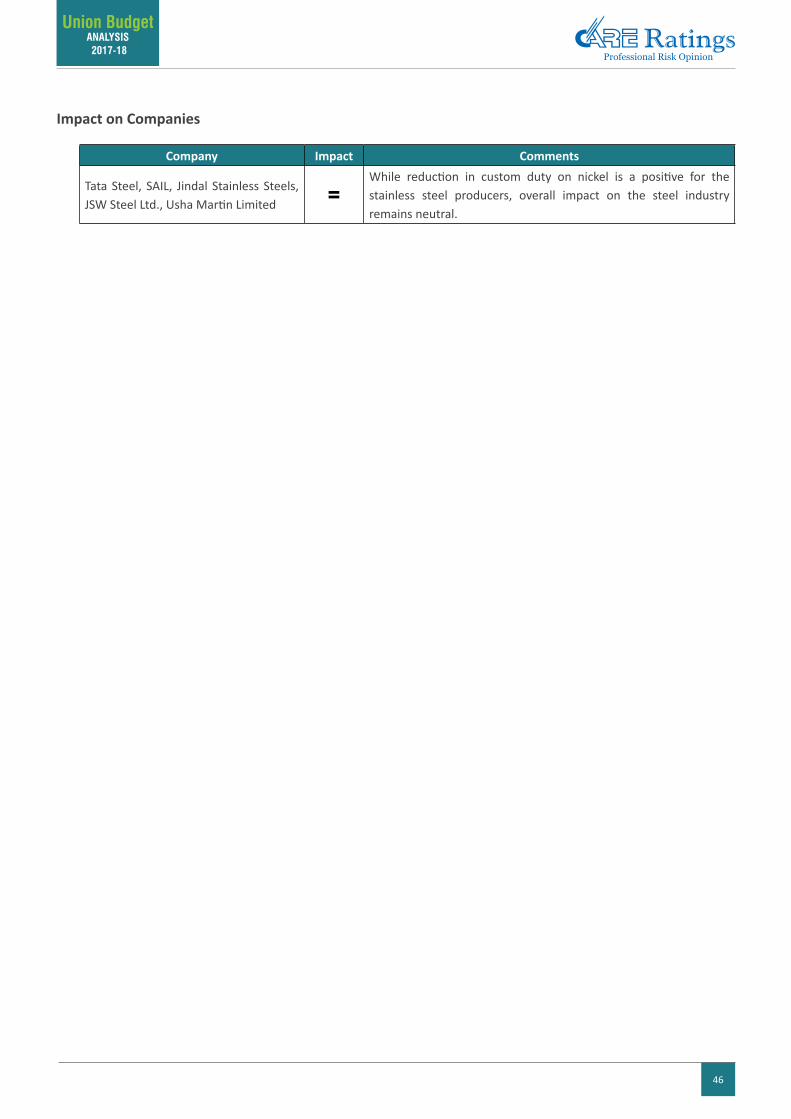
46
Union Budget ANALYSIS 2017-18
Impact on Companies
Company Impact Comments
Tata Steel, SAIL, Jindal Stainless Steels, JSW Steel Ltd., Usha Martin Limited =
While reduction in custom duty on nickel is a positive for the stainless steel producers, overall impact on the steel industry remains neutral.
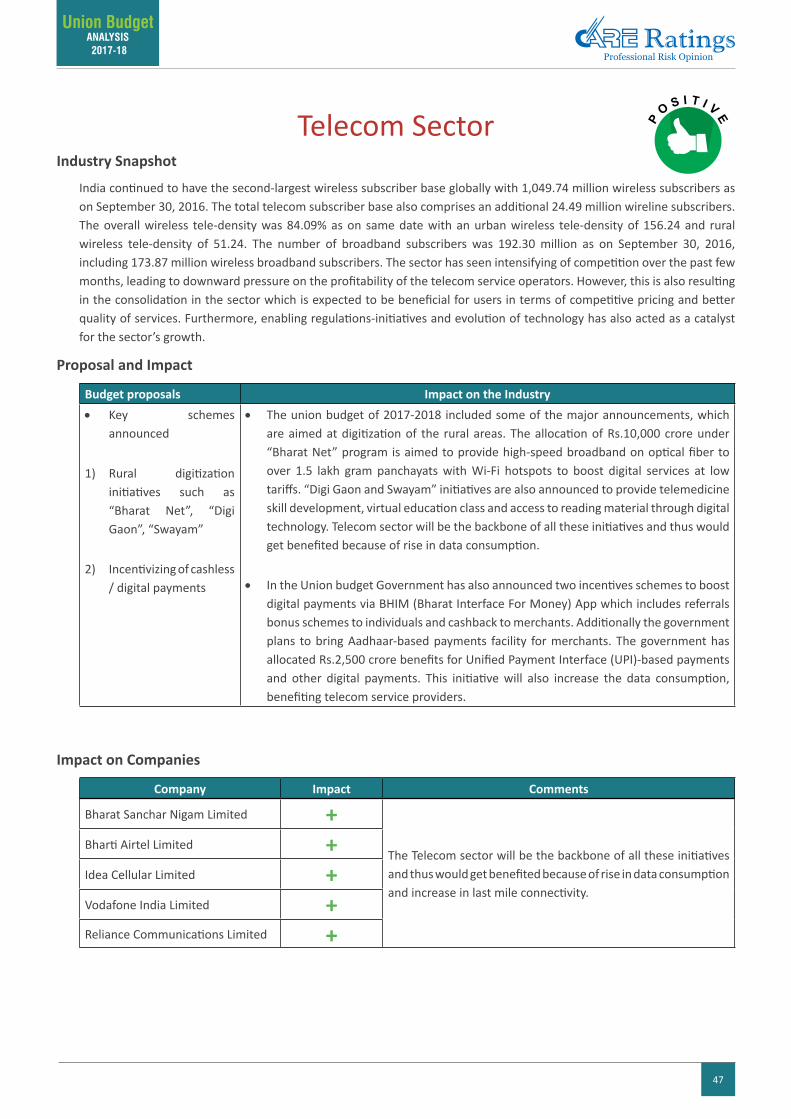
47
Union Budget ANALYSIS 2017-18
Telecom SectorIndustry Snapshot
India continued to have the second-largest wireless subscriber base globally with 1,049.74 million wireless subscribers as on September 30, 2016. The total telecom subscriber base also comprises an additional 24.49 million wireline subscribers. The overall wireless tele-density was 84.09% as on same date with an urban wireless tele-density of 156.24 and rural wireless tele-density of 51.24. The number of broadband subscribers was 192.30 million as on September 30, 2016, including 173.87 million wireless broadband subscribers. The sector has seen intensifying of competition over the past few months, leading to downward pressure on the profitability of the telecom service operators. However, this is also resulting in the consolidation in the sector which is expected to be beneficial for users in terms of competitive pricing and better quality of services. Furthermore, enabling regulations-initiatives and evolution of technology has also acted as a catalyst for the sector’s growth.
Proposal and Impact
Budget proposals Impact on the Industry• Key schemes
announced
1) Rural digitization initiatives such as “Bharat Net”, “Digi Gaon”, “Swayam”
2) Incentivizing of cashless / digital payments
• The union budget of 2017-2018 included some of the major announcements, which are aimed at digitization of the rural areas. The allocation of Rs.10,000 crore under “Bharat Net” program is aimed to provide high-speed broadband on optical fiber to over 1.5 lakh gram panchayats with Wi-Fi hotspots to boost digital services at low tariffs. “Digi Gaon and Swayam” initiatives are also announced to provide telemedicine skill development, virtual education class and access to reading material through digital technology. Telecom sector will be the backbone of all these initiatives and thus would get benefited because of rise in data consumption.
• In the Union budget Government has also announced two incentives schemes to boost digital payments via BHIM (Bharat Interface For Money) App which includes referrals bonus schemes to individuals and cashback to merchants. Additionally the government plans to bring Aadhaar-based payments facility for merchants. The government has allocated Rs.2,500 crore benefits for Unified Payment Interface (UPI)-based payments and other digital payments. This initiative will also increase the data consumption, benefiting telecom service providers.
Impact on Companies
Company Impact Comments
Bharat Sanchar Nigam Limited +The Telecom sector will be the backbone of all these initiatives and thus would get benefited because of rise in data consumption and increase in last mile connectivity.
Bharti Airtel Limited +Idea Cellular Limited +Vodafone India Limited +Reliance Communications Limited +
AHMEDABAD32, Titanium, Prahaladnagar Corporate Road,Satellite, Ahmedabad - 380 015Tel: +91-79-4026 5656
BENGALURUUnit No. 1101-1102, 11th Floor, Prestige Meridian II,No. 30, M.G. Road, Bengaluru - 560 001.Tel: +91-80-46625566/5555
CHANDIGARHSCF No. 54-55, First Floor, Phase 11, Sector 65, Mohali 160062Tel: +91-172-5171100/02
CHENNAIUnit No. O-509/C, Spencer Plaza, 5th Floor,No. 769, Anna Salai, Chennai - 600 002.Tel: +91-44-2849 7812 / 0811
COIMBATORET-3, 3rd Floor, Manchester SquarePuliakulam Road, Coimbatore - 641 037.Tel: +91-422-4332399 / 4502399
HYDERABAD 401, Ashoka Scintilla, 3-6-502, Himayat Nagar,Hyderabad - 500 029.Tel: +91-40-4010 2030
JAIPUR304, PashupatiAkshatHeights, Plot No. D-91,Madho Singh Road, Near Collectorate Circle,Bani Park, Jaipur - 302 016.Tel: +91-141-402 0213 / 14
KOLKATA3rd Floor, Prasad Chambers, (Shagun Mall Bldg.)10A, Shakespeare Sarani, Kolkata - 700 071.Tel: +91-33- 40181600/22831803
NEW DELHI13th Floor, E-1 Block, Videocon Tower,Jhandewalan Extension, New Delhi - 110 055.Tel: +91-11-4533 3200
PUNE9th Floor, Pride Kumar Senate,Plot No. 970, Bhamburda, Senapati Bapat Road,Shivaji Nagar, Pune - 411 015.Tel: +91-20- 4000 9000
REGIONAL OFFICE
CONTACTHead Office Mumbai
CREDIT ANALYSIS & RESEARCH LIMITED4th Floor, Godrej Coliseum, Somaiya Hospital Road, Off Eastern Express Highway, Sion (East), Mumbai - 400 022.Tel: +91-22-6754 3456 | Fax: +91-22-6754 3457 | E-mail: [email protected] | Website: www.careratings.com
Disclaimer: This report is prepared by Credit Analysis & Research Limited [CARE Ratings]. CARE Ratings has taken utmost care to ensure accuracy and objectivity while developing this report based on information available in public domain. However, neither the accuracy nor completeness of information contained in this report is guaranteed. CARE Ratings is not responsible for any errors or omissions in analysis/inferences/views or for results obtained from the use of information contained in this report and especially states that CARE Ratings has no financial liability whatsoever to the user of this report
www.careratings.com | Follow us on