Embed Size (px)
Citation preview

UNINTENDED CONSEQUENCES How introducing a manufacturing and export exemption to supplementary protection certificates would weaken global standards of IP protection and result in direct losses to Europe’s research-based biopharmaceutical industry – October 2017

SECTION
2
Professor Meir Perez Pugatch, Managing Director, Pugatch Consilium and IPKM Professor at the University of Maastricht
Dr. David Torstensson, Partner, Pugatch Consilium
Ma’ayan Laufer, Senior Consultant, Pugatch Consilium
This article was commissioned by AbbVie, F. Hoffmann – La Roche Ltd, and the U.S. Chamber of Commerce. The views contained in the article are those of the authors who retained editorial independence for the research and its findings.
Copyright © Pugatch Consilium 2017
The moral right of the authors has been asserted.
All rights reserved. Without limiting the rights under copyright reserved above, no part of this publication may be reproduced, stored or introduced into a retrieval system, or transmitted, in any form or by any means (electronic, mechanical, photocopying, recording or otherwise), without the prior written permission of both the copyright owner and the publisher.

UNINTENDED CONSEQUENCES
3
ABSTRACT
Background
In October 2015 the European Commission (EC) released its report Upgrading the Single Market: more opportunities for people and business, which includes a stated intention to explore an option for implementing a Supplementary Protection Certificate (SPC) manufacturing and export exemption, expected to boost economic growth and job creation within the generics and biosimilars industry. However, such a exemption’s impact on the innovative research-based biopharmaceutical industry and on the international level of intellectual property (IP) protection remains in question.
Methodology
Using evidence from the existing literature, a sample of 30 top-selling drugs, and France and Sweden as the primary source for SPC status within the EU we construct an econometric model and estimate potential annual losses to the global and the European innovative research-based biopharmaceutical industries.
Results
This study finds that implementation of an EU-wide SPC manufacturing and export exemption would potentially result in annual losses ranging between USD2.675 billion and up to USD5.35 billion to the global innovative biopharmaceutical industry, with approximately USD1.34 billion to USD2.27 billion of these attributed to the European innovative biopharmaceutical industry. Translating these losses to current levels of biopharmaceutical sector employment and R&D investment the effect of the introduction of an EU-wide SPC manufacturing and export exemption could be between 4,500-7,700 direct job losses (with an additional 19,000-32,000 indirect job losses) and a decrease of between EUR215 million to EUR364 million in R&D investment.
Conclusion
In light of these findings, we conclude that a manufacturing and export exemption, is likely to have a detrimental effect on the European research-based biopharmaceutical industry and is unlikely to provide a significant and sustained positive economic impact on the European generics industry.

SECTION
4 4

UNINTENDED CONSEQUENCES
5
BACKGROUND
In October 2015 the EC released its report Upgrading the Single Market: more opportunities for people and business, which details the overarching initiative to reform and deepen the single market with the purpose of spurring economic growth, job creation and reducing administrative burdens.1 One key challenge identified in the report was the need to address the ambiguity formed with the ongoing process for the creation of an EU-wide unitary patent system, and the lack of a conforming mechanism for SPCs.2
While emphasizing the benefits of a unitary SPC title, the EC also announced its intentions to explore options for recalibrating certain elements of this IP right. One such option put forth by the EC is to provide European manufacturers of generic drugs and biosimilars with an SPC manufacturing exemption which would “create thousands of high-tech jobs in the EU and many new companies”.3 This option and its cited benefits are based on an academic study by Vicente and Simões, published in the Journal of Generic Medicines in 2014.4 In the article, the writers argue that a manufacturing provision and an export provision (which would permit European generic and biosimilar manufacturers to manufacture and export pharmaceutical products that are protected under the SPC to countries where similar exclusivity does not exist) would result in substantial economic gains in the EU, including the creation of nearly 45,000 new direct and indirect jobs and revenue of over €3.3 billion between 2014 and 2022.5 Recently these claims were rebutted by Sussell et al.,6 which showed that the modelled estimates of economic and employment gains made by Vicente and Simões were in part based on invalid assumptions and mathematical errors and were, in fact, likely to be substantially lower if they materialized at all.7
Yet unanswered remains the question of what the effect of an SPC manufacturing and export exemption would be on the European and global research-based biopharmaceutical industry.
This is a question of real import as the research-based biopharmaceutical industry’s contribution to European GDP and job creation is substantial. In 2016 industry estimates suggests that this sector generated some 745,000 direct jobs (with over 113,000 employed directly in innovative R&D) – a growth of 33% since 2000.8 Furthermore, over EUR238 billion in pharmaceutical production were generated by the European research-based biopharmaceutical industry in 2015, as well as investments of some EUR33.5 billion in R&D activities across the EU.9

6
METHODOLOGY AND RESULTS
Estimating the potential losses to the European and the global research-based biopharmaceutical industry.
Step 1: Identifying ‘sales at risk’ of innovative drugs in potential markets
Our economic model begins by reaching an estimated dollar figure that represents the global annual sales of biopharmaceuticals. Since different sources provide varying estimates, we used an average of three sources, resulting in a figure of roughly USD1,000 billion.10 This figure was then adjusted to account only for sales in countries to which European generics and biosimilars manufacturers could export their products that are still under SPC protection in the EU. Naturally, these products could only be exported to countries in which all relevant forms of market or IP exclusivity are either not available or have expired (e.g., regulatory data protection, standard patent term, any applicable patent restoration term). In order to identify these countries we have used the U.S. Chamber of Commerce’s
International IP Index 2017 which examines the IP framework environment in 45 countries, including the existence of a pharmaceutical patent term restoration.11 This analysis suggests that potential markets for exports of generics/biosimilars of SPC-protected products are primarily emerging markets such as Argentina, Brazil, China, Colombia, India, Indonesia, Mexico, Russia, Saudi Arabia, South Africa and Turkey.12
Using publicly available pharmaceutical sales data from IMS the share of emerging markets, including the aforementioned countries, of the global sales of pharmaceuticals is estimated at roughly 21%.13 This adjusts the sales figure to USD210 billion in sales of pharmaceuticals in emerging markets.
Next we adjusted this figure to account only for sales of innovative products in these markets, which is estimated at roughly 17%.14 This adjustment provided a final ‘sales at risk’ figure of USD35.7 billion, which represents the estimated annual sales of innovative products in emerging markets.
FIGURE 1 Estimating annual sales of innovative drugs in emerging markets
Global annual sales of pharmaceuticals
Adjusting for the share of emerging markets
(21%)
Adjusting for the share of innovative drugs in
sales of pharmaceuticals in emerging markets
(17%)
USD 1,000 billion USD 210 billion USD 35.7 billion
UNINTENDED CONSEQUENCES
7
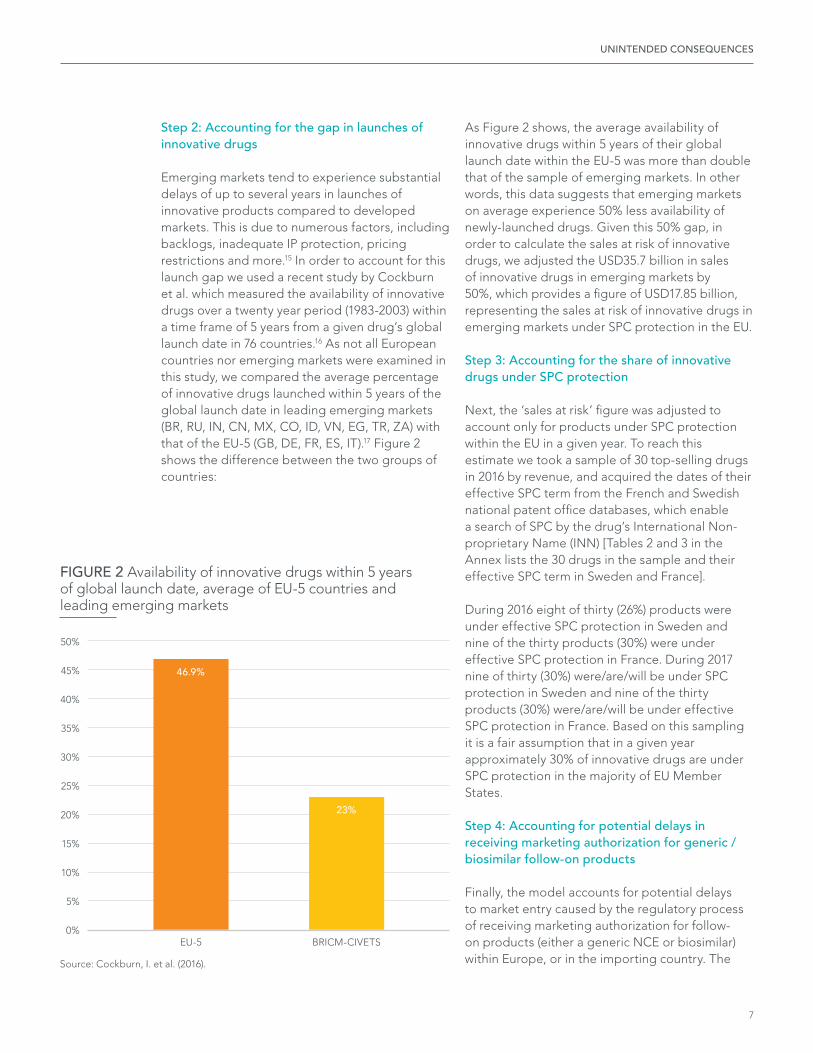
Step 2: Accounting for the gap in launches of innovative drugs
Emerging markets tend to experience substantial delays of up to several years in launches of innovative products compared to developed markets. This is due to numerous factors, including backlogs, inadequate IP protection, pricing restrictions and more.15 In order to account for this launch gap we used a recent study by Cockburn et al. which measured the availability of innovative drugs over a twenty year period (1983-2003) within a time frame of 5 years from a given drug’s global launch date in 76 countries.16 As not all European countries nor emerging markets were examined in this study, we compared the average percentage of innovative drugs launched within 5 years of the global launch date in leading emerging markets (BR, RU, IN, CN, MX, CO, ID, VN, EG, TR, ZA) with that of the EU-5 (GB, DE, FR, ES, IT).17 Figure 2 shows the difference between the two groups of countries:
As Figure 2 shows, the average availability of innovative drugs within 5 years of their global launch date within the EU-5 was more than double that of the sample of emerging markets. In other words, this data suggests that emerging markets on average experience 50% less availability of newly-launched drugs. Given this 50% gap, in order to calculate the sales at risk of innovative drugs, we adjusted the USD35.7 billion in sales of innovative drugs in emerging markets by 50%, which provides a figure of USD17.85 billion, representing the sales at risk of innovative drugs in emerging markets under SPC protection in the EU.
Step 3: Accounting for the share of innovative drugs under SPC protection
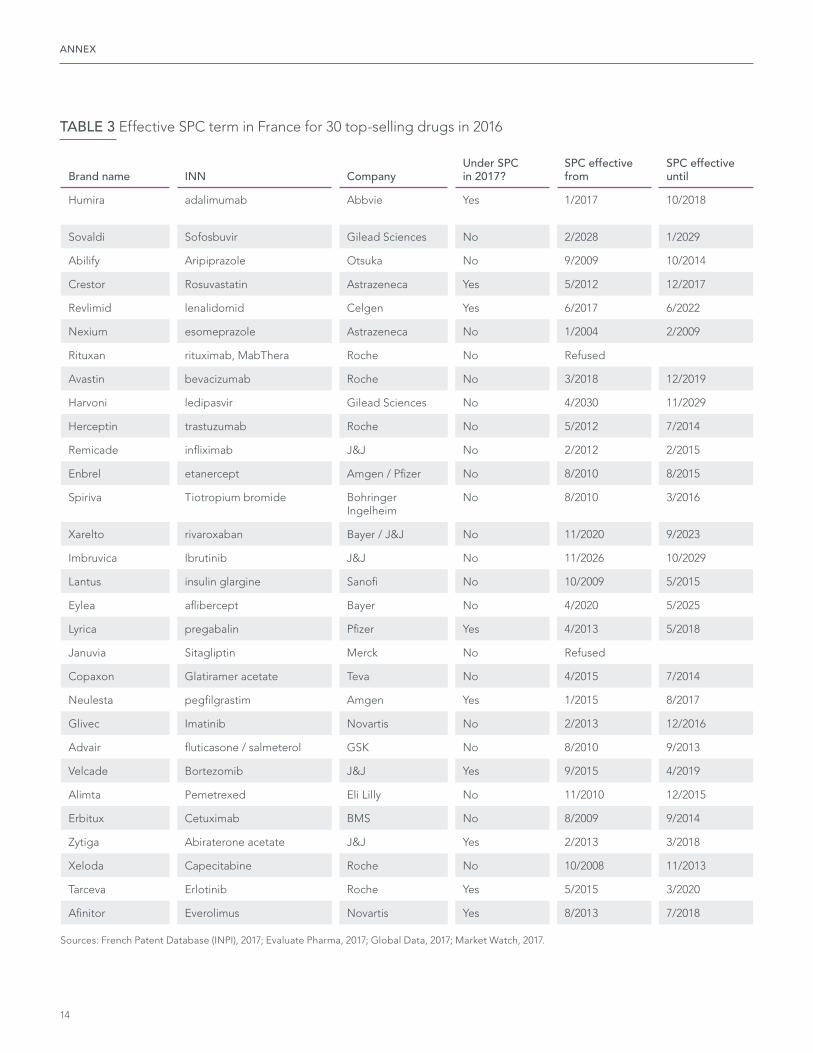
Next, the ‘sales at risk’ figure was adjusted to account only for products under SPC protection within the EU in a given year. To reach this estimate we took a sample of 30 top-selling drugs in 2016 by revenue, and acquired the dates of their effective SPC term from the French and Swedish national patent office databases, which enable a search of SPC by the drug’s International Non-proprietary Name (INN) [Tables 2 and 3 in the Annex lists the 30 drugs in the sample and their effective SPC term in Sweden and France].
During 2016 eight of thirty (26%) products were under effective SPC protection in Sweden and nine of the thirty products (30%) were under effective SPC protection in France. During 2017 nine of thirty (30%) were/are/will be under SPC protection in Sweden and nine of the thirty products (30%) were/are/will be under effective SPC protection in France. Based on this sampling it is a fair assumption that in a given year approximately 30% of innovative drugs are under SPC protection in the majority of EU Member States.
Step 4: Accounting for potential delays in receiving marketing authorization for generic / biosimilar follow-on products
Finally, the model accounts for potential delays to market entry caused by the regulatory process of receiving marketing authorization for follow-on products (either a generic NCE or biosimilar) within Europe, or in the importing country. The
FIGURE 2 Availability of innovative drugs within 5 years of global launch date, average of EU-5 countries and leading emerging markets
Source: Cockburn, I. et al. (2016).
50%
45%
40%
35%
30%
25%
20%
15%
10%
5%
0%EU-5
46.9%
BRICM-CIVETS
23%

8
METHODOLOGY AND RESULTS
EU Commission’s current proposals are not clear on whether follow-on products produced under a potential SPC exemption program will be required to obtain a European marketing authorization prior to exportation, or authorization only in the importing country. Since under each of these options some delay in market entry is expected, this model takes into account both scenarios.
Under the first option, a European-based generics/biosimilars company is required to obtain a European marketing authorization prior to exporting its follow-on version of the SPC-protected product to potential non-EU markets. The approval process for a generic or a biosimilar product by the European Medicines Agency (whether by the centralized, decentralized or national procedure) takes between 4 to 6 months.18
Under the second option, a European-based generics/biosimilars company can export its product under a Certificate of Pharmaceutical Product (CPP).19 In these cases, the exported product will be required to obtain a marketing authorization by the local competent authority. However, timelines for approval vary greatly. Some markets, such as Mexico, have acted to expedite the approval process to 60 days.20 Other markets, such as Brazil, experience substantial delays which can exceed three years.21 On average with estimate market authorization would take roughly 6 months.
Thus, under each of the options European-based generics / biosimilars companies may face a delay in market entry of up to 6 months on average.
Step 5: Estimating the potential losses for the global innovative biopharmaceutical industry
Following the process described in steps 1 and 2 we have reached a figure of USD17.85 billion representing the ‘sales at risk’ of innovative drugs. In step 3 we estimated that 30% of innovative drugs are under their effective SPC protection each year, based on an analysis of a sample of 30 top-selling products in 2016. In step 4 we estimated that these products may
experience a delay of up to 6 months in market entry on average, thus reducing the expected annual revenues by up to 50%. Extrapolating these percentages to the ‘sales at risk’ figure, we therefore estimate that a manufacturing and export provisions would potentially result in losses ranging between USD2.675 billion and up to USD5.35 billion to the global innovative biopharmaceutical industry.
Step 6: Estimating the potential losses for the European innovative biopharmaceutical industry
In order to calculate the percentage share of these global losses that would potentially apply to the European innovative biopharmaceutical industry, we created a proxy measure. This measure applies the share of European innovative companies among the world’s top innovative biopharmaceutical companies by revenue in 2016, extracted from three different sources.22 The average share of European research-based companies is placed at 42.5% of global revenue. Applying this share of global revenues to the estimate of potential global losses gives a range of USD1.34 billion and up to USD2.27 billion – representing the potential losses/exposure to the European innovative biopharmaceutical industry due to a potential SPC manufacturing and export exemptions.
How would the potential losses to the European innovative biopharmaceutical industry affect the European economy and in particular employment and R&D investment?
Over the past decade, losses sustained by the European innovative biopharmaceutical industry due to patent expiry of best-selling drugs have resulted in significant job-cuts and closures of R&D sites across Europe.23
In the following sub-section we provide an estimate of the potential negative impact an SPC exemption and the resulting loss of sales would have on employment for the European innovative biopharmaceutical industry and on investments in domestic R&D and clinical research.

UNINTENDED CONSEQUENCES
9
Estimating the negative impact of an SPC manufacturing and export exemption on jobs and R&D investment
In order to estimate the potential impact of an SPC exemption on employment and R&D investment we compare the estimated potential losses to the European innovative biopharmaceutical industry described above to total sales for a sample of the biggest European research-based manufacturers. In 2016 the total global sales of the ten biggest European biopharmaceutical companies was approximately USD218.235 billion (see Table 4 in the Annex). Using these numbers as an estimated aggregate for total sales by research-based European biopharmaceutical companies, the estimated potential losses from an SPC exemption of USD1.34-USD2.27 billion makes up 0.61% to 1.04% of this figure.
Estimating the impact of the SPC exemption on jobs
Industry figures suggest that in 2016 the European innovative biopharmaceutical industry directly employed some 745,000 people across Europe (a 33% increase since 2000) with over 113,000 employed directly in high-skilled innovative R&D jobs.24 Assuming a potential reduction in employment following on from the estimated
losses of 0.61% to 1.04% of sales caused by a potential SPC exemption, a similar 0.61% to 1.04% reduction applied on industry employment there could potentially be between 4,600 and up to 7,750 jobs lost in direct employment in the European biopharmaceutical industry. Given the current ratio of R&D jobs as a share of total employment, anywhere between 706 and 1,196 of these losses would be in high-value R&D activities including clinical research.
In addition to these direct jobs losses there is also potential additional losses in indirect employment. The research-based biopharmaceutical sector is a high-tech, high-value sector and each job within the sector supports a number of other jobs within the economy. A 2016 study by TEConomy Partners and the American biopharmaceutical industry association PhRMA examined the industry’s economic footprint in the US. With regards to employment it found that each job within the biopharmaceutical industry supports an additional 4.21 indirect jobs, creating a total employment multiplier of 5.21.25 Applying this multiplier to the most recent industry estimates of employment within the European innovative biopharmaceutical industry, the potential scope for direct and indirect jobs loss extends between 24,000 and up to 40,000 jobs across Europe.26
FIGURE 3 Estimating the potential losses to the European and the global innovative biopharmaceutical industry
STEP 1 Identifying ‘sales at risk’ of innovative drugs in potential markets: USD35.7 billion
STEP 2 Accounting for the gap in launches of innovative drugs: USD17.85 billion
STEP 3 Accounting for the share of innovative drugs under SPC protection: 30%
STEP 4 Accounting for potential delays in receiving marketing authorization for products produced under a SPC exemption program: Up to 50% of expected annual revenue
STEP 5 A conservative estimate of the potential losses for the global innovative biopharmaceutical industry: Between USD2.675 billion and up to USD5.355 billion
STEP 6 A conservative estimate of the potential losses for the European innovative biopharmaceutical industry: Between USD1.34 billion and up to USD2.27 billion

10
It is also likely that a loss in sales caused by the SPC exemption would reduce the number of new jobs created annually by the research-based industry. Since 2000 the research-based industry has created close to 200,000 new jobs in Europe growing the total number of individuals employed in Europe in the sector from 554,186 to the current estimate of 745,000.27
In sum, the SPC exemption could result in between 4,500-7,700 direct job losses (with an additional 19,000-32,000 indirect job losses) across Europe.
Estimating the impact of the SPC exemption on R&D investment
Each year the European innovative biopharmaceutical industry invests circa 15% of its revenues in R&D and innovation. For 2016 EFPIA industry figures show that the research-based European biopharmaceutical industry invested circa EUR35 billion in R&D within Europe – nearly double the amount invested in 2000.28 Assuming a potential reduction in R&D investment in Europe following on from the estimated 0.61% to 1.04% in sales losses caused by a potential SPC exemption, applying the same 0.61% to 1.04% reduction on total industry R&D spending in Europe there could potentially be a drop in R&D spending of anywhere between EUR215 million and EUR364 million.
METHODOLOGY AND RESULTS
TABLE 1 Estimating the impact of the SPC exemptions on European economy
Total direct employment (2016)
Direct employment in R&D (2016)
Investment in R&D, EFPIA member companies (2016)
In 2016 745,000 (e) 115,000 (e) EUR35 billion (e)
Estimated potential losses due to introduction of an SPC exemption
Conservative estimate
4,574 direct jobs and additional 19,258 indirect jobs
706 direct jobs in R&D EUR215 million
Moderate estimate
7,749 direct jobs and additional 32,623 indirect jobs
1,196 direct jobs in R&D EUR364 million

UNINTENDED CONSEQUENCES
11
DISCUSSIONThe potential detrimental effect of SPC exemptions extends beyond the loss of jobs and investments in R&D within Europe. Countries outside the EU which maintain robust IP regimes may emulate this exemption of IP rights, seeking also to boost the growth of their local generics and biosimilars companies.29 Ironically, this spill-over effect may lead not only to a deterioration of international standards of IP protection but also to increased competition which may substantially reduce the expected share of EU-based generic and biosimilar manufacturers.
Today these countries biopharmaceutical IP policy regimes are fairly in line with the EU with regards to launch and approval of innovative drugs as well as providing patent term restoration.30 Broadly speaking innovative drugs enter their effective SPC term in many of these countries virtually in parallel to the EU, providing generic and biosimilar companies the same advantage as generic manufacturers’ would receive under the SPC exemption policy in the EU. If an SPC manufacturing and export exemption would be emulated by these countries thus increasing market competition, it would substantially reduce the likelihood of significant and sustained economic activity for the European generic and biosimilar manufacturing industry.
Under such a scenario, the end result of the introduction of the SPC exemption policy may significantly harm the global and EU research-based industry (as estimated in the preceding section) without any tangible gain for European generic manufacturers.
More broadly, loosening standards for IP protection is a slippery slope. Following on proposals for an SPC export exemption there are now also calls being made to extend the concept of an export exemption to the entire basic 20-year term of patent protection. This would provide
follow-on product manufacturer’s the ability to export their products as early as the originator’s market entry into markets where the product is not patent protected.31 However, as this study shows, neither an SPC exemption nor a wider exemption of IP rights are likely to achieve a ‘level playing field’ for European-based generics and biosimilars manufacturers, as other non-EU countries would seek to emulate these exemptions and compete for their market share. Furthermore, the negative effect of this type of extended ‘full-term’ export exemption on the European economy would be substantial. The existing gap in launches of innovative products between Europe and potential markets, as described above, would entail losses of many years of exclusivity for the European innovative biopharmaceutical industry and, as this article suggests, is highly likely to translate into substantial loss of jobs and R&D investments.

12 12
CONCLUSIONThis study examines the potential consequences of introducing an EU-wide SPC manufacturing and export exemption.
Our economic modelling based on existing biopharmaceutical sales data suggests that an EU SPC manufacturing and export exemption would potentially result in annual losses ranging between USD2.675 billion and up to USD5.35 billion to the global innovative biopharmaceutical industry; approximately USD1.34 billion to USD2.27 billion of these can be attributed to the European innovative biopharmaceutical industry.
In turn, these losses may result in anywhere between 4,600 and up to 7,700 direct job losses in the European research-based industry as well as an additional 19,000 to 32,000 jobs indirectly supported by the industry; furthermore, these losses may lead to a decrease of circa EUR215 million to EUR364 million in R&D investment within Europe.

UNINTENDED CONSEQUENCES
13
ANNEX
TABLE 2 Effective SPC term in Sweden for 30 top-selling drugs in 2016
Brand name INN CompanyUnder SPC in 2017?
SPC effective from
SPC effective until
Humira adalimumab Abbvie Yes 2/2017 10/2018
Sovaldi Sofosbuvir Gilead Sciences No 3/2028 1/2029
Abilify Aripiprazole Otsuka No 10/2009 10/2014
Crestor Rosuvastatin Astrazeneca Yes 7/2012 6/2017
Revlimid lenalidomid Celgen Yes 7/2017 6/2022
Nexium esomeprazole Astrazeneca No Rejected
Rituxan rituximab, MabThera Roche No Applied, no decision yet
Avastin bevacizumab Roche No 4/2018 12/2019
Harvoni ledipasvir Gilead Sciences No Applied, no decision yet
Herceptin trastuzumab Roche No 6/2012 7/2014
Remicade infliximab J&J No 3/2012 8/2014
Enbrel etanercept Amgen / Pfizer No Original SPC N/A, latest available SPC expired 1/2015
Spiriva Tiotropium bromide Bohringer Ingelheim
No 9/2010 3/2016
Xarelto rivaroxaban Bayer / J&J No 12/2020 9/2023
Imbruvica Ibrutinib J&J No 12/2026 10/2029
Lantus insulin glargine Sanofi No 11/2009 11/2014
Eylea aflibercept Bayer No 5/2020 5/2025
Lyrica pregabalin Pfizer No Revoked
Januvia Sitagliptin Merck Yes 4/2017 3/2022
Copaxon Glatiramer acetate Teva No 5/2015 8/2015
Neulesta pegfilgrastim Amgen Yes 2/2015 8/2017
Glivec Imatinib Novartis No 3/2013 12/2016
Advair fluticasone / salmeterol GSK No 9/2010 9/2013
Velcade Bortezomib J&J Yes 10/2015 4/2019
Alimta Pemetrexed Eli Lilly No 12/2010 12/2015
Erbitux Cetuximab BMS No 9/2009 9/2014
Zytiga Abiraterone acetate J&J Yes 3/2013 3/2018
Xeloda Capecitabine Roche No 11/2008 11/2013
Tarceva Erlotinib Roche Yes 6/2015 3/2020
Afinitor Everolimus Novartis Yes 9/2013 7/2018
Sources: Swedish Patent Database (PRV), 2017; Evaluate Pharma, 2017; Global Data, 2017; Market Watch, 2017.
14
Brand name INN CompanyUnder SPC in 2017?
SPC effective from
SPC effective until
Humira adalimumab Abbvie Yes 1/2017 10/2018
Sovaldi Sofosbuvir Gilead Sciences No 2/2028 1/2029
Abilify Aripiprazole Otsuka No 9/2009 10/2014
Crestor Rosuvastatin Astrazeneca Yes 5/2012 12/2017
Revlimid lenalidomid Celgen Yes 6/2017 6/2022
Nexium esomeprazole Astrazeneca No 1/2004 2/2009
Rituxan rituximab, MabThera Roche No Refused
Avastin bevacizumab Roche No 3/2018 12/2019
Harvoni ledipasvir Gilead Sciences No 4/2030 11/2029
Herceptin trastuzumab Roche No 5/2012 7/2014
Remicade infliximab J&J No 2/2012 2/2015
Enbrel etanercept Amgen / Pfizer No 8/2010 8/2015
Spiriva Tiotropium bromide Bohringer Ingelheim
No 8/2010 3/2016
Xarelto rivaroxaban Bayer / J&J No 11/2020 9/2023
Imbruvica Ibrutinib J&J No 11/2026 10/2029
Lantus insulin glargine Sanofi No 10/2009 5/2015
Eylea aflibercept Bayer No 4/2020 5/2025
Lyrica pregabalin Pfizer Yes 4/2013 5/2018
Januvia Sitagliptin Merck No Refused
Copaxon Glatiramer acetate Teva No 4/2015 7/2014
Neulesta pegfilgrastim Amgen Yes 1/2015 8/2017
Glivec Imatinib Novartis No 2/2013 12/2016
Advair fluticasone / salmeterol GSK No 8/2010 9/2013
Velcade Bortezomib J&J Yes 9/2015 4/2019
Alimta Pemetrexed Eli Lilly No 11/2010 12/2015
Erbitux Cetuximab BMS No 8/2009 9/2014
Zytiga Abiraterone acetate J&J Yes 2/2013 3/2018
Xeloda Capecitabine Roche No 10/2008 11/2013
Tarceva Erlotinib Roche Yes 5/2015 3/2020
Afinitor Everolimus Novartis Yes 8/2013 7/2018
ANNEX
TABLE 3 Effective SPC term in France for 30 top-selling drugs in 2016
Sources: French Patent Database (INPI), 2017; Evaluate Pharma, 2017; Global Data, 2017; Market Watch, 2017.

UNINTENDED CONSEQUENCES
15
CompanyGlobal sales of biopharmaceuticals (2016 or latest available figures)
Roche $ 40,838
Novartis $ 32,562
Sanofi $ 21,586
Astrazeneca $ 21,319
GSK $ 20,985
BMS $ 19,427
Bayer $ 18,924
Novo Nordisk $ 17,325
Boehringer Ingelheim $ 13,872
Shire $ 11,397
Total $ 218,235
TABLE 4 Global sales of biopharmaceuticals, ten largest European biopharmaceutical companies (2016 or latest available figures, in million USD)32
Sources: Companies’ respective websites, annual reports and/or US 20-F forms.

16

UNINTENDED CONSEQUENCES
17
1 European Commission, (2015). Upgrading the Single Market: more opportunities for people and business, COM(2015) 550 final, Brussels.
2 Ibid., p. 15. A Supplementary Protection Certificate is an Intellectual Property (IP) right, similar to the Patent Term Extension (PTE) in place in the US and other countries, which can provide up to five additional years of exclusivity following the expiration of the patent protection, as a compensation for lost term of patent protection due to delays in obtaining marketing authorization. It is currently granted on a national basis within all EU and EEA-member states as well as Switzerland, Albania, Bosnia and Herzegovina, Macedonia, and Serbia. For a detailed discussion of the availability, scope and limitations of the SPC, see: J A Kemp, Supplementary Protection Certificates for Medicinal Products, 24.10.2014, http://jakemp.com/uploads/files/general-briefings/Supplementary_Protection_Certificates_for_Medicinal_Products.PDF.
3 European Commission, (2015). The EC has used the term “waiver” in all of its major publications on the matter (including the Inception Impact Assessment) to describe the proposed changes to SPC protection for the purposes of manufacturing and exports. This report will instead use the term “exemption”. Under the proposed policy changes the current rights conferred by SPC protection in the EU will be exempted rather than waived.
4 Vicente, V. and Simoes, S. (2014). “Manufacturing and export provisions: Impact on the competitiveness of European pharmaceutical manufacturers and on the creation of jobs in Europe”, Journal of Generic Medicines, Vol. 11, Issue 1–2, pp.35–47.
5 Ibid., p. 35.6 Sussell, J. A. et al. (2017). “Reconsidering the economic impact of
the EU manufacturing and export provisions”, Journal of Generic Medicines, Vol. 13, Issue 2, pp. 73–89.
7 Ibid.8 EFPIA (2017). The Pharmaceutical Industry in Figures 2017, p.3,
https://www.efpia.eu/media/219735/efpia-pharmafigures2017_statisticbroch_v04-final.pdf.
9 Ibid.10 See: IMShealth, (2016). Outlook for Global Medicines through
2021, p.1; Deloitte, (2016). 2016 Global life sciences outlook: Moving forward with cautious optimism, p.2; EvaluatePharma, (2016). World Preview 2016, Outlook to 2022, p. 9.
11 Global Intellectual Property Center, International IP Index, Fifth Edition, US Chamber of Commerce, http://www.theglobalipcenter.com/ipindex2017/.
12 See: IMShealth, (2013). Pharmerging Markets: Picking a pathway to success, White Paper, https://www.imshealth.com/files/web/Global/Services/Services%20TL/IMS_Pharmerging_WP.pdf.
13 Ibid., p. 1. Figure represents ‘pharmerging’ markets’ pharmaceuticals sales in 2012, after removing Poland and Romania (1% each) on account of their EU membership.
14 See: IMShealth, (2016). Outlook for Global Medicines through 2021, p.45; IMShealth (2012). Outlook for Global Medicines through 2016, p.8; The percentage represents an average of the sources, to account for change overtime.
15 Cockburn, I., Lanjouw, J. O. and Schankerman, M. (2016). “Patents and the global diffusion of new drugs”, American Economic Review, Vol. 106, No.1, pp. 136-164; Wileman, H., & Mishra, A. (2010). Drug Lag and Key Regulatory Barriers in the Emerging Markets. Perspectives in Clinical Research, Vol. 1, No. 2, pp. 51–56.
16 Cockburn, I., Lanjouw, J. O. and Schankerman, M. (2016). “Patents and the global diffusion of new drugs”, American Economic Review, Vol. 106, No.1, pp. 136-164.
17 Countries codes: BR – Brazil, RU – Russia, IN – India, CN – China, MX – Mexico, CO – Colombia, ID – Indonesia, VN – Vietnam, EG – Egypt, TR – Turkey, ZA – South Africa, GB – United Kingdom, DE – Germany, FR – France, ES – Spain, IT – Italy.
18 The approval process for a generic NCE or a biosimilar by EMA takes a minimum of 120 days, or 4 months. The approval of translations of the product’s Annex, SmPC, labeling, package leaflet etc., into all EU languages requires an additional month, with an additional potential delay of up to one month caused by fixed monthly dates for applications submission. See: EMA, Marketing Authorisation, generic medicines, generic and Hybrid applications, Q.3.1 How shall my generic/hybrid application be evaluated (timetable)? Rev. Mar 2013, http://www.ema.europa.eu/ema/index.jsp?curl=pages/regulation/q_and_a/q_and_a_detail_000170.jsp&mid=WC0b01ac0580514d5c; EMA, Marketing Authorisation, biosimilar medicines, Q. 3.1 3.1. How shall my similar biological medicinal product application be evaluated (timetable)? Rev. Mar 2013, http://www.ema.europa.eu/ema/index.jsp?curl=pages/regulation/q_and_a/q_and_a_detail_000168.jsp&mid=WC0b01ac0580533e0b.
19 See: World Health Organization (2010). WHO Certification Scheme on the Quality of Pharmaceutical Products Moving in International Commerce: Questions and Answers (Q&A), Working document QAS/10.374, May 2010, http://www.who.int/medicines/areas/quality_safety/regulation_legislation/certification/qas_certif_scheme_2012.pdf.
20 Salud Mexico, Generics Commanding Pharmaceutical Market Share, Posma, J., 21.8.2015, http://mexicosalud.com/generics-commanding-pharmaceutical-market-share/ https://www.thepharmaletter.com/article/russia-tightens-procedure-for-accelerated-registration-of-drugs.
21 See: ANVISA, Regularização de Produtos – Medicamentos, Fila de Análise (unofficial translation: Product regularization – medicines, queue analysis), http://portal.anvisa.gov.br/fila-de-analise; Senado Noticias, Necessidade de agilizar registro de medicamentos é consenso em debate na CAS (unofficial translation: The need to streamline drug registration is a consensus in the CAS debate), 9.3.2016, http://www12.senado.leg.br/noticias/materias/2016/03/09/necessidade-de-agilizar-registro-de-medicamentos-e-consenso-em-debate-na-cas.
22 Fierce Pharma, Top 15 pharma companies by 2016 revenue, 14.3.2017, http://www.fiercepharma.com/special-report/top-15-pharma-companies-by-2016-revenues; Evaluate Pharma, (2016). World Preview 2016, Outlook to 2022, p. 19; Global Data, Top 25 pharma companies by global sales, PMLive, http://www.pmlive.com/top_pharma_list/global_revenues.
23 See for example: PharmaExec.com, Pharma Job Cuts Cause Anxiety in Europe, 2.6.2013, http://www.pharmexec.com/pharma-job-cuts-cause-anxiety-europe; The Guardian, AstraZeneca to move some UK jobs to Poland, Costa Rica and Malaysia, 4.12.2016, https://www.theguardian.com/business/2016/dec/04/astrazeneca-pharmaceuticals-jobs-moved-costa-rica-poland-malaysia-cost-cutting; Nature Biotechnology News, Researchers cut loose as Pfizer and Merck shutter European sites, Subbaraman, N., Nature Biotechnology 29, 299–300, Published online 08 April 2011; Fierce Pharma, Troubled Lundbeck targets 1,000 layoffs in HQ, commercial revamp, 19.8.2015, http://www.fiercepharma.com/corporate/troubled-lundbeck-targets-1-000-layoffs-hq-commercial-revamp; Biopharmadive.com, GSK to ax hundreds of jobs through manufacturing shuffle, 20.7.2017, http://www.biopharmadive.com/news/gsk-to-ax-hundreds-of-jobs-through-manufacturing-shuffle/447563/.
24 EFPIA (2017). The Pharmaceutical Industry in Figures 2017, pp.12-3, https://www.efpia.eu/media/219735/efpia-pharmafigures2017_statisticbroch_v04-final.pdf
25 TEConomy Partners; for PhRMA. The Economic Impact of the US Biopharmaceutical Industry. Columbus, OH: TEConomy Partners; April 2016.
NOTES

NOTES
18
26 Given the fact that most European research-based biopharmaceutical manufacturers do not, relatively speaking, have huge numbers of employed persons in emerging markets compared to their headquarters or main R&D centers (which are predominantly in Europe) these estimated losses are based on a working assumption that job losses due to an SPC exemption would be concentrated in Europe. Nevertheless, many European research-based manufacturers have significant numbers of employees in emerging markets and so it is probable that there would be job losses in these markets as well. These would, however, most likely be concentrated in sales and marketing divisions as opposed to R&D or advanced manufacturing which is concentrated in Europe.
27 Ibid. p. 13.28 EFPIA (2017). The Pharmaceutical Industry in Figures 2017, p.3,
https://www.efpia.eu/media/219735/efpia-pharmafigures2017_statisticbroch_v04-final.pdf.
29 Consider, for example, two countries which, like EU Member States, maintain fairly robust IP regimes (including the granting of patent term restoration) and are also home to some of the biggest and most competitive generic manufacturing companies in the world. Israel provides an exemption for manufacturing and export of generic follow-on products despite a term of market exclusivity being in place under Israel’s existing RDP framework. The introduction of RDP in Israel in July 2005 resulted in a heated debate between stakeholders (including the Government of Israel and the US Trade Representative) over the carve-out of data exclusivity which permitted the Israeli Ministry of Health to rely on innovators’ confidential data in approving the safety and efficacy of a generic drug; a prerequisite for granting a CPP that is required for exports. Although regulations published by the Ministry in October 2007 included non-reliance on innovator’s confidential data when approving a generic drug for marketing in Israel, de facto the option to rely on innovators’ confidential data in testing the safety and efficacy of generic drugs that are yet unregistered in Israel is maintained to date, enabling the exports of generics and biosimilar drugs that are not registered (or in the process of registration) in Israel. Israel is home to some of the largest biopharmaceutical companies in the world specializing in follow-on products with established and substantive presence in emerging markets. Similarly, Australia is currently considering the implementation of a similar SPC exemption. The Productivity Commission – an independent advisory board to the Australian Government on economic and social affairs – has urged the Government to pursue “the steps needed to explicitly allow the manufacture for export of pharmaceuticals in their patent extension period”, echoing the recommendation made by the Pharmaceutical Patents Review Panel (commissioned by the Australian Government) in 2013.
30 Based on examination of availability of the sample of 30 top-selling drugs in 2016. See also: Sansom, L., DeLaat, W., Horvath, J. (2015). Review of Medicines and Medical Devices Regulation: Report on the regulatory framework for medicines and medical devices, Canberra; Bareket, E., Benshafrut, R., Ben-Dori Alkan, C. Major Overhaul of the Israeli PTE System: Attention and Action Required, January 27 , 2014.
31 Seuba, X., Genovesi, M., Roffe, P. (2017). “A Manufacturing for Export Exception”, in Contemporary Issues in Pharmaceutical Patent Law: Setting the Framework and Exploring Policy Options, Mercurio, B. and Kim, D. (Eds.), Routledge.
32 Global sales figures refer only to sales of biopharmaceuticals and were extracted from companies’ websites and/or 20-F forms; figures were converted into USD using current exc

UNINTENDED CONSEQUENCES
19

CONTACT USIsrael Office 10 Hanechoshet St, Tel Aviv 6971072 Tel: +972 3 6299294 Fax: +972 3 6204395
UK Office 88 Sheep Street, Bicester, Oxon OX26 6LP Tel: +44 1869 244414 Fax: +44 1869 320173
FOLLOW USFor more information on our services, to read our research reports or media coverage and for all the latest Pugatch Consilium news, please take a look at our online news room and blog or follow us on social media.
www.pugatch-consilium.com
Twitter@PConsilium


![20110712 Unintended Consequences 12[1].07](https://img.pdfslide.us/doc/110x75/577d278b1a28ab4e1ea429b5/20110712-unintended-consequences-12107.jpg)