Embed Size (px)
Citation preview

EUR Prev. 2016A Prev. 2017E Prev. 2018E Prev. 2019E
Organic RevGrowth
-- 3.7% -- 3.8% -- 4.1% -- 4.3%
EBIT Margin -- 15.3% 15.7% 16.0% 16.3% 16.8% 16.9% 17.6%
EPS -- 1.88 2.02 2.11 2.22 2.34 2.42 2.59
Div Yield -- 3.30% -- 3.50% -- 3.80% -- 4.10%
FCF Yield
FY Dec -- 4.80% -- 5.30% -- 5.80% -- 6.40%
GBp Prev. 2016A Prev. 2017E Prev. 2018E Prev. 2019E
FY Dec -- 153.34 172.11 180.44 188.63 200.54 206.50 221.92
FY P/E 26.4x 22.4x 20.2x 18.2x
Price Performance
MAR-16 JUL-16 NOV-16 MAR-17
50
45
40
35
^Prior trading day's closing price unlessotherwise noted.
COMPANY NOTE
Target | Estimate Change
Europe | Consumer | Food & HPC 15 March 2017
Unilever NV (UNA NA)A Marmite Stock No Longer. And Still APositive Spread From Here.
EQU
ITY R
ESEARC
H EU
ROPE
BUYPrice target €51.50
(from €44.00)Price €46.10^
Price target 4,490.00p(from 3,700.00p)Price 4,042.00p^
Bloomberg AEX: UNA NABloomberg LSE: ULVR LN
Financial SummaryNet Debt (MM): €10,230.4
Market Data52 Week Range: €46.22 - €36.22Total Entprs. Value (MM): €141,813.6Market Cap. (MM): €131,583.2Institutional Ownership: 77.2%Shares Out. (MM): 2,854.3Float (MM): NAAvg. Daily Vol.: 4,543,914
Martin Deboo *Equity Analyst
+44 (0) 20 7029 8670 [email protected] Letten *
Equity Analyst+44 (0)20 7029 8020 [email protected]
* Jefferies International Limited
Key Takeaway
The NV is up 15% post-KHC and ahead of a review in April. We stay on boardand counsel investors not to underestimate the value of the galvanising shockthat has been administered. Our Buy case assumes faster progress on margins,but not a spin/split, which we think offers insufficient risk/reward from here.But the ultimate end-game remains one of building a New World Order in HPCby acquiring Colgate. April's review should be seen as a staging post to that.
A profound wake-up call, the positive impact of which should not be under-estimated. As the shockwaves abate, the galvanising impact of Kraft's (KHC's) approach forULVR shouldn't be underestimated, in our view. Despite an NV/plc share price up 15%/20%since Feb 16, we continue to see upside from here, with April's review a first staging post.
Buying Colgate our preferred end-game. Argues for a 'keep and improve'stance in April. We identify 3 end-games for ULVR, of which building a New World Orderin HPC (via Colgate) is most attractive. We project fair value across 4 scenarios of €53-€56per share, but it's a stretch without disposals. Better, we think, to hold on to non-HPC assets,in pursuit of selling a control premium later, when the time is right to pay for one on Colgate.
Upgrading stand-alone numbers to top-end of current margin guidance.Results in FY19E EPS of €259c (€279c inc. buyback). In the meantime, and witheyelids suitably fluttered at CAGNY, ULVR need to demonstrate renewed impetus on costs.We think progress beyond the top end of 40-80bps margin guidance would be a stretch.But even that offers a 7% EPS uplift by FY19 (relative to our previous high-end numbers &a 15% uplift including a €6bn annual buyback), with growth in EPS/FCF of 11%/12% paalong the way. Which can be owned for the current 21.3x PER, relative to NESN 21.0x, P&G22.5x & Colgate 24.8x.
No further upside from a spin. Costs as well as benefits. We have been advocatesof a spin/split...until we counted the costs. While we can scope an incremental c.€10bnof benefit from a spin (of Foods or Foods & Refreshment), predicated on improved valuediscovery, plus an indicative €2.75 special dividend, we also scope c.€10bn costs to achieve.The risk/reward feels unattractive and there is an opportunity cost in the form of a controlpremium foregone on any eventual sale.
Valuation/RisksOur PT of €51.50 reflects a target 15x EBITDA (was 14x) which equates to 21.6x PER, adiscount to peers at 22.8x. Risks include i.) EM demand ii.) fx.
Please see analyst certifications, important disclosure information, and information regarding the status of non-US analysts on pages 52 to 56 of this report.

Contents SCENARIOS SUMMARY ........................................................................................................................ 3 A WAKE-UP CALL THAT IS FUNDAMENTALLY GOOD NEWS FOR INVESTORS ......................................... 4
A profound shock… ............................................................................................................................4 …that is likely to inspire more radical and decisive action .................................................................4 A significant and valuable catalyst for change internally ..................................................................4 Working back to April from three distinct end-games .......................................................................6 Allowing for ULVR’s belief system .....................................................................................................7
VALUE ON THE TABLE, DESPITE RAISED BAR ........................................................................................ 8 Shares up by 15%/20% since the approach .......................................................................................8 Raises the bar to additional value creation relative to undisturbed price .........................................8 Footnote: what is ULVR’s market cap? ............................................................................................10
MOVING TO THE TOP END OF MARGIN GUIDANCE. BUT CAUTIOUS BEYOND THAT ............................ 11 ULVR’s cost base: myth and reality .......................................................................................................11 SG&A efficiency not best-in-class, but not dramatically out-of-line of either .......................................11 But progress on SG&A reduction limited to date..................................................................................12
UK case study: steady work in a mature market .............................................................................13 Seeing margin progress beyond upper bound of current guidance as a challenge...............................15
ZBB programme suitably aggressive ...............................................................................................15 Not a conspicuously under-earning business relative to mix ...........................................................16
Upgrading stand-alone forecasts to the top end of guidance range. Modelling a return to Buybacks .20 Upgrading margin forecasts to the top end of the current guidance range ....................................20 Scoping a potential €18bn cumulative buyback to 2019 .................................................................20 Stand-alone forecast scenarios summary ........................................................................................21
NO FURTHER UPSIDE FROM A SPLIT, ONCE COSTS & COMPLEXITIES ARE WEIGHED ............................ 23 The case for a split ................................................................................................................................23
Questionable returns from scale and diversification .......................................................................23 But costs as well as benefits ............................................................................................................23 Potentially significant upsides: Cadbury & other case studies .........................................................24
Material potential upsides for ULVR from enhanced valuation perception, prior to any costs ............26 Still unconvinced by the synergy arguments in Developed Markets ....................................................28
UK case study: largely un-integrated other than back office? .........................................................29 Separation in the UK un- problematic, with scale diseconomies limited .........................................30
But Emerging Markets more complicated ............................................................................................31 India case study: manufacturing separability, distribution complexity............................................32
Options for a split: Gradations of Foods, DM’s vs. EM’s. The question of Refreshment .......................34 The complexity of Foods ..................................................................................................................35 The question of Refreshment...........................................................................................................36 Appraising the split options .............................................................................................................36
Limited upsides from here, once the costs and risks are properly weighed? .......................................37 Modelling two spin scenarios with a target multiple of 16.2x EBITDA ............................................38 Scoping €10-12bn of offsetting value destruction ...........................................................................38 Scoping a special dividend of €2.75 per ULVR share ........................................................................38 Limited upsides relative to our base case ........................................................................................39
ACQUIRING COLGATE ........................................................................................................................ 41 Potential ULVR/CL combinations .....................................................................................................41
Strong strategic logic ............................................................................................................................41 Good strategic fit. Competition issues manageable ........................................................................41
Modelling a deal ...................................................................................................................................43 Valuation gap currently relative unattractive .................................................................................43 Colgate, Unilever and Universal merger assumptions .....................................................................43 Colgate assumptions .......................................................................................................................43
Resultant accretion & impact on ULVR .................................................................................................44 Implications on leverage and return ................................................................................................44 Earnings accretion & valuation .......................................................................................................44 Colgate not realistically do-able for cash without offsetting disposals............................................44 Towards a pure play HPC business ..................................................................................................44 Scenario impact on geographic mix ................................................................................................45 Puts combined entity on a potentially compelling valuation ...........................................................45 No ULVR disposals sensitivity analysis .............................................................................................46 Colgate plus ULVR Foods disposal sensitivity analysis .....................................................................47 Colgate plus ULVR Foods & Refreshment disposal sensitivity analysis ............................................48
CHANGES TO FORECASTS .................................................................................................................. 49 DIVISIONAL SALES & MARGIN DRIVERS ............................................................................................. 49 DETAILED FINANCIAL FORECASTS ...................................................................................................... 50
UNA NA
Target | Estimate Change
15 March 2017
page 2 of 56 , Equity Analyst, +44 (0) 20 7029 8670, [email protected] Deboo
Please see important disclosure information on pages 52 - 56 of this report.

Scenarios Summary
Summary of Scenarios
New stretch case is basis for published PT of €51.50 on a rounded basis
Scenario Previous
forecast
& PT
New
Stretch
case
Stretch case
plus
buyback
Spin out
Foods/Foods
& Refresh,
plus Special
Div
Buy Colgate
for cash - no
disposals
Buy Colgate -
with new
equity
Buy Colgate -
dispose
Foods
Buy Colgate -
dispose Foods
& Refresh
Key metrics,
events &
assumptions
As published
27 Jan
80bps pa
margin
progress to
FY19 (FY19
margin 17.6%)
As previous
plus Euro 6bn
pa buyback to
FY19 (net
debt:EBITDA
2.0x)
Foods and/or
Foods &
Refreshment
spun out.
€2.75 special
div.
Net
debt:EBITDA
post-deal of
5.1x
New ULVR
equity
equivalent to
13% of total.
Net debt:
EBITDA 4.0x
Sell Foods for
11x EBITDA
Sell Foods &
Refreshment for
13x EBITDA
NV EPS (Euros)
FY16A 188 188 188
FY17E 202 211 213
FY18E 222 234 244 213 297 275 240 234
FY19E 242 259 279
CAGR 19 vs. 16 9% 11% 14% n/a n/a n/a n/a n/a
Net debt:EBITDA1 0.8x 0.7x 1.8x 1.5x 5.1x 4.0x 3.8x 1.6x
Valuation metrics
Projected price
per NV share
44.00 51.60 50.89 48.50 55.98 54.84 53.00 53.75
EV:EBITDA 14.0x 15.0x 15.0x 16.2x 15.6x 15.6x 16.5x 16.6x
PER 19.8x 21.6x 20.4x 22.7x 18.9x 20.0x 22.1x 23.0x
FCF yield 4.2% 3.9% 4.0% n/a n/a n/a n/a n/a
Valuation metrics at current share price (prospective 12 mths basis)
EV:EBITDA 15.3x 14.6x 14.6x n/a n/a n/a n/a n/a
PER 22.5x 21.2x 20.9x n/a n/a n/a n/a n/a
FCF yield 4.0% 4.5% 4.5% n/a n/a n/a n/a n/a
Source: Jefferies analysis & estimates 1 FY18 basis for comparability. Colgate scenarios exclude synergies i.e. leverage is pro-forma peak immediately after acquisition
UNA NA
Target | Estimate Change
15 March 2017
page 3 of 56 , Equity Analyst, +44 (0) 20 7029 8670, [email protected] Deboo
Please see important disclosure information on pages 52 - 56 of this report.

A Wake-Up Call That Is Fundamentally
Good News for Investors ‘This has certainly been a trigger moment for Unilever and we will not waste it’
Graham Pitkethly, ULVR CFO
A profound shock…
We return to the Unilever (ULVR) beat, in anticipation of their strategic review due in April
and in profoundly altered circumstances to those prevailing prior to February 17, the day
when ULVR received an initial bid approach from Kraft Heinz (KHC).
Our bullishness on ULVR notwithstanding, it’s fair to say that a bid for the company
wasn’t on our radar, or was part of our Buy case. Nor, evidently, was it on ULVR’s radar
either. The shock – of being the subject of a bid of any kind, let alone one from such
arrivistes as KHC/3G (the horror, the horror) – will have been profound. And will no doubt
still be resonating around the walls of 100 Victoria Embankment (100VE), ULVR’s mighty
bastion on the banks of the Thames.
Any initial humiliation has been on the Kraft Heinz (KHC)/3G side. The collapse of their
approach within 48 short hours has left their reputation for sharp and persistent deal-
making and bear-hugging damaged. Their $50 per share offer looked less an invitation to
treat and more a piece of hastily-contrived opportunism. One that was a long way short
of what would have been required to engage shareholders. They would appear to have
under-estimated both ULVR’s strategic and economic significance in Europe and the likely
complexities of seizing control of a dual-listed entity, with strong roots in Holland, a
nation with a more muscular model of stakeholder capitalism than the UK. The fawning
obsequieties of KHC’s walk-away notice must have been painful to pen.
But neither has the experience been comfortable for ULVR either. Their reluctance to be
more aggressive towards their cost base had left their P&L dangerously vulnerable to
arbitrage from an alternative owner with radically different cultural norms and margin
aspirations. An unleveraged balance sheet meant that a less well-capitalised buyer could
contemplate acquiring control, by utilising ULVR’s own debt capacity. A diverse portfolio
left plenty of potential to reduce that debt with subsequent asset disposals.
…that is likely to inspire more radical and decisive action
KHC’s incursion will mean that all three of the above issues (which have all been germane
to the shareholder debate on ULVR in the decade that this analyst has covered the stock)
must now be re-addressed. Whatever conclusions are ultimately reached, this must surely
be both good and healthy.
Such dilemmas have conditioned this analyst’s views over the years. In September 2014
we were Sellers of ULVR on the grounds of frustration with slow progress on margins and
over-dependence on slowing Emerging Markets. In January 2016 we kicked the tyres on
ZBB and found the targets to be credible. But our confidence in the willingness to do the
hard yards on cost was wanting. In December 2016 we turned Buyers, predicated on
ULVR’s growing confidence in delivery a year down the track and a depressed stock price.
But we would be lying if we didn’t confess to feeling a certain tremulousness in our new
found conviction, something which the weak Q4 did little to dissipate.
A significant and valuable catalyst for change internally
ULVR now has precisely the catalyst it needed to shift the terms of debate internally and
align the culture with more radical action. This can and should be a firm-wide process.
The tendency at times like these is to see the actors in the drama as those on the Board
and ExComm. They will be the lead players, sure enough. But change and improvement
only washes through an organisation of 170,000 employees if there is buy-in to the goals
and imperatives at the middle and bottom of the organisation.
We return to ULVR post the KHC
approach
We think this will have been a
profound shock to ULVR
Any initial embarrassment was on
the KHC side
But the experience has highlighted
ULVR’s vulnerabilities too
We expect the event to prompt more
decisive action on costs and margins,
a recurring source of frustration for
us
UNA NA
Target | Estimate Change
15 March 2017
page 4 of 56 , Equity Analyst, +44 (0) 20 7029 8670, [email protected] Deboo
Please see important disclosure information on pages 52 - 56 of this report.

Prior to 17 February it’s conceivable that this buy-in wasn’t as strong as it might have
been. ULVR’s white collar troops were being realigned into the new Connected For
Growth (‘C4G’) organisational structure, which gelled as recently as last December. A
structure that demands new ways of working and different reporting lines. This on the
back of the long march from a region-led, to a category-led, organisation that has been
underway for the past decade and a half. On top of this has come Zero-Based Budgeting
(ZBB), a source of both incremental workload (all those tiresome task force meetings) and,
no doubt, some challenge to the level of individual perquisites that do so much to ease
the stresses of the working day. Down on the shop floor, it’s been only five years since
ULVR’s sizeable UK workforce were on strike over curtailed pension benefits.
Our sense has been that both C4G and ZBB have been placing additional burdens on an
already change-weary organisation. So they might be expected to encounter some
pushback. But now any recalcitrance has been met with a counterfactual and counter-
cultural vision of the most dramatic kind.
Ratings and feedback on ULVR & KHC from glassdoor.com corroborate the anecdotes that
have featured in the newspapers over the past two weeks. These are two companies that
couldn’t be more different in terms of internal cultural norms and morale.
Exhibit 1: ULVR vs. KHC employee feedback on glassdoor.com
ULVR KHC
Sample size 2,251 2,145
Would recommend to a friend 81% 29%
Approve of CEO 94% 28%
Positive Business Outlook 68% 26%
Satisfaction scores (where 5 is best)
Culture & values 4.0 2.2
Work/life balance 3.5 2.1
Senior Management 3.3 2.1
Compensation & benefits 3.5 2.9
Career Opportunities 3.5 2.7
Overall score 3.8 2.5
Trend in overall score Up Down
Source: glassdoor.com; Jefferies analysis
Exhibit 2: Verbatim reviews from glassdoor.com
ULVR KHC
Positive ‘Fantastic brands. Great People. Collaborative, friendly, culture.
International scale. High integrity. True to their sustainability
mission.'
‘People are great. Brands are strong. Opportunities to work across
departments and develop knowledge and skills in Grocery. Have
become more shopper-focussed over time.'
‘Beautiful office. Nice perks. Nice canteen. Exposure to senior
stakeholders. Systems generally work well. Professional atmosphere.
Prestigious company to work for.’
‘Fast growth opportunity. Lean structure. Easy to be noticed.’
‘Good work culture. Smart people.’ ‘Culture is very specific and not for everyone.’
Negative/critical ‘A huge company with all the complexity and politics you would
expect.’
‘The merger completely killed the culture of a great CPG company.’
‘Be prepared for plenty of structured processes and lots of
stakeholder management.’
‘An unsustainable business model…cutting costs to the point where
some functions barely run.’
‘The same English & Dutch ‘club’ that got us here may not be the
right one to take us to the next level.’
‘Haphazard leadership and dysfunctional culture. 3G mantra
inspirational in theory but in practice targets unachievable and
leadership style brutal - miss your number and you are exited, which
happens regularly.’
Source: glassdoor.com; Jefferies analysis
The value of the KHC approach as an
internal catalyst for change will have
been enormous
glassdoor.com ratings illuminate the
cultural divide
UNA NA
Target | Estimate Change
15 March 2017
page 5 of 56 , Equity Analyst, +44 (0) 20 7029 8670, [email protected] Deboo
Please see important disclosure information on pages 52 - 56 of this report.

The implication for the typical mid-level ULVR staffer is clear. Prior to February 17 he or
she was no doubt cavilling, as one might, over the level and pace of disruption to their
internal comfort zone that C4G and ZBB was requiring. Now they have been invited to
contemplate a fate worse than 10,000 deaths. The impact will be electrifying. Not since
the dark days of 2004/2005 will senior management have enjoyed such latitude to drive
change and raise the level of expectation. They must make the most of it.
Working back to April from three distinct end-games
So rather than focus on the April review in isolation, we think it’s appropriate to start by
outlining what we think are the long term strategic end games for ULVR. We then propose
to work back from there to what they might say in April. We think there are three such
end-games, per Exhibit 4.
We think these end games both gel the debates unfolding in the market as we write and
highlight the choices that need to be made by ULVR. As it happens we don’t think the
choices have fundamentally altered since February 17. But the urgency of confronting
them, and the need for decisive and credible action, has.
Exhibit 3: Potential strategic end-games for ULVR
Source: Jefferies
And so to ULVR’s April review. Investors are right to fixate on it and the sequential market
announcements made on 22nd February have raised the level of anticipation. But we
would urge investors to keep those expectations in check: ULVR in our experience is a
conservative company that is managed for long term value, in harness to a longer term
vision and purpose.
1. Optimise & bid-proof the broad status quo
2. Split the business3. Build a New World
Order in HPC
End games for ULVR
• Increased aggression on costs & margins
• Pursue enhanced cash returns
• Continue to reposition portfolio incrementally in favour of HPC, most obviously via a spin-out of Spreads
• Spin out the Foods business as a separate listing
• Buy Colgate (or RB as a secondary option)
• Fund via a sale or carve-out of Foods
Both these options incremental to (1)Question mark over Refreshment in both scenarios
Choices
Questions
• How much harder can margins be pushed?
• How big a cash distribution?
• What is there left to sell short of a complete exit from Foods?
• Would a split create net incremental value?
• Is Refreshment a keep or a spin?
• Is there a strategic logic?• Would a ‘megadeal’ create
value?• Is there a strategic buyer
for Foods/Refreshment?
Having contemplated a fate worse
than 10,000 deaths, ULVR’s body
politic should have been galvanised
We counsel a focus on the ultimate
end-game for ULVR, not just April’s
review
But we do think that the urgency of
resolving the ultimate end-game has
increased
UNA NA
Target | Estimate Change
15 March 2017
page 6 of 56 , Equity Analyst, +44 (0) 20 7029 8670, [email protected] Deboo
Please see important disclosure information on pages 52 - 56 of this report.

If that longer-term vision is, for example, to acquire a Colgate and build a New World
Order in HPC, then we think we are unlikely to see that unveiled in April. But, should it be
the vision, any announcements made in April mustn’t preclude it and must be consistent
with it. Otherwise ULVR will lay themselves open to the charge of precipitate behaviour
that was famously levelled at Cadbury in 2007, by senior fund manager Anthony Bolton,
as they took the decision to split their business in response to activist pressure.
Allowing for ULVR’s belief system
What end-game ULVR might choose is partly a function of analysis and hard-headed
calculation. But it will also be a function of the belief system that operates within ULVR,
one that we think reflects a strong sense of mission, inclines to scale and business
diversity, rather than focus, and which reflects strong fiscal conservatism. None of this is
to argue that ULVR won’t be feeling the need to change and evolve. But is to argue that
the choices will be carefully weighed, and that long-standing beliefs won’t be abrogated
by current exigencies. What we think of the belief system is essayed below.
Belief in the virtue of independence for its own sake. The vehemence of the
response to the KHC approach signals strongly that ULVR want to retain their
independence. Any company, performing basically well, and faced with a lowball offer,
would have responded similarly. But we sense that the desire to remain independent runs
deeper within ULVR than in most companies. Not, we would suggest, for venal or self-
seeking reasons amongst the current Board and Senior Management team. But because of
the sense of purpose and manifest destiny that arises from ULVR’s long history and deep
values. Much has been made over the past two weeks around the similarities with the
Cadbury take-out in 2009/10. But then Cadbury Chairman Roger Carr said at the outset
that the debate ‘would be about (shareholder) value, and only value.’ While Cadbury
fought hard and nobly for its independence, the implication was that the company was
always for sale at the right price. We question whether we will be hearing similar rhetoric
from ULVR Chairman Marijn Dekkers. The implication is that ULVR will be wary of moves,
most obviously a split, that would make it more vulnerable to takeover.
Belief in the value of multi-category scale and risk diversification. This analyst
has argued consistently that there are limited returns to multi-category scale in Developed
Markets with a strong, consolidated Modern Trade. The case will be argued again later in
this note. Your analyst was also taught at the London Business School that ‘investors can
diversify risk more cheaply and efficiently than managers.’ ULVR, by their actions and
commentary, would appear to dance to a different drum. We might not like the beat, but
we think that they are sincere in their adherence to it. The implication, similar to the point
above, is that ULVR will be relatively reluctant to shrink its portfolio too aggressively.
A ‘DCF’, rather than earnings, mindset. ULVR’s M&A culture, on both the sell and
buy-side of deals, reflects in our experience a strong mindset around value to the
company versus value to the acquirer/vendor, reflecting Discounted Cash Flow (DCF)
analysis. The most obvious example of this has been the apparent reluctance to
contemplate a sale of the Spreads business on the grounds that it is an important
generator of cash. The implication is that ULVR don’t, or won’t evaluate deals purely on
the basis of earnings accretion/dilution and will be relatively resistant to the sort of EPS
‘grandstanding’ that might arise from a return to buybacks of pursuit of ‘megadeals’ that
are light on strategic logic and economic synergy.
A conservative approach to the balance sheet. ULVR have struck a consistently
conservative tone on balance sheet management and CEO Paul Polman has voiced his
dislike of buybacks, despite almost continuous pressure from elements in the investment
community to adopt them (on which score this analyst agrees with ULVR). ULVR hasn’t
had a buyback programme in place since 2008 and net debt:EBITDA has been below 1x
for more than 50% of the time over the past twenty years. This is not so say that ULVR
won’t gear up for the right big acquisition (they were briefly >3x net debt:EBITDA post-
Bestfoods in November 2000) or that they won’t consider buybacks as a defensive
response to a bid. But we think they will weigh carefully the risks as well as the benefits.
ULVR need to avoid seeming
precipitate or reactive
UNA NA
Target | Estimate Change
15 March 2017
page 7 of 56 , Equity Analyst, +44 (0) 20 7029 8670, [email protected] Deboo
Please see important disclosure information on pages 52 - 56 of this report.

Value on the table, despite raised bar Shares up by 15%/20% since the approach
The previous section has argued that KHC’s intervention has been unequivocally good
news for ULVR shareholders. The complication is that the good news is directionally in the
price, with the NV and PLC listings up 15% and 20% respectively relative to the close on
16 February. Relative to which we are upgrading our FY17 forecasts by c.5% to reflect
both the margin guidance upgrade of 22 February and slightly better fx.
Exhibit 4: ULVR NV forecasts & valuation pre- & post-KHC
As at 13 March. Prospective 12 mths. basis. Now reflects fx & 22 Feb guidance upgrade
16 Feb Now
NV share price €39.57c €45.60c
Market value
Market cap €110275m €129490m
Net debt (end FY17) €10511m €10230m
IAS19 deficit (end FY17) €2902m €2902m
Gross EV €123688m €142622m
Less JV's & Associates at fair value (€3283m) (€3100m)
Add non-controlling interests at fair value €16391m €16311m
Adjusted EV (for EV:EBITDA purposes) €136796m €155833m
Forecast metrics (NTM basis)
EBITDA €10073m €10546m
EPS €202.5c €214.3c
DPS €132.3c €134.9c
FCF per share €183.0c €202.0c
Valuations (NTM basis)
EV:EBITDA 13.6x 14.8x
PER 19.5x 21.3x
Dividend yield 3.3% 3.0%
FCF yield 4.6% 4.4%
Source: FactSet; Jefferies analysis
Raises the bar to additional value creation relative to undisturbed price
The impact has been to add more than a turn to ULVR’s Enterprise multiple, nearly two
turns to PER and to reduce both dividend & FCF yield by 20-30bps. So any contemplation
of what might be on the table in April needs to be compared to this higher hurdle.
Or should it? The counter-argument, advanced by some in the market, and ULVR
themselves at CAGNY the other week, is that the valuation immediately prior to KHC was
at some sort of unreasonable trough. Indeed, at that point, the NV share price had come
down by 7% from its 12 month high (achieved in early September 2016) of €42.70. This
equated to a PER of 22.4x, relative to only 19.5x on 16 February.
We’re not persuaded by this argument (of unreasonableness), for a couple of reasons.
First, almost all of ULVR’s share price decline was a function of the defensive counter-
rotation that occurred in October and November 2016: ULVR’s share price relative to the
SX3P (EuroStoxx Food & Beverage index) barely moved from early September to February
161. Second, the price on 16 February was the price of what is a well-researched and well-
understood stock. Sure we might have disagreed with it, having a Buy recommendation
and a then price target of €44. But that was just one opinion, in an efficient market.
1 ULVR fell by 3-4% relative to the SX3P on the weak Q4 on 26 January. This loss had been
regained by Feb 16, reflecting we think the subsequent weak Q4 across the sector
The NV & PLC listings are up 15% &
20% since 16 Feb
This has added more than 1 turn of
EBITDA & nearly 2 turns of PER to
valuation
We are not persuaded by the
argument that ULVR was
anomalously cheap on 16 Feb
UNA NA
Target | Estimate Change
15 March 2017
page 8 of 56 , Equity Analyst, +44 (0) 20 7029 8670, [email protected] Deboo
Please see important disclosure information on pages 52 - 56 of this report.

Exhibit 5: PER vs. EPS growth
Prospective 12-24 months1, per consensus. As at 9 March
Source: FactSet; Jefferies analysis 1 EPS growth is 12-24 mths out (‘2TM’) to minimise fx distortions
Exhibit 6: PER vs. organic sales growth
Prospective 12 months, per consensus. As at 9 March
Source: FactSet; Jefferies analysis
Exhibit 7: EV:EBITDA vs. organic profit growth
Prospective 12 mths., per consensus. Adjusted for JV’s & minorities
Source: FactSet; Jefferies analysis
Exhibit 8: EV: operating cashflow vs. organic profit growth
Prospective 12 mths., per consensus. Adjusted for JV’s & minorities
Source: FactSet; Jefferies analysis
Exhibit 9: EPS growth vs. FCF yield
Prospective 12 months, per consensus. As at 9 March
Source: FactSet; Jefferies analysis
DGE
RI
BFI
RCO
BATS
PMIMO
RAI
ULVR - consNESN
BN
RBPG
CLOR
HEN3
BEI
ABI
HEIA
CARL.B
ULVR - JEFe
16.0x
18.0x
20.0x
22.0x
24.0x
26.0x
28.0x
30.0x
6% 8% 10% 12% 14%
PE
R
EPS growth in reporting currency
DGE
RI
BFI
RCO
BATS
IMB
PMI
MORAI
ULVR - consNESN
BN
RBPG
CL
OR
HEN3
BEI
ABI
HEIACARL.B
ULVR - JEFe
12.0x
14.0x
16.0x
18.0x
20.0x
22.0x
24.0x
26.0x
28.0x
30.0x
0% 2% 4% 6%
PE
R
Organic sales growth
DGERI
BFI RCO
IMB
PMIMO
RAIULVR - cons
NESN BN
RBPG
CL
OR
HEN3
BEIABI
HEIA
CARL.B
ULVR - JEFe
8.0x
10.0x
12.0x
14.0x
16.0x
18.0x
20.0x
0% 2% 4% 6% 8% 10% 12%
Ad
just
ed
EV
:EB
ITD
A
Organic profit growth next 12 mths.
DGE
RI
BFI
IMB
PMI
MO
RAI
ULVR - cons
NESN
BN
RBPG
CLOR
HEN3
BEI
ABI
HEIA
CARL.B
ULVR - JEFe
10.0x
15.0x
20.0x
25.0x
30.0x
35.0x
40.0x
45.0x
0% 2% 4% 6% 8% 10% 12%EV
: o
pe
rati
ng
ca
shfl
ow
po
st c
ap
ex
& t
ax
Organic profit growth next 12 mths.
DGE
RI
BFI
RCO
BATS
IMB
PMI
MO
RAI
ULVR - consNESN
BN
RBPG
CLOR
HEN3
BEI
ABIHEIA
CARL.B
ULVR - JEFe
2.0%
2.5%
3.0%
3.5%
4.0%
4.5%
5.0%
5.5%
6.0%
6.5%
7.0%
4% 5% 6% 7% 8% 9% 10% 11% 12% 13% 14%
FC
F y
ield
EPS growth in reporting currency
UNA NA
Target | Estimate Change
15 March 2017
page 9 of 56 , Equity Analyst, +44 (0) 20 7029 8670, [email protected] Deboo
Please see important disclosure information on pages 52 - 56 of this report.
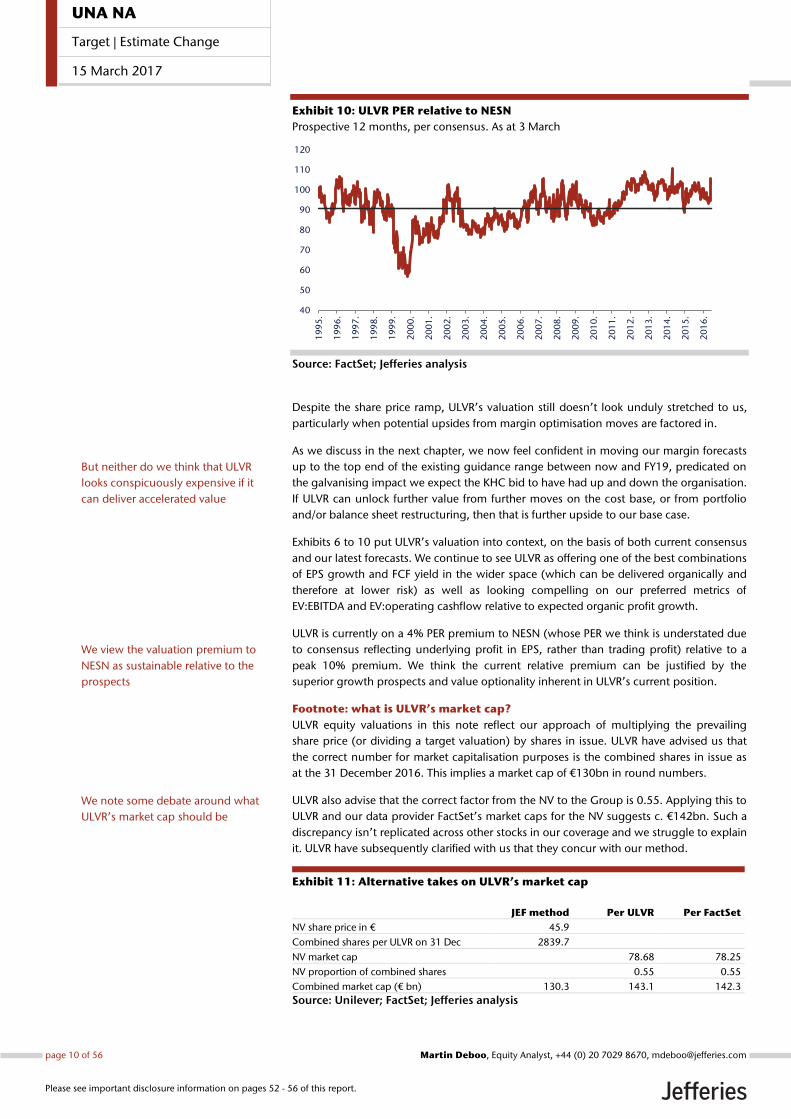
Exhibit 10: ULVR PER relative to NESN
Prospective 12 months, per consensus. As at 3 March
Source: FactSet; Jefferies analysis
Despite the share price ramp, ULVR’s valuation still doesn’t look unduly stretched to us,
particularly when potential upsides from margin optimisation moves are factored in.
As we discuss in the next chapter, we now feel confident in moving our margin forecasts
up to the top end of the existing guidance range between now and FY19, predicated on
the galvanising impact we expect the KHC bid to have had up and down the organisation.
If ULVR can unlock further value from further moves on the cost base, or from portfolio
and/or balance sheet restructuring, then that is further upside to our base case.
Exhibits 6 to 10 put ULVR’s valuation into context, on the basis of both current consensus
and our latest forecasts. We continue to see ULVR as offering one of the best combinations
of EPS growth and FCF yield in the wider space (which can be delivered organically and
therefore at lower risk) as well as looking compelling on our preferred metrics of
EV:EBITDA and EV:operating cashflow relative to expected organic profit growth.
ULVR is currently on a 4% PER premium to NESN (whose PER we think is understated due
to consensus reflecting underlying profit in EPS, rather than trading profit) relative to a
peak 10% premium. We think the current relative premium can be justified by the
superior growth prospects and value optionality inherent in ULVR’s current position.
Footnote: what is ULVR’s market cap?
ULVR equity valuations in this note reflect our approach of multiplying the prevailing
share price (or dividing a target valuation) by shares in issue. ULVR have advised us that
the correct number for market capitalisation purposes is the combined shares in issue as
at the 31 December 2016. This implies a market cap of €130bn in round numbers.
ULVR also advise that the correct factor from the NV to the Group is 0.55. Applying this to
ULVR and our data provider FactSet’s market caps for the NV suggests c. €142bn. Such a
discrepancy isn’t replicated across other stocks in our coverage and we struggle to explain
it. ULVR have subsequently clarified with us that they concur with our method.
Exhibit 11: Alternative takes on ULVR’s market cap
JEF method Per ULVR Per FactSet
NV share price in € 45.9
Combined shares per ULVR on 31 Dec 2839.7
NV market cap 78.68 78.25
NV proportion of combined shares 0.55 0.55
Combined market cap (€ bn) 130.3 143.1 142.3
Source: Unilever; FactSet; Jefferies analysis
40
50
60
70
80
90
100
110
120
19
95
.
19
96
.
19
97
.
19
98
.
19
99
.
20
00
.
20
01
.
20
02
.
20
03
.
20
04
.
20
05
.
20
06
.
20
07
.
20
08
.
20
09
.
20
10
.
20
11
.
20
12
.
20
13
.
20
14
.
20
15
.
20
16
.
But neither do we think that ULVR
looks conspicuously expensive if it
can deliver accelerated value
We view the valuation premium to
NESN as sustainable relative to the
prospects
We note some debate around what
ULVR’s market cap should be
UNA NA
Target | Estimate Change
15 March 2017
page 10 of 56 , Equity Analyst, +44 (0) 20 7029 8670, [email protected] Deboo
Please see important disclosure information on pages 52 - 56 of this report.

Moving to the top end of margin
guidance. But cautious beyond that
ULVR’s cost base: myth and reality ULVR is a fat, complacent, high-cost organisation isn’t it? Why the evidence is there for all
to see: Its monumental Thames-side gaff at 100 Victoria Embankment, nearly half of which
is an atrium, all indulgent thin air funded at Prime London rental rates. Not to mention its
multi-£millions renovation in the mid-noughties, courtesy of en vogue architectural
hotshot Kohn Pederson Fox. And don’t even get us started on the lavish Four Acres
‘Leadership Development Facility’ in Singapore (what was wrong with a bulk discount at
Insead?), opened at a cost of €50m in 2013.
In contrast Reckitt Benckiser make do with a nondescript 80s block at the wrong end of
Slough, while bêtes noires Kraft Heinz have moved their people out of a glossy out-of-
town campus into five open plan floors in a downtown skyscraper. Why, something must
be done to control ULVR’s largesse, angry investors might say (and do).
Well yes and no. We’d by lying if, like many, we didn’t admit to a few twinges of cynicism
and wonderment as we have toured the various demesnes of ULVR’s global empire over
the past few years. But going the other way is that ULVR is a big global business, one that
benefits from significant economies of scale in SG&A. It is a business engaged in a global
war for talent and one that believes in treating its people with care and respect, in the
interests of their longer-term wellbeing and ability to perform. And ULVR are far from the
only multinational to feel the need to erect the occasional symbol to their greatness,
including one or two investment banks we could mention.
So any debate on the cost reduction potential available to ULVR needs to stay rooted in
the facts and the analysis, not the comforting mythology. So let’s go there now.
SG&A efficiency not best-in-class, but not dramatically out-of-line of either Let’s commence at the logical starting point of Selling, General & Admin (SG&A) cost as a
percentage of sales, which is the heart of the debate about the ‘3G’ versus ‘ULVR’ way of
doing things. Exhibit 13 analyses this ratio for the usual suspect large consumer
multinationals, including ULVR. The analysis is complicated by different approaches to
cost (particularly distribution cost) allocation. However we believe that the ratios for the
key comparators of ULVR, RB, KHC & Nestle (NESN) are comparable.
The immediately striking thing about Exhibit 13 is that there is no evidence of returns to
scale in SG&A. The relative cheapskates, RB, are the smallest company in the sample while
the biggest, company, NESN, sports a relatively high ratio. We suspect that Colgate &
P&G’s ratio might include distribution costs, which typically run at 5 to 10% of sales2. We
think the lack of the intuitive inverse correlation is partly because of differences in culture
but also because Food companies have a lower sales value per unit (and hence higher
SG&A as a percentage) than HPC ones.
ULVR runs on an SG&A:sales ratio of 13%, relative to the best-in-class benchmark of RB, at
8%, which is of course a much smaller player, albeit an HPC (and Health) one. The two
‘3G’ players, KHC and ABI, run on about 10% SG&A to sales, although we can’t be sure in
KHC’s case whether this includes an element of distribution cost.
2 We have been unable to validate this from 10-K disclosures for P&G and Colgate
There is plenty of mythology in the
market around ULVR’s purported
high cost base…
..which sits in contrast to the likes of
RB and of course KHC
But we urge a focus on the facts of
efficiency, not the myths
We focus on SG&A cost, the
heartland of any ZBB programme
There is little compelling evidence of
returns to scale in SG&A across large
staples players
ULVR runs a higher SG&A ratio than
best-in-class, but is also far from
worst-in-class
UNA NA
Target | Estimate Change
15 March 2017
page 11 of 56 , Equity Analyst, +44 (0) 20 7029 8670, [email protected] Deboo
Please see important disclosure information on pages 52 - 56 of this report.

Exhibit 12: SG&A costs as a percentage of sales, relative to overall scale
Based on the most recent reported financial year with detailed cost disclosure
Source: Company data; Jefferies analysis Note: In some cases SG&A to sales has been calculated by derivation from gross margin, operating margin and A&P to sales. The picture is complicated by the fact that definitions of gross margin differ, particularly around where and how distribution costs are accounted for. But we think the ratios for ULVR, RB, DGE & NESN are comparable. NESN’s ratio rests on an assumption of A&P:sales of 7%,which is not disclosed and is our estimate
So the facts would suggest that there is potential for ULVR to make savings in SG&A.
Given its scale, we would have thought that a high single digit percentage of sales should
be attainable, equivalent to a reduction of at least 30% from current levels. Whether ULVR
want to deliver this is a question primarily of their appetite. Let’s return to that below.
But progress on SG&A reduction limited to date Our long-standing critique of ULVR has been that operating margins haven’t progressed
as strongly as we would like, relative to what has been achieved by best-performing peers
and the imperative to buttress weak top line with compensating improvement in margin.
In fairness to ULVR, the rate of progress has improved, with the five year average
improving from 18bps in 2013, to 21bps in 2014 and 36 bps now. This has been driven
by two years of above-trend improvement in 2015 & 2016. However these have arguably
been relatively ‘easy’ years, where input cost pressures have been subdued and US
players have been obliged to take a benign pricing stance given adverse $ fx.
Exhibit 13: Average progress in adjusted/core operating margins
In basis points. Most recent five financial years. At actual fx
Source: Company data; Jefferies analysis
NESN
ULVR
RB
CL
PG
ABIKHC
DGE
0%
5%
10%
15%
20%
25%
30%
0 10 20 30 40 50 60 70 80 90 100S
G&
A %
of
sale
s
Sales (USDbn)
119
74
36
126
(5)
RB CL ULVR NESN PG Danone
While margin progression has
accelerated, ULVR remains middle of
our performance table
UNA NA
Target | Estimate Change
15 March 2017
page 12 of 56 , Equity Analyst, +44 (0) 20 7029 8670, [email protected] Deboo
Please see important disclosure information on pages 52 - 56 of this report.

So ULVR still remains #3 in our table, albeit now ahead of NESN. RB and Colgate have
higher base margins, but it remains the case that RB’s 120bps of progress and Colgate’s
75bps amount to an incremental one to two points faster earnings growth over five years.
Turning to the principal moving parts of core margin, namely gross margin, SG&A and
Brand & Marketing Investment (BMI) it can be seen that ULVR’s operating margin
progress has come solely from improvement in gross margin. BMI was increasing as a
percentage of sales prior to 2016, while SG&A started to climb again in 2015 & 2016,
having fallen in the two years prior to that. While this was partly due to adverse fx on
SG&A in 2015, it’s hard to argue that ULVR have taken really decisive action on its SG&A
base prior to the unveiling of Zero-Based Budgeting (‘ZBB’) in December 2015.
Exhibit 14: ULVR margin moving parts since 2004
% of sales
Source: Unilever; Jefferies analysis 1 Gross margin prior to 2010 includes distribution & selling costs to improve comparability to post-2010 margin. SG&A prior to 2010 is Admin Expenses per old ULVR reporting
UK case study: steady work in a mature market
There is a lot going on in ULVR’s global SG&A cost line. So in order to undertake a
‘cleaner’ analysis, in a single market, we have drilled down in the UK. This has been
possible because ULVR’s UK trading entity, Unilever UK Ltd, files annual returns.
The UK is ULVR’s fourth biggest market worldwide (behind the USA, Brazil and India) and
is its largest European market by some margin. The business was extensively re-organised
in 2007-2009, when three operating companies headquartered respectively in Kingston-
upon-Thames (Home and Personal Care), Crawley (Foods) and Walton-on-Thames (Ice
Cream) were amalgamated into one new Head Office at Leatherhead, Surrey, under the
auspices of then Chairman in the UK, Dave Lewis. Lewis offered extensive disclosures at
the 2008 Investor Seminar at Port Sunlight to the effect that the move to Leatherhead was
facilitating extensive overhead reduction following a detailed cost benchmarking study.
This is apparent in the data. Ignoring the transitional year of 2007 (Unilever UK was
formed only in the middle of 2007), the business started life with close to 4400 heads in
2008, including nearly 600 in admin. By 2014 this had been reduced to under 4000
heads, despite 20% cumulative organic growth in the intervening years and the
integration of the acquired Alberto Culver and Sara Lee businesses in 2010 /2011. Sales
per employee accordingly rose, by c.3% pa between 2008 and 2014. Headcount fell
further in 2015 but this reflected in part the carve-out the Baking, Cooking and Spreads
(BCS) Company into a separate entity in April 2015, with close to 200 associated heads.
41.0%38.9% 39.8% 40.0%
38.4% 39.5%41.5%
39.9% 40.5% 41.6% 41.4% 42.2% 42.7%
13.7%
11.4%
12.5% 12.4% 11.4%11.5% 14.2% 13.3%
12.5% 12.7% 12.1% 12.4% 12.7%11.7%
12.8%
13.1% 13.2% 12.5% 13.3% 13.7% 13.1%
14.2% 14.8% 14.8% 15.0% 14.7%
0.0%
5.0%
10.0%
15.0%
20.0%
25.0%
30.0%
35.0%
40.0%
45.0%
2004 2005 2006 2007 2008 2009 2010 2011 2012 2013 2014 2015 2016
Gross margin SG&A BEI
New 'core profit' definitionOld definition
Operating margin progress has
come from GM, not SG&A
We case study the UK in more
detail…
…where overheads were extensively
rationalised in 2007-2009
UK headcount has fallen consistently
despite rising sales
UNA NA
Target | Estimate Change
15 March 2017
page 13 of 56 , Equity Analyst, +44 (0) 20 7029 8670, [email protected] Deboo
Please see important disclosure information on pages 52 - 56 of this report.

Like many of ULVR’s Developed Market businesses, UK sales slowed markedly in 2014 &
2015 as demand remained subdued and commodity inflation cycled out. Margins fell by
several percentage points to c.4%.3
Exhibit 15: ULVR UK LFL sales growth
Source: Unilever; Jefferies analysis Note: 2008 to 2012 is as disclosed in Companies House accounts. 2013 & 2014 is based change in domestic sales. 2015 is based on change in continuing ops sales ex BCS
Exhibit 16: ULVR UK adjusted operating margin
Source: Unilever; Jefferies analysis
Exhibit 17: ULVR UK headcount
Source: Unilever; Jefferies analysis
Exhibit 18: ULVR UK admin costs to sales ratio
Source: Unilever; Jefferies analysis
Behind the scenes, admin costs as a percentage of sales fell consistently from 2009 to
2012, reflecting, we assume, efficiencies. Since 2012 they have stayed fairly constant as a
percentage of sales, despite tough conditions4.
So we find both positive and negative messages from our UK case study. On the positive
side, SG&A has flatlined as a percentage of sales in recent years. This suggests potential
for improvement, facilitated by ZBB and new C4G ways of working. On the other hand it
might suggest that ULVR have already maxed out on SG&A efficiencies, having
undertaken a de facto ZBB exercise in 2007-2009, facilitated by a move to a greenfield
site.
3 We don’t consider the absolute level of operating margin for ULVR UK to be meaningful,
reflecting as it does transfer pricing in from ULVR’s Unilever Supply Chain Company AG
(‘USCC’). We do however assume the margin trend to be meaningful 4 We can’t explain the fall in admin heads and costs that occurred in 2013.
-1%
0%
1%
2%
3%
4%
5%
2008 2009 2010 2011 2012 2013 2014 2015
0%
1%
2%
3%
4%
5%
6%
7%
8%
9%
10%
2007 2008 2009 2010 2011 2012 2013 2014 2015
2101 2277 2065 2064 2230 2245 2157 2061 1895
1018
15371621 1585
1685 1698 15811409
1279
715
573397 336
395 397329
356351
2007 2008 2009 2010 2011 2012 2013 2014 2015
Production Marketing & Selling Admin0%
2%
4%
6%
8%
10%
12%
14%
16%
18%
20%
2007 2008 2009 2010 2011 2012 2013 2014 2015
UK SG&A:sales fell from 2009-2012,
but have flatlined since
We think our UK case study signals
renewed potential for improvement
UNA NA
Target | Estimate Change
15 March 2017
page 14 of 56 , Equity Analyst, +44 (0) 20 7029 8670, [email protected] Deboo
Please see important disclosure information on pages 52 - 56 of this report.

Seeing margin progress beyond upper bound of current guidance as a challenge To advance the analysis, and the argument, we return to and refresh some detailed
analysis at the Group level that we undertook initially in January 2016, as we appraised
ZBB for the first time. We have updated this analysis for the FY16 out-turn and firmer
guidance commentary given at last December’s Port Sunlight seminar.
We continue to probe the upsides on margin through two complementary perspectives:
Bottom up, in terms of the structure of the current cost base and the relative
aggression of the current ZBB savings programme in this context
Top down, in terms of the evolving mix of categories, peer group benchmarks
in these categories and ULVR’s track record on margin progression
A re-review of this analysis leads us to stick to our conclusion that progress beyond the
upper bound of current 3 year guidance of between 40bps and 80bps will be challenging
for ULVR. This implies a terminal (FY19) margin of between 17.5% and 18.0%.
Let’s start by looking bottom up, at ULVR’s cost base by line item. As we have already
observed above, ULVR has a generally good record on gross margins (GM’s) to date as a
result of ongoing gross supply chain savings in the €1bn+ range, structural change in the
portfolio in favour of higher GM HPC and incremental ‘maxing the mix’ initiatives at sub-
category level.
ZBB programme suitably aggressive
So the focus of the current ZBB programme has been the SG&A cost base. The core of this
is the €5.7bn or so of ‘pure’ SG&A cost (essentially white collar staff functions and
associated overhead such as property and IT costs). Also in scope for ZBB will be R&D cost
of around €1bn and the ‘non-working media’ (how this analyst’s former advertising
colleagues hate that term) component of Brand & Marketing Investment (BMI). We think
this will be around 20% of total BMI spend of €7.7bn, say around €1.5bn. So there is
around €8bn of total cost in-scope for the ZBB programme.
Exhibit 19: ULVR’s cost base by component
Based on FY16A
Source: Unilever; Jefferies analysis
€52.7bn
€21.1bn
€1.5bn
€7.6bn
€7.7bn
€1.0bn
€5.7bn
€8.0bn
Sales Raw & Pack D&A Oth. COGs BMI R&D SG&A Core Profit
40% 3% 14% 15% 2% 11% 15%% sales
€1bn+ ZBB goal as % of:Sales: 200-250bps
All costs: 250-300bpsSG&A costs: 20-25%
We review and refresh our integrated
analysis of margins from 2016
We think that progress on a 3 year
view above the top end of current
guidance will be tough to achieve
The €1bn+ ZBB target needs to come
out of a c.€8bn target cost base
UNA NA
Target | Estimate Change
15 March 2017
page 15 of 56 , Equity Analyst, +44 (0) 20 7029 8670, [email protected] Deboo
Please see important disclosure information on pages 52 - 56 of this report.

ULVR’s delivery partner in ZBB, consulting firm Accenture, cite savings of between 10%
and 40% of SG&A cost from ZBB, depending on line item. They claim resultant
improvements in EBITDA of between 25% to 50%.
Exhibit 20: Accenture’s view of potential ZBB savings
Source: Accenture: ‘Closed Loop Cost Management’
ULVR’s implied ZBB target of 20 to 25% of SG&A cost looks suitably aggressive to us in
this context. It’s well in the mid-range of Accenture’s claims. And while it implies a much
lower improvement in EBITDA than Accenture claim (c.10%, even if all the savings go to
the bottom line) that calculation depends acutely on what starting point SG&A:sales and
EBITDA margins are.
ULVR’s consistent commentary on ZBB has been to the effect that it’s not a ‘full on’ 3G
style programme and is instead targeted at looking at cost more insightfully and creatively
in a way that inspires better ways of working, not just cost savings. We have also opined
that ULVR won’t want to fracture their internal ‘social contract’ with white collar staff such
as would occur if an ultra-aggressive programme was instituted. Some will argue that this
calculation has altered fundamentally since February 17. We are not so sure: ULVR have
many levers to pull to unlock value, of which ZBB is just one.
Not a conspicuously under-earning business relative to mix
A complementary top-down analysis reinforces our caution around margin progress
going beyond the upper bound of current guidance. Our core argument is that, contrary
to myth, ULVR is not a conspicuously under-earning business relative to its mix of
categories, geographic exposures and competitive challenges.
Exhibit 22 compares operating margins across the broad peer group. ULVR is a mid-table
player in a peer group that tends to have large multinational HPC businesses at the high
end and a mix of smaller multinational HPC’s and local Food businesses at the low end.
The reality is that ULVR is a hybrid Foods & HPC business with characteristics of both
groupings. It is also a business more heavily exposed to Emerging Markets than most,
where peer margins tend to be lower and the need to invest is higher.
ULVR’s ZBB goal looks suitably
stretching relative to partner
Accenture’s benchmarks…
…particularly when the nature of
ULVR’s ‘social contract’ with its staff
is factored in
We stick to our view that ULVR isn’t
an under-earning business relative to
its mix
UNA NA
Target | Estimate Change
15 March 2017
page 16 of 56 , Equity Analyst, +44 (0) 20 7029 8670, [email protected] Deboo
Please see important disclosure information on pages 52 - 56 of this report.

Exhibit 21: Peer group operating margins in broadly comparable business to Unilever
FY16 for ULVR, NESN & KHC. Latest reported FY for peers. Reflects margins in broadly comparable businesses to ULVR (see notes)
Source: Companies; Jefferies analysis & estimates Notes 1. Danone excludes Medical Nutrition, 2. Edgewell excludes Wet Shave, 3. Henkel excludes adhesives, 4. Kao excludes Speciality Chemicals & Health Care, 5. L’Oreal excludes Body Shop
We frame the debate by looking at ULVR’s mix of sales by region and category (Exhibit 23)
and our estimates of margins in each region/category (Exhibit 24). This reveals that ULVR
tends to have some mature businesses earning exceptionally high margins (e.g. Spreads
in Europe) and some growth businesses earning much lower ones (e.g. the nascent parts
of the Home Care and Refreshment empire). Advancing margins via category mix and
margin improvement is therefore a non-trivial challenge.
Exhibit 22: ULVR sales value map by geography & category
Chart areas proportionate to sales in €bn at ULVR selling prices. Estimated, consistent with FY16A totals
Source: Jefferies analysis & estimates
ULVR Predominantly HPC Predominantly Foods
0.0
42
5.5
% 7.7
%
8.5
% 11
.3%
11
.9%
12
.0%
12
.2%
12
.9%
13
.3%
13
.3%
13
.9%
14
.0%
14
.8%
14
.8%
15
.3%
15
.3%
15
.5%
15
.8%
17
.1%
17
.2% 20
.5%
21
.9%
24
.0%
24
.7%
1.50.3
2.51.3 3.7 0.8
2.1
1.0 5.2
3.2
1.5
6.2
1.01.7
0.6
2.1
1.1
1.2
2.3
1.04.3
0.41.1
0.41.2
1.8 0.41.0 0.3 0.8 0.7
0.1 0.1 0.1 Spreads€2.9bn
Other Foods€9.6bn
Refreshment€10.0bn
Personal Care€20.2bn
Home Care€10.0bn
W. Europe€10.7bn
NorthAm€9.1bn
LatAm€8.0bn
Emerging Asia€14.0bn
AME€3.2bn
CEE€2.5bn
Dev Asia€5.3bn
Total€52.7bn
We explore the question of a fair rate
of margin starting with the current
sales and margin mix
UNA NA
Target | Estimate Change
15 March 2017
page 17 of 56 , Equity Analyst, +44 (0) 20 7029 8670, [email protected] Deboo
Please see important disclosure information on pages 52 - 56 of this report.

Exhibit 23: ULVR estimated margins by geography & category
Estimated, consistent with FY16A. Chart areas proportionate to sales. Omits margin estimates for segments with low materiality
Source: Jefferies analysis & estimates
Exhibits 25-30 look at ULVR margins relative to peers in related categories and
geographies. This supports the thesis that ULVR aren’t conspicuously under-margined:
Margins in Foods are upper quartile (Spreads margins are even higher). Ditto Personal
Care. Home Care margins are low and therefore a big source of upside. Refreshment
wants for benchmarks but probably also has upside. Emerging Market and Europe
margins are average and North American margins are low end. But much depends on
category mix in the market and overall local scale.
Spreadsc.19%
Other Foodsc.17.5%
Refreshment9.9%
Personal Care19.1%
Home Care9.7%
W. Europec.16%
NorthAmc.16%
LatAmc.15%
Emerging Asiac.16%
AMEc.10%
CEEc.12%
Dev. Asiac.16%
c.8%
c.19%
c.11%
c.19%
c.19%
c.12%
c.10%
c.11%
c.17%
c.11%
c.11%
c.10%
c.8%
c.15%
c.7%
Group15.3%
c.20%
c.20%
c.21%
c.18%
c.19%
c.8%
c.18%
c.10%
c.20% c.20%
Margins are peer superior or peer
comparable ex Home Care
UNA NA
Target | Estimate Change
15 March 2017
page 18 of 56 , Equity Analyst, +44 (0) 20 7029 8670, [email protected] Deboo
Please see important disclosure information on pages 52 - 56 of this report.

Exhibit 24: Peer margins in Foods ex. Spreads
Source: Companies; Jefferies analysis & estimates Note: ULVR is estimated. NESN is underlying, not trading, margin
Exhibit 25: Peer margins in Personal Care
Source: Companies; Jefferies analysis & estimates Note: RB is estimated excluding Foods & Healthcare
Exhibit 26: Peer margins in Home Care
Source: Companies; Jefferies analysis & estimates Note: RB includes some Personal Care businesses
Exhibit 27: Peer margins in North America
Source: Companies; Jefferies analysis & estimates Note: RB is Europe & North America combined
Exhibit 28: Peer margins in Europe
Source: Companies; Jefferies analysis & estimates Note: RB is Europe & North America combined
Exhibit 29: Peer Margins in Emerging Markets
Source: Companies; Jefferies analysis & estimates Note: ULVR is estimated. Peer margins reflect either overall EM averages or reported margins from LatAm, Asia or Africa
This top down analysis corroborates some of our caution from the ZBB perspectives and
leads us to question whether ULVR can put any more margin guidance on the table than
they already are.
5.5%
8.5%
11.3%
12.0%
12.2%
14.8%
17.1%
17.2%
17.5%
18.6%
22.1%
24.0%
26.9%
Bimbo
Tingyi
Mondelez
Brasil Foods
Danone
Campbells
Premier Foods
Gen. Mills
Unilever
Nestle
Heinz
Kraft
RB
4.2%
7.7%
9.7%
11.9%
13.3%
13.9%
14.0%
14.8%
15.3%
16.8%
19.1%
20.5%
21.2%
Shisheido
Oriflame
Kao
Beiersdorf
Johnson Johnson
Natura
PZ Cussons
Edgewell
Henkel
P&G
Unilever
L'Oreal
RB
9.7%
16.2%
16.4%
18.8%
21.2%
Unilever
Henkel
P&G
Kao
RB
8.6%
14.8%
16.0%
20.6%
26.0%
27.2%
28.2%
Danone
Campbells
Unilever
Gen. Mills
Kraft
Colgate
RB
12.7%
14.9%
15.3%
15.7%
16.0%
17.1%
22.0%
23.3%
25.5%
28.2%
Mondelez
Dairy Crest
Nestle
Danone
Unilever
Premier Foods
PZ Cussons
Colgate
Heinz
RB
8.4%
8.5%
10.8%
11.6%
12.9%
13.9%
14.0%
18.7%
19.8%
24.0%
Mondelez
Tingyi
Bimbo
Danone
Brasil Foods
Heinz
Unilever
Nestle
RB
Colgate
UNA NA
Target | Estimate Change
15 March 2017
page 19 of 56 , Equity Analyst, +44 (0) 20 7029 8670, [email protected] Deboo
Please see important disclosure information on pages 52 - 56 of this report.

Upgrading stand-alone forecasts to the top end of guidance range. Modelling a return to Buybacks Upgrading margin forecasts to the top end of the current guidance range
We now integrate these perspectives to inform a new forecast. The increase in FY17
guidance is a clear signal that ULVR plan to accelerate capture of ZBB savings and, we
suspect, increase the retention rate on those savings. We expect this to drive an
accelerated rate of margin progress beyond FY17, with the biggest gains being made in
the under-margined categories of Home Care and Refreshment. This gives us confidence
that ULVR can continue to bat at the upper end of the 40-80bps guidance range.
But not beyond it, in our view. Exhibit 31 highlights the extent of the challenge.
On the upside, we assume that Home Care can continue to grow margins at close to its
recent and high rate of 150-200bps. This projects an FY19 margin of 14.9%, which we see
as directionally consistent with Home Care EVP Nitin Paranjpe’s assertion at Port Sunlight
to the effect that he saw no reason why Home Care margins couldn’t exceed the group
average at some point in the future. Our FY19 forecast assumes that they achieve the
current group average (more or less) in three years.
We also assume accelerated margin progress in Refreshment (Ice Cream and Tea).
Consistent margin progress has been made in the past two and a half years and ULVR
seem to be getting to grips with low levels of ROIC in Ice Cream via mix improvement and
cabinet management initiatives. ROIC in Ice Cream improved by 300bps between 2013
and 2016, around half of which was margin, according to EVP Kevin Havelock.
We also assume that Personal Care can deliver a higher rate of margin growth than it has
in recent years as organic growth recovers, mix continues to improve and the category
benefits from its share of ZBB savings. But there are risks here: starting point margins are
high, the category is competitively intense and ULVR has some performance-fixing to do.
Exhibit 30: Projected FY19 core margins & 3 year progression
2015/16
avg. LFL
2015/16
Core
margin
pa
2016A
Core
margin
Projected
LFL
Projected
Core
Margin
pa
2019E
core
margin
Personal Care 4.2% 20bps 19.1% 5.0% 50bps 20.8%
Home Care 5.4% 170bps 9.7% 5.0% 150bps 14.9%
Refreshment 4.5% 55bps 9.9% 4.0% 100bps 13.3%
Foods 1.8% (35bps) 17.9% 2.0% 10bps 18.2%
Total 3.9% 40bps 15.3% 4.1% 80bps 17.6%
Source: Company data; Jefferies analysis & estimates
On the (relative) downside, we assume that Foods margins progress only slowly, given
the high starting point relative to the peer group and the need to invest in defending the
top line. Our forward projection of 15bps of annual progress reflects significant
improvement relative to the most recent two years.
Scoping a potential €18bn cumulative buyback to 2019
ULVR’s April review remit has made explicit reference to the Balance Sheet. We read this as
an open-ness to fresh thinking around enhanced cash returns to shareholders.
ULVR’s CEO Paul Polman has of course vigorously resisted Buybacks over the years. We
have some sympathy with his position, taking the view that headline earnings accretion is
largely offset by PER compression, as the result of the higher cost of leveraged equity.
However we now expect more pragmatic counsels to prevail, post-KHC. Partly as the
result of shareholder pressure and the symbolism inherent in such a shareholder friendly
move. More critically, because one of the hard lessons from KHC was that a smaller
Our peer analysis informs our new
medium term margin forecasts
We think that core margins of 17-
18% by FY19 is a realistic target
We model a buyback scenario that
reflects a target net debt:EBITDA at
end FY19 of 2.0x
UNA NA
Target | Estimate Change
15 March 2017
page 20 of 56 , Equity Analyst, +44 (0) 20 7029 8670, [email protected] Deboo
Please see important disclosure information on pages 52 - 56 of this report.

predator was able to contemplate taking out ULVR using its own under-leveraged balance
sheet. We expect this to shift hearts and minds inside 100VE.
We accordingly model an upside (for EPS) case that has ULVR buying back to hit a target
net debt:EBITDA multiple of 2.0x by the end of 2019. This implies a c.€6bn annual
programme between now and then.
Stand-alone forecast scenarios summary
Exhibit 32 summarises our forecast scenarios based on the above discussion. We reference
as a baseline our previous published forecast from January 27, which resolved to an FY17
EPS of €202c rising to €243c by FY19. This forecast reflected c.40bps of margin
progression in FY17, rising to c.60bps in FY19, the latter the mid-upper range of
guidance. Subsequent fx movements would have been a c.2% upgrading influence.
Exhibit 31: Summary forecasts (published forecast shaded grey)
Organic growth
FY16A FY17E FY18E FY19E FY20E CAGR
19 vs.16
Previous published forecast 3.7% 3.8% 4.1% 4.3% 4.3% 4.1%
Above at latest fx 3.7% 3.8% 4.1% 4.3% 4.3% 4.1%
New stretch margin forecast 3.7% 3.8% 4.1% 4.3% 4.3% 4.1%
New forecast plus buyback 3.7% 3.8% 4.1% 4.3% 4.3% 4.1%
Core margins
FY16A FY17E FY18E FY19E FY20E Delta pa
19 vs.16
Previous published forecast 15.3% 15.7% 16.3% 16.9% 17.3% 56bps
Above at latest fx 15.3% 15.7% 16.3% 16.9% 17.3% 55bps
New stretch margin forecast 15.3% 16.0% 16.8% 17.6% 18.4% 76bps
New forecast plus buyback 15.3% 16.0% 16.8% 17.6% 18.4% 76bps
Net debt:EBITDA
FY16A FY17E FY18E FY19E FY20E
Previous published forecast 1.3x 1.0x 0.8x 0.6x 0.4x
Above at latest fx 1.3x 1.0x 0.8x 0.6x 0.3x
New stretch margin forecast 1.3x 1.0x 0.7x 0.5x 0.2x
New forecast plus buyback 1.3x 1.6x 1.8x 2.0x 2.0x
NV EPS (in Euro c)
FY16A FY17E FY18E FY19E FY20E CAGR
19 vs.16
Previous published forecast 188.1 202.1 221.5 242.5 261.6 9%
Above at latest fx 188.1 206.6 226.9 248.4 267.9 10%
New stretch margin forecast 188.1 210.5 233.8 258.6 285.2 11%
New forecast plus buyback 188.1 213.2 243.8 278.9 319.0 14%
PLC EPS (in GBp)
FY16A FY17E FY18E FY19E FY20E CAGR
19 vs.16
Previous published forecast 153.3 172.1 188.6 206.5 222.7 10%
Above at latest fx 153.3 177.0 194.5 212.8 229.6 12%
New stretch margin forecast 153.3 180.4 200.5 221.9 244.9 13%
New forecast plus buyback 153.3 182.7 209.0 239.0 273.4 16%
% EPS deltas relative to previous published forecast
FY16A FY17E FY18E FY19E FY20E
Latest fx 0% 2% 2% 2% 2%
New stretch margin forecast 0% 4% 6% 7% 9%
New forecast plus buyback 0% 5% 10% 15% 22%
Source: Jefferies analysis & estimates
Our best case optimised forecasts
indicates FY19 EPS 15% higher at
€279c
UNA NA
Target | Estimate Change
15 March 2017
page 21 of 56 , Equity Analyst, +44 (0) 20 7029 8670, [email protected] Deboo
Please see important disclosure information on pages 52 - 56 of this report.

Our new published forecasts (shaded grey in the Exhibit and set out in detail at the end of
this note) now assume consistent margin progress at the very top end of the range i.e.
80bps pa. This is consistent with new ULVR guidance for FY17 issued on 22 February and
our own analysis and conjecture as set out above in the out years. The effect is to upgrade
FY19 EPS by 7% relative to our previous published forecast of 5% at constant fx.
Our speculative Buyback case projects FY19 EPS of €279c, being a 15% upgrade to our
previous published forecast (13% at constant fx) and a cumulative 8% upgrade to our
new stretch margin case forecast.
UNA NA
Target | Estimate Change
15 March 2017
page 22 of 56 , Equity Analyst, +44 (0) 20 7029 8670, [email protected] Deboo
Please see important disclosure information on pages 52 - 56 of this report.

No further upside from a split, once
costs & complexities are weighed
The case for a split Questionable returns from scale and diversification
KHC’s intervention has put the question of whether ULVR should break itself up in some
way firmly back on the table. ‘Portfolio’ has now been identified by ULVR as one of the
four legs of its strategic review process. While this might not be intended to allude to the
idea of a split, the market is abuzz with that kind of speculation. So the issue needs to be
tackled, as comprehensively and analytically as possible.
This analyst has been a long term advocate of a ULVR split, for virtually the whole of the
ten years he has covered the stock. This reflects two strong convictions.
The first and most important is that we are simply unconvinced by the returns from multi-
category scale: manufacturing synergy is non-existent and distribution synergy is limited
outside certain Emerging Markets. What little cost synergies there are will be limited to
shared back office functions. So the argument turns on revenue synergy: the idea that
aggregate scale within a particularly territory or in a particular retailer confers some sort of
benefit. Or to put the issue more specifically, the idea that ULVR gets some combination of
better terms, more listings and more shelf space from Tesco because it is the UK market
leader both in margarine and deodorant. We have always struggled with that and still do.
Going the other way is that increased category focus can be very positive for performance.
The positive case study is Cadbury. A business that was chided for years for weak earnings
growth and low margins in its core confectionery business, grew operating profits at a
compound rate of over 20% in its two brief years as a pure play confectionery player. It’s
subsequent take out by Kraft (for what looks now like a low valuation) might have been a
loss to the nation, but was a further big source of upside for shareholders.
But it’s not just Cadbury who is the poster child for separation. The spin-outs of
Kraft/Mondelez and Altria/Philip Morris have both been strongly positive for value.
Our second objection to ULVR’s complexity is a more straightforward one: the idea that
investors can diversify risk more cheaply than managers can. If there are no returns to
scale from being in both Foods and HPC together, then why not list those entities
separately and allow the market to better scrutinise their value and risk profiles?
But costs as well as benefits
We see three clear areas of benefit from a split. The most widely cited rationale for a
corporate split is that investors might be inclined to attribute a higher aggregate value to
multiple entities over which they have more visibility and scrutiny, rather than one
‘conglomerate’ with a resultant discount attached. A further benefit is that it might be
possible to create more segmented and differentiated investor appeals, most obviously by
configuring the divided balance sheets differently. There should also be commercial and
operational benefits from focus. The divided businesses are smaller and simpler to
manage, managers have narrower spans of control and there is no longer any ‘poor
relation’ syndrome in respect of the ‘non-core’ business.
Splits don’t however come for free and there are significant costs to separation. The most
obvious is the one off costs of advisory fees and arrangement fees. These have been
quantified at something like 2% of the transaction value. There may also be permanent
diseconomies of scale: most obviously from the duplication of Board, Exec Comm and
‘plc’ functions (if the spun out business is listed.). But also potentially from duplication in
internal functions such as sales and distribution. Finally there are ‘stranded’ costs, in the
form of excess shared costs left behind in the parent that are no longer covered by the
contribution from the spun out entity. These need to be worked out over the early years
‘’Portfolio’ is part of the April review
process, with the market looking for
a split
We remain unconvinced by the
benefits of multi-category scale…
…and think further that a narrower
category focus can be positive for
performance
We also hold to the view that
investors can diversify risk more
efficiently than corporate managers
We therefore think that a split could
unlock a lot of value upside
But only after incurring one-off costs,
stranded costs and some permanent
diseconomies of scale
UNA NA
Target | Estimate Change
15 March 2017
page 23 of 56 , Equity Analyst, +44 (0) 20 7029 8670, [email protected] Deboo
Please see important disclosure information on pages 52 - 56 of this report.

post the spin. Cadbury estimated stranded costs as 2-3% of the surviving confectionery
businesses sales, for example.
Exhibit 32: Generic sources of value creation & destruction from a split
Source: Jefferies
Potentially significant upsides: Cadbury & other case studies
Despite this balance of costs and benefits, the preponderance of evidence suggests that
there are significant net value benefits from spin-outs. Let’s first return to the Cadbury
example, as it’s both analogous to ULVR and close to home for many ULVR investors and
analysts.
The story is, we think, well known. In March 2007 the Cadbury Schweppes Board
announced the splitting of the business into separate confectionery and soft drinks
companies. The immediate catalyst was position-building by a vocal activist investor,
Trian Fund Management, led by Nelson Peltz. The move was seen as a sign of weakness in
many quarters, but Cadbury were adamant that the decision to split had been live for a
long time prior to Trian’s involvement. Following the failure to achieve a trade sale of the
soft drinks business, Cadbury elected to spin the business out into a separate listing on
the NYSE. This duly occurred in April 2008.
This focussed attention on a surviving confectionery business with good growth but low
margins (10%) partly due to inherent inefficiency and partly as a result of the stranded
cost burden alluded to above. The confectionery business soon started surprising
consistently on the upside and grew its profits at constant fx at a compound rate of over
20% in 2008 & 2009. In September 2009 Cadbury was the subject of a bid from Kraft
(now Mondelez), which went unconditional at 840p per share in January 2010.
The Cadbury saga unfolded in very difficult markets during the Global Financial Crisis. So
the best indicator of value creation is performance relative to the FTSE 100, which was
50% ahead from the decision to split to the ultimate take out.
We see Cadbury as a strongly positive case study of the value creation from a category-
based split in the consumer goods space and one strongly analogous to ULVR. The
complication is that we are viewing it through a pure near-term shareholder value lens,
where a lot of the value creation was from a take-out of one of the separate entities. This
may of course not be the way ULVR are seeing it, either because they value independence
for its own sake, or because they want to be in control of the timing and quantum of any
bid premium for a separated business, should they want to invest this elsewhere.
Enhanced value perceptions as a result of increased visibility
More segmented investor appeal e.g. growth vs. income proposition
Commercial & operational benefits from increased focus
One-off costs to achieve e.g. advisory fees, finance arrangement fees, relocation expenses
etc.
Permanent diseconomies of scale, definitely plc and back office costs, but also potential
operational costs
Stranded costs: temporarily uncovered costs in the rump business that need to be
eliminated over time
Potential value creation Potential value destruction
Cadbury plc is a strongly positive
case study of the value of a spin out
The former Cadbury entity increased
its value by 50% in three years,
market-relative
UNA NA
Target | Estimate Change
15 March 2017
page 24 of 56 , Equity Analyst, +44 (0) 20 7029 8670, [email protected] Deboo
Please see important disclosure information on pages 52 - 56 of this report.

Exhibit 33: Cadbury synthetic share price1 pre and post-split
Rebased to 1 January 2007
Source: FactSet; Jefferies analysis 1 Synthetic share price is the price of a Cadbury Schweppes plc share up to the date of the split in April 2008. Post the split it is the combined market cap of Cadbury plc and the spun-out Dr. Pepper Snapple Group, divided by the old Cadbury Schweppes share count
The Cadbury case if of anecdotal value only. Two ‘meta’ studies of the value from splits of
various kinds from leading consulting firms have come to our attention.
The first, from the Boston Consulting Group in September 2014, looked at short term
market reaction to trade sales, spin-offs and carve-outs5. This was based on analysis of
around 8,000 deals in the US since 1990.
Exhibit 34: BCG’s study of near term market reaction to separations
Cum. abnormal
return1
% of deals with
positive share price
reaction
Trade sales 1.3% 54%
Spin-offs 2.6% 59%
Carve-outs 1.2% 53%
Source: Boston Consulting Group 1 Cumulative abnormal return relative to the market over a seven-day window centred around the announcement date
Exhibit 35: Bain’s study of longer-term market reaction to spin-outs
Top third 56%
Middle third 0%
Bottom third (44%)
Simple average 4%
Source: Bain & Company
The key conclusion from BCG is that while market reactions to separations were generally
positive, the near term share price benefit was small. The second study, from Bain and
Company, assessed 40 transactions in the US with values of over $1bn, across a range of
industries and on an 18 month timeframe post-deal. This suggested that the most
successful transactions generated returns similar to Cadbury, in excess of 50%. However
the least successful deals destroyed value. While the net result was a modest positive, the
inference is that any separation has to make strategic and economic sense.
5 A carve out is a full or partial IPO of a separated business rather a pure spin. Carve-outs have
the advantage of bringing capital back to the parent, but often attract tax liabilities
400
450
500
550
600
650
700
750
800
850
900
Jan
-20
07
Feb
-20
07
Mar-
20
07
Ap
r-2
00
7
May-
20
07
Jun
-20
07
Jul-
20
07
Au
g-2
00
7
Sep
-20
07
Oct
-20
07
No
v-2
00
7
Dec-
20
07
Jan
-20
08
Feb
-20
08
Mar-
20
08
Ap
r-2
00
8
May-
20
08
Jun
-20
08
Jul-
20
08
Au
g-2
00
8
Sep
-20
08
Oct
-20
08
No
v-2
00
8
Dec-
20
08
Jan
-20
09
Feb
-20
09
Mar-
20
09
Ap
r-2
00
9
May-
20
09
Jun
-20
09
Jul-
20
09
Au
g-2
00
9
Sep
-20
09
Oct
-20
09
No
v-2
00
9
Dec-
20
09
Jan
-20
10
Absolute Relative to FTSE 100
Announces split, following activist pressure Split occurs
Strong maiden results from Cadbury plc
Kraft bid for Cadbury plc
Meta-studies from two leading
consulting firms have pointed to
positive, but smaller, returns from
splits of various kinds
UNA NA
Target | Estimate Change
15 March 2017
page 25 of 56 , Equity Analyst, +44 (0) 20 7029 8670, [email protected] Deboo
Please see important disclosure information on pages 52 - 56 of this report.

Material potential upsides for ULVR from enhanced valuation perception, prior to any costs We are strongly of the view that ULVR would be valued more highly by the market if it
was split into more logical and coherent component parts. There should therefore be
material positive benefits to offset the costs of any separation.
ULVR’s capital allocation under CEO Paul Polman has been strongly in favour of
Household and Personal Care (HPC). Since 2009, ULVR has added around €1.9bn of sales
from acquisitions. This is the net of €3.2bn of acquired Personal Care sales, around €450m
each of Home Care and Refreshment sales less €2.2bn of divested Foods turnover.
Exhibit 36: ULVR’s Cumulative M&A history under Paul Polman
Cumulative sales value of deals in €m at current exchange rates
Source: Unilever; Jefferies analysis & estimates
The effect has been to transform ULVR into an overtly HPC-led business, strongly
weighted to Emerging Markets (EM’s). We think that around 45% of Group EBITDA arises
from EM’s as a whole and that just over 30% of Group EBITDA arises from HPC in EM’s.
The message from peer group valuations is that the capital markets tend to value this sort
of exposure very highly. HPC companies that are geographically diversified tend to trade
on substantial valuation premia to Foods companies, whether diversified or not. Emerging
Market subsidiaries of multinationals like ULVR & NESN trade on exceptionally high
valuations, close to 30x EBITDA in fact. Relative to which ULVR was trading on less than
14x EBITDA before KHC came along.
€30m
€240m€70m
(€35m)
(€460m)(€90m)
€750m
(€190m)
€1520m
€95m
(€50m)
(€80m)
€210m€70m
(€290m)
(€350m)
€50m
(€75m)
(€180m)
€40m
(€40m)
(€100m)
€140m
(€570m)
(€95m)
€110m
€210m
€230m
€190m€30m
€150m
€100m
€190m
€1860m
Expansion into Mass Personal Care: Alberto &
Sara Lee
Foods disposals, principally NorthAm
Personal Care & Refreshment
‘speedboat’ deals
FoodsRefreshmentHome CarePersonal Care
Under Paul Polman, ULVR’s portfolio
direction of travel has been
decisively towards HPC
ULVR is now a much more HPC-led,
EM-led entity as a result…
…in a world where HPC & EM pure
plays trade on much higher
multiples than ULVR
UNA NA
Target | Estimate Change
15 March 2017
page 26 of 56 , Equity Analyst, +44 (0) 20 7029 8670, [email protected] Deboo
Please see important disclosure information on pages 52 - 56 of this report.

Exhibit 37: Diversified HPC EV:EBITDA multiples
Prospective 12 months basis. Ex associates. As at 7 March
Source: FactSet; Jefferies analysis
Exhibit 38: Developed HPC EV:EBITDA multiples
Prospective 12 months basis. As at 7 March
Source: FactSet; Jefferies analysis
Exhibit 39: Diversified Foods EV:EBITDA multiples
Prospective 12 months basis. Ex associates. As at 7 March1
Source: FactSet; Jefferies analysis 1 Mead Johnson multiple is prior to RB offer on 1 Feb
Exhibit 40: Developed Foods EV:EBITDA multiples
Prospective 12 months basis. As at 7 March
Source: FactSet; Jefferies analysis
Exhibit 41: Emerging Market & Asia EV:EBITDA multiples
Prospective 12 months basis. As at 7 March
Source: FactSet; Jefferies analysis
16.5x15.8x
15.0x 14.8x14.2x
12.9x
Colgate RB P&G Beiersdorf L'Oreal Henkel
15.4x14.4x
12.1x11.5x
Church & Dwight Clorox Newell Brands Edgewell
14.5x
12.7x
12.2x
Mead Johnson Nestle Danone
16.4x
14.1x13.1x 12.8x
11.6x
9.0x
Kraft Heinz Hershey Kellogg's General
Mills
Campbell's Premier
Foods
31.6x
27.5x26.3x
13.0x 12.3x10.5x
9.4x7.6x
4.9x
ULVR
Indonesia
HUL NESN India Shisheido Oriflame Kao Grupo
Bimbo
Tingyi JBS
UNA NA
Target | Estimate Change
15 March 2017
page 27 of 56 , Equity Analyst, +44 (0) 20 7029 8670, [email protected] Deboo
Please see important disclosure information on pages 52 - 56 of this report.
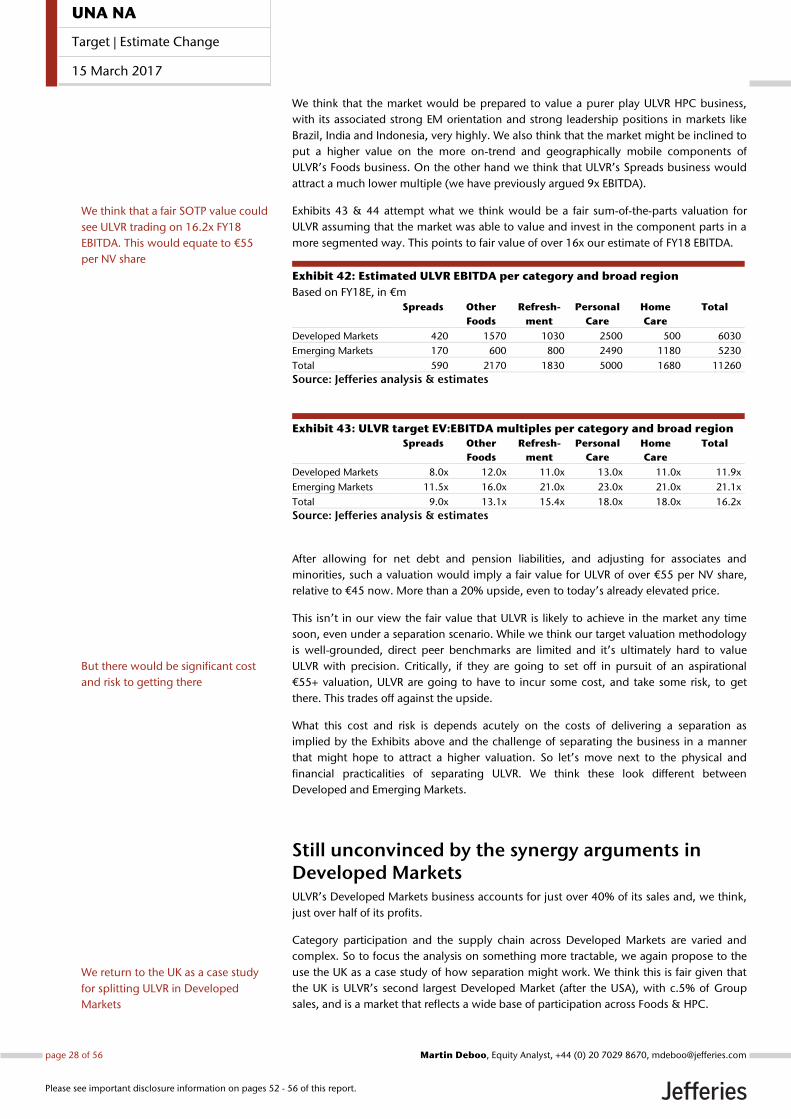
We think that the market would be prepared to value a purer play ULVR HPC business,
with its associated strong EM orientation and strong leadership positions in markets like
Brazil, India and Indonesia, very highly. We also think that the market might be inclined to
put a higher value on the more on-trend and geographically mobile components of
ULVR’s Foods business. On the other hand we think that ULVR’s Spreads business would
attract a much lower multiple (we have previously argued 9x EBITDA).
Exhibits 43 & 44 attempt what we think would be a fair sum-of-the-parts valuation for
ULVR assuming that the market was able to value and invest in the component parts in a
more segmented way. This points to fair value of over 16x our estimate of FY18 EBITDA.
Exhibit 42: Estimated ULVR EBITDA per category and broad region
Based on FY18E, in €m
Spreads Other
Foods
Refresh-
ment
Personal
Care
Home
Care
Total
Developed Markets 420 1570 1030 2500 500 6030
Emerging Markets 170 600 800 2490 1180 5230
Total 590 2170 1830 5000 1680 11260
Source: Jefferies analysis & estimates
Exhibit 43: ULVR target EV:EBITDA multiples per category and broad region
Spreads Other
Foods
Refresh-
ment
Personal
Care
Home
Care
Total
Developed Markets 8.0x 12.0x 11.0x 13.0x 11.0x 11.9x
Emerging Markets 11.5x 16.0x 21.0x 23.0x 21.0x 21.1x
Total 9.0x 13.1x 15.4x 18.0x 18.0x 16.2x
Source: Jefferies analysis & estimates
After allowing for net debt and pension liabilities, and adjusting for associates and
minorities, such a valuation would imply a fair value for ULVR of over €55 per NV share,
relative to €45 now. More than a 20% upside, even to today’s already elevated price.
This isn’t in our view the fair value that ULVR is likely to achieve in the market any time
soon, even under a separation scenario. While we think our target valuation methodology
is well-grounded, direct peer benchmarks are limited and it’s ultimately hard to value
ULVR with precision. Critically, if they are going to set off in pursuit of an aspirational
€55+ valuation, ULVR are going to have to incur some cost, and take some risk, to get
there. This trades off against the upside.
What this cost and risk is depends acutely on the costs of delivering a separation as
implied by the Exhibits above and the challenge of separating the business in a manner
that might hope to attract a higher valuation. So let’s move next to the physical and
financial practicalities of separating ULVR. We think these look different between
Developed and Emerging Markets.
Still unconvinced by the synergy arguments in Developed Markets ULVR’s Developed Markets business accounts for just over 40% of its sales and, we think,
just over half of its profits.
Category participation and the supply chain across Developed Markets are varied and
complex. So to focus the analysis on something more tractable, we again propose to the
use the UK as a case study of how separation might work. We think this is fair given that
the UK is ULVR’s second largest Developed Market (after the USA), with c.5% of Group
sales, and is a market that reflects a wide base of participation across Foods & HPC.
We think that a fair SOTP value could
see ULVR trading on 16.2x FY18
EBITDA. This would equate to €55
per NV share
But there would be significant cost
and risk to getting there
We return to the UK as a case study
for splitting ULVR in Developed
Markets
UNA NA
Target | Estimate Change
15 March 2017
page 28 of 56 , Equity Analyst, +44 (0) 20 7029 8670, [email protected] Deboo
Please see important disclosure information on pages 52 - 56 of this report.

UK case study: largely un-integrated other than back office?
ULVR has been in the UK for over a hundred years and has deep roots in the market. As we
have noted above, the operational model in the UK was extensively restructured in the
2007-2009 period as ULVR combined what had been three principal operating companies
into one. Subsequently, in 2015, the Margarines business was unbundled into the new
BCS operation, based in Purfleet, reputedly the world’s biggest margarine plant.
However what is apparent from a more detailed study of the market is that ULVR’s UK
supply chain, which represents the vast bulk of its assets, remains largely un-integrated
across categories. There is one semi-integrated facility, Port Sunlight. This is ULVR’s
spiritual home and a dedicated Home Care plant until it took on some former Alberto and
Sara Lee production on the closure of their facilities in 2012. Aside from that all
manufacturing is dedicated to one of ULVR’s four principal categories.
Exhibit 44: ULVR in the UK
Principal locations including headcounts & capacities where known
Source: Unilever; Jefferies analysis
Moving to distribution and warehousing, ULVR have one integrated facility in the form of
its combined Ambient Grocery (Foods) and Home Care Distribution Centre (DC) at
Cannock. Personal Care and Spreads operate from separate DC’s, both from each other
and from the Grocery & Home Care DC.
Mustards& condiments
Norwich
Spreads DCThurrock
Refreshment
Home Care
Personal Care
Foods
Shared
Key
Factory
Distribution Centre (DC)
SpreadsPurfleet200 FTE
180k tonnes
Pot NoodleCrumlin
15k tonnes
MarmiteBurton
6k tonnes
Ice CreamGloucester
500 FTE80k tonnes
Head OfficeLeatherhead
1750 FTE
Ambient Foods& Home Care DC
Cannock
Personal Care 2 DCDeeside
Personal Care 1 DCDoncaster
DeodorantsSeacroft
TeaTrafford Park
Home & Personal CarePort Sunlight
2000 FTE
Home CareWarrington
ULVR UK was extensively
restructured and optimised in 2007-
2009
Despite this manufacturing is not
integrated across categories
Warehousing and distribution is only
partly integrated
UNA NA
Target | Estimate Change
15 March 2017
page 29 of 56 , Equity Analyst, +44 (0) 20 7029 8670, [email protected] Deboo
Please see important disclosure information on pages 52 - 56 of this report.

Where ULVR in the UK is integrated is in its Head Office in Leatherhead, purpose-built and
commissioned in 2008. Leatherhead accommodates some 1750 heads according to
recent planning filings, around 350 of which are in ‘administration’ according to
Companies House filings.
We would imagine that these 350 admin heads are in back office functions like Finance,
HR & IT. So by inference around 1400 heads are in market-facing functions like sales and
marketing.
Separation in the UK un- problematic, with scale diseconomies limited
What might happen in the UK if ULVR was to separate, into a Foods and HPC business for
the sake of argument?
We see no implications for manufacturing, as the only integrated facility is for HPC.
Distribution is also largely separate, save for the integrated Foods & Home Care facility at
Cannock. ULVR will benefit from some minor site-level scale economies there, but we
suspect that the bulk of the cost of a DC is in its picking operations. It’s difficult to explore
ULVR’s distribution cost economics from the outside. However a very clear insight into
what these might look like is provided by the structure of ULVR’s UK terms of trade, which
are in the public domain.
ULVR, like their peers, offer fixed discounts off invoice for items like Early Payment and
Electronic Ordering. These discounts are small (less than 1% off the invoice value) and are
business-level issues. The principal terms offered by ULVR are Logistics Efficiency Terms
(LET) which offer discounts of up to 3% off-invoice. The structure of these terms are
complex, but in essence they offer the customer an incentive to order full pallets of the
same SKU Stock Keeping Unit.) Interestingly there is no discount for overall scale or
average order size across all SKU’s.
The inference we would draw is that the bulk of ULVR’s distribution efficiencies arise at the
individual SKU level (because bulk orders of the same SKU are easier to pick, load and
unload). So there would appear to be no returns to multi-category scale (because that
implies different SKU’s and indeed different supply chains) nor returns to overall account-
level scale, which are partly a function of being in multiple categories.
So the nub of challenge of separating ULVR in the UK would be at the white collar level,
out of Leatherhead. But again here observation and experience would suggest that many
commercial roles are category facing. Brand management is by definition and we would
also imagine that many junior and mid-level sales roles are similar. So the inseparabiltiies,
and resultant diseconomies of scale, would be confined to senior management and the
back office.
It’s hard to quantify what these might be but let’s have a stab. If the UK’s SG&A cost to
sales ratio is the same as the group average, 13%, then the inference from the admin
headcount relative to total headcount at Leatherhead is that about a quarter of heads are
back office. Senior management roles would add a few more heads to this but
significantly more cost. So it feels like maybe a third of admin cost (c.4% of sales) of
indivisible. This feels like a fair number as, looking at it the other way round, guided
merger synergies for companies looking to eliminate SG&A tend to be of a similar
quantum.
If ULVR was to split, this cost would need to be duplicated, implying a 4% penalty. But we
doubt that the ultimate impact would be that severe, despite the apparent diseconomy of
scale. Smaller, more focussed companies tend to find smarter ways of doing things. And
there should be offsetting revenue benefits from increased focus and greater
accountability. So any value destruction should be a relatively small percentage of sales.
Only the back office is integrated
ULVR UK trading terms suggest
strongly that returns from multi-
category scale in the supply chain
are low to non-existent
The implication is that any cost
synergies are limited to white collar
headcount
We think that any scale diseconomy
would be a low single digit
percentage of sales
UNA NA
Target | Estimate Change
15 March 2017
page 30 of 56 , Equity Analyst, +44 (0) 20 7029 8670, [email protected] Deboo
Please see important disclosure information on pages 52 - 56 of this report.

But Emerging Markets more complicated In contrast to Developed Markets, we think that separation in some Emerging Markets
would present more of a challenge and result in a higher level of value destruction. The
key issue is different retailer structures and what this means for distribution economics.
Foods and Refreshment categories are less germane to overall scale in Emerging Markets
than they are to Developed. We estimate that Foods and Refreshment account for just
over half of ULVR sales in DM’s, but only a third of sales in EM’s. In ULVR’s two big Asian
markets, India & Indonesia, Foods & Refreshment account for less than a quarter of sales.
Exhibit 45: ULVR India profile
Source: Source: Jefferies estimates
Exhibit 46: ULVR Indonesia profile
Source: Jefferies estimates
Exhibit 47: ULVR LatAm profile
Source: Jefferies estimates
This relative low significance to overall scale of Foods and Refreshment might suggest that
separating the two halves of the business would be a simpler and less emotive issue than
it would be in Developed Markets. But the complication is the low incidence of the
‘Modern Trade’ (Supermarkets) in certain key ULVR territories like India and Indonesia.
Exhibit 48: Penetration of Modern Trade
% of Grocery sales in Modern Trade. Markets >5% ULVR sales in blue
Source: Kantar; Bain & Company
In markets like India, low population density and low urbanisation, plus low levels of car
ownership, makes the Supermarket model unsuitable. The consequence is that the
Modern Trade in India is edging into a double digit share of Grocery only slowly, in
contract to the >70% share it enjoys in Developed Markets. This has major implications for
selling and distribution in these markets, in that there are a large number of retail outlets
Laundry
48%
Personal
Care
26%
Exports
& other
12%
Tea 11%
Ice
Cream
2%
Bakery
1%
HPC
73%
Foods &
Refresh
27%
Foods
36%
Personal
Care
32%
Home
Care
24%
Ice
Cream
8%
89%84%
81%
72% 71%68%
58%53%
48% 48%41% 41%
28%
19% 18%12%
Separation in EM’s would be more of
a challenge given distribution
economics
The key issue is retail channel
concentration and sophistication
Some big ULVR EM markets have
very fragmented retail channels
UNA NA
Target | Estimate Change
15 March 2017
page 31 of 56 , Equity Analyst, +44 (0) 20 7029 8670, [email protected] Deboo
Please see important disclosure information on pages 52 - 56 of this report.

to serve and dependence on extensive networks of intermediate wholesaler. The game is
therefore one of both filing the lorry and maximising the value of a sales call. Both of these
are returns to national scale, which in turn favours a multi-category presence. The
competitive advantage conferred by distribution returns to scale explains why ULVR can
be #2 in Coffee to Nestle in India, when they have virtually no presence anywhere else.
India case study: manufacturing separability, distribution complexity
Diving deeper into India, ULVR’s second biggest market worldwide in accounting for c.8%
of Group sales, offers further insight into the issue.
Just as in the UK, manufacturing is largely un-integrated. Of the 23 ULVR manufacturing
locations in India that we can identify, none manufacture more than one category.
Exhibit 49: ULVR manufacturing plants in India
Source: Business Standard; Jefferies analysis
But the sheer scale and complexity of India’s retailing and wholesaling landscape makes
for a much more complex picture at the distribution level. ULVR are reaching 2m out of
India’s 7-8m retail outlets via network of 7,000 wholesalers.
Exhibit 50: Landscape of Indian urbanisation, retail universe & ULVR reach
Number of:
Metropolises 6
Cities 438
Towns 5,500
Villages 600,000
ULVR reach
Total retail outlets c.8m
Reached by ULVR direct & indirect distribution 7m
Reached by ULVR direct distribution 3.2m
ULVR perfect stores >1m
ULVR wholesalers 7,000
Shakti participants >70,000
Source: Hindustan Unilever; LiveMint; Jefferies analysis
Soaps & detergents
Ice Cream
Foods
Tea
Personal Care
Fine chemicals
Water purifiers
Coffee
Household Cleaners
We case study India, ULVR’s second
biggest market
ULVR reaches some 7m retail outlets
in India
UNA NA
Target | Estimate Change
15 March 2017
page 32 of 56 , Equity Analyst, +44 (0) 20 7029 8670, [email protected] Deboo
Please see important disclosure information on pages 52 - 56 of this report.

To be able to ‘go deep’ into the highly fragmented distribution base means that a sales
call or a delivery drop needs to be economic down to very low levels of sales per outlet –
much, much lower than would be encountered in a Modern Trade-led Developed Market
which relies on direct distribution to the retailer’s warehouse. We estimate that the
average ULVR served outlet has sales of ULVR products at MSP of only around $40 per
week. So the average outlet contributes less than $20 a week to ULVR’s cost base.
Exhibit 51: Outlet sales coverage across major Indian CPG players
m outlets covered
Source: Jefferies India estimates
The key to how ‘deep’ ULVR can go – and by the same token any value destruction as the
result of de-scaling in the market – is the ‘concentration curve’ of retail outlets. We don’t
know what this looks like in India, but can make some informed speculations based on
what little data we have, plus judgement and experience.
Exhibit 52: Distribution economics in India
Speculative outlet level concentration curves
Source: Jefferies analysis & estimates
We hypothesise in Exhibit 53 that the biggest Modern Trade outlets in India have
contribution per outlet many times bigger than the smallest ones (the chart suggests 10x
bigger for visual clarity. In practice the multiple will be much larger). We would expect
the concentration curve to fall quite sharply as one travels down the independent urban
trade and then to have a ‘long tail’ of small (often tiny) rural outlets.
0
2
4
6
8
Colgate Emami Godrej ULVR Marico NESN ITC
Direct Indirect Total
0
10
20
30
40
50
60
70
80
90
100
0% 10% 20% 30% 40% 50% 60% 70% 80% 90% 100%
Sa
les
pe
r o
utl
et
Cumulative outlets
Now Ex. Foods Ex. Refreshment
Outlet cost to serve under direct model
Outlet cost to serve indirect
Moderntrade
Urbantrade
Ruraltrade
We think that the average outlet in
India contributes c.$20 per week to
ULVR’s cost base
The implication is that distribution
‘depth’ in the market is a function of
scale
UNA NA
Target | Estimate Change
15 March 2017
page 33 of 56 , Equity Analyst, +44 (0) 20 7029 8670, [email protected] Deboo
Please see important disclosure information on pages 52 - 56 of this report.

In reality, ULVR in India has a many-layered sales and distribution model that depends on
7,000 principal redistribution stockists and a much larger network of Rural Distributors,
each of which serves 15-20 rural sub-stockists each. For simplicity we confine our
hypothesis to two models: the ULVR salesman-led direct model and the distributor-led
indirect model. The latter is supported in part by ULVR’s well-known ‘Shakti’ programme.
This embraces networks of ‘shakti ammas’ (rural village women) and ‘shaktimaans’
(usually their husbands), who sell small quantities of ULVR products on foot (within a
single village) and by bicycle (across a wider area) respectively. Let’s hypothesise that
provisioning the indirect model has half the cost-to-serve of the full-service model (in
practice it’s probably a lot less.)
In our hypothetical model, the indirect model allows ULVR at its current scale to penetrate
down the 60th percentile outlet by size (red line). But if ULVR de-scales in any separation
scenario, this level of penetration will fall. Exiting Foods would make relatively little
difference but exiting Refreshment (green line, which is principally tea) would have bigger
impact. It all depends on the steepness of the concentration curve but in our hypothetical
example an exit from Foods & Refreshment would cap economic distribution at around
the 30th percentile outlet – a big difference. So separation would impact ULVR’s revenues
(via reduced sales presence and availability), margins (due to higher costs to serve) as well
as lowering the distribution barrier to entry for competitors. Clear value destruction.
We don’t have the data to take the argument any further but see the impact of de-scaling
in Emerging Markets with small Modern Trades as potentially significant, and a resultant
barrier to a clean break from Foods and/or Refreshment.
But we also urge a sense of proportion. Markets where the Modern Trade accounts for
less than half of Grocery sales probably account for less than 25% of ULVR’s Group sales.
Major Emerging Markets like Brazil and China6 have well-developed Modern Trades that
are growing their share. The rise of e-commerce will reduce the distribution barrier to
entry over time. Finally, in markets like India and Indonesia an exit from Foods would be
much less destructive than an exit from Refreshment.
Under a split, or perhaps even a sale, scenario it might even be possible for ULVR to
minimise value destruction by forming a distribution JV with the successor business a la
Diageo & Heineken’s brandhouse JV in South Africa. So there are options, as well as
complications.
Options for a split: Gradations of Foods, DM’s vs. EM’s. The question of Refreshment What does ‘splitting’ ULVR mean practically, assuming that it is strategically and
economically desirable?
The market’s knee-jerk scenario, and indeed this analyst’s general view over the years, has
been that ULVR should split itself into a ‘Foods’ and ‘HPC’ business. The former would be
a low growth, high margin, cash generative entity that generates income for shareholders,
while the latter would be a high growth, medium margin investment vehicle.
In reality there are gradations and variations of possibility under the broad rubric of ‘Foods
vs. HPC.’ Foods is far from a homogenous category. And then there is the question of
ULVR’s ‘Refreshment’ business, a combination of Ice Cream and Tea.
6 We would speculate that ULVR’s relatively late entry into China (actually re-entry) means that
the Modern Trade as a % of ULVR sales is much higher than the 41% national average
The value of scale depends acutely
on the shape of the outlet
‘concentration curve’
We think that distribution scale
diseconomies in markets like India
would be significant
But also counsel a sense of
proportion: relatively few EM’s have
small Modern Trades and there may
be mitigating options
Splitting ULVR isn’t just a simplistic
‘Foods vs. HPC’ decision. In reality
there are gradations of choices
UNA NA
Target | Estimate Change
15 March 2017
page 34 of 56 , Equity Analyst, +44 (0) 20 7029 8670, [email protected] Deboo
Please see important disclosure information on pages 52 - 56 of this report.

The complexity of Foods
Foods for ULVR is a complex, fragmented category comprising many brands. The origins
of the Division reside in the formative Margarine Union business in Holland (one of the
two forerunners of ULVR, along with Lever Brothers in the UK) plus the BestFoods business
acquired in 2000, which brought with it Knorr, Hellmann’s and others.
The majority of ULVR Foods brands by number are strongly local and/or regional in
character. Genuinely global brands in the Division are confined to Knorr,
Hellmann’s/Calve, Flora/Becel and Rama/Blue Band. The consequence is that most ULVR
Foods brands are below the radar of the market, but represent strong local franchises with
resultant contribution to national scale and value: ‘local jewels’ as they have been referred
to in the past. A good example is Maizena, a brand of corn starch that enjoys a strong
franchise in both Northern Europe and Latin America, but which is little known elsewhere.
Exhibit 53: Landscape of ULVR’s Foods business, including representative brands
Sales reflects FY15 disclosures
Source: Company data; Jefferies analysis & estimates
Foods for ULVR therefore resolves into three principal Divisions: Spreads (margarines) with
a turnover of c. €3bn, Savoury (Knorr et al) with turnover of nearly €6bn and Dressings
(Hellmann’s) with a turnover of nearly €4bn.
So splitting or focussing the Foods business isn’t just a binary decision. The market wants
to see Spreads gone, but the consequence would be material loss of scale in Northern
Europe and procurement diseconomies with Dressings. If Foods is exited wholesale, then
ULVR waves goodbye to nascent global brands with growth potential in Emerging
Markets, principally Knorr.
Regular€1.7bn
Heart Health€1.2bn
Bouillons, seasonings &
soups€2.9bn
Meals, side dishes & sauces€1.8bn
Other savoury€1.1bn
Mayonnaise€2.4bn
Other dressings€1.2bn
Spreads€2.9bn
Savoury€5.8bn
Dressings€3.6bn
Unilever Foods€13bn
Other€0.7bn
ULVR’s Foods business comprises
three principal sub-divisions and
many brands
UNA NA
Target | Estimate Change
15 March 2017
page 35 of 56 , Equity Analyst, +44 (0) 20 7029 8670, [email protected] Deboo
Please see important disclosure information on pages 52 - 56 of this report.

The question of Refreshment
Refreshment often feels like ULVR’s Cinderella business: schizophrenic in character (Ice
Cream and Tea), capital- and labour-intensive (ice cream chillers and tea plantations) and,
in tea, ULVR’s arguably least glamorous and least well explained business, in our
experience.
Technically it’s a Foods business, but the key difference is that in Ice Cream ULVR have one
of their more global and richly innovative categories, with ‘Heart Brand’ (Wall’s to the
Brits) sold in over 30 countries and Magnum growing fast in over a dozen.
Tea can lay claim to one genuinely global brand, Lipton. But it also comprises many local
brands, many in India, what we think is ULVR’s biggest tea market. ULVR have been facing
major competitive challenges in tea, notably in the US (Twinings) and India (Tata).
But while Tea might look like a ‘bad’ business superficially, there would be consequences
from exiting here, too. As we have just argued above, it would de-scale ULVR in critical
markets like India. Beyond India, black tea is becoming a hot space in the global foods
industry given tea’s health and wellness properties, with ULVR making a significant
investment behind rolling out it’s acquired premium tea brand, T2. There is also the
complication of the Pepsi Lipton JV in iced tea.
Appraising the split options
Bringing this all together, there seem to us to be six logically coherent options for splitting
or spinning some combination of ULVR Foods & Refreshment businesses.
The first, most extensively discussed and most do-able is to exit Spreads. We assessed this
option extensively in a previous note, ‘Looking for Some Sunlight Over The Wirral,’ 25
November 2016 and concluded that:
Spreads is a highly separable business
But there are few obvious strategic buyers, suggesting that a spin-out or carve-
out would be the most viable exit option.
A speculative spin scenario at 9x EBITDA and 2x net debt:EBITDA would create a
business worth around €1.60 per ULVR share, trading on a PER of c.12x and
yielding nearly 5%.
Our judgement remains that presenting such a business to the market in a
separate listing would be problematic for the time being given strongly negative
top line growth rates
Looking beyond Spreads, we see five further options, the materiality, pros and cons of
which we set out in Exhibit 55.
The incremental step from exiting Spreads would be exit both the Spreads and Dressings
business, a €6.5bn sales entity. Bundling Dressings with Spreads would add some top line
fizz to the proposition and there will be operational and procurement synergies around
edible oils. According to reports in the Financial Times (FT) Alphaville column in June
2010, ULVR contemplated selling Spreads and Hellman’s as a precursor to acquiring
Reckitt Benckiser. The downside of such a transaction is that it would leave behind a
rump, sub-scale, Foods business.
If ULVR conclude that there is value from multi-category scale in Emerging Markets and
that there is genuine growth potential from global brands such as Knorr, then a logical
move strategically would be to exit the Developed Markets Foods business. The offsetting
complication would be that the Knorr brand (arguably ULVR’s most global Foods brand)
would be split, along with other multi-local brands like Maizena. So there would need to
be licensing or similar agreements in place with the successor owner of the Developed
Markets business. This feels difficult to us.
Refreshment has often felt like
ULVR’s Cinderella business to us
Ice Cream is more genuinely global
than Foods…
…while black tea is a hot space in
consumer terms while volume is key
in certain EM’s
The least radical cut would be to sell
or spin Spreads
Exiting Spreads & Dressings would
be the next most radical option
We see an exit from Developed
Markets Foods as difficult
UNA NA
Target | Estimate Change
15 March 2017
page 36 of 56 , Equity Analyst, +44 (0) 20 7029 8670, [email protected] Deboo
Please see important disclosure information on pages 52 - 56 of this report.

Exhibit 54: Strategic split options for ULVR in Foods & Refreshment
Source: Jefferies
The most radical options for ULVR would be to exit the Foods Division wholesale, or to
exit Foods & Ice Cream or Foods & Refreshment wholesale.
The principal incremental attraction would be to realise materially more value (and realise
a control premium if a sale) than by exiting Foods alone. This is relevant to an end game
of ULVR buying Colgate, which we discuss below.
But in any spin-out scenario ULVR wouldn’t be realising any premium but would be
destroying value via transaction costs, stranded costs and permanent diseconomies of
scale, as described at the opening of this section. So net value creation from such a move
would depend acutely on what a split entity could trade at in the market.
Limited upsides from here, once the costs and risks are properly weighed? If ULVR’s end-game is to buy Colgate, then we think they will need to raise capital by
selling assets, if they are to avoid issuing new equity. That would argue for a trade sale.
• Accretive to top line• Limited impact on overall scale,
particularly in EM’s
• A more sellable package than Spreads alone
• Procurement and operational synergies around edible oils
• Accretive to top line
• Avoids value destruction in EM markets with low Modern Trade
• Accretive to top line
• Above-average cash generation• Earnings-dilutive• Few obvious buyers
• Leaves behind a rump presence in Foods
• Earnings-dilutive
• Of questionable do-ability: Splits the Knorr brand and other minor brands: would require a licensing agreement
Potential value creation Potential value destruction
• Clean exit from the category• Accretive to top line• Of material scale and value
• Of material scale and value• Clear margin upsides in Ice Cream for
the right buyer
• Clean exit from any Foods• Of highly material value
• Earnings-dilutive• Some impact on overall scale in key
EM’s
• Earnings-dilutive• Not clear if there are buyers seeking
this combination of assets
• Loss of Tea impacts scale in India and other EM’s
€2.9bn
€6.5bn
€8.5bn
€13.0bn
€20.0bn
€23.0bn
Sales at stake
Spreads
Spreads & Dressings (Hellmann’s)
Developed Market Foods
All Foods
Foods & Ice Cream
All Foods & Refreshment
A wholesale exit from Foods or
Foods & Refresh would be the most
radical options
UNA NA
Target | Estimate Change
15 March 2017
page 37 of 56 , Equity Analyst, +44 (0) 20 7029 8670, [email protected] Deboo
Please see important disclosure information on pages 52 - 56 of this report.

The advantage of the former is that it is a simpler transaction and would crystallise a
control premium, which could then be re-invested in a control premium for Colgate.
But if the end game is not to buy Colgate (or indeed not to do any ‘megadeal’) then the
relevant end games are either for ULVR to maintain the broad status quo (on a margin and
balance sheet-optimised basis) or to sell or spin-out its non-HPC businesses.
If they want to do the latter, then they have the choice of either attempting to sell their
non-HPC businesses, spinning them out (via a tax-free distribution of shares) or carving
them out (via an IPO.) The most obvious buyer of ULVR’s Foods assets is KHC and we
think that ULVR would be nervous of bringing KHC back to the table other than under the
scenario of a back-to-back transaction to buy Colgate. So the distinct option that we want
to contemplate in this section is a spin-out.
Modelling two spin scenarios with a target multiple of 16.2x EBITDA
The rationale for a spin from a shareholder perspective is that ULVR should be able to
realise a higher valuation for the component parts than the integrated whole. Our
argument earlier was that a target multiple for ULVR based on a fair sum-of-the-parts
(SOTP) would be 16.2x EBITDA, relative to the current 15.0x.
As we have argued above, there would appear to be six principal split options available to
try to realise this value. For simplified modelling purposes, we analyse only two of these
options, spinning Foods or Foods and Refreshment. In any case we apply the limiting
assumption that any combination of spin is capable of realising our target SOTP
EV:EBITDA of 16.2x, so the value economics of any option are broadly similar.
Exhibit 56 provides an overview of the two spin options relative to our Base Case of an
optimised status quo, which resolves to €51.50 per ULVR share, or a TSR value including
normal dividend of €53 in round numbers on a 12 month horizon.
Scoping €10-12bn of offsetting value destruction
In line with our general analysis, we assume that any spin-out would incur one-off
transaction costs, the present value of stranded costs and the present value of permanent
diseconomies of scale.
We think that collectively these would destroy €10-€12bn of value (depending on the
option). This reflects transaction costs of 2% of spun revenues, stranded costs of an initial
3% of the sales of the spun business, falling to zero in 3 years, and permanent
diseconomies equivalent to 1% of the sales of the combined entities i.e. the current ULVR
Group.
It’s difficult to scope these offsetting costs with any precision, but we think it’s right to
reflect them. We note, for example, that the transaction costs in the Kraft/Mondelez split
(a smaller Group than ULVR) were over $1 billion.
The really big item is the PV of the scale diseconomies. We have observed above that
indivisible back office costs are c.4% of sales and that there would be material, hard-to
quantify, distribution diseconomies in markets like India. Against which separate more
focussed entities would have lower costs of co-ordination and, arguably, a tighter focus
on their respective cost bases. So a net 1% of total sales seems reasonable to us.
Scoping a special dividend of €2.75 per ULVR share
We think that under a spin scenario ULVR would give serious consideration to paying a
special dividend, funded by modestly re-gearing the split businesses. The rationale would
be to offer a degree of value certainty, reward investors for historic value creation and to
deliver the sought-after (in some quarters) enhanced cash return without an apparent
volte face on buybacks.
For illustrative purposes we assume aggregate gearing post-spin of 1.5x (relative to an
anticipated 0.8x in FY18 per our forecasts) with leverage loaded disproportionately onto
We model a pure spin as a distinct
end game option from selling and
then acquiring
We model a spin of Foods vs. Foods
& Refreshment for simplicity, both at
a target ‘unbundled’ multiple for the
Group of 16.2x
Relative to the gross valuation
upside, we think there would be
€10-12bn of value destruction to get
there
We think ULVR might consider
paying a special dividend on a split.
We model €2.75 per share
UNA NA
Target | Estimate Change
15 March 2017
page 38 of 56 , Equity Analyst, +44 (0) 20 7029 8670, [email protected] Deboo
Please see important disclosure information on pages 52 - 56 of this report.

the spun-out Foods/Foods & Refreshment entity. This would generate a Special Dividend
of €2.75 per ULVR share.
Limited upsides relative to our base case
Exhibits 56, 57 and 58 present respectively a summary of our two spin scenarios and a
more detailed P&L and ratio analysis for each scenario individually.
Our spin scenarios deliver broadly similar value to our base case on a TSR basis including
dividends i.e. no further upside. This is because value destruction from the transaction
and the impact of higher leverage on the PER offsets the higher projected Enterprise
multiple. Given that incurring the transaction costs is relatively more certain than
obtaining the projected valuation, the conclusion is that it would be risky for ULVR to try
to create value from a spin relative to the alternative of optimising the status quo.
Exhibit 55: Overview of spin-out scenarios relative to the base case
Based on FY18 forecasts and relative to the NV share price on 10 March
Base case Spin out
Foods
Spin out
Foods
& Refresh
Target EV:EBITDA 15.2x 16.2x 16.2x
Gross EV of subsidiaries 171106 181823 181823
Add associates at fair value 3100 3100 3100
Gross EV of Group 174206 184923 184923
Deduct costs of separation:
Transaction costs (2% of spun revenues) (640) (1168)
PV stranded costs (3% spun sales yr. 1, 0% yr. 3) (819) (1484)
PV permanent diseconomies @ 1% of sales (9497) (9497)
Sub-total costs of separation (10956) (12149)
Net EV 174206 173967 172774
Deduct net debt (8153) (16004) (16004)
Deduct pension deficit (2632) (2632) (2632)
Deduct value of non-controlling (16311) (16311) (16311)
Equity value 147110 139020 137827
NV equity value per share 51.52 48.69 48.27
EPS 2.34 2.13 2.13
Implied PER 22.0x 22.8x 22.6x
Normal dividend 1.44 1.44 1.44
Special dividend 2.75 2.75
TSR value 52.96 52.88 52.46
TSR % 16% 16% 15%
Source: Jefferies analysis & estimates
Exhibit 56: Scenario summary for a Foods spin-out
Based on FY18 forecasts
Foods HPC &
Refresh
Total
Key metrics
Sales 13649 45148 58797
EBITDA 2619 8050 10669
Core Profit 2332 6934 9267
EPS per ULVR share (cents) 53.3 160.1 213.4
Prospective organic sales growth 2.7% 4.4% 4.0%
Core profit margin 17.1% 15.4% 15.8%
EV subsidiaries 32007 140316 172322
JV's & Associates 0 3100 3100
Total 32007 143416 175422
Neither of our spin scenarios offer
much upside to our stand-alone base
case, when costs as well as benefits
are factored in
UNA NA
Target | Estimate Change
15 March 2017
page 39 of 56 , Equity Analyst, +44 (0) 20 7029 8670, [email protected] Deboo
Please see important disclosure information on pages 52 - 56 of this report.

Exhibit 56: Scenario summary for a Foods spin-out
Based on FY18 forecasts
Foods HPC &
Refresh
Total
Less non-controlling 0 (16311) (16311)
Less net debt (5500) (10504) (16004)
Costs to achieve (271) (1188) (1459)
Pension deficit (489) (2143) (2632)
Equity value 25747 113270 139017
Equity value per ULVR share 9.02 39.67 48.69
Key ratios
EV:EBITDA 12.2x 17.4x 16.2x
Net debt:EBITDA 2.1x 1.3x 1.5x
PER 16.9x 24.8x 22.8x
Div yield 3.5% 2.4% 2.9%
FCF yield 5.4% 3.9% 4.2%
Source: Jefferies analysis & estimates
Exhibit 57: Scenario summary for a Foods & Refreshment spin-out
Based on FY18 forecasts
Foods &
Refresh
HPC Total
Key metrics
Sales 24734 34063 58797
EBITDA 4337 6332 10669
Core Profit 3585 5682 9267
EPS per ULVR share (cents) 81.3 132.1 213.4
Prospective organic sales growth 3.1% 4.6% 4.0%
Core profit margin 14.5% 16.7% 15.8%
Valuation logic
EV subsidiaries 58399 113924 172322
JV's & Associates 0 3100 3100
Total 58399 117024 175422
Less non-controlling 0 (16311) (16311)
Less net debt (9000) (7004) (16004)
Costs to achieve (899) (1753) (2652)
Pension deficit (892) (1740) (2632)
Equity value 47608 90216 137824
Equity value per ULVR share 16.67 31.59 48.27
Key ratios
EV:EBITDA 13.5x 18.0x 16.2x
Net debt:EBITDA 2.1x 1.1x 1.5x
PER 20.5x 23.9x 22.6x
Div yield 3.0% 2.4% 3.0%
FCF yield 4.7% 3.9% 4.2%
Source: Jefferies analysis & estimates
UNA NA
Target | Estimate Change
15 March 2017
page 40 of 56 , Equity Analyst, +44 (0) 20 7029 8670, [email protected] Deboo
Please see important disclosure information on pages 52 - 56 of this report.

Acquiring Colgate We have identified the vision of building a New World Order in HPC as a potential end-
game for ULVR in Exhibit 4 of this note. We think that the most effective route to realising
such an end-game would be to buy Colgate.
As long ago as February 2011 Forbes were speculating that ULVR might move for Colgate
as a route to delivering its Compass goal of doubling sales. Speculation around a bid has
rumbled around the market ever since. This has reached a fresh crescendo since the KHC
move for ULVR.
Despite this, we would view any announcement around a move for Colgate at ULVR’s
April review as highly unlikely. A move of this size would require months of planning and
evaluation and we judge it unlikely that any such plans were being made prior to
February 17. Neither is Colgate’s valuation premium to ULVR as attractive as it has been.
Finally, as we go on to argue, buying Colgate at acceptable levels of leverage would
mandate significant asset disposals by ULVR, if a dilutive equity raise is to be avoided. All
these factors say to us that now isn’t the moment to act precipitously, whatever pressure
ULVR might be under.
But if the acquisition of Colgate is indeed a desired end-game for ULVR, then the
implication for April is that ULVR won’t want to take any actions that would preclude such
an outcome. Given that we think any deal almost certainly requires offsetting and major
disposals, then this (plus the relative unattractiveness of a split) says to us that ULVR won’t
be proposing to spin-out its Foods and/or Refreshment business in April.
Put more plainly, if ULVR needs to pay a control premium for Colgate, it needs to retain a
control premium for now that it can sell to someone else.
Potential ULVR/CL combinations
We’ve assessed three scenarios under which Unilever could acquire Colgate:
Acquire Colgate with no ULVR disposals
Acquire Colgate with ULVR Foods disposal
Acquire Colgate with ULVR Foods and Refreshment disposals
In each scenario we have assumed that ULVR would exit Colgate’s Hill’s (Pet Nutrition)
business. ULVR growth and margin forecasts are as per our main model. We also reflect
scale diseconomies in scenarios where ULVR exits businesses.
Strong strategic logic Good strategic fit. Competition issues manageable
We have long been of the view that Colgate would represent an excellent strategic fit with
ULVR, for a number of reasons:
Colgate’s dominant position in Oral Care (46% of Colgate sales) remedies
ULVR’s principal strategic weakness in the broader HPC category.
Colgate’s secondary presence in categories like Laundry & Surface Care would
usefully remedy some areas of relative strategic weakness for ULVR in LatAm and
Australasia.
Colgate’s Emerging Market bias (51% of sales) complements ULVR’s and tees up
the prospect of an EM-led HPC powerhouse trading on a premium valuation
Relative to these attractions we see any competition/anti-trust issues around Colgate as
manageable. Acute competition concerns would we think be limited to Oral Care in parts
of LatAm, Deodorants in Western Europe and Laundry in Australasia.
We think Colgate represents the best
route to building a New World Order
in HPC
A ULVR/Colgate combination has
been speculated on for years
We think any announcement by
ULVR around Colgate in April is
highly unlikely…
…but think that ULVR won’t take any
actions in April that would preclude
such an outcome
We model three scenarios of a
Colgate take out
We continue to see Colgate as a
strong strategic fit with ULVR
We see any anti-trust implications as
manageable
UNA NA
Target | Estimate Change
15 March 2017
page 41 of 56 , Equity Analyst, +44 (0) 20 7029 8670, [email protected] Deboo
Please see important disclosure information on pages 52 - 56 of this report.

Exhibit 58: Market shares & impacts on concentration & competitiveness in major overlapping categories
Blue text indicates a material improvement in competitive position relative to P&G. Red text indicates a potential concentration problem
Resultant RMS1 to P&G
Unilever Colgate Unilever &
Colgate
P&G
(for ref)
ULVR stand-
alone
ULVR &
Colgate
Deos
World 35% 5% 40% 8% 4.3x 4.9x
Asia Pac 20% 1% 21% 2% 11.6x 12.1x
Australasia 65% 0% 65% 5% 13.9x 13.9x
Eastern Europe 23% 7% 30% 8% 2.9x 3.7x
LatAm 39% 4% 43% 4% 9.5x 10.5x
Middle East Africa 32% 5% 37% 4% 8.9x 10.3x
North America 34% 6% 41% 31% 1.1x 1.3x
Western Europe 38% 5% 43% 2% 17.2x 19.6x
Hair
World 14% 1% 16% 20% 0.7x 0.8x
Asia Pac 15% 1% 16% 23% 0.7x 0.7x
Australasia 16% 4% 20% 23% 0.7x 0.9x
Eastern Europe 9% 1% 10% 17% 0.6x 0.6x
LatAm 20% 4% 24% 17% 1.1x 1.4x
Middle East Africa 13% 1% 14% 18% 0.7x 0.8x
North America 17% 17% 22% 0.8x 0.8x
Western Europe 8% 0% 8% 18% 0.4x 0.5x
Skin
World 5% 5% 5% 1.2x 1.2x
Asia Pac 5% 5% 5% 0.9x 0.9x
Australasia 5% 5% 9% 0.6x 0.6x
Eastern Europe 9% 9% 1% 6.4x 6.4x
LatAm 7% 7% 0% 23.3x 23.3x
Middle East Africa 14% 14% 4% 3.3x 3.3x
North America 5% 5% 7% 0.8x 0.8x
Western Europe 3% 3% 3% 1.1x 1.1x
Oral
World 7% 27% 34% 19% 0.4x 1.8x
Asia Pac 9% 24% 33% 11% 0.8x 2.9x
Australasia 0% 46% 46% 14% 0.0x 3.2x
Eastern Europe 8% 27% 35% 19% 0.4x 1.9x
LatAm 6% 51% 57% 16% 0.4x 3.5x
Middle East Africa 21% 26% 47% 14% 1.5x 3.3x
North America 0% 18% 18% 34% 0.0x 0.5x
Western Europe 8% 19% 28% 19% 0.4x 1.5x
Laundry
World 15% 2% 17% 27% 0.6x 0.6x
Asia Pac 17% 1% 18% 15% 1.1x 1.2x
Australasia 27% 32% 59%
Eastern Europe 2% 2% 38% 0.1x 0.1x
LatAm 27% 4% 31% 20% 1.3x 1.5x
Middle East Africa 19% 2% 22% 19% 1.0x 1.1x
North America 2% 2% 54% 0.0x 0.0x
Western Europe 17% 2% 20% 25% 0.7x 0.8x
Surface
World 6% 8% 14% 11% 0.6x 1.3x
Asia Pac 4% 0% 4% 1% 4.4x 4.9x
Australasia 4% 20% 23%
Eastern Europe 14% 5% 19% 13% 1.1x 1.4x
LatAm 5% 20% 25% 2% 3.0x 15.6x
Middle East Africa 14% 2% 16% 4% 3.7x 4.3x
North America 0% 3% 4% 22% 0.0x 0.2x
Western Europe 11% 9% 20% 15% 0.7x 1.3x
Source: Euromonitor; Jefferies analysis 1. RMS (Relative Market Share) is the market share of ULVR or a ULVR combination relative to P&G
UNA NA
Target | Estimate Change
15 March 2017
page 42 of 56 , Equity Analyst, +44 (0) 20 7029 8670, [email protected] Deboo
Please see important disclosure information on pages 52 - 56 of this report.

Modelling a deal Valuation gap currently relative unattractive
CL is close to a peak valuation, reflecting in part bid spec subsequent to the ULVR/KHC
announcement, which put 4% on Colgate’s share price on the day. However even
without this Colgate’s premium to ULVR has been high by historic standards.
Exhibit 59: ULVR and CL PER since 2008
Prospective 12 months basis
Source: Factset: Jefferies analysis
Exhibit 60: Colgate PER premium to ULVR since 2008
Turns of PER. Prospective 12 months basis
Source: Factset: Jefferies analysis
Colgate, Unilever and Universal merger assumptions
Our base-case analysis is based on the following assumptions. We later provide
sensitivities on disposal multiples for Foods and Refreshment, as well as Colgate synergies.
Assessment of capital raise requirements required to stay within desired leverage (≤4.0x
net debt/EBITDA) is also included in our analysis.
Exhibit 61: Deal model assumptions
Colgate Unilever disposals Universal assumptions
Bid price ($) 90.00 Exit EV/EBITDA Synergies as % CL sales 8%
Offer equity ($bn) 79.4 Foods 11.0x1 Cost of net debt 4%
PER FY18 23.6x Refreshment 16.0x2 ULVR tax rate 26%
EV/EBITDA FY18 17.5x Foods and Refreshment 13.0x CL tax rate 31%
Hill's disposal Exit EV’s ULVR diseconomies on exits3 (1.0%)
EV/EBITDA 15.0x Foods (€bn) 30.3 Target leverage cap 4.0x
Exit EV ($bn) 11.8 Refreshment (€bn) 29.3 EURUSD 1.06
Foods and Refreshment (€bn) 59.6
Source: Jefferies estimates, company data 1,2 These multiples reflect a modest control premium over and above the organic multiples for ULVR Foods & Refreshment in Exhibit 43. 3 Applied to surviving ULVR sales where Foods and/or Refreshment are disposed
Colgate assumptions
A $90 bid price equates to a 30% premium to the undisturbed share price prior to 17
February (23% to spot), resolving to a 23.6x FY18 P/E and 17.5x EV/EBITDA. Our base case
assumption for Hill’s is a 15x exit multiple, resulting in an EV of $11.8bn (€11.1bn).
10x
12x
14x
16x
18x
20x
22x
24x
26x
'08 '09 '10 '11 '12 '13 '14 '15 '16 '17
ULVR-GB CL-US
-1.0 x
0.0 x
1.0 x
2.0 x
3.0 x
4.0 x
5.0 x
6.0 x
'08 '09 '10 '11 '12 '13 '14 '15 '16 '17
CL PE premium to ULVR 30 period average
The valuation gap between ULVR &
Colgate is currently wide
We model the deal on the basis of
detailed assumptions
We model $90 per Colgate share as
our central scenario
UNA NA
Target | Estimate Change
15 March 2017
page 43 of 56 , Equity Analyst, +44 (0) 20 7029 8670, [email protected] Deboo
Please see important disclosure information on pages 52 - 56 of this report.

Resultant accretion & impact on ULVR Implications on leverage and return
Potential ULVR disposals reduce EPS accretion, but the benefit is more sensible leverage.
There are also differential impacts on ULVR’s portfolio mix. Given the uncertainties, we
think it’s useful to model a range of possibilities and sensitivities.
Earnings accretion & valuation
Exhibit 63 sets out the key deal metrics across our principal scenarios.
Exhibit 62: Prospective integrated ULVR/Colgate FY18 P&L under different deal scenarios
Line item ULVR base All cash/no new
ULVR equity
4x leverage cap
new ULVR equity of 13%
of market cap
Exit
ULVR Foods
Exit ULVR
Foods & Refresh
Sales (€bn) 58.8 71.8 71.8 58.1 47.0
EBIT (€bn) 9.9 14.3 14.3 11.4 10.2
EPS (€) 2.34 2.97 2.75 2.40 2.34
Net Debt/ EBITDA1 0.7x 5.1x 4.0x 3.8x 1.6x
EPS accretion - 27% 17% 3% 0%
EV/EBITDA2 13.8x 13.8x 13.8x 14.9x 14.6x
PER1 19.6x 15.4x 16.6 19.0x 19.5x
Source: Jefferies analysis, company data 1 Excludes synergies i.e. peak leverage immediately post-deal 2 At current ULVR share price
The resulting ULVR+CL multiples of the combined entity vary depending on the multiples
achieved when selling Unilever’s Food and Refreshment Businesses (see exhibit 63).
Exhibit 63: ULVR Colgate Multiple sensitivities to Foods and Refreshment selling prices
Foods exit EV/EBITDA multiple 9.0x 10.0x 11.0x 12.0x 13.0x 14.0x
ULVR + CL multiple 15.3x 15.1x 14.9x 14.7x 14.5x 14.3x
Foods and Refreshment exit EV/EBITDA multiple 11.0x 12.0x 13.0x 14.0x 15.0x 16.0x
ULVR + CL multiple 15.4x 15.0x 14.6x 14.2x 13.8x 13.3x
Source: Jefferies estimates, company data
Colgate not realistically do-able for cash without offsetting disposals
Buying Colgate for cash with no offsetting disposals is the most straightforward scenario.
However net debt:EBITDA of 5.1x post-deal feels too high to us. The alternative scenario is
to complete the acquisition with an equity raise. We model a scenario where net
debt:EBITDA post-deal is capped to 4.0x. This would require ULVR to issue new equity
equivalent to 13% of its current market cap. Were ULVR Foods to be disposed, we think
the deal could be completed for cash – resulting in 3.8x leverage and 2.7% accretion.
Were Refreshment to be disposed of in addition to food, would be 1.6x with no accretion.
Towards a pure play HPC business
Exhibit 65 below shows the combined sales mix under each scenario, including the Oral
Care category. Acquiring Colgate with no offsetting disposals contributes 8pp of
incremental HPC sales (including Oral Care) on top of ULVR’s existing 58% (i.e. the
combined company would be 66% exposed to HPC). If ULVR exits Foods or Foods &
Refreshment, HPC rises as a proportion of sales to 81% and 100% respectively.
We project between 0% & 27% EPS
accretion depending on scenario
We think an all cash offer for Colgate
with no offsetting disposals would
be unrealistic
All scenarios would increase ULVR’s
exposure to the HPC category
UNA NA
Target | Estimate Change
15 March 2017
page 44 of 56 , Equity Analyst, +44 (0) 20 7029 8670, [email protected] Deboo
Please see important disclosure information on pages 52 - 56 of this report.

Exhibit 64: ULVR & Colgate combined sales profiles x category
% HPC sales: 58% 100% 66% 81% 100%
Source: Jefferies analysis, company data
Scenario impact on geographic mix
Turning to the impact on geographic mix, acquiring Colgate with no offsetting disposals
has no material impact on ULVR’s EM profile, reflecting Colgate’s broadly similar one.
Disposing of Foods and/or Foods and Refreshment would increase EM’s as a proportion of
sales to well over 60%.
Exhibit 65: ULVR & Colgate combined sales profiles x geography
% EM sales: 57% 56% 56% 65% 67%
Source: Jefferies estimates, company data
Puts combined entity on a potentially compelling valuation
We think that a ULVR/Colgate combination could trade on between €53 & €56 per ULVR
NV share, depending on scenario. We regard these valuations as indicative only and they
do not determine our price target for ULVR.
Exhibit 66 sets out our assumptions, within which the critical ones are a fair EV:EBITDA
multiple for HPC (both ULVR & ex-Colgate) of 16.5x (equivalent to Colgate’s current
multiple) and a valuation of 11x EBITDA for ULVR Foods and 16x for Refreshment under
both retain and exit scenarios. An all-cash offer with no disposals is technically the value-
3%
55%
13% 16% 19% 23%
19%
19% 15%
19%
20%
22%
20%
25%
31%
35% 23%
33% 41%
50%
0%
10%
20%
30%
40%
50%
60%
70%
80%
90%
100%
Unilever Colgate (ex-Hills) No disposals Food Food +
Refreshment
Oral Care Foods Refreshment Home Care Personal care
27% 21%
26% 19% 17%
32%
18%
29% 37% 37%
19%
23%
20% 19% 19%
14%
31%
17% 20% 22%
8% 7% 8% 5% 4%
0%
10%
20%
30%
40%
50%
60%
70%
80%
90%
100%
Unilever Colgate (ex-Hills) ULVR & CL Exit Foods Exit Foods and
Refresh
Europe Asia NorthAm LatAm MEA
Exiting Foods would concentrate
ULVR’s EM exposure
We think that various ULVR/Colgate
combinations could trade
indicatively at €53-56 per ULVR share
UNA NA
Target | Estimate Change
15 March 2017
page 45 of 56 , Equity Analyst, +44 (0) 20 7029 8670, [email protected] Deboo
Please see important disclosure information on pages 52 - 56 of this report.

optimal solution from an equity point of view. However all scenarios are close and in
practice would need to be resolved on the grounds of strategic logic and the ultimate
values of any disposals.
Exhibit 66: Indicative valuation scenarios at $90 per Colgate share
All cash ULVR
Equity
Raise
Exit
ULVR
Foods
Exit ULVR
Foods &
Refresh
Target EV:EBITDA multiple
ULVR HPC 16.5x 16.5x 16.5x 16.5x
ULVR Foods 11.0x 11.0x 11.0x 11.0x
ULVR Refreshment 16.0x 16.0x 16.0x 16.0x
Colgate 16.5x 16.5x 16.5x 16.5x
CL Hill's Pet Nutrition 15.0x 15.0x 15.0x 15.0x
Synergies 16.5x 16.5x 16.5x 16.5x
Dis-synergies 16.5x 16.5x 16.5x 16.5x
Total 15.6x 15.6x 16.5x 16.6x
FY18E EBITDA
ULVR HPC 6673 6673 6673 6673
ULVR Foods 2755 2755
ULVR Refreshment 1829 1829 1829
Colgate 4557 4557 4557 4557
CL Hill's Pet Nutrition (743) (743) (743) (743)
Synergies 1150 1150 1150 1150
Dis-synergies 0 0 (516) (389)
Total 16221 16221 12950 11247
Valuation
ULVR HPC 110098 110098 110098 110098
ULVR Foods 30310 30310
ULVR Refreshment 29229 29229 29229
Colgate Hill's 75184 75184 75184 75184
CL Hill's Pet Nutrition (11140) (11140) (11140) (11140)
Synergies 18971 18971 18971 18971
Dis-synergies 0 0 (8509) (6420)
Enterprise Value 252651 252651 213832 186692
+ Associates 3100 3100 3100 3100
- Minorities (16311) (16311) (16311) (16311)
- Net debt (76686) (60284) (46376) (17113)
- IAS19 (2902) (2902) (2902) (2902)
Equity value 159852 176254 151343 153466
No ULVR shares 2,855 3,214 2,855 2,855
Value per NV share 55.98 54.84 53.00 53.75
EPS 2.97 2.75 2.40 2.34
PER 18.9x 20.0x 22.1x 23.0x
Net debt/EBITDA1 5.1x 4.0x 3.8x 1.6x
Source: Jefferies analysis 1 Excludes synergies i.e. peak leverage immediately post-deal
No ULVR disposals sensitivity analysis
As we have observed, an outright purchase of Colgate without offsetting disposals would
lead to what we think would be an unsustainable level of leverage. Thus we would see
the requirement for an equity raise. Our base case assumption of a $90 bid implies 26% of
the offer would need to be equity, equating to €16.4bn, or c. 13% of ULVR’s market cap.
Capping leverage and with no
disposals implies progressively more
dilution for ULVR shareholders
UNA NA
Target | Estimate Change
15 March 2017
page 46 of 56 , Equity Analyst, +44 (0) 20 7029 8670, [email protected] Deboo
Please see important disclosure information on pages 52 - 56 of this report.

Exhibit 67: Sensitivity of capital structure & EPS accretion to Colgate offer price, constrained to 4x net debt:EBITDA
Offer price per CL share ($) $85.00 $90.00 $92.50 $95.00 $97.50 $100.00
Cash portion (€m) 47,344 47,344 47,344 47,344 47,344 47,344
Cash % of offer 79% 74% 72% 70% 68% 66%
Equity portion (€m) 12,242 16,403 18,483 20,563 22,643 24,723
New ULVR equity % of Colgate offer 21% 26% 28% 30% 32% 34%
New ULVR equity % of ULVR market cap 9% 13% 14% 16% 17% 19%
Share issued (m) 268 359 404 449 495 540
EPS (€) 2.83 2.75 2.71 2.67 2.64 2.60
EPS accretion 21% 17% 16% 14% 13% 11%
Source: Jefferies estimates, company data
The €16.4bn could also come via disposal of select assets. Exhibit 68 below provides some
analysis of how much of ULVR’s sales would need to be sold to achieve that, with some
sensitivities provided around exit multiples.
This implies anything from 10-20% of ULVR’s sales would need to be disposed of to avoid
an equity raise being required to keep leverage at 4.0x.
Exhibit 68: Disposals required to lower leverage to 4x (i.e. raise €16.4bn)
Exit EBITDA multiple EBITDA Implied sales at
18% margin
% ULVR sales
8.0x 2,050 11,391 19%
9.0x 1,823 10,125 17.2%
10.0x 1,640 9,113 15.5%
11.0x 1,491 8,284 14.1%
12.0x 1,367 7,594 12.9%
13.0x 1,262 7,010 11.9%
14.0x 1,172 6,509 11.1%
15.0x 1,094 6,075 10.3%
Source: Jefferies analysis
Colgate plus ULVR Foods disposal sensitivity analysis
An acquisition could be made all cash under most cases where ULVR disposes of its Foods
business without leverage exceeding 4.0x. Our base case assumptions outline a $90 offer
for CL and a Foods exit multiple of 11x, resolving to the leverage (3.8x) and accretion
(c3%) highlighted below. Numbers marked red show where equity raises would be
required in order to maintain 4.0x leverage.
Capping leverage to 4x with no
equity issue would require the
disposal of 10-20% of ULVR sales
Disposing of ULVR Foods would
facilitate the acquisition of Colgate
for cash
UNA NA
Target | Estimate Change
15 March 2017
page 47 of 56 , Equity Analyst, +44 (0) 20 7029 8670, [email protected] Deboo
Please see important disclosure information on pages 52 - 56 of this report.

Exhibit 69: Food disposals sensitivities
Source: Jefferies analysis, company data
Base case assumed 11.0x Food
Colgate plus ULVR Foods & Refreshment disposal sensitivity analysis
Leverage is not an issue when Foods & Refreshment are disposed, given the extent of the
disposal proceeds. Even at our lowest assumed exit multiple and $100 offer price, net
debt:EBITDA doesn’t exceed 4x. Most scenarios are earnings-dilutive, but we would
expect this to be offset in terms of valuation by much lower leverage.
Exhibit 70: Food and refreshment disposals sensitivities
Source: Jefferies analysis, company data
Base case assumes 13.0x combined Food and Refreshment
Net debt/EBITDA all cash
$85.00 $90.00 $92.50 $95.00 $97.50 $100
8.0x 4.1x 4.4x 4.6x 4.8x 4.9x 5.1x9.0x 3.9x 4.2x 4.4x 4.6x 4.7x 4.9x
10.0x 3.7x 4.0x 4.2x 4.3x 4.5x 4.7x
11.0x 3.4x 3.8x 3.9x 4.1x 4.3x 4.4x
12.0x 3.2x 3.5x 3.7x 3.9x 4.0x 4.2x
13.0x 3.0x 3.3x 3.5x 3.7x 3.8x 4.0x
14.0x 2.8x 3.1x 3.3x 3.4x 3.6x 3.8x
15.0x 2.5x 2.9x 3.0x 3.2x 3.4x 3.5x
EPS accretion all cash $85.00 $90.00 $92.50 $95.00 $97.50 $100
8.0x n/a n/a n/a n/a n/a n/a
9.0x 2.2% n/a n/a n/a n/a n/a
10.0x 3.1% 1.8% 1.1% n/a n/a n/a
11.0x 4.1% 2.7% 2.0% n/a n/a n/a
12.0x 5.0% 3.6% 2.9% 2.2% n/a n/a
13.0x 5.9% 4.5% 3.8% 3.1% 2.5% 1.8%
14.0x 6.8% 5.4% 4.7% 4.0% 3.4% 2.7%
15.0x 7.7% 6.3% 5.6% 4.9% 4.3% 3.6%Fo
od
s e
xit
mu
ltip
le
Offer price
Offer price
Fo
od
s e
xit
mu
ltip
le
Net debt/EBITDA all cash
85.00 90.00 92.50 95.00 97.50 100
10.0x 2.5x 2.9x 3.1x 3.3x 3.5x 3.7x
11.0x 2.1x 2.5x 2.7x 2.9x 3.1x 3.3x
12.0x 1.7x 2.1x 2.3x 2.5x 2.7x 2.9x
13.0x 1.2x 1.6x 1.8x 2.0x 2.2x 2.4x
14.0x 0.8x 1.2x 1.4x 1.6x 1.8x 2.0x
15.0x 0.4x 0.8x 1.0x 1.2x 1.4x 1.5x
16.0x -0.1x 0.3x 0.5x 0.7x 0.9x 1.1x
EPS accretion all cash
85.00 90.00 92.50 95.00 97.50 100
10.0x -3.1% -4.5% -5.1% -5.8% -6.5% -7.2%
11.0x -1.6% -3.0% -3.7% -4.3% -5.0% -5.7%
12.0x -0.1% -1.5% -2.2% -2.8% -3.5% -4.2%
13.0x 1.4% 0.0% -0.7% -1.3% -2.0% -2.7%
14.0x 2.9% 1.5% 0.8% 0.2% -0.5% -1.2%
15.0x 4.4% 3.0% 2.3% 1.6% 1.0% 0.3%
16.0x 5.9% 4.5% 3.8% 3.1% 2.5% 1.8%
Fo
od
s &
refr
esh
me
nt
ex
it
mu
ltip
le
Offer price (USD)
Offer price (USD)
Fo
od
s &
refr
esh
me
nt
ex
it
mu
ltip
le
Disposing of ULVR Foods &
Refreshment would facilitate the
disposal of Colgate for broadly
unchanged leverage
UNA NA
Target | Estimate Change
15 March 2017
page 48 of 56 , Equity Analyst, +44 (0) 20 7029 8670, [email protected] Deboo
Please see important disclosure information on pages 52 - 56 of this report.

Changes to forecasts
Exhibit 71: Forecast changes for UNA.NA/ULVR.LN
Source: Jefferies analysis & estimates
Divisional sales & margin drivers
Exhibit 72: Divisional sales drivers
Source: Jefferies analysis & estimates
FY17E New FY 17E Old % Chg FY18E New FY18E Old % Chg
Sales 56351 55224 2.0% 58797 57477 2.3%
Organic growth 3.8% 3.8% (0bps) 4.1% 4.1% (0bps)
EBIT 8997 8671 3.8% 9855 9380 5.1%
U'lying margin 16.0% 15.7% 26bps 16.8% 16.3% 44bps
EPS (€c, UNA) €211c €202c 4.2% €234c €222c 5.6%
EPS (£p, ULVR) 180p 172p 4.8% 201p 189p 6.3%
Net debt 10230 10511 (2.7%) 8153 8738 (6.7%)
Drivers of Change
Forecasts ( Euro m)
We reflect latest fx and move our margin expectations to the top end of the 40-80bps pa guidance
range for the FY17 - FY19 period.
FY-15 FY-16 1Q-17E 2Q-17E 3Q-17E 4Q-17E H1-17E H2-17E FY-17E FY-18E FY-19E
Total Group
Revenue €m 53,272 52,713 13,193 14,760 14,307 14,091 27,952 28,398 56,351 58,797 61,331
Volume/mix 2.1% 0.9% (1.9%) 0.7% 1.8% 3.5% (0.5%) 2.6% 1.0% 2.0% 2.2%
Price 2.0% 2.8% 3.4% 3.0% 2.4% 2.4% 3.2% 2.4% 2.8% 2.1% 2.1%
Organic growth 4.1% 3.7% 1.5% 3.7% 4.2% 5.9% 2.6% 5.0% 3.8% 4.1% 4.3%
M&A (0.1%) 0.5% 0.2% 0.2% 0.1% 0.2% 0.2% 0.2% 0.2% 0.0% 0.0%
Forex 6.0% (5.3%) 3.4% 3.6% 2.6% 1.9% 3.5% 2.3% 2.9% 0.2% 0.0%
Total 10.0% (1.0%) 5.1% 7.5% 6.9% 8.0% 6.4% 7.4% 6.9% 4.3% 4.3%
Per Region FY-15 FY-16 1Q-17A 2Q-17A 3Q-17A 4Q-17E H1-17A H2-17E FY-17E FY-18E FY-19E
Asia AMET RUB
Revenue €m 22,425 22,445 5,875 6,356 6,127 6,021 12,231 12,148 24,379 25,657 26,940
Volume/mix 3.0% 2.1% (0.9%) 1.2% 3.9% 4.3% 0.2% 4.1% 2.1% 3.0% 3.0%
Price 1.5% 2.5% 6.0% 5.0% 3.5% 3.0% 5.5% 3.3% 4.4% 2.0% 2.0%
Organic growth 4.6% 4.6% 5.1% 6.2% 7.4% 7.3% 5.7% 7.3% 6.5% 5.0% 5.0%
Americas
Revenue €m 17,294 17,105 4,350 4,796 4,678 4,883 9,145 9,561 18,707 19,610 20,590
Volume/mix 0.4% (0.2%) (2.3%) 0.5% (0.6%) 2.0% (0.9%) 0.7% (0.0%) 1.5% 2.0%
Price 6.1% 6.3% 2.1% 1.9% 2.0% 2.6% 2.0% 2.3% 2.2% 3.0% 3.0%
Organic growth 6.6% 6.1% (0.3%) 2.4% 1.4% 4.6% 1.1% 3.0% 2.1% 4.5% 5.0%
Europe
Revenue €m 13,553 13,163 2,968 3,608 3,502 3,187 6,576 6,689 13,264 13,530 13,800
Volume/mix 2.6% 0.3% (3.2%) 0.2% 1.5% 4.1% (1.4%) 2.7% 0.6% 1.0% 1.0%
Price (2.2%) (1.1%) 0.5% 1.0% 1.0% 1.0% 0.8% 1.0% 0.9% 1.0% 1.0%
Organic growth 0.3% (0.8%) (2.7%) 1.2% 2.5% 5.1% (0.6%) 3.7% 1.5% 2.0% 2.0%
UNA NA
Target | Estimate Change
15 March 2017
page 49 of 56 , Equity Analyst, +44 (0) 20 7029 8670, [email protected] Deboo
Please see important disclosure information on pages 52 - 56 of this report.

Exhibit 73: Divisional profit & margin forecasts
Source: Jefferies analysis & estimates
Detailed financial forecasts
Exhibit 74: Profit & loss forecasts (€m unless otherwise stated)
2015 2016 2017F 2017F -
cons. fx
2018F 2019F 2020F
Asia AMET RUB 22425 22445 24379 23903 25657 26940 28287
Americas 17294 17105 18707 17567 19610 20590 21620
Europe 13553 13163 13264 13361 13530 13800 14076
Sales 53272 52713 56351 54831 58797 61331 63983
Asia AMET RUB 3035 3294 3756 3687 4158 4581 5036
Americas 2517 2726 3107 2932 3412 3745 4104
Europe 2313 2026 2134 2151 2285 2442 2604
Core op. profit 7865 8046 8997 8770 9855 10768 11744
JV's & Assocs 198 231 159 159 164 169 174
Net financing (493) (563) (471) (471) (402) (333) (252)
Adjusted PBT 7570 7714 8684 8458 9617 10605 11666
Adjusted tax (2010) (1981) (2302) (2241) (2552) (2818) (3103)
Non-controlling (350) (363) (373) (373) (383) (393) (403)
Net income 5210 5370 6010 5844 6682 7394 8160
Core EPS (FD) €1.82 €1.88 €2.11 €2.05 €2.34 €2.59 €2.86
DPS €1.20 €1.24 €1.33 €1.33 €1.43 €1.56 €1.69
Source: Jefferies analysis & estimates
€m FY-15 FY-16 H1-17E H2-17E FY-17E FY-18E FY-19E
Revenues
Asia AMET RUB 22,425 22,445 12,231 12,148 24,379 25,657 26,940
Americas 17,294 17,105 9,145 9,561 18,707 19,610 20,590
Europe 13,553 13,163 6,576 6,689 13,264 13,530 13,800
Total 53,272 52,713 27,952 28,398 56,351 58,797 61,331
Core operating profit
Asia AMET RUB 3,035 3,294 1,775 1,981 3,756 4,158 4,581
Americas 2,517 2,726 1,307 1,799 3,107 3,412 3,745
Europe 2,313 2,026 1,185 949 2,134 2,285 2,442
Total 7,865 8,046 4,267 4,729 8,997 9,855 10,768
Core Margin (%)
Asia AMET RUB 13.5% 14.7% 14.5% 16.3% 15.4% 16.2% 17.0%
Americas 14.6% 15.9% 14.3% 18.8% 16.6% 17.4% 18.2%
Europe 17.1% 15.4% 18.0% 14.2% 16.1% 16.9% 17.7%
Total 14.8% 15.3% 15.3% 16.7% 16.0% 16.8% 17.6%
Core profit profile
Asia AMET RUB 39% 41% 42% 42% 42% 42% 43%
Americas 32% 34% 31% 38% 35% 35% 35%
Europe 29% 25% 28% 20% 24% 23% 23%
UNA NA
Target | Estimate Change
15 March 2017
page 50 of 56 , Equity Analyst, +44 (0) 20 7029 8670, [email protected] Deboo
Please see important disclosure information on pages 52 - 56 of this report.

Exhibit 75: Cashflow & net debt forecasts (€m unless otherwise stated)
2015 2016 2017F 2017F -
cons. fx
2018F 2019F 2020F
Core op. profit 7865 8046 8997 8770 9855 10768 11744
D&A 1370 1464 1387 1387 1402 1432 1466
EBITDA 9235 9510 10384 10157 11257 12200 13210
Share based payments 150 198 170 170 180 190 200
Investment in NWC 720 51 118 118 124 133 142
Cash restructuring (133) 0 (100) (100) (100) (100) (100)
Cash taxation (2021) (2251) (2393) (2329) (2551) (2816) (3102)
Other (621) (461) (350) (350) (350) (350) (350)
Operating cashflow 7330 7047 7828 7665 8560 9257 10000
Net capex (2074) (1878) (1809) (1809) (1870) (1933) (2000)
Net M&A (1584) (1701) 546 546 0 0 0
Other 0 286 331 331 130 135 140
C'flow pre-financing 3672 3754 6897 6734 6820 7458 8141
Cash interest (460) (367) (391) (391) (322) (253) (172)
Dividends (3404) (3609) (3786) (3786) (4076) (4437) (4815)
Other financial (1413) (887) (336) (336) (345) (354) (363)
Change in net debt (1605) (1109) 2384 2221 2077 2416 2791
Opening net (debt/cash) (12722) (11505) (12614) (12614) (10230) (8153) (5738)
Closing net debt (14327) (12614) (10230) (10393) (8153) (5738) (2946)
Source: Jefferies analysis & estimates
Exhibit 76: Key ratios (priced at €45.65 for the NV on 14 March 2017)
2015 2016F 2017F 2018F 2019F 2020F
Growth & margin
Organic sales growth 4.1% 3.7% 3.8% 4.1% 4.3% 4.3%
Core operating margin 14.8% 15.3% 16.0% 16.8% 17.6% 18.4%
Core margin progress (bps) 27 50 70 80 80 80
Financial
Average net debt:EBITDA 1.5x 1.3x 1.1x 0.8x 0.6x 0.3x
Year-end net debt:EBITDA 1.6x 1.3x 1.0x 0.7x 0.5x 0.2x
EBITDA interest cover 20.1x 25.9x 26.5x 34.9x 48.3x 76.9x
Adjusted tax rate 27.3% 26.5% 27.0% 27.0% 27.0% 27.0%
DPS growth 6.5% 3.1% 7.9% 7.6% 8.8% 8.5%
Dividend payout ratio 66% 66% 63% 61% 60% 59%
Cash dividend cover 0.8x 0.8x 1.6x 1.5x 1.5x 1.6x
Profit & return
Core margin, post tax 10.7% 11.2% 11.7% 13.4% 12.8% 0.0%
Asset turn 1.8x 1.6x 1.7x 1.7x 1.8x 1.8x
ROIC (post-tax) 19.1% 18.0% 20.1% 21.8% 23.5% 25.3%
Trading NWC days (6) (7) (6) (7) (7) (8)
Operating cash conversion (operating cashflow pre-tax & financing/core profit)
Pre-capex 119% 116% 114% 113% 112% 112%
Post-capex 93% 92% 94% 94% 94% 95%
Capex:depreciation 1.9x 1.3x 1.5x 1.6x 1.6x 1.6x
Valuation
PER 25.2x 24.4x 21.8x 19.6x 17.7x 16.1x
Dividend yield 2.6% 2.7% 2.9% 3.1% 3.4% 3.7%
FCF yield (ex. M&A) 3.7% 3.9% 4.6% 5.0% 5.5% 6.1%
Source: Jefferies analysis & estimates
UNA NA
Target | Estimate Change
15 March 2017
page 51 of 56 , Equity Analyst, +44 (0) 20 7029 8670, [email protected] Deboo
Please see important disclosure information on pages 52 - 56 of this report.

Company DescriptionUnilever is one of the leading European Food & Beverage and Home & Personal Care companies, with 2012 revenues of €51.3bn. The Food& Beverage part of the business accounted for 47% of 2012 sales and includes global brands such as Knorr, Hellmann's, Lipton, Becel andMagnum. The Personal Care division, with brands such as Dove, Lux, Axe and Sunsilk contributed 35% to group revenues in 2011, while theHome Care division accounted for the remaining 18% with brands like Omo, Cif and Domestos.
Unilever is one of the leading European Food & Beverage and Home & Personal Care companies, with 2011 revenues of €46.5bn. The Food& Beverage part of the business accounted for 49% of 2011 sales and includes global brands such as Knorr, Hellmann's, Lipton, Becel andMagnum. The Personal Care division, with brands such as Dove, Lux, Axe and Sunsilk contributed 33% to group revenues in 2011, while theHome Care division accounted for the remaining 18% with brands like Omo, Cif and Domestos.
Analyst Certification:I, Martin Deboo, certify that all of the views expressed in this research report accurately reflect my personal views about the subject security(ies) andsubject company(ies). I also certify that no part of my compensation was, is, or will be, directly or indirectly, related to the specific recommendationsor views expressed in this research report.I, James Letten, certify that all of the views expressed in this research report accurately reflect my personal views about the subject security(ies) andsubject company(ies). I also certify that no part of my compensation was, is, or will be, directly or indirectly, related to the specific recommendationsor views expressed in this research report.Registration of non-US analysts: Martin Deboo is employed by Jefferies International Limited, a non-US affiliate of Jefferies LLC and is not registered/qualified as a research analyst with FINRA. This analyst(s) may not be an associated person of Jefferies LLC, a FINRA member firm, and therefore maynot be subject to the NASD Rule 2241 and Incorporated NYSE Rule 472 restrictions on communications with a subject company, public appearancesand trading securities held by a research analyst.Registration of non-US analysts: James Letten is employed by Jefferies International Limited, a non-US affiliate of Jefferies LLC and is not registered/qualified as a research analyst with FINRA. This analyst(s) may not be an associated person of Jefferies LLC, a FINRA member firm, and therefore maynot be subject to the NASD Rule 2241 and Incorporated NYSE Rule 472 restrictions on communications with a subject company, public appearancesand trading securities held by a research analyst.As is the case with all Jefferies employees, the analyst(s) responsible for the coverage of the financial instruments discussed in this report receivescompensation based in part on the overall performance of the firm, including investment banking income. We seek to update our research asappropriate, but various regulations may prevent us from doing so. Aside from certain industry reports published on a periodic basis, the large majorityof reports are published at irregular intervals as appropriate in the analyst's judgement.
Investment Recommendation Record(Article 3(1)e and Article 7 of MAR)
Recommendation Published , 17:16 ET. March 14, 2017Recommendation Distributed , 05:00 ET. March 15, 2017
Company Specific DisclosuresFor Important Disclosure information on companies recommended in this report, please visit our website at https://javatar.bluematrix.com/sellside/Disclosures.action or call 212.284.2300.
Explanation of Jefferies RatingsBuy - Describes securities that we expect to provide a total return (price appreciation plus yield) of 15% or more within a 12-month period.Hold - Describes securities that we expect to provide a total return (price appreciation plus yield) of plus 15% or minus 10% within a 12-month period.Underperform - Describes securities that we expect to provide a total return (price appreciation plus yield) of minus 10% or less within a 12-monthperiod.The expected total return (price appreciation plus yield) for Buy rated securities with an average security price consistently below $10 is 20% or morewithin a 12-month period as these companies are typically more volatile than the overall stock market. For Hold rated securities with an averagesecurity price consistently below $10, the expected total return (price appreciation plus yield) is plus or minus 20% within a 12-month period. ForUnderperform rated securities with an average security price consistently below $10, the expected total return (price appreciation plus yield) is minus20% or less within a 12-month period.NR - The investment rating and price target have been temporarily suspended. Such suspensions are in compliance with applicable regulations and/or Jefferies policies.CS - Coverage Suspended. Jefferies has suspended coverage of this company.NC - Not covered. Jefferies does not cover this company.Restricted - Describes issuers where, in conjunction with Jefferies engagement in certain transactions, company policy or applicable securitiesregulations prohibit certain types of communications, including investment recommendations.Monitor - Describes securities whose company fundamentals and financials are being monitored, and for which no financial projections or opinionson the investment merits of the company are provided.
Valuation MethodologyJefferies' methodology for assigning ratings may include the following: market capitalization, maturity, growth/value, volatility and expected totalreturn over the next 12 months. The price targets are based on several methodologies, which may include, but are not restricted to, analyses of marketrisk, growth rate, revenue stream, discounted cash flow (DCF), EBITDA, EPS, cash flow (CF), free cash flow (FCF), EV/EBITDA, P/E, PE/growth, P/CF,
UNA NA
Target | Estimate Change
15 March 2017
page 52 of 56 , Equity Analyst, +44 (0) 20 7029 8670, [email protected] Deboo
Please see important disclosure information on pages 52 - 56 of this report.

P/FCF, premium (discount)/average group EV/EBITDA, premium (discount)/average group P/E, sum of the parts, net asset value, dividend returns,and return on equity (ROE) over the next 12 months.
Jefferies Franchise PicksJefferies Franchise Picks include stock selections from among the best stock ideas from our equity analysts over a 12 month period. Stock selectionis based on fundamental analysis and may take into account other factors such as analyst conviction, differentiated analysis, a favorable risk/rewardratio and investment themes that Jefferies analysts are recommending. Jefferies Franchise Picks will include only Buy rated stocks and the numbercan vary depending on analyst recommendations for inclusion. Stocks will be added as new opportunities arise and removed when the reason forinclusion changes, the stock has met its desired return, if it is no longer rated Buy and/or if it triggers a stop loss. Stocks having 120 day volatility inthe bottom quartile of S&P stocks will continue to have a 15% stop loss, and the remainder will have a 20% stop. Franchise Picks are not intendedto represent a recommended portfolio of stocks and is not sector based, but we may note where we believe a Pick falls within an investment stylesuch as growth or value.
Risks which may impede the achievement of our Price TargetThis report was prepared for general circulation and does not provide investment recommendations specific to individual investors. As such, thefinancial instruments discussed in this report may not be suitable for all investors and investors must make their own investment decisions basedupon their specific investment objectives and financial situation utilizing their own financial advisors as they deem necessary. Past performance ofthe financial instruments recommended in this report should not be taken as an indication or guarantee of future results. The price, value of, andincome from, any of the financial instruments mentioned in this report can rise as well as fall and may be affected by changes in economic, financialand political factors. If a financial instrument is denominated in a currency other than the investor's home currency, a change in exchange rates mayadversely affect the price of, value of, or income derived from the financial instrument described in this report. In addition, investors in securities suchas ADRs, whose values are affected by the currency of the underlying security, effectively assume currency risk.
Other Companies Mentioned in This Report• Anheuser-Busch InBev (ABI BB: €101.00, BUY)• Nestle (NESN VX: CHF76.05, HOLD)• Reckitt Benckiser (RB/ LN: p7,333.00, BUY)• The Procter & Gamble Company (PG: $91.00, BUY)• Unilever PLC (ULVR LN: p4,042.00, BUY)
UNA NA
Target | Estimate Change
15 March 2017
page 53 of 56 , Equity Analyst, +44 (0) 20 7029 8670, [email protected] Deboo
Please see important disclosure information on pages 52 - 56 of this report.

Notes: Each box in the Rating and Price Target History chart above represents actions over the past three years in which an analyst initiated on acompany, made a change to a rating or price target of a company or discontinued coverage of a company.Legend:
I: Initiating Coverage
D: Dropped Coverage
B: Buy
H: Hold
UP: Underperform
For Important Disclosure information on companies recommended in this report, please visit our website at https://javatar.bluematrix.com/sellside/Disclosures.action or call 212.284.2300.
Distribution of RatingsIB Serv./Past 12 Mos.
Rating Count Percent Count Percent
BUY 1100 50.25% 338 30.73%HOLD 912 41.66% 181 19.85%UNDERPERFORM 177 8.09% 15 8.47%
UNA NA
Target | Estimate Change
15 March 2017
page 54 of 56 , Equity Analyst, +44 (0) 20 7029 8670, [email protected] Deboo
Please see important disclosure information on pages 52 - 56 of this report.

Other Important DisclosuresJefferies does and seeks to do business with companies covered in its research reports. As a result, investors should be aware that Jefferies may have aconflict of interest that could affect the objectivity of this report. Investors should consider this report as only a single factor in making their investmentdecision.Jefferies Equity Research refers to research reports produced by analysts employed by one of the following Jefferies Group LLC (“Jefferies”) groupcompanies:United States: Jefferies LLC which is an SEC registered firm and a member of FINRA.United Kingdom: Jefferies International Limited, which is authorized and regulated by the Financial Conduct Authority; registered in England andWales No. 1978621; registered office: Vintners Place, 68 Upper Thames Street, London EC4V 3BJ; telephone +44 (0)20 7029 8000; facsimile +44 (0)207029 8010.Hong Kong: Jefferies Hong Kong Limited, which is licensed by the Securities and Futures Commission of Hong Kong with CE number ATS546; locatedat Suite 2201, 22nd Floor, Cheung Kong Center, 2 Queen’s Road Central, Hong Kong.Singapore: Jefferies Singapore Limited, which is licensed by the Monetary Authority of Singapore; located at 80 Raffles Place #15-20, UOB Plaza 2,Singapore 048624, telephone: +65 6551 3950.Japan: Jefferies (Japan) Limited, Tokyo Branch, which is a securities company registered by the Financial Services Agency of Japan and is a memberof the Japan Securities Dealers Association; located at Hibiya Marine Bldg, 3F, 1-5-1 Yuraku-cho, Chiyoda-ku, Tokyo 100-0006; telephone +813 52516100; facsimile +813 5251 6101.India: Jefferies India Private Limited (CIN - U74140MH2007PTC200509), which is licensed by the Securities and Exchange Board of India as a MerchantBanker (INM000011443), Research Analyst (INH000000701) and a Stock Broker with Bombay Stock Exchange Limited (INB011491033) and NationalStock Exchange of India Limited (INB231491037) in the Capital Market Segment; located at 42/43, 2 North Avenue, Maker Maxity, Bandra-KurlaComplex, Bandra (East) Mumbai 400 051, India; Tel +91 22 4356 6000.This material has been prepared by Jefferies employing appropriate expertise, and in the belief that it is fair and not misleading. The information setforth herein was obtained from sources believed to be reliable, but has not been independently verified by Jefferies. Therefore, except for any obligationunder applicable rules we do not guarantee its accuracy. Additional and supporting information is available upon request. Unless prohibited by theprovisions of Regulation S of the U.S. Securities Act of 1933, this material is distributed in the United States ("US"), by Jefferies LLC, a US-registeredbroker-dealer, which accepts responsibility for its contents in accordance with the provisions of Rule 15a-6, under the US Securities Exchange Act of1934. Transactions by or on behalf of any US person may only be effected through Jefferies LLC. In the United Kingdom and European EconomicArea this report is issued and/or approved for distribution by Jefferies International Limited and is intended for use only by persons who have, or havebeen assessed as having, suitable professional experience and expertise, or by persons to whom it can be otherwise lawfully distributed. JefferiesInternational Limited Equity Research personnel are separated from other business groups and are not under their supervision or control. JefferiesInternational Limited has implemented policies to (i) address conflicts of interest related to the preparation, content and distribution of research reports,public appearances, and interactions between research analysts and those outside of the research department; (ii) ensure that research analysts areinsulated from the review, pressure, or oversight by persons engaged in investment banking services activities or other persons who might be biased intheir judgment or supervision; and (iii) promote objective and reliable research that reflects the truly held opinions of research analysts and prevents theuse of research reports or research analysts to manipulate or condition the market or improperly favor the interests of the Jefferies International Limitedor a current or prospective customer or class of customers. Jefferies International Limited may allow its analysts to undertake private consultancywork. Jefferies International Limited’s conflicts management policy sets out the arrangements Jefferies International Limited employs to manage anypotential conflicts of interest that may arise as a result of such consultancy work. Jefferies International Ltd, its affiliates or subsidiaries, may make amarket or provide liquidity in the financial instruments referred to in this investment recommendation. For Canadian investors, this material is intendedfor use only by professional or institutional investors. None of the investments or investment services mentioned or described herein is available toother persons or to anyone in Canada who is not a "Designated Institution" as defined by the Securities Act (Ontario). In Singapore, Jefferies SingaporeLimited is regulated by the Monetary Authority of Singapore. For investors in the Republic of Singapore, this material is provided by Jefferies SingaporeLimited pursuant to Regulation 32C of the Financial Advisers Regulations. The material contained in this document is intended solely for accredited,expert or institutional investors, as defined under the Securities and Futures Act (Cap. 289 of Singapore). If there are any matters arising from, orin connection with this material, please contact Jefferies Singapore Limited, located at 80 Raffles Place #15-20, UOB Plaza 2, Singapore 048624,telephone: +65 6551 3950. In Japan this material is issued and distributed by Jefferies (Japan) Limited to institutional investors only. In Hong Kong,this report is issued and approved by Jefferies Hong Kong Limited and is intended for use only by professional investors as defined in the Hong KongSecurities and Futures Ordinance and its subsidiary legislation. In the Republic of China (Taiwan), this report should not be distributed. The researchin relation to this report is conducted outside the PRC. This report does not constitute an offer to sell or the solicitation of an offer to buy any securitiesin the PRC. PRC investors shall have the relevant qualifications to invest in such securities and shall be responsible for obtaining all relevant approvals,licenses, verifications and/or registrations from the relevant governmental authorities themselves. In India this report is made available by JefferiesIndia Private Limited. In Australia this information is issued solely by Jefferies International Limited and is directed solely at wholesale clients withinthe meaning of the Corporations Act 2001 of Australia (the "Act") in connection with their consideration of any investment or investment servicethat is the subject of this document. Any offer or issue that is the subject of this document does not require, and this document is not, a disclosuredocument or product disclosure statement within the meaning of the Act. Jefferies International Limited is authorised and regulated by the FinancialConduct Authority under the laws of the United Kingdom, which differ from Australian laws. Jefferies International Limited has obtained relief underAustralian Securities and Investments Commission Class Order 03/1099, which conditionally exempts it from holding an Australian financial serviceslicence under the Act in respect of the provision of certain financial services to wholesale clients. Recipients of this document in any other jurisdictionsshould inform themselves about and observe any applicable legal requirements in relation to the receipt of this document.
This report is not an offer or solicitation of an offer to buy or sell any security or derivative instrument, or to make any investment. Any opinion orestimate constitutes the preparer's best judgment as of the date of preparation, and is subject to change without notice. Jefferies assumes no obligationto maintain or update this report based on subsequent information and events. Jefferies, its associates or affiliates, and its respective officers, directors,and employees may have long or short positions in, or may buy or sell any of the securities, derivative instruments or other investments mentioned ordescribed herein, either as agent or as principal for their own account. Upon request Jefferies may provide specialized research products or servicesto certain customers focusing on the prospects for individual covered stocks as compared to other covered stocks over varying time horizons orunder differing market conditions. While the views expressed in these situations may not always be directionally consistent with the long-term viewsexpressed in the analyst's published research, the analyst has a reasonable basis and any inconsistencies can be reasonably explained. This materialdoes not constitute a personal recommendation or take into account the particular investment objectives, financial situations, or needs of individualclients. Clients should consider whether any advice or recommendation in this report is suitable for their particular circumstances and, if appropriate,seek professional advice, including tax advice. The price and value of the investments referred to herein and the income from them may fluctuate. Pastperformance is not a guide to future performance, future returns are not guaranteed, and a loss of original capital may occur. Fluctuations in exchange
UNA NA
Target | Estimate Change
15 March 2017
page 55 of 56 , Equity Analyst, +44 (0) 20 7029 8670, [email protected] Deboo
Please see important disclosure information on pages 52 - 56 of this report.

rates could have adverse effects on the value or price of, or income derived from, certain investments. This report has been prepared independently ofany issuer of securities mentioned herein and not in connection with any proposed offering of securities or as agent of any issuer of securities. Noneof Jefferies, any of its affiliates or its research analysts has any authority whatsoever to make any representations or warranty on behalf of the issuer(s).Jefferies policy prohibits research personnel from disclosing a recommendation, investment rating, or investment thesis for review by an issuer priorto the publication of a research report containing such rating, recommendation or investment thesis. Any comments or statements made herein arethose of the author(s) and may differ from the views of Jefferies.
This report may contain information obtained from third parties, including ratings from credit ratings agencies such as Standard & Poor’s. Reproductionand distribution of third party content in any form is prohibited except with the prior written permission of the related third party. Third party contentproviders do not guarantee the accuracy, completeness, timeliness or availability of any information, including ratings, and are not responsible forany errors or omissions (negligent or otherwise), regardless of the cause, or for the results obtained from the use of such content. Third party contentproviders give no express or implied warranties, including, but not limited to, any warranties of merchantability or fitness for a particular purpose oruse. Third party content providers shall not be liable for any direct, indirect, incidental, exemplary, compensatory, punitive, special or consequentialdamages, costs, expenses, legal fees, or losses (including lost income or profits and opportunity costs) in connection with any use of their content,including ratings. Credit ratings are statements of opinions and are not statements of fact or recommendations to purchase, hold or sell securities. Theydo not address the suitability of securities or the suitability of securities for investment purposes, and should not be relied on as investment advice.
Jefferies research reports are disseminated and available primarily electronically, and, in some cases, in printed form. Electronic research issimultaneously available to all clients. This report or any portion hereof may not be reprinted, sold or redistributed without the written consent ofJefferies. Neither Jefferies nor any officer nor employee of Jefferies accepts any liability whatsoever for any direct, indirect or consequential damagesor losses arising from any use of this report or its contents.
For Important Disclosure information, please visit our website at https://javatar.bluematrix.com/sellside/Disclosures.action or call 1.888.JEFFERIES
© 2017 Jefferies Group LLC
UNA NA
Target | Estimate Change
15 March 2017
page 56 of 56 , Equity Analyst, +44 (0) 20 7029 8670, [email protected] Deboo
Please see important disclosure information on pages 52 - 56 of this report.