Embed Size (px)
Citation preview

UnileverPitch
ō
Innovation, growth, and strategyT R I N I T Y S M F
Sector Manager: Dina Abu-RahmehSenior Analyst: Cian Mulcahy
Analysts: Vivien Teszler, Iain Pollock, and Dylan Byrne
T R I N I T Y S M F
Investment Thesis
EmergingMarkets
Acceleratedevolutionofportfolio
GrowthinTargetMarket
StrongCashFlow
Business OverviewTRINITY SMF

T R I N I T Y S M F
Company Snapshot
Recommendation BUY
CurrentPrice $57.76PriceTarget $62.66Upside 9.72%
Timeline 1Year
MarketCap. 168.7Bil52wkrange 38.78- 61.62
P/E 23.4
Div.Yield 2.71%
Analyst Consensus Outperform

T R I N I T Y S M F
Unilever V.S. MSCI world index and MSCI Consumer Staples
Blue:Unilever
Red:MSCIWorldIndex
Orange:MSCIConsumerStaplesIndex
Outperform

T R I N I T Y S M F
Company OverviewLeadingtransnationalconsumersgoodcompanyandmarketerforfood,beverages,cleaningagents,andpersonalcareproductsunderknownbrandnames
Sellsproductsinmorethan190countries,operatesinover100countries,employingaround169,000people
Majormarkets:ASIA/AMET/RUB,AmericasandEurope
Organisedinto4categories;PersonalCare,Foods,HomeCare,andRefreshment
Diversifiedbrandportfolioà ownapproximately400brands
12sustainablelivingbrandsdeliverednearlyhalfofUnilever’sgrowth
38%
24%
19%
19%
RevenueBreakdownbySegment
Personalcare Foods Homecare Refreshment
38%
24%
19%
19%

T R I N I T Y S M F
Company overview- Segments and Markets
80%ofsalesinemergingmarkets
PersonalcarebrandisDove
strategyofstronginnovation
€1billionbrandssuchasHeartbrand(e.g.Wall’s),MagnumandLipton
acquiredorganicteabrands
RefreshmentPersonalCare Food
grocerysegment
BrandslikeHelmannandBece
Performancedrivenbydressingsà ‘easyouttechnology’andorganicvariantsandcookingproductsinemergingmarkets
HomeCare
T R I N I T Y S M F
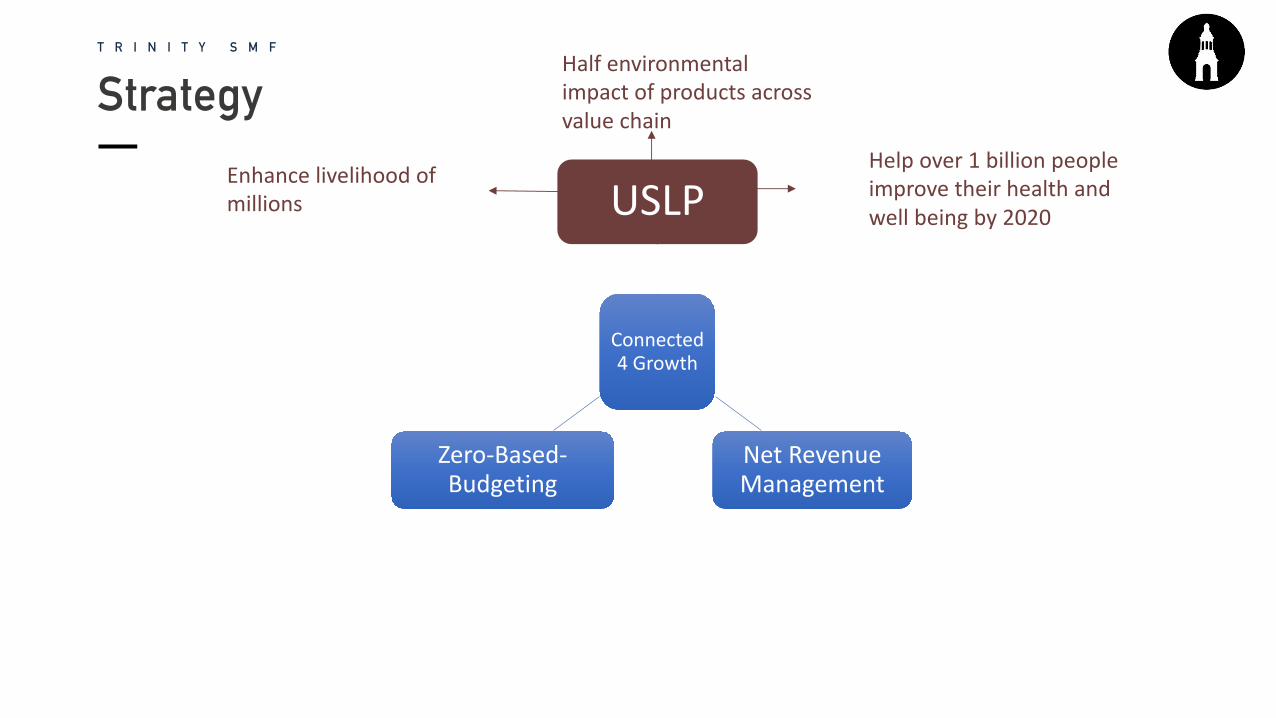
Strategy
Connected4Growth
USLP
NetRevenueManagement
Zero-Based-Budgeting
Helpover1billionpeopleimprovetheirhealthandwellbeingby2020
Halfenvironmentalimpactofproductsacrossvaluechain
Enhancelivelihoodofmillions

T R I N I T Y S M F
Acquisitions
HomeCare PersonalCare
August2016
October2016
February2017
August2017
Refreshment
September2017

T R I N I T Y S M F
Future Plans
PersonalCare Refreshment

T R I N I T Y S M F
Industry and Competitive positioning

FinancialsTRINITY SMF
ō
T R I N I T Y S M F
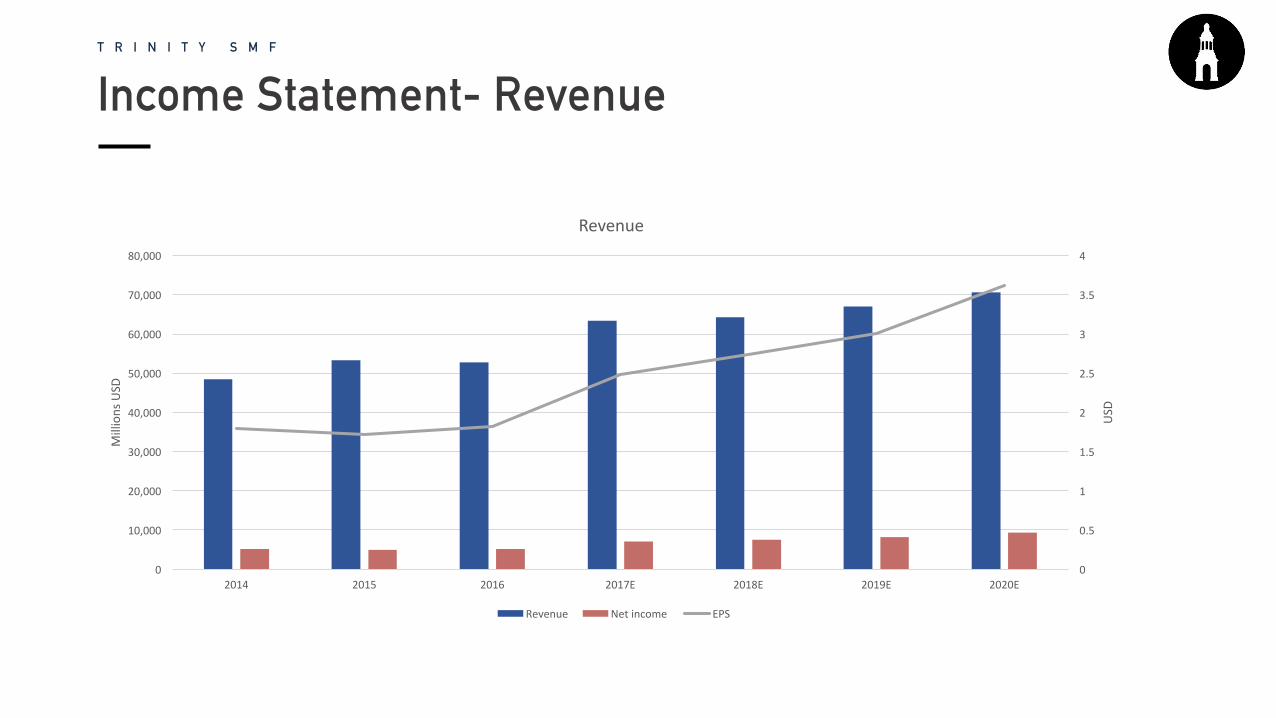
Income Statement- Revenue
0
0.5
1
1.5
2
2.5
3
3.5
4
0
10,000
20,000
30,000
40,000
50,000
60,000
70,000
80,000
2014 2015 2016 2017E 2018E 2019E 2020E
USD
MillionsUSD
Revenue
Revenue Netincome EPS

T R I N I T Y S M F
Income Statement- Profitability
0.00
5.00
10.00
15.00
20.00
25.00
30.00
35.00
40.00
45.00
50.00
2014 2015 2016 2017E 2018E 2019E 2020E
Profitability
Grossmargin% OperatingMargin%

DebtAnalysis
0
1000
2000
3000
4000
5000
6000
7000
8000
0
0.1
0.2
0.3
0.4
0.5
0.6
0.7
0.8
0.9
1
2012 2013 2014 2015 2016 2017latestquarter
FreeCashFlowvsYear
D/E FCF
RatingsAgency Longtermdebt
Moody’sInvestorService
A1
StandardandPoor’s A+
FitchRatings A+

ValuationTRINITY SMF
ō

T R I N I T Y S M F
Implied Multiples ValuationCompanyName P/E Fwd.P/E P/B P/S P/CF EV/EBITDA
Nestle 28.4 21.3 4.3 3 19.3 16.49
HenkelAG&Co 20.5 21.5 3.0 2.2 17.6 14.14
Clorox 24.8 22.2 29.4 2.9 18.5 14.28
Procter&GambleCo 23.6 19.6 4.2 3.7 17.9 13.89
ReckittBenckiserGroupPlc 21.9 23.4 5.6 4.4 17.8 17.68
Colgate-PalmoliveCo 27.7 22.9 - 4.2 20.5 15.49
Johnson&Son 23.9 17.5 5.0 5.1 17.5 15.90
Church&DwightCoInc 25.7 21.0 5.7 3.2 19.7 14.73
KraftandHeinzCo 24.9 20.3 1.7 3.7 23.1 15.30
PeerMedian 24.8 21.3 4.65 3.7 18.5 15.3
Unilever 23.4 19.9 8.5 2.5 18.3 15.52
ImpliedPrice 61.22 61.82 31.60 85.48 58.39 56.94
ImpliedPrice: $59.24
ImpliedUpside: 2.57%
T R I N I T Y S M F
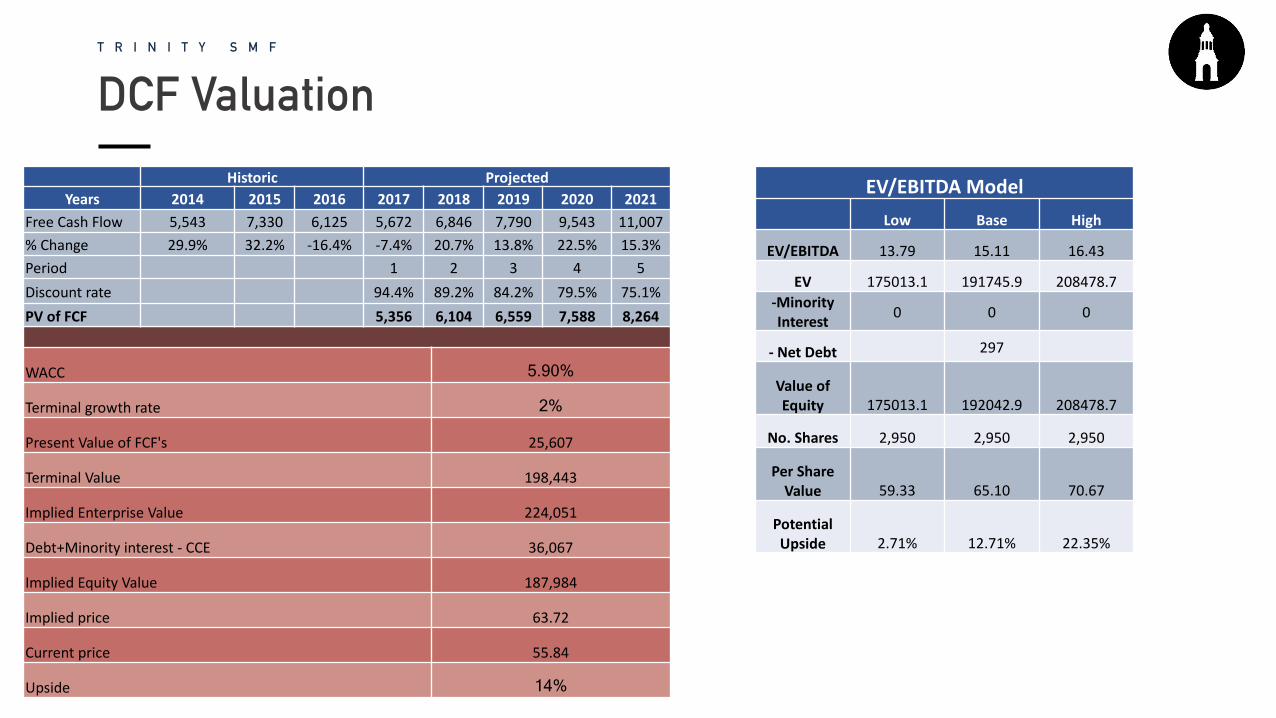
DCF Valuation
WACC 5.90%
Terminalgrowthrate 2%
PresentValueofFCF's 25,607
TerminalValue 198,443
ImpliedEnterpriseValue 224,051
Debt+Minorityinterest- CCE 36,067
ImpliedEquityValue 187,984
Impliedprice 63.72
Currentprice 55.84
Upside 14%
Historic ProjectedYears 2014 2015 2016 2017 2018 2019 2020 2021
FreeCashFlow 5,543 7,330 6,125 5,672 6,846 7,790 9,543 11,007%Change 29.9% 32.2% -16.4% -7.4% 20.7% 13.8% 22.5% 15.3%Period 1 2 3 4 5Discountrate 94.4% 89.2% 84.2% 79.5% 75.1%PVofFCF 5,356 6,104 6,559 7,588 8,264
EV/EBITDAModelLow Base High
EV/EBITDA 13.79 15.11 16.43
EV 175013.1 191745.9 208478.7-MinorityInterest 0 0 0
- NetDebt 297
ValueofEquity 175013.1 192042.9 208478.7
No.Shares 2,950 2,950 2,950
PerShareValue 59.33 65.10 70.67
PotentialUpside 2.71% 12.71% 22.35%
RiskTRINITY SMF
ō
T R I N I T Y S M F
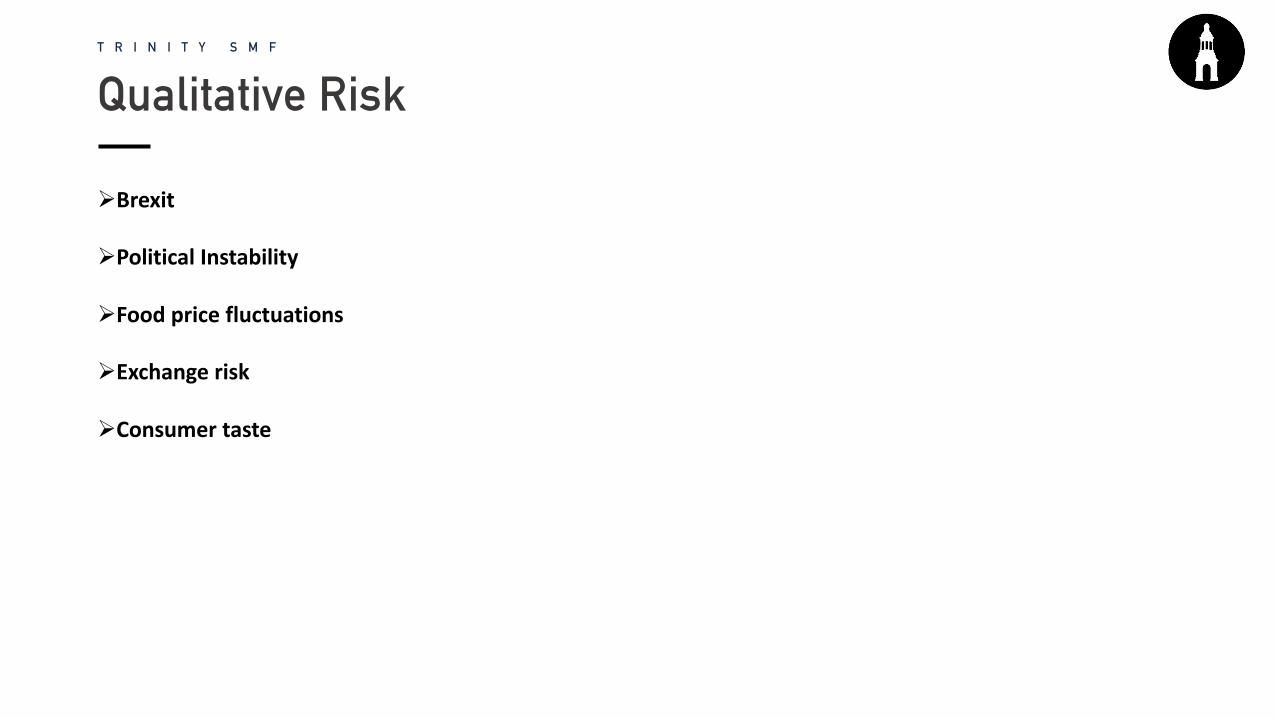
Qualitative Risk
ØBrexit
ØPoliticalInstability
ØFoodpricefluctuations
ØExchangerisk
ØConsumertaste

QuantitativeRisk1%VaR
ConfidenceLevel 99%
VaR -0.03192
VaR % 3.19%
InvestmentAmount 2000
Valueat $63.84
1Yr
Volatility 0.014485
Skew 3.490838
Kurtosis 41.61939
Beta 0.83
Unilever MSCIWorldIndex
Average 0.00177992 0.00071233
StandardDeviation 0.01448541 0.00369443

CorrelationAnalysis
Name Ticker UN WMT GLB KXI
UnileverNV UN - 0.13 0.06 0.66
WalmartInc. WMT 0.13 - 0.03 0.37
Glanbia GLB 0.06 0.03 - 0.06
MSCIConsumerIndex KXI 0.66 0.37 0.06 -

T R I N I T Y S M F
Investment Thesis
EmergingMarkets
Acceleratedevolutionofportfolio
GrowthinTargetMarket
StrongCashFlow
Thank youTRINITY SMF


![Tips - PERI ASd6953a6c-c7dc-4519-bb76-6a3eef17fe9b/... · Actual kicker load [kN] F AV 2.00 1.50 1.10 1.10 1.10 Base Plate Resulting force [kN] 5.00 6.60 6.20 5.80 5.90 5.90 Resulting](https://img.pdfslide.us/doc/110x75/5d44b5b288c993f1188b9824/tips-peri-as-d6953a6c-c7dc-4519-bb76-6a3eef17fe9b-actual-kicker-load-kn.jpg)


![Untitled-2 [] · Assorted. Gyozafiž* Cabbage Gyoza Ginger Gyoza $5.90 $3.90 (5 pcs) (3 pcs) Ginger pork Cyoza $5.90$3.90 Negi Gyoza (6 pcs) (3 pcs) Fresh Spring Onion Pork Gyoza](https://img.pdfslide.us/doc/110x75/602d61bcb595202e330cc573/untitled-2-assorted-gyozafi-cabbage-gyoza-ginger-gyoza-590-390-5-pcs.jpg)


![[UPDATED] PS3 4.65 CFW Jailbreak for PS3 Slim & Super Slim](https://img.pdfslide.us/doc/110x75/5597ef401a28aba1378b486e/updated-ps3-465-cfw-jailbreak-for-ps3-slim-super-slim.jpg)