Embed Size (px)
Citation preview

https://doi.org/10.1177/0956797617735534
Psychological Science 1 –14© The Author(s) 2018Reprints and permissions: sagepub.com/journalsPermissions.navDOI: 10.1177/0956797617735534www.psychologicalscience.org/PS
Research Article
A basic anatomical challenge to the formation of coher-ent spatial representations is that information from the left and right halves of the visual field is initially pro-cessed separately, starting from the retina and continu-ing through the early stages of cortical visual processing. The implication is that, at least initially, objects and scene elements that straddle the two visual hemifields are processed independently in different cortical areas. How, then, does the visual system integrate these two halves of the scene into a unified percept of the visual field, where everything is properly aligned across the midline?
One approach would be to construct a fixed align-ment of the adjacent cortical maps across the two hemi-spheres, which might be expected because the optics of the eye and image statistics are relatively unchanging
after normal development. This solution would be stable but not sensitive to dynamic changes. Alternatively, the visual system could deploy an adaptable calibration process aligning the two visual field representations in real time. In this article, we present a novel adaptation paradigm to determine whether such a dynamic recali-bration process is present across the visual hemifields.
We tested for perceptual aftereffects following adap-tation to a set of randomly moving lines that straddled the vertical meridian. The stimulus was split at the vertical midline such that stimuli in the left hemifield
735534 PSSXXX10.1177/0956797617735534Chen et al.Unifying Visual Space Across the Left and Right Hemifieldsresearch-article2018
Corresponding Author:Zhimin Chen, Department of Psychology, University of California, Berkeley, 3210 Tolman Hall #1650, Berkeley, CA 94720 E-mail: [email protected]
Unifying Visual Space Across the Left and Right Hemifields
Zhimin Chen 1, Anna Kosovicheva1,2, Benjamin Wolfe1,3, Patrick Cavanagh4,5, Andrei Gorea5, and David Whitney1,6,7
1Department of Psychology, University of California, Berkeley; 2Department of Psychology, Northeastern University; 3Computer Science and Artificial Intelligence Laboratory, Massachusetts Institute of Technology; 4Department of Psychological and Brain Sciences, Dartmouth College; 5Laboratoire Psychologie de la Perception, Centre National de la Recherche Scientifique and Université Paris Descartes; 6Vision Science Program, University of California, Berkeley; and 7Helen Wills Neuroscience Institute, University of California, Berkeley
AbstractVisual space is perceived as continuous and stable even though visual inputs from the left and right visual fields are initially processed separately within the two cortical hemispheres. In the research reported here, we examined whether the visual system utilizes a dynamic recalibration mechanism to integrate these representations and to maintain alignment across the visual fields. Subjects adapted to randomly oriented moving lines that straddled the vertical meridian; these lines were vertically offset between the left and right hemifields. Subsequent vernier alignment judgments revealed a negative aftereffect: An offset in the same direction as the adaptation was required to correct the perceived misalignment. This aftereffect was specific to adaptation to vertical, but not horizontal, misalignments and also occurred following adaptation to movie clips and patterns without coherent motion. Our results demonstrate that the visual system unifies the left and right halves of visual space by continuously recalibrating the alignment of elements across the visual fields.
Keywordsvisual perception, visual fields, perceptual continuity, hemifield, adaptation, psychophysics, open data, open materials
Received 4/26/17; Revision accepted 9/8/17

2 Chen et al.
were shifted upward relative to those in the right hemi-field, or vice versa. An occluder strip attenuated the visibility of the discontinuity at the vertical meridian. Subjects wore neutral density filter goggles to eliminate external visual references. We found that adaptation to misalignments between the two hemifields influenced subsequent judgments of perceived alignment across the vertical meridian. The adaptation caused vernier test lines to appear shifted in a direction opposite to the adapting misalignment. Moreover, we found no aftereffect following adaptation to misalignments between the upper and lower visual fields and no after-effect following adaptation to misalignments within the same hemifield. We further confirmed that this afteref-fect generalized to other types of stimuli, including clips from a Hollywood movie and patterns without coherent motion signals. Several features of our stimulus and control experiments revealed that the aftereffect that we observed was not a variant of any previously known aftereffect, including vernier aftereffects (Wolfe, 1987), figural aftereffects (Köhler & Wallach, 1944), regulariza-tion (Otten, Pinto, Paffen, Seth, & Kanai, 2016), position aftereffects (Hess & Doshi, 1995), motion aftereffects (Nishida & Johnston, 1999), or attentional repulsion (Suzuki & Cavanagh, 1997). Our results provide clear evidence for the existence of a unique, global, dynamic calibration process that aligns the visual hemifield rep-resentations—unifying the left and right halves of visual space.
Experiment 1
In Experiment 1a, we tested for perceptual aftereffects following adaptation to a global offset across the verti-cal meridian. We predicted that adaptation to a spatial offset between the left and right visual hemifields would induce perceptual misalignments in subse-quently viewed vernier lines (Fig. 1a). Specifically, we predicted that the pair of vernier lines would appear misaligned in the opposite direction from the spatial offset in the adapting stimulus. The presence of a nega-tive aftereffect from adaptation to the spatial offset between the left and right visual fields would indicate that the visual system computes and dynamically reca-librates the relative alignment of elements across the visual hemifields.
In Experiment 1b, we tested whether this aftereffect is specific to vertical misalignments. Adaptation to split-field prism spectacles (Pick, Hay, & Martin, 1969) could produce aftereffects similar to those observed in Experi-ment 1a. If the aftereffect is due to the same kind of generic adaptation that happens in prism adaptation, then it should operate equally across vertical and hori-zontal meridians. To determine whether this recalibra-tion process is specific to the division between the left
and right hemifields or general to any other split between the whole visual field, we measured the shift in perceived alignment following adaptation to offsets across the horizontal meridian.
Method
Subjects. Eight subjects (3 female, including 1 author, and 5 male; age range: 20–32 years) took part in both Experiments 1a and 1b. The sample size we used is com-mon for studies of visual adaptation and aftereffects (e.g., Hisakata, Nishida, & Johnston, 2016; Whitney, 2005; Wolfe, 1987). All experimental procedures were approved by the University of California (UC) Berkeley Institutional Review Board. Subjects were affiliates of UC Berkeley and provided written informed consent before participa-tion. All had normal or corrected-to-normal vision.
Stimuli. Visual stimuli were generated with MATLAB (The MathWorks, Natick, MA) and Psychophysics Tool-box Version 3 (Brainard, 1997; Pelli, 1997) running on an Apple Macintosh computer (Apple Inc., Cupertino, CA). Stimuli were displayed on a 21-in. gamma-corrected ViewSonic CRT monitor (ViewSonic, Walnut, CA; 39 cm × 29 cm, 1,024- × 768-pixel resolution, 60 Hz refresh rate). Subjects viewed the stimuli through a neutral density filter (Shade 5 welder’s mask or goggles), and viewing dis-tance was maintained at 28.5 cm via a chin rest. Experi-ments took place in a dark room. The monitor frame and black screen when viewed through the filter were of less than measurable luminance according to readings of a Minolta LS110 luminance meter (< 0.001 cd/m2). The neutral density filter reduced the luminance of the dis-play to 1.6% of the luminance before attenuation. All reported luminance values were measured with the neu-tral density filter.
We used a set of large randomly rotating and moving colored lines on a black (< 0.001 cd/m2) background as the adapting stimulus (Fig. 1b). It consisted of 25 lines (0.76° width), with a randomly selected length between 30° and 45°. The color of each line was deter-mined by independently selecting random red, green, and blue intensity values (mean luminance: 0.11 cd/m2). The midpoint of each line moved continuously at a rate of 18.3°/s in a random initial motion direction (from 0° to 360°), starting from a random x- and y-coordinate within an invisible screen-centered box (40.2° × 40.2°). To keep the midpoint of each line inside the box, we had the horizontal (or vertical) component of the line’s motion direction reverse whenever the midpoint reached the horizontal (or vertical) edge of the box. In addition, each line was assigned an initial random orientation (from 0° to 180°) and a random rever-sal point (from 0° to 180°). Line orientations were ran-domized to minimize any net effect of the Poggendorff

Unifying Visual Space Across the Left and Right Hemifields 3
illusion (Weintraub & Krantz, 1971) on the apparent misalignment in the adapting stimulus and subsequent aftereffect. Each line rotated continuously clockwise or counterclockwise at a rate of 57.3°/s and changed rota-tion direction whenever it reached its reversal point (i.e., aside from the first reversal, lines changed direc-tion after making a 180° rotation). A new set of 25 random lines was generated for every adaptation phase (initial adaptation phase and each top-up interval; see the Procedure section).
We divided the adapting stimuli in half across the vertical (Experiment 1a) or horizontal (Experiment 1b) meridian. We introduced an adapting offset by shifting one half of the display along the chosen meridian by 1.83°. A black occluder strip covering the length of the
stimulus (3.5º width) was placed on the chosen merid-ian, centered on the fixation point, covering any visible breaks between the two halves. The adapting stimulus was presented at full contrast through a circular luminance aperture (14° radius), which was smoothly attenuated outward from 14° to approximately 20° eccentricity by a Gaussian function (SD = 2°). To aid fixation, we positioned a white dot (0.83° diameter; 0.42 cd/m2) at the center of the display throughout the experiments.
Vernier trials were used to measure aftereffects of perceived alignment from adaptation (Fig. 1c). Test stim-uli were two thin white lines (3° length, 0.2° width, 0.05 cd/m2) presented straddling the long occluder (orthogo-nal to its orientation), with a 20° center-to-center
or
Fixation500 ms Vernier Lines
83 ms Mask500 ms
a
bAdaptation
Adaptation to Misalignment Between the Left and Right Visual Hemifields Aligned Vernier Lines
or
Misaligned Vernier Lines
Test Perceive
c
d
Test
8 min 1 min 1 min 1 minAdaptation Period
Vernier Alignment Test (4 × 12 Trials)
Fig. 1. Prediction and experimental paradigm for Experiments 1a and 1b. After subjects adapted to a dynamic stimulus that was misaligned between the left and right hemifields (a), we expected aligned vernier stimuli to appear misaligned in a direction opposite from the adapting offset. During the adaptation period (b), we presented a moving set of colored lines that rotated randomly in different directions while subjects performed a demanding central fixation task. The left and right halves of the stimulus were shifted vertically in opposite directions, and a central dark occluder covered apparent line breaks at the midline. During the test period (c), each trial began with a fixation dot, followed by a pair of vernier lines centered on the fixation dot, which straddled the vertical meridian. The vernier lines appeared either horizontally (Experiment 1a; shown here) or vertically (Experiment 1b). To control exposure duration, we presented a noise mask of black and white squares following the vernier stimulus. Subjects reported whether the left line was higher or lower than the right line in a two-alternative forced-choice task. Each session (d) began with an 8-min initial adaptation period, followed by four periods of 12 vernier test trials interspersed with three periods of 1-min top-up adaptation.

4 Chen et al.
separation. Vernier offset was pseudorandomly selected (see the Procedure section) from one of six linearly spaced separations between −1° and 1°. In Experiment 1a, negative values indicate that the left line was lower than the right line. In Experiment 1b, negative values indicate that the top line was shifted leftward relative to the bottom line. Vernier lines were always centered around the middle of the screen, with each line shifted by half the full separation (in opposite directions).
Procedure. To create a reference-free environment and to eliminate visibility of screen edges during the experi-ment (see the Stimuli section), we required subjects to wear a neutral density filter. Subjects reported not being able to see the monitor frame throughout the experi-ments. Subjects, except for the one author, were naive to the purpose of the experiments. Subjects were not informed of the presence or the direction of spatial off-sets in the adapting stimulus. In fact, all naive subjects reported being unaware of the shift between the two halves of the adapting stimulus.
During each run, subjects viewed the adapting stimu-lus for an initial interval of 8 min. After the initial adaptation period, we alternated four sets of 12 vernier trials with 1 min of top-up adaptation (Fig. 1d). During top-up adaptation, the offset in the adapting stimulus was the same as the initial adapting offset. Each run lasted for about 15 min.
During the initial adaptation and top-up adaptation periods, subjects performed a fixation task to maintain fixation at the center of the display. Subjects were instructed to detect a recurring target—a small (1 pixel; 0.08°), dark gray spot (0.073 cd/m2) at a randomly selected location inside the white fixation dot. The target was shown for 250 ms and appeared at a ran-domly selected time between 2,000 and 4,000 ms from the previous target onset (or from the beginning of the adaptation period). Subjects were instructed to press the space bar each time the target appeared. If they failed to respond within 1,000 ms or pressed the space bar at any other time, the white fixation dot turned red (0.42 cd/m2) for 500 ms or until the next fixation target appeared (whichever came first). Mean accuracy on the fixation task was 92.1%.
Each vernier trial started with a central fixation dot shown for 500 ms. Two vernier lines on either side of the meridian were flashed for 83 ms, followed by a 500-ms random noise mask consisting of a regular grid of 0.77° squares, each with a randomly selected gray-scale intensity value (97% contrast; mean luminance: 0.066 cd/m2) inside the same circular aperture used in the adaptation period. Subjects were then asked to report whether the left line appeared higher or lower than the right line (in the vertical-meridian condition)
or whether the upper line appeared farther to the left relative to the lower line (in the horizontal-meridian condition). The program proceeded immediately to the next trial following the subject’s response. Subjects were exposed to light sources in between runs to pre-vent visibility of the monitor edges resulting from dark adaptation.
Subjects completed Experiments 1a and 1b in a ran-dom order across 2 days (each experimental session lasted approximately 1 hr). Each experiment consisted of four runs, with the two adaptation offset directions interleaved between runs. Subjects completed a total of 96 trials for each adaptation offset direction (6 spatial offsets × 16 repetitions in a random order).
Data analysis. For each observer and each adaptation direction, response proportions across the set of vernier offsets were fit to logistic functions using a least-squares procedure. The point of subjective equality (PSE)—cor-responding to the vernier offset at which subjects per-ceived the two lines to be aligned—was calculated for each curve. The size of the aftereffect was calculated as the difference in PSEs between the two adaptation directions. Confidence intervals were calculated from a bootstrapped distribution of the aftereffect values by resampling each subject’s responses 1,000 times with replacement and refit-ting the curves (Efron & Tibshirani, 1993). Statistical com-parisons for individual subjects and group means were calculated using nonparametric permutation tests. These were generated by randomly shuffling the adaptation direction labels of each subject’s responses, refitting the curves, and then recalculating the aftereffect values for the shuffled data. A null distribution of the aftereffect values was generated for each subject by repeating this procedure 5,000 times. We then obtained a null distribu-tion of the group means by averaging the permuted null distribution values across subjects. Two-tailed p values were calculated by computing the proportion of per-muted aftereffect values in the null distribution with an absolute value that was greater than or equal to the abso-lute value of the observed mean aftereffect size. Paramet-ric analyses (t tests and analyses of variance) confirmed the significance results obtained from the permutation tests.
Results
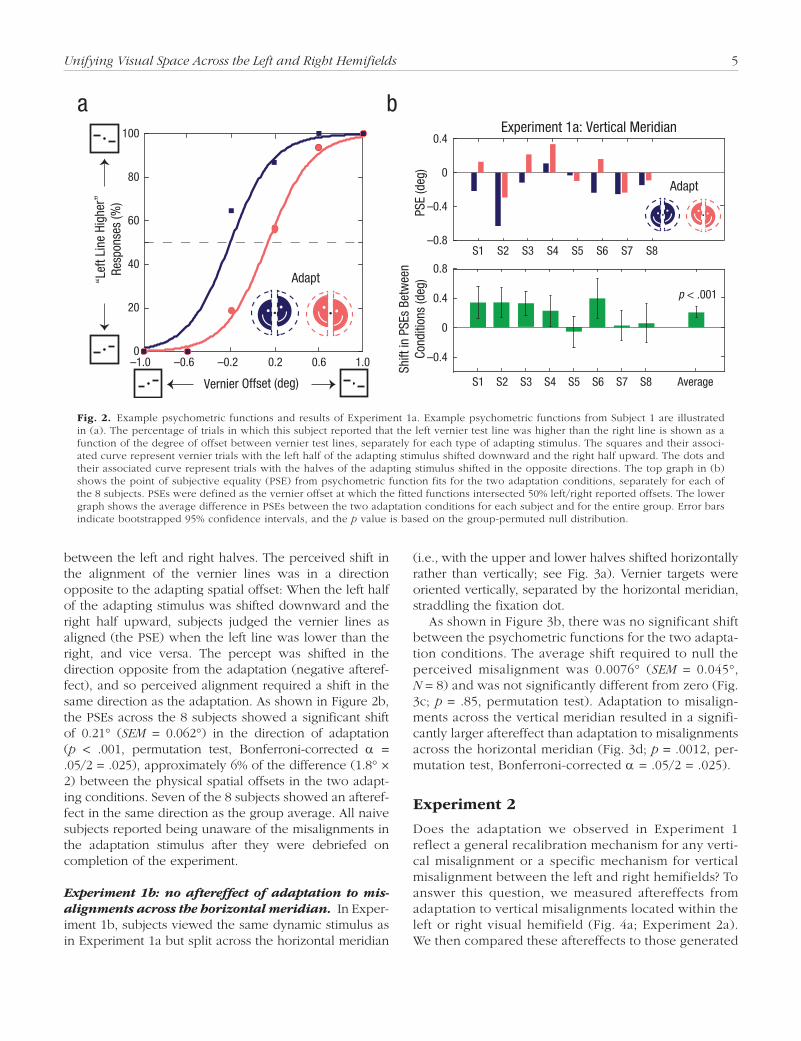
Experiment 1a: negative aftereffect of adaptation to misalignments across the vertical meridian. After prolonged viewing of a misaligned dynamic stimulus, subjects experienced a significant shift in the perceived alignment of subsequent vernier targets. Figure 2a shows psychometric functions fitted to the data of 1 subject for two adaptation conditions with opposite spatial offsets
Unifying Visual Space Across the Left and Right Hemifields 5
between the left and right halves. The perceived shift in the alignment of the vernier lines was in a direction opposite to the adapting spatial offset: When the left half of the adapting stimulus was shifted downward and the right half upward, subjects judged the vernier lines as aligned (the PSE) when the left line was lower than the right, and vice versa. The percept was shifted in the direction opposite from the adaptation (negative afteref-fect), and so perceived alignment required a shift in the same direction as the adaptation. As shown in Figure 2b, the PSEs across the 8 subjects showed a significant shift of 0.21° (SEM = 0.062°) in the direction of adaptation (p < .001, permutation test, Bonferroni-corrected α = .05/2 = .025), approximately 6% of the difference (1.8° × 2) between the physical spatial offsets in the two adapt-ing conditions. Seven of the 8 subjects showed an afteref-fect in the same direction as the group average. All naive subjects reported being unaware of the misalignments in the adaptation stimulus after they were debriefed on completion of the experiment.
Experiment 1b: no aftereffect of adaptation to mis-alignments across the horizontal meridian. In Exper-iment 1b, subjects viewed the same dynamic stimulus as in Experiment 1a but split across the horizontal meridian
(i.e., with the upper and lower halves shifted horizontally rather than vertically; see Fig. 3a). Vernier targets were oriented vertically, separated by the horizontal meridian, straddling the fixation dot.
As shown in Figure 3b, there was no significant shift between the psychometric functions for the two adapta-tion conditions. The average shift required to null the perceived misalignment was 0.0076° (SEM = 0.045°, N = 8) and was not significantly different from zero (Fig. 3c; p = .85, permutation test). Adaptation to misalign-ments across the vertical meridian resulted in a signifi-cantly larger aftereffect than adaptation to misalignments across the horizontal meridian (Fig. 3d; p = .0012, per-mutation test, Bonferroni-corrected α = .05/2 = .025).
Experiment 2
Does the adaptation we observed in Experiment 1 reflect a general recalibration mechanism for any verti-cal misalignment or a specific mechanism for vertical misalignment between the left and right hemifields? To answer this question, we measured aftereffects from adaptation to vertical misalignments located within the left or right visual hemifield (Fig. 4a; Experiment 2a). We then compared these aftereffects to those generated
“Lef
t Lin
e Hi
gher
”Re
spon
ses
(%)
Vernier Offset (deg)
Adapt
–1.0 –0.2 0.2 1.00
20
40
60
80
100
–0.6 0.6
a bExperiment 1a: Vertical Meridian
S1 S2 S3 S4 S5 S6 S7 S8–0.8
–0.4
0
0.4
PSE
(deg
)
Average
–0.4
0
0.4
0.8
Shift
in P
SEs
Betw
een
Cond
ition
s (d
eg)
p < .001
S1 S2 S3 S4 S5 S6 S7 S8
Adapt
Fig. 2. Example psychometric functions and results of Experiment 1a. Example psychometric functions from Subject 1 are illustrated in (a). The percentage of trials in which this subject reported that the left vernier test line was higher than the right line is shown as a function of the degree of offset between vernier test lines, separately for each type of adapting stimulus. The squares and their associ-ated curve represent vernier trials with the left half of the adapting stimulus shifted downward and the right half upward. The dots and their associated curve represent trials with the halves of the adapting stimulus shifted in the opposite directions. The top graph in (b) shows the point of subjective equality (PSE) from psychometric function fits for the two adaptation conditions, separately for each of the 8 subjects. PSEs were defined as the vernier offset at which the fitted functions intersected 50% left/right reported offsets. The lower graph shows the average difference in PSEs between the two adaptation conditions for each subject and for the entire group. Error bars indicate bootstrapped 95% confidence intervals, and the p value is based on the group-permuted null distribution.

6 Chen et al.
between the two hemifields, as in Experiment 1 (Fig. 4b; Experiment 2b).
Method
Subjects. Six subjects (4 female, including 1 author, and 2 male; age range: 19–33 years) took part in both Experi-ment 2a and 2b.
Stimuli and procedure. We measured aftereffects fol-lowing adaptation to a peripheral misalignment within the left or right hemifield (Experiment 2a) and compared
these values with aftereffects following adaptation to a central misalignment (Experiment 2b). To compare after-effects between central and peripheral vision, we equated sensitivity to the adapting offsets between Experiments 2a and 2b. Following adaptation, aftereffects were mea-sured using vernier test stimuli that were presented at peripheral locations in both experiments (Fig. 4), and their respective locations were also matched for discrim-inability. These two additional procedures (equating sen-sitivity to the adapting offsets and to the vernier test stimuli) are described after the main procedures for Experiments 2a and 2b.
c
Vertical – Horizontal Meridian
S1 S2 S3 S4 S5 S6 S7 S8 Average
–0.4
0
0.4
0.8
d
p = .0012
Experiment 1b: Horizontal Meridian
S1 S2 S3 S4 S5 S6 S7 S8–0.8
–0.4
0
0.4
PSE
(deg
)Sh
ift in
PSE
s Be
twee
nCo
nditi
ons
(deg
)Di
ffere
nce
inAf
tere
ffect
Siz
e (d
eg)
–0.4
0
0.4
0.8
AverageS1 S2 S3 S4 S5 S6 S7 S8
n.s.
Adapt
0
20
40
60
80
100
–1.0 –0.2
Vernier Offset (deg)
0.2 1.0–0.6 0.6
“Top
Lin
e Ri
ghtw
ard”
Resp
onse
s (%
)a
Adapt
Adaptation Stimuli Vernier Test Stimuli
Adaptation to MisalignmentAcross the Horizontal Meridian
b
Fig. 3. Stimulus configuration, example psychometric functions, and results of Experiment 1b. On each trial (a), adaptation to misaligned upper and lower hemifields was followed by vernier targets straddling the fixation dot across the horizontal meridian. Example psychomet-ric functions from Subject 1 are illustrated in (b). The percentage of trials in which this subject reported that the top vernier test line was farther to the right than the bottom line is shown as a function of the degree of offset between vernier test lines, separately for each type of adapting stimulus. The squares and their associated curve represent vernier trials with the top half of the adapting stimulus shifted to the left and the bottom half to the right. The dots and their associated curve represent trials with the halves of the adapting stimulus shifted in the opposite directions. The top graph in (c) shows the point of subjective equality (PSE) from psychometric function fits for the two adaptation conditions, separately for each of the 8 subjects. PSEs were defined as the vernier offset at which the fitted functions intersected 50% top/bottom reported offsets. The lower graph shows the average difference in PSEs between the two adaptation conditions for each individual subject and for the entire group. The average difference in aftereffect size between the vertical and horizontal meridians (d) is shown for each subject and for the entire group. Error bars in (c) and (d) indicate bootstrapped 95% confidence intervals, and the p value is based on the group-permuted null distribution.

Unifying Visual Space Across the Left and Right Hemifields 7
Experiment 2a. The overall stimulus configuration was the same as that in Experiment 1a except that the adapting stimulus and the vernier lines were centered on an invisible vertical line 12° to the left or the right of the central fixation dot (Fig. 4a). The moving-lines stimu-lus was divided into left and right halves by an invis-ible vertical line within the left or right hemifield, and the divided halves were shifted vertically in opposite directions. The vertical misalignment was individually determined for each subject in a preliminary experiment and ranged from 1.90° to 3.59° (see the Equating the Adapting Stimuli section). The apparent line breaks were covered with an occluder strip. During the test period, vernier lines straddled the occluder strip within the left or right hemifield.
Experiment 2b. The stimulus configuration in Experi-ment 2b was the same as that in Experiment 1a, with the following changes. During the test period, vernier lines were presented above or below the fixation dot at an eccentricity determined individually for each subject, which ranged from 7.54° to 10.49° (see the Equating the Vernier Test Stimuli section).
Subjects completed Experiment 2a and 2b in a ran-dom order across 2 days using the same procedure as in Experiment 1. The locations of the vernier lines
(either left, right, above, or below relative to central fixation) and two adaptation offset directions were interleaved between runs.
Equating the adapting stimuli. For each subject, we conducted a preliminary experiment to equate sensi-tivity to the adapting misalignment in peripheral vision (Experiment 2a) with the misalignment sensitivity in cen-tral vision (1.83°, fixed; Experiment 2b). We measured the threshold misalignment separately in peripheral and in central vision and calculated the ratio between the two thresholds. We then multiplied this ratio by the fixed cen-tral misalignment (1.83°) to obtain a matched-to-sample peripheral misalignment to be used in the adaptation period in Experiment 2a.
The adapting stimulus in Experiments 2a and 2b was used as the test stimulus. The test stimulus was divided in half and shifted vertically with a spatial offset that varied from 0° to 1.2° in steps of 0.2°. During each trial, the test stimulus was presented for 1 s, and then a 500-ms random noise mask was presented. We measured sub-jects’ misalignment discrimination thresholds for periph-eral and central vision using the method of constant stimuli and a two-alternative forced-choice (2AFC) task. Subjects were asked to report whether the left half of the moving-lines stimulus appeared higher or lower
a
or
Adaptation Stimuli
Experiment 2a: Within Hemifield Experiment 2b: Between Hemifields
Vernier Test Stimuli
b
Adaptation Stimuli Vernier Test Stimuli
or
12º
12º 12º
12º
Fig. 4. Stimulus configuration in Experiments 2a and 2b. In each trial of Experiment 2a (a), subjects viewed an adapting stimulus that was split and misaligned either to the left or to the right of central fixation within the same hemifield. This was followed by vernier targets flashed in either the left or the right visual field. In each trial of Experiment 2b (b), adaptation to a vertical misalignment between the hemifields was followed by vernier targets flashed at a peripheral location either above or below fixation.

8 Chen et al.
than the right half. Twenty trials were presented at each of the seven spatial offsets, and a total of 140 trials were divided into four runs of 35 trials each. The seven spa-tial offsets between the two halves were randomly ordered across trials. The spatial location displaying the misalignment (either at the center or within the left or right hemifield) was interleaved between runs, and sub-jects were informed of the location at the beginning of each run. The resulting data were fitted with psycho-metric functions (see the Data Analysis section of Experiment 1) to estimate thresholds, defined as 75% correct performance.
Equating the vernier test stimuli. We conducted a second preliminary experiment to equate discriminabil-ity of the vernier offsets in Experiments 2a and 2b for each subject. First, we measured the vernier threshold for lines presented within the left or right hemifield at 12° from central fixation (Experiment 2a), using the method of constant stimuli and a 2AFC task. The absolute spa-tial misalignment between vernier lines was randomly sampled from 0° to 1.2° with a step size of 0.2°, and each offset value was presented for 20 trials. Vernier off-set directions were randomly interleaved across trials. Subjects reported whether the left line appeared higher or lower than the right line, and the 75% performance threshold was calculated for each subject. Next, we pre-sented the vernier lines, with the 75% threshold mis-alignment, at various eccentricities in the upper or lower visual field and measured the 75% threshold eccentricity using the same 2AFC method and task described previ-ously. The eccentricity was randomly selected from 6° to 12° in steps of 1°, and each value was presented for 20 trials. As before, subjects reported whether the left line appeared higher or lower than the right line. The location of the vernier lines was blocked within runs, and subjects were informed of the location for each run prior to its start. The 75% threshold eccentricity was then used in the test period in Experiment 2b.
Results
Equating stimuli. The central 1.83° adapting misalign-ment (Experiments 1 and 2b) was psychophysically equivalent to a peripheral adapting misalignment (Exper-iment 2a) that ranged from 1.90° to 3.59° across subjects (M = 2.68°, SEM = 0.28°; see Fig. S3b in the Supplemental Material available online). To approximately equate sen-sitivity to vernier offsets presented 12° to the left or right of the fixation (Experiment 2a), we set the eccentricity of the vernier lines in the upper and lower visual fields (Experiment 2b) to range from 7.54° to 10.49° across sub-jects. These results are shown in Figure S3d in the Sup-plemental Material (M = 9.30°, SEM = 0.49°; Fig. S3d).
Experiment 2: no aftereffect of adaptation to mis-alignments within the same hemifield. When the adapting stimulus was split within the same hemifield in Experiment 2a, there was no significant shift in the per-ceived alignment of subsequent vernier targets. Figure 5a shows example psychometric functions for the two adapta-tion conditions with opposite spatial offsets. The average shift required to null the perceived misalignment was 0.047° (SEM = 0.036°, N = 6) and was not significantly different from zero (Fig. 5b; p = .92, permutation test). In contrast, when the adapting stimulus was split between the two hemifields in Experiment 2b with an equally discriminable adapting misalignment and with vernier eccentricity psy-chophysically equated to Experiment 2a, subjects experi-enced a significant shift in the perceived alignment of subsequent vernier targets. Figure 5c shows a significant shift between the example psychometric functions. There was a significant shift in the PSE across all 6 subjects, on average 0.32° (SEM = 0.088°) in the direction of adaptation (Fig. 5d; p < .001, permutation test, Bonferroni-corrected α = .05/2 = .025). Furthermore, adaptation to misalignments between the hemifields produced a significantly larger after-effect than adaptation to misalignments within the same hemifield (Fig. 5e; p < .001, permutation test, Bonferroni-corrected α = .01/2 = .005).
Experiment 3
Is the adaptation we observed in Experiment 1a an artifact of the stimuli used, or is it a general process? To test whether our results would generalize to other stimuli, we measured the negative aftereffect following adaptation to clips from a Hollywood movie (Experi-ment 3a) and Glass patterns with no coherent motion or orientation signals (Experiment 3b). Using movies allowed us to test whether this adaptation can occur with naturalistic scenes, similar to those that subjects see outside the laboratory. In addition, Glass patterns contain no linear visual information across the meridian and no coherent motion information, but they neverthe-less produce a percept of rotational motion and sym-metry across the meridian (Glass, 1969; Ross, Badcock, & Hayes, 2000). Adapting subjects to Glass patterns allowed us to determine whether linear information is a necessary input to the recalibration mechanism or if information from global structure is sufficient.
Method
Subjects. Five subjects (3 female, including 2 authors, and 2 male; age range: 19–38 years) took part in Experi-ment 3a, and 5 subjects (3 female, including 2 authors, and 2 male, including 1 author; age range: 23–38 years) took part in Experiment 3b.

Unifying Visual Space Across the Left and Right Hemifields 9
20
40
60
80
100
a
–1.0 –0.2 1.0–0.6 0.6
Adapt
PSE
0
“Lef
t Lin
e Hi
gher
”Re
spon
ses
(%)
“Lef
t Lin
e Hi
gher
”Re
spon
ses
(%)
0.2 –1.0 –0.2 0.2 1.0–0.6 0.6
PSE
0
20
40
60
80
100
c
–0.8
–0.4
0
0.4
0.8
PSE
(deg
)
–0.4
0
0.4
0.8
Shift
in P
SEs
Betw
een
Cond
ition
s (d
eg)
Diffe
renc
e in
Afte
r-ef
fect
Siz
e (d
eg)
–0.8
–0.4
0
0.4
0.8
b
S1 S2 S3 S4 Average
n.s.
d
PSE
(deg
)
Average
Adapt
Shift
in P
SEs
Betw
een
Cond
ition
s (d
eg)
eBetween – Within
Average
S5 S6
S1 S2 S3 S4 S5 S6S1 S2 S3 S4 S5 S6
S1 S2 S3 S4 S5 S6
S1 S2 S3 S4 S5 S6
–0.4
0
0.4
0.8
–0.4
0
0.4
0.8
Adapt
p < .001
p < .001
Adapt
Experiment 2a: Within Hemifield
Experiment 2a: Within Hemifield
Vernier Offset (deg) Vernier Offset (deg)
Experiment 2b: Between Hemifields
Experiment 2b: Between Hemifields
Fig. 5. Example psychometric functions and results of Experiments 2a and 2b. Example psychometric functions are shown for Subject 1 in (a) Experiment 2a and (c) Experiment 2b. The percentage of trials in which this subject reported that the left vernier test line was higher than the right line is shown as a function of the degree of offset between vernier test lines, separately for each type of adapting stimulus. The squares and their associated curve represent vernier trials with the left half of the adapting stimulus shifted downward and the right half upward. The dots and their associated curve represent trials with the halves of the adapting stimulus shifted in the opposite directions. The top graphs in (b) and (d) show the point of subjective equality (PSE) from psychometric function fits for the two adaptation conditions, separately for each of the 6 subjects in each experiment. PSEs were defined as the vernier offset at which the fitted functions intersected 50% left/right reported offsets. The lower graphs in (b) and (d) show the average difference in PSEs between the two adaptation conditions for each subject and for the entire group. The difference in aftereffect size between Experiments 2a and 2b (e) was calculated by subtracting the values shown in the lower graphs in (b) from the values shown in the lower graphs in (d). Error bars in the bar graphs indicate bootstrapped 95% confidence intervals, and p values are based on the group-permuted null distribution.

10 Chen et al.
Stimuli. The overall stimulus configuration of Experi-ment 3 was similar to that of Experiment 1a, with adapta-tion stimuli consisting of clips from a Hollywood movie (Experiment 3a) or Glass patterns (Experiment 3b). The left and right halves of the adapting stimulus were verti-cally misaligned. The spatial offset between the left and right halves of the adapting stimulus was 1.73° for Exper-iment 3a and 2.74° for Experiment 3b. In Experiment 3b, the occluder width was 4.5°; the aperture radius was 18° and smoothly attenuated from 18° to approximately 27° (Gaussian SD = 3°). As in Experiment 1a, the vernier test lines were always centered around the middle of the dis-play and straddled the vertical meridian.
Experiment 3a. We used scenes from The Dark Knight (2008) as the adapting stimulus (Fig. 6a). The original video file had a rate of 24 frames per second (fps) and a 4:3 aspect ratio (640 × 480 pixels), encoded with H.264 compression. To reduce the amount of time that subjects spent adapting to stimuli with limited visual information
across the vertical meridian (e.g., scenes with extended dialogue or limited camera motion), we developed an automated procedure to extract video segments contain-ing movement and a high frequency of shot boundaries. This technique was modified from a standard shot-bound-ary detection procedure based on differences in color his-tograms between consecutive frames (e.g., Lienhart, 1998). For each frame, we calculated the absolute difference in the normalized pixel counts across 256 intensity bins between the current and previous video frame (summed across red, green, and blue, or RGB). The resulting series of RGB histogram differences was then low-pass-filtered (Gaussian profile, cutoff frequency = 0.05 fps, σ = 0.03 fps). Finally, video frames at which the filtered series of histogram differences exceeded a threshold value were joined together to generate a new video, identical in frame rate and pixel dimensions to the original file. The threshold value was selected to produce a total video length of 30.2 min (out of an original video length of 143.6 min). All video frames exceeding the threshold
S1 S2 S3 S4 S5–0.6–0.4–0.2
00.2
PSE
(deg
)
S1 S2 S3 S4 S5 Average–0.4–0.2
00.2
Shift
in P
SEs
Betw
een
Cond
ition
s (d
eg)
0.4
0.40.6
Experiment 3b: Glass Patterns
S1 S2 S3 S4 S5
PSE
(deg
)
S1 S2 S3 S4 S5 AverageShift
in P
SEs
Betw
een
Cond
ition
s (d
eg)
aExperiment 3a: Hollywood Movie Clips
c
b d
–0.6–0.4–0.2
00.2
–0.4–0.2
0.20.4
0.4
0.6
0
p < .001 p = .0074
Adapt Adapt
Fig. 6. Adapting stimuli and results of Experiments 3a and 3b. The adapting stimulus in Experiment 3a (a) consisted of movie clips from The Dark Knight (2008), and the adapting stimulus in Experiment 3b (c) consisted of sequences of static Glass patterns. (For illustrative purposes, the stills shown here for Experiment 3a are taken from personal photographs.) The top graphs in (b) and (d) show the points of subjective equality (PSE) from psychometric function fits for the two adaptation conditions, separately for each of the 5 subjects in each experiment. PSEs were defined as the vernier offset at which the fitted functions intersected 50% top/bottom reported offsets. The lower graphs in (b) and (d) show the average difference in PSEs between the two adaptation conditions for each subject and for the entire group. Error bars indicate bootstrapped 95% confidence intervals, and p values are based on the group-permuted null distribution.

Unifying Visual Space Across the Left and Right Hemifields 11
were concatenated in their original order, without any breaks or pauses between frames. The final video was cropped centrally to a square and scaled to 49.1° × 49.1°, with a mean luminance of 0.025 cd/m2 across frames (maximum: 0.16 cd/m2, minimum: 0.0021 cd/m2). Sub-jects viewed the video without audio, starting the video from the beginning in the first block of trials. Each subse-quent top-up adaptation phase continued the video from the previous adaptation phase. The next block of trials in the same adaptation direction continued the video from the previous session. The video was then repeated for the other adaptation direction, starting from the begin-ning. This resulted in a 30-min viewing time of the same unique video for each adaptation direction.
Experiment 3b. The adapting stimulus consisted of rotational Glass patterns (Glass, 1969) on a black back-ground (Fig. 6c). Patterns were generated by first posi-tioning 250 circular dots (0.46° diameter) at randomly selected x- and y-coordinates within an invisible screen-centered box (54.8° × 54.8°). Dot pairs were then pro-duced by positioning an additional 250 dots at matching x- and y-coordinates, rotated 3° around the center of the display. An additional 500 dots (250 pairs) were added to the pattern by flipping the x-coordinates of the existing dot pairs around the horizontal center of the display, for a total of 1,000 dots (500 pairs) per pattern. The colors of individual dot pairs were determined by independently drawing random RGB intensity values (mean luminance: 0.11 cd/m2), and the color of each dot pair matched the color of its mirror-symmetric counterpart. Unlike the other two adaptation stimuli, this stimulus contained no linear cues across the vertical meridian. Therefore, we maxi-mized the availability of visual cues across the meridian by adding vertical mirror symmetry. Patterns were mirror symmetric with respect to the vertical meridian. A new pattern was generated every 83 ms for a presentation rate of 12 Hz. Sequences of independent rotational Glass patterns previously have been shown to induce a percept of rotational global motion (ambiguous in direction) in the absence of any coherent motion information (Ross et al., 2000).
Procedure. The procedure for Experiment 3 was similar to that for Experiment 1, except that the initial adaptation period was 9 min and the top-up adaptation was 2 min in Experiment 3a. In Experiments 3a and 3b, each subject com-pleted four runs with adaptation conditions interleaved.
Results
We used scenes from a Hollywood movie for Experi-ment 3a. Results showed a significant negative afteref-fect, consistent with that found in Experiment 1a: a
mean vernier offset of 0.16° (SEM = 0.052) in the direc-tion of adaptation was necessary to cancel the per-ceived misalignment caused by adaptation (Fig. 6b; p < .001, permutation test). In Experiment 3b, we used sequences of static Glass patterns. Results showed a significant negative aftereffect, consistent with the ear-lier experiments: a mean vernier offset of 0.14° (SEM = 0.060) was necessary to correct the perceived misalign-ment (Fig. 6d; p = .0074, permutation test).
Discussion
We report a previously unknown adaptation effect: Adaptation to global misalignments between the two hemifields can have marked effects on the perceived alignment of subsequently viewed vernier lines (Experi-ment 1a). Importantly, this aftereffect was induced by dynamic stimuli with rapidly varying, random content, which ruled out local adaptation to low-level features, such as orientation, spatial frequency, motion, color, or form. This aftereffect was found to be selective to mis-alignments across the vertical meridian: Adaptation to misalignments between the upper and lower visual fields (Experiment 1b) or adaptation to misalignments within the same hemifield (Experiment 2a) resulted in little or no aftereffect. Furthermore, the same aftereffect was found following adaptation to offsets between the left and right visual fields for a Hollywood movie (Experiment 3a) and even stimuli lacking coherent motion or orientation signals (Experiment 3b). Our results reveal a dynamic calibration mechanism in the visual system that maintains perceptual alignment between the left and right visual fields, a mechanism critical for the stable perception of space.
The magnitude of the aftereffect (~6% of the adapted offset) is comparable with aftereffects from other types of adaptation. For instance, prism adaptation results in an aftereffect that is 11% of the adapted shift (Pick & Hay, 1964). However, unlike subjects in prism adapta-tion experiments, naive subjects in our experiments were unaware of the direction or even the existence of the spatial offset between the split halves. Moreover, our results suggest that there is some degree of indi-vidual variability in the observed aftereffects. For exam-ple, not all subjects showed significant aftereffects from adaptation, which could be due to individual differ-ences in sensitivity to misalignment and the speed with which it is corrected, consistent with previous reports on individual variability in perceiving negative afteref-fects (e.g., Immergluck, 1966; Morgan, 2011).This selec-tive adaptation across the vertical meridian cannot be predicted by any previously reported form of adapta-tion. Figural aftereffects (Köhler & Wallach, 1944) dis-tort perceived shape but do not predict our results, as

12 Chen et al.
our test stimulus did not match the adaptation stimuli in form. Density adaptation (Hisakata et al., 2016) can-not account for our results because the surrounding density and proximity of adapting elements were bal-anced above and below the test stimulus. Our findings are distinct from the tilt aftereffect (Gibson, 1933; Gibson & Radner, 1937) because our adapting stimulus did not have any net orientation that could bias the subsequent judgment. The presence of a shifted frame could induce perceived misalignments (the Roelofs effect; Bridgeman, Peery, & Anand, 1997), but we minimized the effect of a reference frame by presenting the stimuli in a circular aperture that was viewed through neutral density filters, preventing visibility of screen edges and the surround-ing room. Although the vernier aftereffect (Wolfe, 1987) and aftereffects from position adaptation (Hess & Doshi, 1995; Whitaker, McGraw, & Levi, 1997) can produce apparent position shifts following adaptation, they are short range, rely on local features, require extended exposure of a stable stimulus, and, most important, do not account for the presently observed asymmetry between splits along the vertical and horizontal merid-ians. Likewise, prism adaptation (Harris, 1963; Pick et al., 1969) and adaptation to image skew (Habtegior-gis, Rifai, Lappe, & Wahl, 2017) can alter perceived loca-tion, but it is not selective to the vertical meridian, which distinguishes it from the mechanism revealed in our study.
Several other effects might be able to produce a perceived misalignment, but they are also fundamen-tally different from ours and cannot account for our results. For example, focused attention can distort visual space, as in the attentional repulsion effect (Suzuki & Cavanagh, 1997). However, in the present case, subjects’ attention was directed to a demanding central fixation task during the adaptation period, and there was also no attentional cue that could alter the perceived location of the vernier test flashes. In addi-tion, our results were not due to motion-induced posi-tion shifts following motion adaptation (Nishida & Johnston, 1999; Whitney, 2005; Whitney & Cavanagh, 2003; see Whitney, 2002, for a review), as our stimuli had no net motion, and adaptation to randomly moving stimuli does not generate a position aftereffect (Harp, Bressler, & Whitney, 2007). Although saccadic eye movements were not tracked, they are unlikely to account for our effect because subjects performed a demanding central fixation task during the adaptation periods. Furthermore, any saccadic mislocalization at the moment the test was presented could not be in opposite directions for the two hemifields.
Our results reveal an adaptive and automatic recali-bration of perceived alignment across the two hemifields. Models have been proposed to explain how the visual system calibrates collinearity and adjacency during
normal neural development (Ahumada & Mulligan, 1990; Maloney & Ahumada, 1989). These processes could be invaluable in development, and the resulting mapping would remain rigid in adulthood because of relatively stable optics and image statistics. Except for atypical conditions such as prism adaptation or brain pathology, misalignments are usually assumed to be slow to occur, as would be the corrective visual realignment (Redding & Wallace, 2003). However, our experiments demon-strated that the recalibration of alignment between left and right visual fields can occur with as little as 8 min of adaptation. This adaptation may call on similar pro-cesses to those that initially calibrate alignment all over the visual field, but this residual alignment processing remains operative only for differences across the vertical meridian.
The nasotemporal overlap of receptive fields cen-tered on the vertical meridian undoubtedly contributes to unifying the left and right hemifields in general, but it cannot account for the aftereffects we found. Previous research indicates that the overlap is a narrow strip with edges no more than 1° or 2° from the vertical midline (Blakemore, 1969; Fendrich, Wessinger, & Gazzaniga, 1996). Because we covered the vertical meridian with an occluder, our adapting stimuli were at least 1.75° (2.25° for Experiment 2b) from the vertical midline, and the vernier test stimuli were also 10° away from the center. Instead, the selective recalibration process that we found is likely to depend on a sophisticated network of interhemispheric communications with a variety of signals carrying both local and global visual features. It is possible that neurons with receptive fields close to the vertical meridian develop specialized long-range connections with those in the other hemisphere and with nearby receptive fields. Interhemispheric synchro-nization between cells in the two hemispheres with similar orientation or motion preference (Engel, Konig, Kreiter, & Singer, 1991) has been reported and might be part of the local-scale anatomical support for the recalibration process. Notably, our results also demon-strate that even without local orientation or motion cues (Glass patterns), the visual system is still able to register the overall misalignment and adapt to it. In this case, global structure detectors or symmetry cues, which are stronger across the vertical meridian (Herbert & Humphrey, 1996), could also play a role in signaling overall align-ment between the visual hemifields (Ostwald, Lam, Li, & Kourtzi, 2008; Wilson & Wilkinson, 1998; Wilson, Wilkinson, & Asaad, 1997).
For most of the visual field, the lack of a dynamic global recalibration process indicates that the visual system opts for a relatively rigid mapping between neu-rons with nearby receptive fields, subject to local adap-tation effects, such as position, motion, and orientation (Hess & Doshi, 1995; Whitney, 2002; Wolfe, 1987).
Unifying Visual Space Across the Left and Right Hemifields 13
Between the left and right visual fields, however, our results suggest that the visual system computes a global correspondence, which can adapt and modify apparent alignment to unify the left and right halves of visual space.
Action Editor
Edward S. Awh served as action editor for this article.
Author Contributions
The experiments were conceived by Z. Chen, A. Kosovicheva, P. Cavanagh, A. Gorea, and D. Whitney. Software was pro-grammed by A. Kosovicheva and Z. Chen. Data were analyzed by Z. Chen and A. Kosovicheva. The manuscript was drafted by Z. Chen and A. Kosovicheva and reviewed and edited by Z. Chen, A. Kosovicheva, B. Wolfe, A. Gorea, P. Cavanagh, and D. Whitney. The figures were made by Z. Chen and A. Kosovicheva. Z. Chen and A. Kosovicheva are co–first authors on this article.
ORCID iD
Zhimin Chen https://orcid.org/0000-0002-8075-072X
Declaration of Conflicting Interests
The author(s) declared that there were no conflicts of interest with respect to the authorship or the publication of this article.
Funding
This research was supported by National Institutes of Health Grant R01 EY018216 to D. Whitney and by funding from the European Research Council (ERC) under the European Union’s Seventh Framework Programme (FP7/2007–2013; ERC Grant AG324070) and Dartmouth College to P. Cavanagh.
Supplemental Material
Additional supporting information can be found at http://journals.sagepub.com/doi/suppl/10.1177/0956797617735534
Open Practices
All data and materials have been made publicly available via the Open Science Framework and can be accessed at https://osf.io/vjacn/. The complete Open Practices Disclosure for this article can be found at http://journals.sagepub.com/doi/suppl/10.1177/0956797617735534. This article has received badges for Open Data and Open Materials. More information about the Open Practices badges can be found at http://www .psychologicalscience.org/publications/badges.
References
Ahumada, A. J., & Mulligan, J. B. (1990). Learning recep-tor positions from imperfectly known motions. In B. E. Rogowitz & J. P. Allebach (Eds.), Proceedings Volume
1249, Human vision and electronic imaging: Models, methods, and applications (pp. 124–134). Bellingham, WA: SPIE. doi:10.1117/12.19665
Blakemore, C. (1969). Binocular depth discrimination and the nasotemporal division. The Journal of Physiology, 205, 471–497. doi:10.1113/jphysiol.1969.sp008978
Brainard, D. H. (1997). The Psychophysics Toolbox. Spatial Vision, 10, 433–436.
Bridgeman, B., Peery, S., & Anand, S. (1997). Interaction of cognitive and sensorimotor maps of visual space. Perception & Psychophysics, 59, 456–469. doi:10.3758/BF03211912
Efron, B., & Tibshirani, R. J. (1993). An introduction to the bootstrap. London, England: Chapman & Hall.
Engel, A., Konig, P., Kreiter, A., & Singer, W. (1991). Interhemispheric synchronization of oscillatory neuronal responses in cat visual cortex. Science, 252, 1177–1179. doi:10.1126/science.252.5009.1177
Fendrich, R., Wessinger, C. M., & Gazzaniga, M. S. (1996). Nasotemporal overlap at the retinal vertical meridian: Investigations with a callosotomy patient. Neuropsychologia, 34, 637–646. doi:10.1016/0028-3932(95)00155-7
Gibson, J. J. (1933). Adaptation, after-effect and contrast in the perception of curved lines. Journal of Experimental Psychology, 16, 1–31. doi:10.1037/h0074626
Gibson, J. J., & Radner, M. (1937). Adaptation, after-effect and contrast in the perception of tilted lines. I. Quantitative studies. Journal of Experimental Psychology, 20, 453–467. doi:10.1037/h0059826
Glass, L. (1969). Moiré effect from random dots. Nature, 223, 578–580. doi:10.1038/223578a0
Habtegiorgis, S. W., Rifai, K., Lappe, M., & Wahl, S. (2017). Adaptation to skew distortions of natural scenes and reti-nal specificity of its aftereffects. Frontiers in Psychology, 8, Article 1158. doi:10.3389/fpsyg.2017.01158
Harp, T. D., Bressler, D. W., & Whitney, D. (2007). Position shifts following crowded second-order motion adap-tation reveal processing of local and global motion without awareness. Journal of Vision, 7(2), Article 15. doi:10.1167/7.2.15
Harris, C. S. (1963). Adaptation to displaced vision: Visual, motor, or proprioceptive change? Science, 140, 812–813. doi:10.1126/science.140.3568.812
Herbert, A. M., & Humphrey, G. K. (1996). Bilateral symmetry detection: Testing a “callosal” hypothesis. Perception, 25, 463–480. doi:10.1068/p250463
Hess, R. F., & Doshi, S. (1995). Adaptation to spatial offsets. Perception, 24, 1407–1426.
Hisakata, R., Nishida, S., & Johnston, A. (2016). An adapt-able metric shapes perceptual space. Current Biology, 26, 1911–1915. doi:10.1016/j.cub.2016.05.047
Immergluck, L. (1966). Resistance to an optical illusion, fig-ural after-effects, and field dependence. Psychonomic Science, 6, 281–282. doi:10.3758/BF03328067
Köhler, W., & Wallach, H. (1944). Figural after-effects: An investigation of visual processes. Proceedings of the American Philosophical Society, 88, 269–357.
Lienhart, R. W. (1998). Comparison of automatic shot bound-ary detection algorithms. In M. M. Yeung, B.-L. Yeo, & C. A. Bouman (Eds.), Proceedings Volume 3656: Storage

14 Chen et al.
and retrieval for image and video databases VII (pp. 290–301). Bellingham, WA: SPIE. doi:10.1117/12.333848
Maloney, L. T., & Ahumada, A. J. (1989). Learning by assertion: Two methods for calibrating a linear visual system. Neural Computation, 1, 392–401. doi:10.1162/neco.1989.1.3.392
Morgan, M. J. (2011). Wohlgemuth was right: Distracting attention from the adapting stimulus does not decrease the motion after-effect. Vision Research, 51, 2169–2175. doi:10.1016/j.visres.2011.07.018
Nishida, S., & Johnston, A. (1999). Influence of motion signals on the perceived position of spatial pattern. Nature, 397, 610–612. doi:10.1038/17600
Nolan, C., Roven, C., Thomas, E., Orleans, L. (Producers), & Nolan, C. (Director). (2008). The dark knight [Motion picture]. United States: Warner Brothers.
Ostwald, D., Lam, J. M., Li, S., & Kourtzi, Z. (2008). Neural cod-ing of global form in the human visual cortex. Journal of Neurophysiology, 99, 2456–2469. doi:10.1152/jn.01307.2007
Otten, M., Pinto, Y., Paffen, C. L. E., Seth, A. K., & Kanai, R. (2016). The uniformity illusion: Central stimuli can determine peripheral perception. Psychological Science, 28, 56–68. doi:10.1177/0956797616672270
Pelli, D. G. (1997). The VideoToolbox software for visual psy-chophysics: Transforming numbers into movies. Spatial Vision, 10, 437–442.
Pick, H. L., & Hay, J. C. (1964). Adaptation to prismatic dis-tortion. Psychonomic Science, 1, 199–200. doi:10.3758/BF03342863
Pick, H. L., Hay, J. C., & Martin, R. (1969). Adaptation to split-field wedge prism spectacles. Journal of Experimental Psychology, 80, 125–132. doi:10.1037/h0027111
Redding, G. M., & Wallace, B. (2003). Dual prism adaptation: Calibration or alignment? Journal of Motor Behavior, 35, 399–408. doi:10.1080/00222890309603159
Ross, J., Badcock, D. R., & Hayes, A. (2000). Coherent global motion in the absence of coherent velocity signals. Current Biology, 10, 679–682. doi:10.1016/S0960-9822(00)00524-8
Suzuki, S., & Cavanagh, P. (1997). Focused attention dis-torts visual space: An attentional repulsion effect. Journal of Experimental Psychology: Human Perception and Performance, 23, 443–463.
Weintraub, D. J., & Krantz, D. H. (1971). The Poggendorff illusion: Amputations, rotations, and other perturbations. Perception & Psychophysics, 10, 257–264. doi:10.3758/BF03212818
Whitaker, D., McGraw, P. V., & Levi, D. M. (1997). The influence of adaptation on perceived visual location. Vision Research, 37, 2207–2216. doi:10.1016/S0042-6989(97)00030-8
Whitney, D. (2002). The influence of visual motion on per-ceived position. Trends in Cognitive Sciences, 6, 211–216. doi:10.1016/S1364-6613(02)01887-9
Whitney, D. (2005). Motion distorts perceived position with-out awareness of motion. Current Biology, 15, 324–326. doi:10.1016/j.cub.2005.04.043
Whitney, D., & Cavanagh, P. (2003). Motion adaptation shifts apparent position without the motion aftereffect. Perception & Psychophysics, 65, 1011–1018. doi:10.3758/BF03194830
Wilson, H. R., & Wilkinson, F. (1998). Detection of global structure in Glass patterns: Implications for form vision. Vision Research, 38, 2933–2947.
Wilson, H. R., Wilkinson, F., & Asaad, W. (1997). Concentric orientation summation in human form vision. Vision Research, 37, 2325–2330. doi:10.1016/S0042-6989(97) 00104-1
Wolfe, J. M. (1987). The vernier aftereffect. Perception, 16, 593–597. doi:10.1068/p160593