Embed Size (px)
Citation preview

Unified Frontend and Backend Industrie 4.0 Roadmap forSemiconductor Manufacturing
Bernd Waschneck∗Graduate School advanced
Manufacturing Engineering (GSaME)- Universität Stuttgart
70569 Stuttgart, Germanybernd.waschneck@gsame.
uni-stuttgart.de
Lee Wei Fong BrianInfineon Technologies Asia Pacific Pte
LtdSingapore 349282
Koh Chey Woon BennyInfineon Technologies (Malaysia) Sdn.
Bhd.75350 Melaka
Christoph RipplerInfineon Technologies AG93049 Regensburg, Germany
Gottfried SchmidInfineon Technologies AG93049 Regensburg, Germany
ABSTRACTIndustrie 4.0 or digitalization of manufacturing currently create un-certainty and unrest in the manufacturing industry as many playersdo not know when, how or whether a disruptive change in industrywill happen. Many published high-level strategies stay vague andleave practitioners unsure what to expect. Breaking Industrie 4.0down into tangible pieces and steps is necessary for transportingthe vision into reality. In this paper we develop an assessmentand roadmap for Industrie 4.0 in semiconductor manufacturing -the FINCA model. The model covers semiconductor frontend andbackend manufacturing. It was successfully applied and tested atone of Europe’s largest semiconductor manufacturers, the InfineonTechnologies AG. Results from the assessment are presented in thispaper.
CCS CONCEPTS• Applied computing → Reference models; Enterprise infor-mation systems; • General and reference; • Computer systemsorganization→ Embedded and cyber-physical systems;
KEYWORDSIndustrie 4.0, Digitalization, Automation, Roadmap, SemiconductorManufacturing
1 INTRODUCTIONIndustrie 4.0, digitalization or digital transformation create a spiritof optimism but also a high uncertainty in the manufacturing in-dustry. On a general level the three terms have the same meaning:The introduction of digital technology into manufacturing. Manyconsultancies and research institutions expect a high impact onmanufacturing by the so-called fourth industrial revolution. Fraun-hofer IPA estimates an average cost reduction potential of about30% [3].∗corresponding author
SamI40 workshop at i-KNOW ’17 October 11-12, 2017, Graz, AustriaCopyright ©2017 for this paper by its authors. Copying permitted for private andacademic purposes.
Industrie 4.0 is a set of contemporary automation and data sci-ence technologies, as well as organizational paradigms for manu-facturing in the 21st century. The core of Industrie 4.0 are Cyber-Physical-Systems (CPS), which connect the physical and the virtualworld [5]. McKinsey & Company clusters the disruptive technolo-gies which enable this concept under four headlines [2]:
• Data, computational power and connectivity,• Analytics and intelligence,• Human-machine interaction,• Digital-to-physical conversion.
The high number of different technologies associated with Industrie4.0 leads to the question of prioritization of different approachesat companies. In a fast moving field, with standardization still on-going, companies are reluctant to make investments in new tech-nologies. High-level strategies offer little orientation as they donot get specific enough to derive concrete recommendations. Thefear of investing into the wrong technology slows down innova-tion tremendously. Strategies need to be broken down into smallerparts to provide tangible steps towards the implementation of anIndustrie 4.0 vision.
There are several assessments and roadmaps for Industrie 4.0and digitalization available (section 3). Still, no framework candirectly be applied to semiconductor manufacturing. Most assess-ments are general and not industry-specific which leaves roomfor interpretation and leads to subjective results of the assessment.Additionally, no framework is currently available which can beapplied to semiconductor frontend and backend to compare thelevel of digitalization in these manufacturing steps.
In this paper, we present a framework for Industrie 4.0 in semi-conductor manufacturing. The framework can be applied to fron-tend and backend production. It can be used as assessment androadmap for further development of the manufacturing site. Thepurpose of the framework is
• to foster a common understanding between Industrial Engi-neering, IT and Business on the existing capabilities,
• to create a vision for further development in semiconductormanufacturing,
• to identify gaps at manufacturing sites,

i-know ’17, October 11.-12., 2017, Graz, Austria Bernd Waschneck et al.
• to support benchmarking between semiconductor manufac-turing companies, and
• to enable a fast assessment of acquired sites within integra-tion projects.
In the section 2, we will describe the semiconductor manufac-turing process and the difference between frontend and backend.In section 3, existing frameworks, assessments and roadmaps forIndustrie 4.0 will be presented. We also highlight some existingroadmaps for the semiconductor industry. None of the existingframeworks offers a detailed semiconductor specific assessmentand roadmap which can be used for frontend and backend manu-facturing. Therefore, we developed the FINCA Model which will bepresented in section 4. In section 5, the model is applied to frontendand backend sites of the Infineon Technologies AG and results arediscussed. In the conclusion (section 6), further research directionsand applications are presented.
2 SEMICONDUCTOR MANUFACTURINGPROCESS
The semiconductor manufacturing process starts in the frontend.Structures in the sub-µm range are processed on raw wafers, whichare thin slices of crystalline silicon. The manufacturing processrequires a cleanroom as dust or other particles can destroy thesub-µm structures during the fabrication process. From a manu-facturing point of view, frontends are complex job shops (for adetailled description see [18]). This production type is usually usedfor custom-made items but semiconductor manufacturing is a massproduction with a strong economy of scale. Industrial mass pro-duction is mostly done in assembly lines but this concept is notsuitable for semiconductor manufacturing due the nature of thephysical processes on the wafer.
Semiconductor frontends are considered high-tech with complexprocesses and high levels of automation and digitalization. They arevery capital intensive and mostly located in advanced economies.
After the frontend the wafers are brought into an intermediatestorage facility, the so-called die bank. From the die bank the wafersare taken to the backend, the second and final manufacturing step.At the backend, the wafers are cut into separate dies. The diesare bonded to a leadframe, which connects the chip to electricalcontacts on the outside of the package. After the bonding, the chipsare packaged and sealed in order to make them robust againstenvironmental impacts. The final product is now ready for sale.
In contrast to the frontend, the backend is traditionally a moremechanical and labor-intensive process rather located in low-costcountries. Latest backend technologies which comprises of assem-bly and final test became more sophisticated and more complex.
3 RELATEDWORK: INDUSTRIE 4.0ASSESSMENTS, FRAMEWORKS,BENCHMARKS AND ROADMAPS FOR THESEMICONDUCTOR INDUSTRY
The Platform Industrie 4.0 released the Reference ArchitectureModel Industrie 4.0 (RAMI 4.0) [17]. RAMI 4.0 focuses on interfacesand standardization. The model has a broad scope. It is suitable
for comparison of standards and identification of gaps in standard-ization. RAMI 4.0 has successfully been applied to semiconductormanufacturing [19].
There are several Industrie 4.0 assessments and roadmaps avail-able [1, 4, 6, 16]. Still, all of them are on a general level and cannotbe directly applied to semiconductor manufacturing. Our model isguided by the methodology of the VDMA Maturity model [1].
For technology development and the continuous shrinking ofsemiconductor devices (Moore’s law) the International TechnologyRoadmap for Semiconductors (IRTS [20] and ITRS 2.0 [7]) played acrucial role. ITRS has a section on Factory Integration (FI, Manufac-turing IT) which provides guidance. However, ITRS is not updatedany more and is not linked to recent developments such as Industrie4.0. The successor of the ITRS, the International Roadmap for De-vices and Systems (IDRS [13]) which is part of the IEEE rebootingcomputing Initiative [15], is currently more focused on semicon-ductor technology. However, IDRS has not yet published influentialmaterial on digitalization in semiconductor manufacturing.
The increase in wafer size has always lead to substantial changesin manufacturing engineering at semiconductor plants. However,the switch to 450mm wafer-size has been delayed and is not ex-pected within the next 2-3 years [12].
Current initiatives mostly focus on the application of specifictechnologies in semiconductor manufacturing without providing afull picture. Here, the focus is on intelligent algorithms [8, 10] andbig data [14]. For specific areas in semicondcutor manufacturingdetailed roadmaps exist, e.g. for dispatching [18].
All in all, the existing frameworks lack scope, are too general intheir recommendations or do not focus on digitalization.
4 THE FINCA MODELThe FINCA model is an Industrie 4.0 assessment and roadmapfor the semiconductor industry for both frontend and backendmanufacturing. It was developed at Infineon Technologies AG. Themain properties are already encoded in the abbreviation FI-N-C-A:
• Factory Integration (FI):FI refers to all IT services necessary to run a semiconductorproduction. In some companies the responsible organizationis called “Manufacturing IT” and can be under IT or a differ-ent central function, local factories or cluster management.Among different tasks, FI’s mission is to ensure standard-ization within the company. At Infineon Technologies AG,FI is under the corporate supply chain function and has themission to standardize across regions and manufacturinglevels while maintaining and even increasing capabilities ofthe manufacturing system landscape.
• Normalized:Capabilities are, wherever possible, independent from region,manufacturing levels (frontend, backend) and products. Ide-ally any frontend site can be compared to any backend siteusing the normalized capabilities. There are five levels foreach category going from zero (no capability or no systemto support paper/manual process) to four (capability imple-mented in professional IT system and used to the fullestextend in regards of industry standards). Each category canbe split into several sub-categories that need to be assessed

Unified Frontend and Backend Industrie 4.0 Roadmap for Semiconductor Manufacturing i-know ’17, October 11.-12., 2017, Graz, Austria
Level 0 Level 1 Level 2 Level 3 Level 4
Process rules are defined Changes are documented
[paper]
Standalone system with
Semi Auto decision
proposal
Standalone system with
Auto decision proposal
Integrated system with
Auto decision making
Partially simulation [Lot
Start] & manual
scheduling, dispatching &
recoding
Partially simulation
[whole process] & manual
scheduling, Snap-Shot
dispatching & system
recoding
Snap Shot simulation
[whole process] & Real
Time scheduling,
dispatching & system
recoding
Snap Shot simulation
[whole process] & Real
Time scheduling,
dispatching & system
recoding
Real Time simulation
[whole process] & Real
Time scheduling,
dispatching & system
recoding
Paper document, No
recording, Manual
control with No
processing of data
Paperless document,
Manual recording,
manual control with
Storage of data for
documentation
Paperless document,
Manual recording,Semi
auto control with
Analyzing data for
process monitoring
Paperless document,
Manual recording, Online
control with Evaluation
for process planning
/control
Paperless document,
Auto recording, Online
control with Automatic
process planning /
control
Limited [<50%] Data
Availability / Accuracy,
with Manual data
provision from
Product/Planning To MES
System.
Limited [<70%] Data
Availability / Accuracy,
with Semi Auto data
provision from
Product/Planning To MES
System.
Limited [<90%] Data
Availability / Accuracy,
with Automatic data
provision from
Product/Planning To MES
System.
Limited [<100%] Data
Availability / Accuracy,
with Automatic data
provision from
Product/Planning To MES
System.
FULL Data Availability /
Accuracy, with Automatic
& Real time data
provision from
Product/Planning To MES
System.
Manual storage & retrival
with Manual transport
delivery & Loading system
Manual storage & retrival
with Automated
transport delivery with
Semi auto Loading
system
Manual storage & retrival
with Automated
transport delivery with
Automated Loading
system
Automated storage &
retrival with Automated
transport delivery with
Automated Loading
system
Automated storage &
retrival with Automated
transport delivery with
Automated Loading
system [Linked up]
Manual Identification,
validation & traceability.
Auto Identification of
Product [Lot Level], Auto
Validation of employee
qualification .
Auto Identification of
Mounted Material, Auto
Validation of employee
qualification .
Auto Identification,
validation & traceability
[Strip Level].
Auto Identification,
validation & traceability
[Single Device].
No communication,
Manual triggering for
Setup / Change over
SEC/GEM Connection or
Other EQ Connection (Eg :
iTec/Tec), Machine Alarm
retrieval, Semi Auto
Identification of
setup/change over
Automated Retrieval of
data from machine, Auto
Triggering for Setup /
Change over
Automated transfer of
Logistic data, Automated
Release, Flexible
schedule of Maint base
on production situation.
Load & Go indetification
od Setup, Predictive
Maintenance.
Material
Handling
Material
Identification &
Tracking
Equipment
Automation
7 Dimensions of Automation
Workflow
Automation
WIP Flow
Management
Process Control
Automation
Manufacturing
Data
Management
Industrie 4.0 Level
Figure 1: Overview of the different dimensions and their maturity levels in the FINCA model.

i-know ’17, October 11.-12., 2017, Graz, Austria Bernd Waschneck et al.
Pre-requisite
Connect the data
See what is happening
Understand what is happening
Anticipate what will happen
System decides what will happen Automated decisions
Prediction
Knowledge
Information
Connection
Stabilization & Standardization
Figure 2: A general model of different Industrie 4.0 maturity levels used at Infineon Technologies AG.
individually and aggregated using a simple numerical aver-age (no weighting).
• Capability:Focusing entirely on capabilities and availability (rollout %)of those capabilities in one location/sub location (whatevermakes sense in terms of an existing homogeneous capabilitylandscape). Out of scope are architecture, technology stack,service levels, application names, source of the applications(build vs. buy) and infrastructure. Applications are only usedin an abstract way like application classes e.g. “Manufactur-ing Execution System (MES)”. Application roadmaps, sta-bility and architecture changes are only considered if theyadd/remove capabilities.
• Assessment:The FINCA model has to be assessed and filled by the busi-ness owner of a site or sub-site, usually supported by busi-ness domain experts, FI domain experts and FI business ana-lysts. Business process experts and FI business analysts are incharge to keep the normalization of all dimensions (the grid)up to date, so the comparison independent of manufacturinglevels or region is always possible.
The FINCA Model consists of seven dimensions and several subcategories. Each dimension can achieve a value from level zero (lowcapability) to level four (maximum in terms of desired capability).An overview of the dimensions is given in Fig. 1. Every dimensionis described more precisely with the number of sub categoriesthat are to be rated during the assessment. While all levels areseparately defined, they follow a general guideline with differentmaturity levels. The different levels are depicted as a knowledgepyramid in Fig. 2. The foundation of the pyramid is “Stabilization& Standardization” and goes up to “Automated decisions”:
• Stabilization & Standardization: Process is according tostandard and running stable. First, local data collection is inplace.
• Connection: Data sources are connected, standardized andcan be accessed globally.
• Information: From data to visualized information, e.g. KPIsand cockpits. System processes data to gain information andto create transparency.
• Knowledge: Classification of events based on informationthat may lead to triggered actions or automatic generationof proposals for action.
• Prediction: Predict future events by simulation, machinelearning or complex mathematical/statistical models.
• Automated decisions: Autonomous systems base theirdecisions on anticipated events and an awareness for theirenvironment.
To score a sub category, certain criteria have to be taken intoconsideration. They are called differentiators. Those differentiatorsare specific features and their existence (or their extend) in a factorycan be used to rate a capability.
For example, the differentiator “tool connectivity” can be used torate the APC/FDC (Advanced Process Control / Fault Control andClassification) capability of a site. The tool connectivity determinesto a great deal the amount of data that is available in the first placeto allow for process control and monitoring.
As some factories do not have a consistent level e.g. some lineshave more automation capabilities than other lines in the samefactory, the level of a sub category can be broken down into multiplerollout scenarios. As some machines in a factory have a betterconnectivity than others a coverage/distribution/rollout percentagefactor has to be applied. For example, if 80% of a factory’s machinepark has an availability of 50% of the critical parameters coveredin APC/FDC (equals level four) and 20% is connected but has acoverage below 50% (equals level three), the overall rating for thissub category is (80 · 4 + 20 · 3)/100 = 3.8.
Not always all five levels are available, in that case only existinglevels as per description have to be used.
Once each sub category has a calculated value based on thedifferentiators and the distribution of coverage across the levels,the overall dimension level is to be calculated as the average (nonweighted) of its sub categories levels.

Unified Frontend and Backend Industrie 4.0 Roadmap for Semiconductor Manufacturing i-know ’17, October 11.-12., 2017, Graz, Austria
In the following, the capability categories and their sub-categoriesare presented. An overview of the capability categories is given inFig. 1.
4.1 Workflow AutomationWorkflow automation has seven sub-categories
• Deviation Management System• WIP Routing (Workflow, Lot Route, . . . )• Exception Management (Workflow)• Subcon [External] / Inter Site [Internal] Management• Small Lot Size Mastering [Lot Size 1]• High Automation Load & Go• Experiment Management System for Sample and Engineer-ing Lots
The definition of the levels is given in table 1.
4.2 WIP Flow ManagementWIP flow management has five sub-categories
• Forecasting for Volume• Dispatching• Scheduling• Work Area Control• Capacity Planning
The definition of the levels is given in table 2.
4.3 Process Control AutomationProcess control automation has eleven sub-categories
• Documentation & Documents• Dynamic Parameters• Check Sheets• Work-In-Progress Data• Sampling & Buyoff• Recipe Handling• Process Time Window / N2 Cabinet• Statistical Process Control (SPC)• Statistical Bin Analysis/ Automatic Lot Release• Advanced Process Control/ Fault Detection and Classifica-tion
• Metrology
The definition of the levels is given in table 3 and 4.
4.4 Manufacturing Data ManagementManufacturing data management has eight sub-categories
• Master Data Systems Availability• Master Data Systems Change/ Release• Master Data Static Systems Accuracy• Master Data Dynamic Systems Accuracy• Operational Production Reporting• Aggregated Reporting• Data Analysis• Lot Release
The definition of the levels is given in table 5, 6, 7 and 8.
4.5 Material HandlingMaterial handling has three sub-categories
• Storage & Retrieval System• Transport & Delivery System• Loading System [Robotics]
The definition of the levels is given in table 9.
4.6 Material Identification and TrackingMaterial identification and tracking has nine sub-categories
• Product (WIP)/ Device (Lot, Strip, Chip) Identification, Vali-dation & Traceability
• Production Material & Wafer Material Identification, Valida-tion & Traceability
• Tool Identification, Validation & Traceability• Carrier / Container Identification, Validation & Traceability• Equipment Identification & Validation• Operator Identification & Validation• Non-Productive Products / materials / tools [durables] /Equipment
• Unified Material Mapping• Split & Merge
The definition of the levels is given in table 10 and 11.
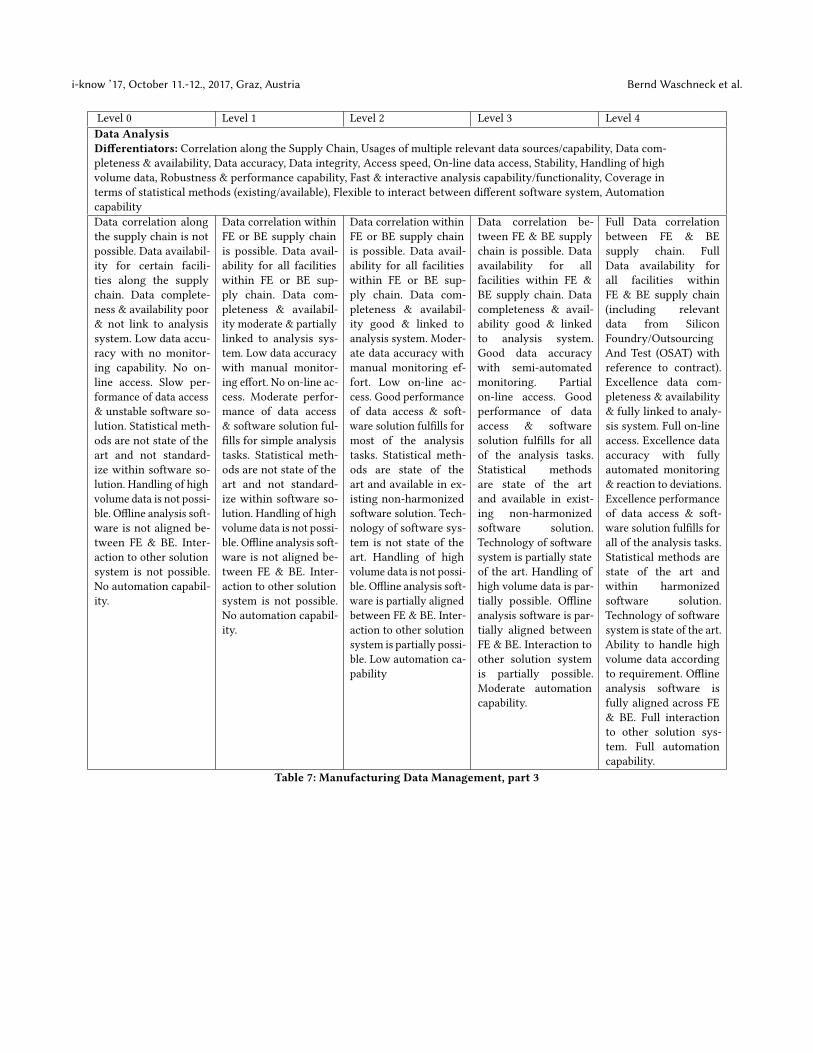
4.7 Equipment AutomationEquipment automation has six sub-categories
• Equipment Interface• Equipment Data• Automated Setup/Change Over• Equipment Health Monitoring• Maintenance• Input loading/ Output loading
The definition of the levels is given in table 12 and 13.
5 APPLICATION OF FINCA TOSEMICONDUCTOR FRONTEND ANDBACKEND MANUFACTURING SITES
The FINCA model has been tested by semiconductor productionexperts of the Infineon Technologies AG. The model has success-fully been applied as internal benchmark. The results were usedto identify best practices and lead factories in certain areas. Nextsteps for development of the sites could be identified.
As an example for the application of the model the aggregatedresults of one frontend and one backend site the Infineon Tech-nologies AG are discussed. The aggregated outcomes are shownin Fig. 3. The axis have been rescaled, but still allow for a relativecomparison and discussion.
The semiconductor frontend is relatively advanced in terms ofIndustrie 4.0. Frontends of the Infineon Technologies AG have avery high degree of automation. The Infineon site in Dresden is the200mm-wafer-size frontend with the highest degree of automation[11]. Traditionally, backends have a lower degree of automationwhich can also be seen in this example. Still, backends are catchingup as rising wages and energy prices in low cost manufacturinglocations put semiconductor manufacturers under pressure [9].

i-know ’17, October 11.-12., 2017, Graz, Austria Bernd Waschneck et al.
Application to a Frontend site of the Infineon Technologies AG
Workflow Automation
WIP flow Management
Process ControlAutomation
Manufacturing DataMgmt
Material Handling
Material Identification& Tracking
EquipmentAutomation
Workflow Automation
WIP flowManagement
Process ControlAutomation
Manufacturing DataMgmt
Material Handling
Material Identification& Tracking
EquipmentAutomation
Application to a Backend site of the Infineon Technologies AG
Figure 3: The FINCAmodel applied to a frontendmanufacturing site and a backendmanufacturing site. The axis are uniformlyrescaled and do not show the absolute results of the model. A relative comparison is still valid.
According to a McKinsey & Company analysis Industrie 4.0 offersjust the right tools for these productivity gains in backend [9].
Digitalization in capital-intensive frontends has started in theearly 1980s. The early introduction of Manufacturing ExecutionSystems (MES) has lead to legacy systems in production. The learn-ing from the frontend MES could be applied to the backend whereintroduction started significantly later. This difference can be seenin the FINCA dimension Manufacturing Data Management: Thefrontend site scores relatively low, while this is a strong dimensionfor the backend. This reflects the effort at the backend sites in therecent years to introduce a solid foundation for digitalization.
The assessment has provided useful insights for the next steps atboth sites. Best practices or tools at different sites could be identifiedand transferred to other manufacturing locations.
6 CONCLUSIONIn this paper we presented an assessment and roadmap for Industrie4.0 for both frontends and backends. The FINCA model has beensuccessfully applied at Infineon Technologies AG. It has provenitself to be a useful tool at evaluation and roadmapping for futureimprovements.
With this publication the authors want to foster the exchangewith science as well as other semiconductor companies. In science,the FINCA model can be used as guideline how semiconductormanufacturers envision manufacturing in the future. The FINCAmodel assists researchers to find open challenges and problems.New technologies and approaches from science can help semi-conductor manufacturers to reach new levels of productivity andquality.
The authors want to use the FINCA model to exchange withother semiconductor companies on their vision of Industrie 4.0 forsemiconductor manufacturing. Furthermore, the assessment canbe used for manufacturing benchmarks with other semiconductorcompanies.
FINCA was developed for semiconductor manufacturing. Still,we think the general model is also valid for other manufacturing
industries. It is especially suitable for job shop production systemswith large amounts of standardized products. The authors inviteother industries to apply and test the model in their scope andwelcome the exchange of experiences with FINCA.
ACKNOWLEDGMENTSThanks to all who contributed to the Framework: E Chui Geok,Frank Banzhoff, Frank Lehmann, Lim Shaw Ming Daniel, MichaelFoerster, Joerg Domaschke, Woi Teck Khiong, Walter Laure, Hans-Juergen Wimberger, Sim Wee Sien, Yeo Danny, Teh Min Kiap,Christian Knoell, Michael Brueggemann, Daniela Eknigk, MathiasHaeuser, Chan Wai Ling, Nina Trude-Kuschel, Andrew Low, GohKian Thong, Marco Tschemmer, Harald Heinrich, Tan Jee Liang Jef-frey, Karl Horst Hohenwarter, Klaus Sandtner, Dirk Loeffelmacher,Gustl Kreuzberger, Ronald Bianchin, Torsten Quaas, Tong SoonHock Adrian, Olaf Herzog.
A part of the work has been performed in the project PowerSemiconductor and Electronics Manufacturing 4.0 (SemI40), undergrant agreement No 692466. The project is co-funded by grantsfrom Austria, Germany, Italy, France, Portugal and - ElectronicComponent Systems for European Leadership Joint Undertaking(ECSEL JU).
Thisworkwas supported as part of the joint undertaking “SemI40”by the German Federal Ministry of Education and Research underthe grant 16ESE0074. Results and statements in this paper reflectthe viewpoint of the authors.
REFERENCES[1] R Anderl, A Picard, Y Wang, J Fleischer, S Dosch, B Klee, and J Bauer. [n. d.].
Guideline Industrie 4.0-Guiding principles for the implementation of Industrie4.0 in small and medium sized businesses. In VDMA Forum Industrie, Vol. 4.
[2] H Bauer, C Baur, G Camplone, et al. 2015. Industry 4.0: How to navigate digitiza-tion of the manufacturing sector. tech. rep., McKinsey Digital (2015).
[3] Thomas Bauernhansl. 2016. WGP-Standpunkt Industrie 4.0. WGP, Wis-senschaftliche Gesellschaft für Produktionstechnik.
[4] Thomas Bauernhansl and Uwe Dombrowski. 2016. Einfluss von Industrie 4.0 aufunsere Fabriken und die Fabrikplanung. (2016).

Unified Frontend and Backend Industrie 4.0 Roadmap for Semiconductor Manufacturing i-know ’17, October 11.-12., 2017, Graz, Austria
[5] Thomas Bauernhansl, Michael Ten Hompel, and Birgit Vogel-Heuser. 2014. In-dustrie 4.0 in Produktion, Automatisierung und Logistik: Anwendung, Technologienund Migration. Springer Vieweg Wiesbaden.
[6] Jürgen Bischoff, Christoph Taphorn, Denise Wolter, Nomo Braun, Man-fred Fellbaum, Alexander Goloverov, S Ludwig, T Hegmanns, C Prasse, MHenke, et al. [n. d.]. Erschließen der Potenziale der Anwendung von In-dustrie 4.0 im Mittelstand. agiplan GmbH, Mühlheim an der Ruhr ([n.d.]). http://www.zenit.de/fileadmin/Downloads/Studie_im_Auftrag_des_BMWi_Industrie_4.0_2015_agiplan_fraunhofer_iml_zenit_Langfassung.pdf
[7] J. A. Carballo, W. T. J. Chan, P. A. Gargini, A. B. Kahng, and S. Nath. 2014.ITRS 2.0: Toward a re-framing of the Semiconductor Technology Roadmap. In2014 IEEE 32nd International Conference on Computer Design (ICCD). 139–146.https://doi.org/10.1109/ICCD.2014.6974673
[8] Chen-Fu Chien, Mitsuo Gen, Yongjiang Shi, and Chia-Yu Hsu. 2014. Manufac-turing intelligence and innovation for digital manufacturing and operationalexcellence. Journal of Intelligent Manufacturing 25, 5 (01 Oct 2014), 845–847.https://doi.org/10.1007/s10845-014-0896-5
[9] Koen de Backer, Matteo Mancini, and Aditi Sharma. 2017. Opti-mizing back-end semiconductor manufacturing through Industry 4.0.(2017). http://www.mckinsey.com/industries/semiconductors/our-insights/optimizing-back-end-semiconductor-manufacturing-through-industry-40
[10] Ganesh Hedge. 2017. Toward Smarter Manufacturing. (2017). https://semiengineering.com/toward-smarter-manufacturing/
[11] Bernd Hops. 2015. Mikroelektronik-Fertigung: Spitzentechnologie in derChipherstellung: die 200-mm-Fertigung mit dem weltweit höchsten Au-tomatisierungsgrad. (2015). http://www.plattform-i40.de/I40/Redaktion/DE/Anwendungsbeispiele/001-mikroelektronik-fertigung-infineon-technologies/beitrag-mikroelektronik-fertigung-infineon-technologies.html
[12] Josephine Lien and Jessie Shen. 2017. Transition to 18-inch wafers remains yearsaway, says Applied. (2017). http://www.digitimes.com/news/a20170223PD207.html
[13] S. Mashiro. 2016. Factory Integration fosus area in the IRDS. In 2016 InternationalSymposium on Semiconductor Manufacturing (ISSM). 1–2. https://doi.org/10.1109/ISSM.2016.7934500
[14] J. Moyne, J. Samantaray, and M. Armacost. 2016. Big Data Capabilities Appliedto Semiconductor Manufacturing Advanced Process Control. IEEE Transactionson Semiconductor Manufacturing 29, 4 (Nov 2016), 283–291. https://doi.org/10.1109/TSM.2016.2574130
[15] Institute of Electrical and Electronics Engineers. 2012. IEEE rebooting Computing.(2012). http://rebootingcomputing.ieee.org/
[16] GuÌĹnther Schuh, Reiner Anderl, Juergen Gausemeier, Michael ten Hompel,and Wolfgang (Hrsg.) Wahlster. 2017. Industrie 4.0 Maturity Index: Die digitaleTransformation von Unternehmen gestalten. Herbert Utz Verlag, MuÌĹnchen.
[17] DIN SPEC. 2016. 91345:2016-04 Referenz-Architekturmodell Industrie 4.0 (RAMI4.0). DIN (2016).
[18] Bernd Waschneck, Thomas Altenmüller, Thomas Bauernhansl, and AndreasKyek. 2016. Production Scheduling in Complex Job Shops from an Industry 4.0Perspective: A Review and Challenges in the Semiconductor Industry.. In SAMI@iKNOW.
[19] Bernd Waschneck and Gottfried Schmid. 2016. Rami 4.0 in der Praxis:Vom Modell in den Reinraum. IT & Production - Das Industrie 4.0-Magazinfür erfolgreiche Produktion (2016). http://www.it-production.com/allgemein/rami-4-0-in-der-praxisvom-modell-in-den-reinraum/
[20] LindaWilson. 2013. International technology roadmap for semiconductors (ITRS).Semiconductor Industry Association (2013).

i-know ’17, October 11.-12., 2017, Graz, Austria Bernd Waschneck et al.
A APPENDIX
Level 0 Level 1 Level 2 Level 3 Level 4Deviation Management SystemDifferentiators: Detection [Auto / Manual], Containment [Auto / Manual], Release [Auto / Manual]Process to handle devi-ation is defined, paperrecording of deviation,no deviation system inplace
Manual detection withauto hold, auto detec-tion with manual hold(standalone), manualdetection with manualhold
Auto detection with de-fined action / contain-ment for quality andyield areas (auto hold)
Following harmonizedcontainment actionthrough standardizeddeviation flow at FE /BE
Auto detection withauto hold for nonquality related areas,integration of FE-BEdeviation systems (BE:List down three Lotsbefore and after ifproblem detected)
WIP Routing (Workflow, Lot Route, . . . )Differentiators: Decision [Auto / Semi Auto / Manual], # of Criteria [Single, Multiple]Rule defined Manual decision by line
personnelManual decision by en-gineers
Automated proposal bysystem but decision byhuman (Eg: Subcon se-lection based on load)
Automated proposal bysystem and decision bysystem (Eg: Path selec-tor)
Exception Management (Workflow)Differentiators: Decision [Auto / Semi Auto / Manual], # of Criteria [Single, Multiple], Complexity [simple, complexmodels], TraceabilityRule defined, no trace-ability of decision mak-ing
Manual decision, simplemodels
Manual Decision, sim-ple models, traceabilityof decision making
Automated proposal bysystem but decision byhuman (Eg : Subcon se-lection based on load),complex models, trace-ability of decision mak-ing
Automated proposalby system and de-cision/execution bysystem (Eg: Path Selec-tor), complex models,traceability of decisionmaking
Subcon [External] / Inter Site [Internal] ManagementDifferentiators: Data Transfer [paper, File Transfer], Visibility [Black Box, Sub Operation, Sub Step], Data availabilityData exchange throughpaper
Data exchange throughfile transfer (in & outinfo)
Data exchange throughfile transfer for sub stepinfo (Eg: Subcon opera-tion points)
Data exchange throughfile transfer for sub step,process & equipmentinfo
Subcon MES is fullyintegrated to companyMES (including report-ing), real time view oflot status, real time de-viation control
Small Lot Size Mastering [Lot Size 1]Differentiators: Data Transfer [paper, File Transfer], Visibility [Black Box, Sub Operation, Sub Step], Data availabilityFE: Full wafer cassetteprocessing, BE: Stan-dard lot size (e.g. 25Wafer) process for allprocesses
FE: No full wafercassette processing, BE:Standard lot size (e.g.25 Wafer) process forcertain processes
FE: Compound Lot, BE:Sub Standard Lot size(e.g. Magazine)
FE: - , BE: Lead frame lotsize process
Die level lot size pro-cess.
High Automation Load & GoDifferentiators: Loading [Auto / Semi auto / Manual]Manual loading Manual loading linked
with MESSemi auto loadinglinked with MES
Auto loading [withmanual robot feeding],linked with MES
Auto loading [Full au-tomation], linked withMES
Table 1: Workflow Automation

Unified Frontend and Backend Industrie 4.0 Roadmap for Semiconductor Manufacturing i-know ’17, October 11.-12., 2017, Graz, Austria
Level 0 Level 1 Level 2 Level 3 Level 4Experiment Management System for Sample and Engineering LotsDifferentiators:Number of capabilities (auto split/merge lot, recipe name and parameter overwriting, APC overwriting,. . .), Existence of an experiment management systemManual creation & re-lease, manual mainte-nance, fixed/static alter-nate item (Route, Billof Material, Tool plan...)upon release, no experi-ment management sys-tem
Fixed Route uponrelease, existing exper-iment managementsystem, basic ca-pabilities (routing,equipment/equipment-setup/tools)
Fixed route upon re-lease some capabilities
Flexible route editing af-ter release all capabili-ties
Forecasting for VolumeDifferentiators: Data Feed [Manual / Auto], Frequency, Scope [work center / line / factory], Method [Simulation /Mathematic Formula]FE: Simulation & mathematical optimization, BE: Mathematical optimizationManual data feed,
weekly forecasting,work center forecastingmanual reporting
Manual data feed, dailyforecasting, work centerforecasting, manual re-porting
Semi-automatic datafeed, 6hrs - 8hrs fore-casting, line forecasting,manual Reporting
Semi-automatic datafeed, 6hrs - 8hrs fore-casting, whole factory,auto reporting
Automatic data feed,4hrs - 6hrs forecasting,whole factory, auto re-porting
DispatchingDifferentiators: Integrated line control [one system apply to whole supply chain], Compliance [work center / line /factory], Flexibility [rules definition by Equipment / Work center/ line], Timeliness<50% Compliance >50% Compliance >80% Compliance >90% Compliance 100% Compliance [Fully
Automated], real time,integrated line control,full flexibility
SchedulingDifferentiators: Integrated line control [one system applied to whole supply chain], Compliance [work center / line /factory], Flexibility [rules definition by Equipment / Work center/ line], Timeliness, Data integrity, Scope [lot start /whole line]Paper recording of
creation/update sched-ule (fixed time, volumebased)
System recording ofcreation/update sched-ule (fixed time, volumebased), system warningof maintenance due
System warning of cre-ation/update due, sys-tem stop of mainte-nance due (integrated toMES)
Automated predictivecreation/update
Automated cre-ation/update schedulebased on capacity op-timization (integratedto resource, tools, spareparts demand, WIP)
Work Area Control [Radar]Differentiators: Users [Operator / Supervisor / Engineers], Scope [work center, Line, Equipment], Information [4M -Man, Machine, Method, Material], Timeliness, View consolidation [One View, Multiple, easy access, mobility]View of critical line con-trol information at theequipment
Snap-shot dashboard(multiple views) ofcritical line control in-formation (all systems)
Snap-shot dashboard(1view) of critical line con-trol information (all Sys-tems)
Real-time dashboard(multiple views) ofcritical line control in-formation (all systems)
Real-time Dashboard (1view) of critical line con-trol information (all sys-tems)
Capacity PlanningManual Single Work Center
only (Bottle Neck),manual
MultipleWork Center &Line, manual
Complete factory level,manual and partial auto
Complete factory level,auto
Table 2: WIP Flow Management

i-know ’17, October 11.-12., 2017, Graz, Austria Bernd Waschneck et al.
Level 0 Level 1 Level 2 Level 3 Level 4DocumentsDifferentiators: Paper / paperless, Search for correct Doc, Revision managementPaper documents on
equipment, manualsearch for the correctdocument (standalone),manual control todisplay the latestrevision
Paperless documentson equipment, manualsearch for the correctdocument (standalone),manual control todisplay the latestrevision
Paperless documentson equipment, semi au-tomated search for thecorrect document (nonintegrated/standalone),manual/automatedcontrol to display thelatest revision
Paperless document onequipment, automatedsearch for the correctdocument (integrated -one transaction), man-ual control to displaythe latest revision
Paperless documentin system, automatedsearch for the correctdocument (integrated- one transaction),automated controlto display the latestrevision
Dynamic ParametersDifferentiators: Paper / paperless, Search for correct Document, Revision managementPaper documents onequipment, manualsearch for the correctinfo (standalone), man-ual control to displaythe latest revision
paperless documentson equipment, manualsearch for the correctinfo (standalone), man-ual control to displaythe latest revision
Paperless documentson equipment, semiautomated search forthe correct info (nonintegrated/standalone),manual/automatedcontrol to display thelatest revision
Paperless info on equip-ment, automated searchfor the correct info (in-tegrated - one transac-tion), manual control todisplay the latest revi-sion
Paperless info in system,automated search thecorrect info (integrated- one transaction), auto-mated control to displaythe latest revision
Check Sheet (Reminder to check tasks, anti-mix, Setup Yield, Test Program)Differentiators: Paper / Paperless / Online control, Validationpaper check sheet withno validation
paper check sheet withvalidation, four eyes val-idation
paperless check sheetwith validation, foureyes validation, definedranges
paperless check sheetwith validation, foureyes validation, definedranges, warning/hold ifout of range
online control
WIP Data (Equipment Data Collection, Lot Info)Differentiators: Paper / paperless /online control, Validationpaper WIP data collec-tion
paperless WIP data col-lection
paperless WIP data col-lection with validation,defined ranges
paperless WIP data col-lection with validation,warning/hold if out ofrange
online control [auto col-lection of WIP data]
Sampling & Buyoff (Products)Differentiators: Paper / paperless / nothing, Triggering, Sampling Type [Static / Dynamic]paper based, manualtriggering, static sam-pling, 100% samplingrate, execution [man-ual]
paperless, manual trig-gering, static sampling,fix sampling rate, execu-tion [manual]
paperless, automatedtriggering, static sam-pling, fix sampling rate,execution [manual]
paperless, automatedtriggering, static sam-pling, fix sampling rate,execution [automated]
paperless, automatedtriggering, dynamicsampling, execution[automated]
Recipe Handling (Tester recipe, Handler recipe, Assembly Recipe)Differentiators: Recipe Release, Recipe select / download, Recipe Validation [Body check]manual select from localm/c, manual adjustmentafter download
semi auto select from lo-cal m/c, manual adjust-ment after download
manual download ofrecipe from central stor-age, manual adjustmentafter download
semi automated down-load of recipe from cen-tral storage, manual ad-justment after down-load
automated downloadof recipe from centralstorage (one transac-tion), no adjustmentafter download
Process Time Window / N2 Cabinet (Min / Max time control)Differentiators: Data Collection, Data Validation, Decision Makingno recording manual recording, man-
ual validationautomated recording,manual validation
automated recording,automated validation[min max]
automated recording,automated validation[pre-warning beforeand during process],automated decision
Table 3: Process Control Automation, part 1

Unified Frontend and Backend Industrie 4.0 Roadmap for Semiconductor Manufacturing i-know ’17, October 11.-12., 2017, Graz, Austria
Level 0 Level 1 Level 2 Level 3 Level 4Statistical Process Control (SPC)Differentiators: Data Collection, Data Validation, Decision Making (Lot Hold/ Tool Stop/ Trigger re-measurement)
manual data collection,manual validation, man-ual decision making
manual data collection,manual validation, auto-mated decision making(lot hold)
manual data collection,automated validation,automated decisionmaking (lot hold)
automated data collec-tion, automated valida-tion, automated deci-sion making (lot hold,tool stop, trigger re-measurement)
Statistical Bin Analysis/ Automatic Lot Release (ALR)Differentiators: Data Collection, Analysis level, Validation, Decision Making)manual input, h-binanalysis only, manualDefect Density Manage-ment System trigger,manual validation
manual input, h-binanalysis only, autoDefect Density Manage-ment System trigger,manual validation
manual input, h-binanalysis only, autoDefect Density Manage-ment System trigger,automated validation(lot hold)
automated input (fromtest/handler summary),h-bin & s-bin analysis(offline ALR), manualDefect Density Manage-ment System trigger, au-tomated validation (lothold)
automated input (fromtest/handler summary),automated analysis ofs-bin (ALR), automatedDefect Density Manage-ment System trigger, au-tomated validation (lothold)
Advanced Process Control/ Fault Detection and ClassificationDifferentiators: Tool Connectivity, Online Reaction, Out-of-Control Action Plan (OOCAP), Regular review processimplementedtools not connected [noapc data flow]
tool connected [apcdata flow], some lim-its defined, e-mailnotification
1st online reaction [toolstop, lot hold, inhibitnext lot] has been estab-lished with oocap.
50% critical parametersonline reaction [toolstop, lot hold, inhibitnext lot] has been estab-lished with oocap.
>90% critical param-eters online reaction[tool stop, lot hold,inhibit next lot] hasbeen established withoocap. Regular reviewprocess implemented.
MetrologyDifferentiators: Scope [all measurement], Virtual for level fourSPC, physical measure-ment at define time in-terval
SPC, physical measure-ment at a control inter-val [event base]
SPC, physical measure-ment at a control inter-val, linked with MES
APC, linked with MES virtual metrology
Table 4: Process Control Automation, part 2

i-know ’17, October 11.-12., 2017, Graz, Austria Bernd Waschneck et al.
Level 0 Level 1 Level 2 Level 3 Level 4Master Data Systems AvailabilityDifferentiators: Standardization local, Data coverage (compared to overall site’s master data content), Timelinessnon harmonized, no
use of global masterdata sets, only cascadefrom global to local oncall
- limited local changeof global master datasets, 4M (Man, Machine,Method, Material)partially available inMES, batch/delayedcascade of global tolocal
- high level of standard-ization global/local, nolocal change of globalmaster data sets, 4M(Man, Machine, Method,Material) fully availablein MES, global immedi-ately cascade to local
Master Data Systems Change/ ReleaseDifferentiators:Maintenance [Manual / Auto], Release [Manual / Auto], Personal efficiency of the staff using the system,Capability of mass update automation, Workflow support (new workflow, workflow controlled data + performancemanagement), Flexibility of data entry, Integrated effect analysis capability for change management, Analysis capability,Rollback capabilitymanual maintenance/synchronization/ en-richment, manualrelease, manual datachanges from globalplanning/product toMES, not connecteddata structures betweenglobal and local (tedioussync), analysis capabil-ity not set up, rollbacksare not supported
semi-auto data changesfrom global plan-ning/product to MES(non assisted)
auto mainte-nance/synchronization,manual release, mappeddata structures betweenglobal and local withadaptions and aggre-gation, ability to domass-change for globalchange for non depen-dency items, abilityto do mass-release forglobal change for nondependency items lowlevel of analysis capabil-ity implemented, somemanual enrichment ofmaster data locally
semi-auto data changesfrom global plan-ning/product to MES(assisted), auto enrich-ment of master datalocally high level ofanalysis capabilityimplemented
auto mainte-nance/synchronization,auto release, auto datachanges from globalplanning/product toMES, equivalent datastructures betweenglobal and local (fastsync), ability to domass-changes for itemsof dependency, abilityto do mass-releasefor global changes foritems of dependency,full rollback capabilityon mass and individualchanges full objectdependent level ofanalysis capability im-plemented, not requiredenrichment of masterdata locally
Master Data Static Systems AccuracyDifferentiators: Integrity [accuracy / timely]low data integrity, no in-formation on integrityavailable
- high data integrity, se-lect/pick lists assisteddata entry for all avail-able selections
high data integrity, se-lect/pick lists assisteddata entry for reducedselections (segment rel-evant)
high data integrity, in-formation on integrityavailable (plausibilitycheck) measurable
Master Data Dynamic Systems AccuracyDifferentiators: Integrity [accuracy / timely]low data integrity, no in-formation on integrityavailable, no aides (picklists)
select/pick lists assisteddata entry generatedmanual input
high data integrity, se-lect/pick lists assisteddata entry generatedfrom static Master Data
- high data integrity, in-formation on integrityavailable (plausibilitycheck) measurable,highly consistent withstatic Master Data
Table 5: Manufacturing Data Management, part 1

Unified Frontend and Backend Industrie 4.0 Roadmap for Semiconductor Manufacturing i-know ’17, October 11.-12., 2017, Graz, Austria
Level 0 Level 1 Level 2 Level 3 Level 4Operational Production ReportingDifferentiators: Standardization [Local, Global], Flexibility [Fix, flexible], Data Storage [Equipment, Local, Central],Integrity [accuracy / timely], Drill down functionality/capability, Automated report generation, Interlinking with mobiledevicesuser generated reportsby segment/site/usergroups (BusinessObjects, excel), nostandardization ofreporting & manuallygenerated, no link tomobile devices
central generated cus-tomized reports by seg-ment/site/user groups,no standardization oncluster level - FE & BE,no link to mobile de-vices
mixture of cluster -wide (FE & BE) andcustomized reportsby segment/site/usergroups, no standard-ization between FE &BE, no link to mobiledevices
1. regular report2. cluster-wide harmo-nized reportsa) same formula, datasourceb) same toolc) with different level ofaggregation3. no standardization be-tween FE & BE4. partially interlinkingto mobile devices
1. on time2. harmonized reportsbetween FE & BEa) same formula, datasourceb) same toolc) with different level ofaggregation3. can be easily cus-tomized & automatedreporting4. drill down functional-ity is available & easy touse5. interface to manufac-turing reporting6. able to fulfill all levelsof reporting from man-agement to engineering7. fully interlinking tomobile devices
Aggregated ReportingDifferentiators: Standardization [Local, Global], Flexibility [Fix, flexible], Data Storage [Equipment, Local, Central],Integrity [accuracy / timely], Drill down functionality/capability, Automated report generation, Interlinking with mobiledevices.user generated reportsby segment/site/usergroups (bo, excel),no standardization ofreporting & manuallygenerated, no link tomobile devices
central generated cus-tomized reports by seg-ment/site/user groups,no standardization oncluster level - FE & BE,no link to mobile de-vices
mixture of cluster -wide (FE & BE) andcustomized reportsby segment/site/usergroups, no standard-ization between FE &BE, no link to mobiledevices
1. regular report2. cluster-wide harmo-nized reportsa) same formula, datasourceb) same toolc) with different level ofaggregation3. no standardization be-tween FE & BE4. partially interlinkingto mobile devices
1. on time2. harmonized reportsbetween FE & BEa) same formula, datasourceb) same toolc) with different level ofaggregation3. can be easily cus-tomized & automatedreporting4. drill down functional-ity is available & easy touse5. interface to manufac-turing reporting6. able to fulfill all levelsof reporting from man-agement to engineering7. fully interlinking tomobile devices
Table 6: Manufacturing Data Management, part 2
i-know ’17, October 11.-12., 2017, Graz, Austria Bernd Waschneck et al.
Level 0 Level 1 Level 2 Level 3 Level 4Data AnalysisDifferentiators: Correlation along the Supply Chain, Usages of multiple relevant data sources/capability, Data com-pleteness & availability, Data accuracy, Data integrity, Access speed, On-line data access, Stability, Handling of highvolume data, Robustness & performance capability, Fast & interactive analysis capability/functionality, Coverage interms of statistical methods (existing/available), Flexible to interact between different software system, AutomationcapabilityData correlation alongthe supply chain is notpossible. Data availabil-ity for certain facili-ties along the supplychain. Data complete-ness & availability poor& not link to analysissystem. Low data accu-racy with no monitor-ing capability. No on-line access. Slow per-formance of data access& unstable software so-lution. Statistical meth-ods are not state of theart and not standard-ize within software so-lution. Handling of highvolume data is not possi-ble. Offline analysis soft-ware is not aligned be-tween FE & BE. Inter-action to other solutionsystem is not possible.No automation capabil-ity.
Data correlation withinFE or BE supply chainis possible. Data avail-ability for all facilitieswithin FE or BE sup-ply chain. Data com-pleteness & availabil-ity moderate & partiallylinked to analysis sys-tem. Low data accuracywith manual monitor-ing effort. No on-line ac-cess. Moderate perfor-mance of data access& software solution ful-fills for simple analysistasks. Statistical meth-ods are not state of theart and not standard-ize within software so-lution. Handling of highvolume data is not possi-ble. Offline analysis soft-ware is not aligned be-tween FE & BE. Inter-action to other solutionsystem is not possible.No automation capabil-ity.
Data correlation withinFE or BE supply chainis possible. Data avail-ability for all facilitieswithin FE or BE sup-ply chain. Data com-pleteness & availabil-ity good & linked toanalysis system. Moder-ate data accuracy withmanual monitoring ef-fort. Low on-line ac-cess. Good performanceof data access & soft-ware solution fulfills formost of the analysistasks. Statistical meth-ods are state of theart and available in ex-isting non-harmonizedsoftware solution. Tech-nology of software sys-tem is not state of theart. Handling of highvolume data is not possi-ble. Offline analysis soft-ware is partially alignedbetween FE & BE. Inter-action to other solutionsystem is partially possi-ble. Low automation ca-pability
Data correlation be-tween FE & BE supplychain is possible. Dataavailability for allfacilities within FE &BE supply chain. Datacompleteness & avail-ability good & linkedto analysis system.Good data accuracywith semi-automatedmonitoring. Partialon-line access. Goodperformance of dataaccess & softwaresolution fulfills for allof the analysis tasks.Statistical methodsare state of the artand available in exist-ing non-harmonizedsoftware solution.Technology of softwaresystem is partially stateof the art. Handling ofhigh volume data is par-tially possible. Offlineanalysis software is par-tially aligned betweenFE & BE. Interaction toother solution systemis partially possible.Moderate automationcapability.
Full Data correlationbetween FE & BEsupply chain. FullData availability forall facilities withinFE & BE supply chain(including relevantdata from SiliconFoundry/OutsourcingAnd Test (OSAT) withreference to contract).Excellence data com-pleteness & availability& fully linked to analy-sis system. Full on-lineaccess. Excellence dataaccuracy with fullyautomated monitoring& reaction to deviations.Excellence performanceof data access & soft-ware solution fulfills forall of the analysis tasks.Statistical methods arestate of the art andwithin harmonizedsoftware solution.Technology of softwaresystem is state of the art.Ability to handle highvolume data accordingto requirement. Offlineanalysis software isfully aligned across FE& BE. Full interactionto other solution sys-tem. Full automationcapability.
Table 7: Manufacturing Data Management, part 3

Unified Frontend and Backend Industrie 4.0 Roadmap for Semiconductor Manufacturing i-know ’17, October 11.-12., 2017, Graz, Austria
Level 0 Level 1 Level 2 Level 3 Level 4Lot ReleaseDifferentiators: Data completeness, Data integrity/accuracy, Decision Making, Meet quality requirements, Linkage toother software system (eg. QMP/DDM, archive viewer, Esquare, analysis software . . . ), Automated configuration & han-dling of different type of configuration, Storage capability, Process reporting & analysis capability, Speed/performance/stability, Inter-site/production capabilitydata completeness &availability, poor & nolinkage to software sys-tem, automated deci-sion making not pos-sible, software systemnot meeting quality re-quirement, linkage toother software systemnot possible, manualconfiguration & limitedin terms of complex-ity, no storage capabil-ity, no process report-ing & analysis capabil-ity, slow performance& unstable, no inter-site/production linkag,no FE & BE interlinked,no standard softwaresystem between FE orBE, no different levels ofusers administration
data completeness &availability, moderate& limited linkage tosoftware system, auto-mated decision makingnot possible, softwaresystem partially meet-ing quality requirement,linkage to other soft-ware system partiallypossible, manual con-figuration & limited interms of complexity,no storage capability,no process reporting& analysis capability,slow performance &unstable, limited inter-site/production linkage,no FE & BE interlinked,no standard softwaresystem between FE orBE, no different levelsof users administration
data completeness &availability, moderate& limited linkage tosoftware system, auto-mated decision makingnot possible, softwaresystem meeting qualityrequirement, linkage toother software systempartially possible, semi-automated & handlespartially complexconfiguration, limitedstorage capability, lim-ited process reporting& analysis capability,moderate performance& stable, limitedinter-site/productionlinkage, no FE & BEinterlinked, partiallyharmonized softwaresystem for FE or BE, nodifferent levels of usersadministration
data completeness &availability, good &full linkage to softwaresystem, automateddecision making par-tially possible, softwaresystem meeting qualityrequirement, linkageto other softwaresystem available, semi-automated & handlespartial complex config-uration with limitedFE & BE linkage, goodstorage capability, goodprocess reporting &analysis capability,good performance &stable, partial inter-site/production linkage,partial FE & BE inter-linked, harmonizedsoftware system for FEor BE, different levelsof users administrationpartially available
data completeness &availability, excellence& full linkage to soft-ware system, fullyautomated decisionmaking based on estab-lished rules, softwaresystem meeting qualityrequirement, linkage toother software systemavailable, automated &handles fully complexconfiguration with FE &BE linkage. excellencestorage capability excel-lence process reporting& analysis capability,excellence performance& stable, full inter-site/production linkage,fully interlinked FE& BE, harmonizedsoftware system acrossFE & BE. different levelsof users administrationfully available
Table 8: Manufacturing Data Management, part 4

i-know ’17, October 11.-12., 2017, Graz, Austria Bernd Waschneck et al.
Level 0 Level 1 Level 2 Level 3 Level 4Storage & Retrieval SystemDifferentiators:Manual/ Assisted / Auto, Manual record/ Standalone / Link to MES, Link to Transportation System
automated storage & re-trieval system, linkedto MES, no link totransport system, (FE:stocker)
automated storage& retrieval system,linked to MES, linked totransport system, (FE:stocker)
Transport & Delivery SystemDifferentiators: Manual / Auto Transport System, Standalone / Link to Storage System, Link to Dispatching System,To Drop Point / Equipment, Link to Scheduling System
automated transportsystem (conveyer,AGV), linked to MES,linked to storage sys-tem, to drop point /Equipment
automated transportsystem, (conveyer, AGV,Automated MaterialHandling System),linked to MES, linkedto storage system, todrop point / Equipment,linked to schedulingsystem
Loading System [Robotics]Differentiators: Manual / Auto Transport System, Standalone / Link to Storage System, Link to Dispatching System,To Drop Point / Equipment, Link to Scheduling System
auto link to MES [closedloop] & scheduling
Table 9: Material Handling

Unified Frontend and Backend Industrie 4.0 Roadmap for Semiconductor Manufacturing i-know ’17, October 11.-12., 2017, Graz, Austria
Level 0 Level 1 Level 2 Level 3 Level 4Product (WIP)/ Device (Lot, Strip, Chip) Identification, Validation & TraceabilityDifferentiators: Level [Lot/ Device / Wafer / Strip / Chip], Identify [Manual / Semi Auto / Auto], Validate [Type, ID,Shelf Life, Floor Life], Trace [Manual / Semi Auto / Auto], Equipment Internal wafer trackingmanual identificationon lot level, manualvalidation of in/out-quantity
automated identifi-cation on lot level ,manual validation ofin/out-quantity
automated identifi-cation on lot level,magazine, reel,FE: automated identifi-cation on wafer level,automated validation ofin/out-quantity
Automated identifica-tion on strip level, FE:automated identifica-tion on wafer level,automated validationin/out - quantity, equip-ment internal wafertracking
automated identifi-cation on strip level,automated identifica-tion on single devicelevel after simulation,automated validationon strip and singledevice level,FE: chip level traceabil-ity [only applicable forsome process steps]
Material consumption &Wafer Material Identification, Validation & TraceabilityDifferentiators: Identify [Manual / Semi Auto / Auto], Validate [Type, ID, Shelf Life, Floor Life], Trace [Manual / SemiAuto / Auto]manual identification
(sticker), manual record-ing (paper), manual val-idation (BOM, floor life,shelf life)
manual identification(sticker), manual record-ing (system), autovalidation (BOM, floorlife, shelf life)
semi auto identification(barcode), semi autorecording (barcode),auto validation (BOM,floor life, shelf life)
semi auto identification(barcode), automatedrecording (m/c reader),automated validation(Equipment : BOM,floor life, shelf life)
automated identifi-cation (Equipment :RFID/barcode), auto-mated recording (m/creader), automatedvalidation (Equipment:BOM, floor life, shelflife, consumption)
Tool Identification, Validation & TraceabilityDifferentiators: Identify [Manual / Semi Auto / Auto], Validate [Type, ID, Life span, Maintenance cycle], Trace [Manual/ Semi Auto / Auto]manual identification
(sticker), manual record-ing (paper), manual val-idation (group, ID)
manual identification(sticker), manual record-ing (system), automatedvalidation (group, ID)
semi auto identification(barcode), semi autorecording (barcode),automated validation(group, ID)
semi auto identification(barcode), automatedrecording (m/c reader),automated validation(group, ID)
automated iden-tification (EG :RFID/barcode), au-tomated recording (m/creader), automatedvalidation (group, ID,lifespan)
Carrier / Container Identification, Validation & TraceabilityDifferentiators: Identify [Manual / Semi Auto / Auto], Validate [Type, ID, Life span, Maintenance cycle], Trace [Manual/ Semi Auto / Auto]same as aboveEquipment Identification & ValidationDifferentiators: Identify [Manual / Semi Auto / Auto], Validate [Type, ID, Life span, Maintenance cycle], Trace [Manual/ Semi Auto / Auto]same as above
Table 10: Material Identification and Tracking, part 1

i-know ’17, October 11.-12., 2017, Graz, Austria Bernd Waschneck et al.
Level 0 Level 1 Level 2 Level 3 Level 4Operator Identification & ValidationDifferentiators: Identify [Manual / Semi Auto / Auto], Validate [qualify / not qualify], Trace [Manual / Semi Auto/Auto]manual identification,manual recording (pa-per), manual validation(certification)
manual identification,manual recording (sys-tem), auto validation(certification)
semi auto identification(manual login + bar-code), semi auto record-ing (barcode), auto vali-dation (certification)
semi auto identification(single sign-on), auto-mated recording, auto-mated validation (certi-fication)
automated identifi-cation (Equipment:RFID) automatedrecording (Equipment :M/C reader) automatedvalidation (certification)
Non Productive Products / Materials / Tools [durables] / EquipmentsDifferentiators: Identify [Manual / Semi Auto / Auto], Validate [Type, ID, Life span, Maintenance cycle, Floor life,Shelf Life], Trace [Manual / Semi Auto / Auto]manual identification
(sticker), manual record-ing (paper), manual val-idation (BOM, floor life,shelf life)
manual identification(sticker), manual record-ing (system), autovalidation (BOM, floorlife, shelf life)
semi auto identification(barcode), semi autorecording (barcode),auto validation (BOM,floor life, shelf life)
semi auto identification(barcode), automatedrecording (M/C reader),automated validation(Equipment : BOM,floor life, shelf life)
automated identifica-tion (eg : RFID/barcode),automated recording(M/C reader), au-tomated validation(Equipment : BOM,floor life, shelf life,consumption)
Unified Material MappingDifferentiators: Scope [Full / partial supply chain]no identification standalone system, par-
tial supply chain imple-mentation, manual iden-tification
standalone system, par-tial supply chain imple-mentation, auto identifi-cation
linked with MES, par-tial supply chain imple-mentation, auto identifi-cation
linked with mes, fullsupply chain implemen-tation, auto identifica-tion
Split & MergeDifferentiators: Compliance [Manual / Auto], Execution [Manual / Auto]no rules applied rules in place, manual
validation of rules byline personnel
auto validation by sys-tem
auto splitting by system auto merging by sys-tem according to de-fined rules
Table 11: Material Identification and Tracking, part 2
Unified Frontend and Backend Industrie 4.0 Roadmap for Semiconductor Manufacturing i-know ’17, October 11.-12., 2017, Graz, Austria
Level 0 Level 1 Level 2 Level 3 Level 4Equipment InterfaceDifferentiators: No Connection / Serial / Ethernet, File Transfer/ SECS/GEM / Interface Ano connection serial / GPIB / USB, file
transfer, legacy protocolSECS/GEM - serial port,(min 9600 baud rate -low data bandwidth)
SECS/GEM - ether-net (HSMS - highspeed SECS messag-ing services, highdata rate - 10mb/sec)SECS/GEM, Interface A(extreme high data rate- > 100mb/sec)
Equipment DataDifferentiators: Status [Up/Down], Event [Alarms / Start / Stop], Parameter [Input / Output], Result [Pass / fail],Frequency [Real time for the smallest Unit]status - up/down
(tower light), event -alarm (within equip-ment), result - completecycle/stop, parameter -internal view only
status - signal fromequipment to external,event - limited pre-setlist (manual selection),result - complete cy-cle/stop, parameter - in-ternal view only
status - SECS/GEM,event - unlimited alarmlist from equipment,result - complete cy-cle/stop, parameter- RMS capable, toolstart/stop
status - SECS/GEM,event - automatedalarm list from equip-ment, result - completecycle/stop, param-eter - RMS & APC(input/output) capable,tool start/stop
Automated Setup/Change OverDifferentiators: Triggering [Auto / Manual], Identification [Auto / Manual], Change over [Auto / manual]mechanism - manual,tool - manual, lot man-agement - no, recipe -no
mechanism - manual,tool - manual, lot man-agement - manual keyin lot ID, recipe - man-ual recipe selection
mechanism - autochange by recipe con-trol, tool - manual, lotmanagement - scan ID,lot ID, recipe - RMSmanual download
mechanism - autochange, tool - autochange, lot manage-ment - by host control,recipe - RMS autodownload
mechanism - autochange, tool - autochange, lot manage-ment - by host control,recipe - RMS autodownload, automatedrelease [inline buy off],automated calibration,automated parameteradjust
Equipment Health MonitoringDifferentiators: # of critical parameters to be monitored, Availabilityno monitoring, indica-tor / counter only
monitoring [snap shot],only equipment status,simple health moni-toring on machine (eg:timeout: servo motorand communicationwithin the equipment)
monitoring [snap shot],equipment status & crit-ical alarm, equipmentwith intelligent sensorto provide local heathmonitoring - equipmentrelated
monitoring [snap shot],equipment status, criti-cal alarm & critical pa-rameter, real time APC,health data from ma-chine used to have intel-ligent process control -offline and not real-time(end of a day)
monitoring [real time],equipment status, crit-ical alarm & criticalparameter, linked withlot ID, real time APC,health data from ma-chine used to have intel-ligent process control -offline and real-time (ev-ery lot)
Table 12: Equipment Automation, part 1

i-know ’17, October 11.-12., 2017, Graz, Austria Bernd Waschneck et al.
Level 0 Level 1 Level 2 Level 3 Level 4MaintenanceDifferentiators:Reactive, Proactive, Preventive, Predictive, AssistedMaintenance, Close Loop,MaintenanceMonitoringrun to fail [break down] time & volume based
maintenance, fixedschedule / volume
time & volume basedmaintenance, fixedschedule / volume,integrated to SAP,equipment with intelli-gent sensor to providelocal heath monitoring- equipment related,advice what needs to bechanged before criticalfailure
time & volume basedmaintenance, inte-grated to SAP &MES
predictive modeling,automated schedulingbased on productionsituation e.g. loading,integrated to SAP &MES
Input loading/Output loading (only backend)Differentiators: Batch size, Validation Capabilitysingle input / single out-put loading, manual val-idation
batch loading at input& output manual valida-tion
batch loading at input &output, auto validation,support automatedloading/unloading(Automated MaterialHandling System, AGV,overhead track
robotic handling)
Table 13: Equipment Automation, part 2