Embed Size (px)
Citation preview
1
UNIFI AIF – BLEND Fund
June 2021
Quarterly Review – June 2021
1 Private and Confidential – Circulation to Unit Holders only
UNIFI AIF – BLEND Fund
June 2021
Asymmetric Most people think in stories instead of numbers. They construct a narrative of how they expect things to play out, with perhaps not the best definition of what constitutes risk, as it is something that may derail that narrative. But risk means different things to different people, and by that extension to different firms, and the idea that there is an equilibrium in what constitutes risk is a mistake. In our line of practice of seeking favourable investment outcomes, it is important to appreciate why risk is a factor in constant disequilibrium. So, while the relationship between the raging pandemic and financial markets seem intuitively risky and symmetric, is it so? The numbers are unequivocal in suggesting otherwise. The outperformance of our portfolio companies and those outside our coverage is testament to how quickly markets have reimagined the business models of the leaders over the followers. What broke one end of the long tail in most industries, has led to the consolidation of leaders in the same industry. And fundamental performance of this nature represents one of the most intriguing facets of financial markets where the upside skew can be extraordinary.
The old maxim that financial markets are a barometer of the economy long stands modified. Markets have signified a regime change in the new world, representing industry leaders who are consolidating their dominance, and a new monetary policy framework of low interest rates around the World that is repricing equities. So, while there is pain among smaller businesses [organized or otherwise], the leaders have benefited by virtue of their ability to withstand this phase of disruption. Remember, it is an asymmetric world. At Unifi, we are in a constant state of regression, acutely aware of the changing marketplace, rethinking business models, financial models, the right forecasting horizon, and valuations across the horizons. While individuals are worried about how bad this phase of the pandemic is, the Street is focused on how good things will be for the leaders after the storm passes. And as is the case with most of our companies, and leaders outside our universe, we find that the immediate economic loss is negligible relative to their intrinsic value given the opportunities that lie ahead.
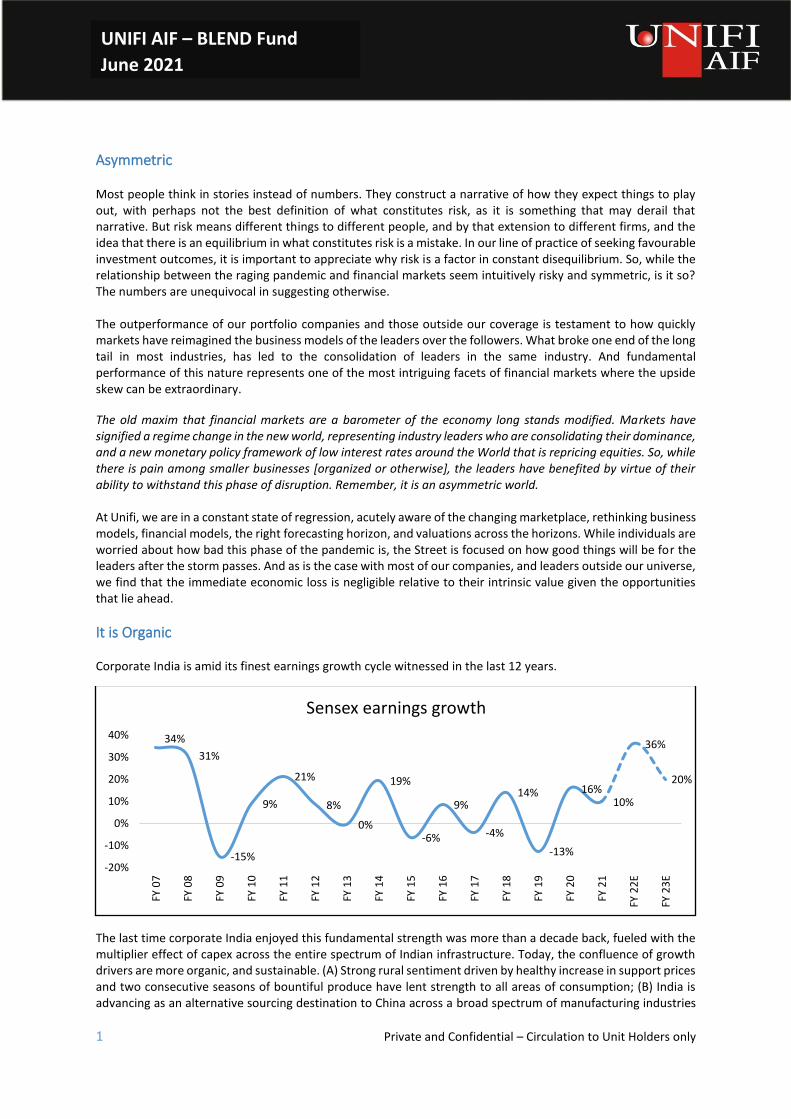
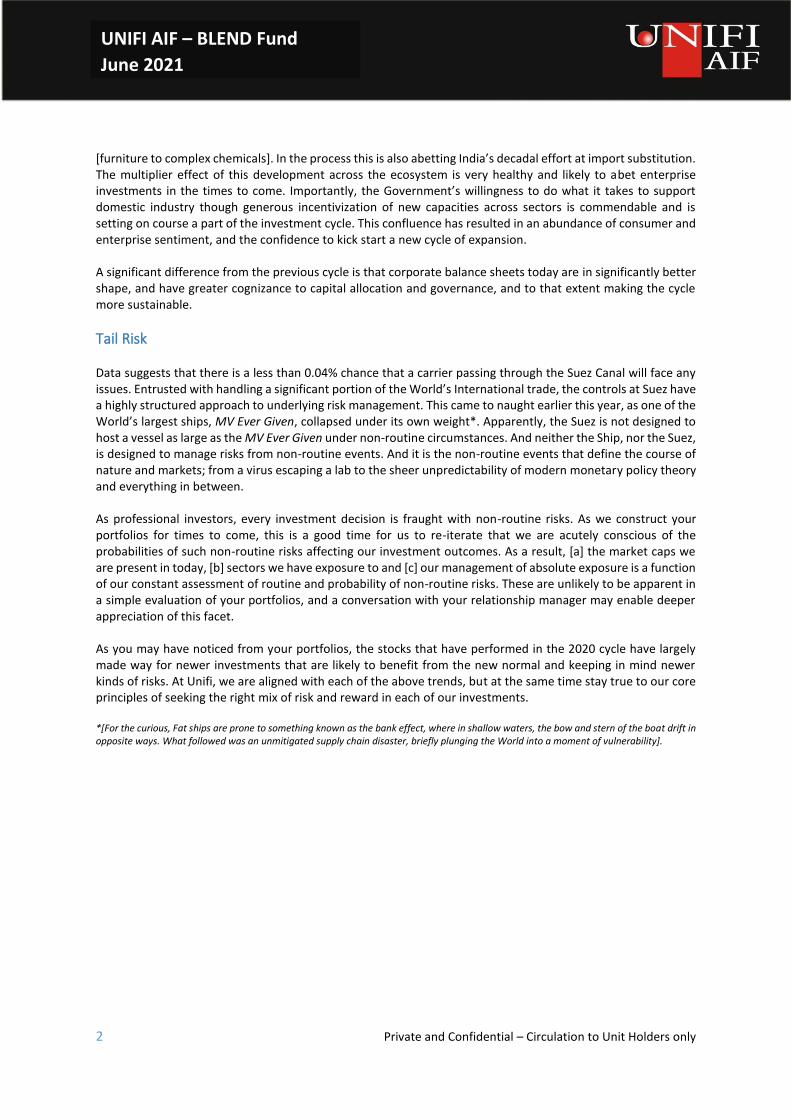
It is Organic Corporate India is amid its finest earnings growth cycle witnessed in the last 12 years.
The last time corporate India enjoyed this fundamental strength was more than a decade back, fueled with the multiplier effect of capex across the entire spectrum of Indian infrastructure. Today, the confluence of growth drivers are more organic, and sustainable. (A) Strong rural sentiment driven by healthy increase in support prices and two consecutive seasons of bountiful produce have lent strength to all areas of consumption; (B) India is advancing as an alternative sourcing destination to China across a broad spectrum of manufacturing industries
34%
31%
-15%
9%
21%
8%
0%
19%
-6%
9%
-4%
14%
-13%
16%10%
36%
20%
-20%
-10%
0%
10%
20%
30%
40%
FY 0
7
FY 0
8
FY 0
9
FY 1
0
FY 1
1
FY 1
2
FY 1
3
FY 1
4
FY 1
5
FY 1
6
FY 1
7
FY 1
8
FY 1
9
FY 2
0
FY 2
1
FY 2
2E
FY 2
3E
Sensex earnings growth
2 Private and Confidential – Circulation to Unit Holders only
UNIFI AIF – BLEND Fund
June 2021
[furniture to complex chemicals]. In the process this is also abetting India’s decadal effort at import substitution. The multiplier effect of this development across the ecosystem is very healthy and likely to abet enterprise investments in the times to come. Importantly, the Government’s willingness to do what it takes to support domestic industry though generous incentivization of new capacities across sectors is commendable and is setting on course a part of the investment cycle. This confluence has resulted in an abundance of consumer and enterprise sentiment, and the confidence to kick start a new cycle of expansion. A significant difference from the previous cycle is that corporate balance sheets today are in significantly better shape, and have greater cognizance to capital allocation and governance, and to that extent making the cycle more sustainable.
Tail Risk Data suggests that there is a less than 0.04% chance that a carrier passing through the Suez Canal will face any issues. Entrusted with handling a significant portion of the World’s International trade, the controls at Suez have a highly structured approach to underlying risk management. This came to naught earlier this year, as one of the World’s largest ships, MV Ever Given, collapsed under its own weight*. Apparently, the Suez is not designed to host a vessel as large as the MV Ever Given under non-routine circumstances. And neither the Ship, nor the Suez, is designed to manage risks from non-routine events. And it is the non-routine events that define the course of nature and markets; from a virus escaping a lab to the sheer unpredictability of modern monetary policy theory and everything in between. As professional investors, every investment decision is fraught with non-routine risks. As we construct your portfolios for times to come, this is a good time for us to re-iterate that we are acutely conscious of the probabilities of such non-routine risks affecting our investment outcomes. As a result, [a] the market caps we are present in today, [b] sectors we have exposure to and [c] our management of absolute exposure is a function of our constant assessment of routine and probability of non-routine risks. These are unlikely to be apparent in a simple evaluation of your portfolios, and a conversation with your relationship manager may enable deeper appreciation of this facet. As you may have noticed from your portfolios, the stocks that have performed in the 2020 cycle have largely made way for newer investments that are likely to benefit from the new normal and keeping in mind newer kinds of risks. At Unifi, we are aligned with each of the above trends, but at the same time stay true to our core principles of seeking the right mix of risk and reward in each of our investments. *[For the curious, Fat ships are prone to something known as the bank effect, where in shallow waters, the bow and stern of the boat drift in opposite ways. What followed was an unmitigated supply chain disaster, briefly plunging the World into a moment of vulnerability].
3 Private and Confidential – Circulation to Unit Holders only
UNIFI AIF – BLEND Fund
June 2021
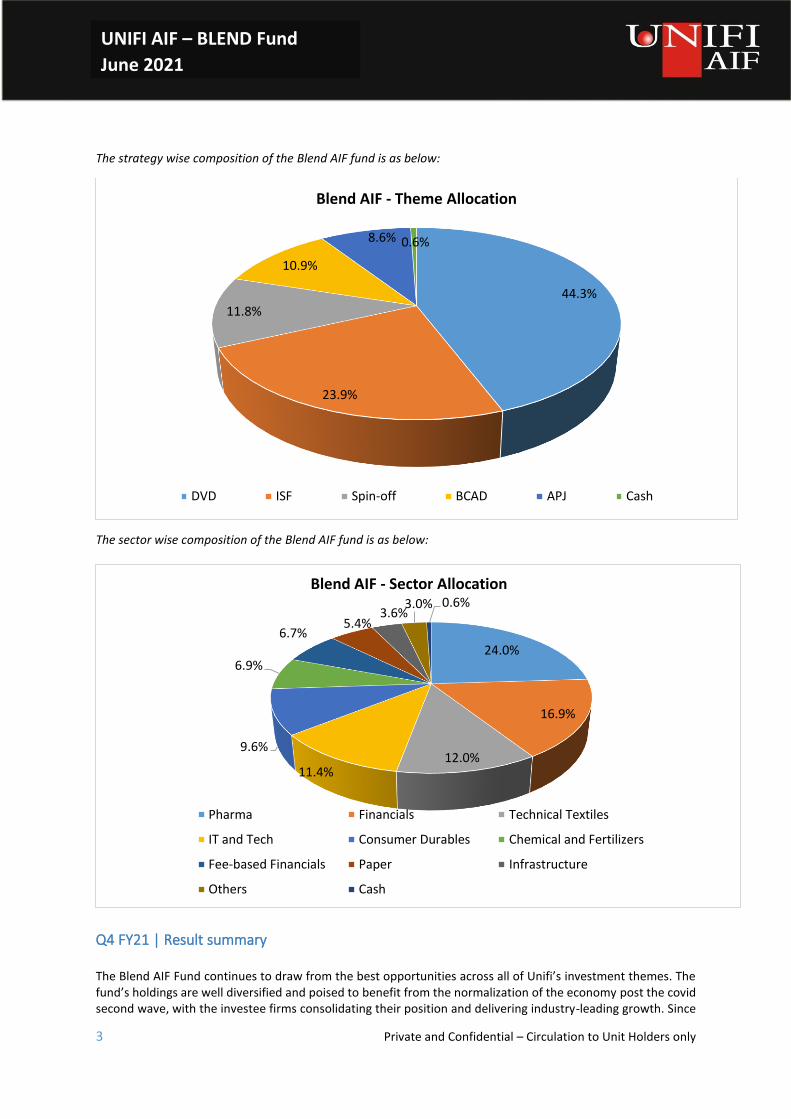
The strategy wise composition of the Blend AIF fund is as below:
The sector wise composition of the Blend AIF fund is as below:
Q4 FY21 | Result summary
The Blend AIF Fund continues to draw from the best opportunities across all of Unifi’s investment themes. The fund’s holdings are well diversified and poised to benefit from the normalization of the economy post the covid second wave, with the investee firms consolidating their position and delivering industry-leading growth. Since
44.3%
23.9%
11.8%
10.9%
8.6% 0.6%
Blend AIF - Theme Allocation
DVD ISF Spin-off BCAD APJ Cash
24.0%
16.9%
12.0%11.4%
9.6%
6.9%
6.7%5.4%
3.6%3.0% 0.6%
Blend AIF - Sector Allocation
Pharma Financials Technical Textiles
IT and Tech Consumer Durables Chemical and Fertilizers
Fee-based Financials Paper Infrastructure
Others Cash
4 Private and Confidential – Circulation to Unit Holders only
UNIFI AIF – BLEND Fund
June 2021
our last letter, the fund has taken fresh exposure towards sectors like digital connectivity, media and an emerging speciality chemical company.
Pharmaceuticals, at 24% continue to have highest weightage within the portfolio. While Suven Pharma and JB Chemical continue to form a core of our pharma exposure, we have initiated exposure to two large-cap Pharma companies namely Lupin and Cadila Healthcare. Both these companies have faced prolonged subdued profitability due to pricing pressure led by consolidation of buyers, stiff competition, sluggish legacy product sales, regulatory hurdles, and leverage to support the inefficacious acquisitions. Meanwhile, these companies continued to reinvest significant portion of their profitability in research and development and building capabilities. Going forward, the companies are fairly placed with a robust pipeline of specialty drugs to be launched over the next 3 years in US, Europe, and key emerging markets. In addition, these companies have strengthened the credit profile following divestment in non-core businesses and using the entire proceeds to reduce the debt.
At 17%, financials constitute the second largest segmental exposure. Our thesis that large banks like SBI, ICICI and Axis would report strong earnings driven by lower asset quality challenges was clearly visible in the Q4FY21 results (detailed in company section). Other major sector exposure includes technical textile (12%), Information Technology (11%) and Consumer Durables (10%). The underlying investments in each of these sectors have reported good results in Q4FY21.
We have initiated exposure to Transpek, a global supplier of specialised chlorinated products with application segment across polymers, pharma, specialty chemicals, agrochemicals and dyes and pigments. Tata Communication (TCOM), a digital connectivity enabler and TV Today, one of India’s largest media house are also new additions to the fund. While TCOM would benefit from huge potential for digital acceleration for companies in the post covid world, TV Today is a bet on recovery in ad-spends as economy revives in FY22 and their focus on increasing presence in digital media.
With Unifi’s philosophy of aligning the portfolio with a favourable risk-reward equation, we exited Chambal Fertilizer, Mahindra Holidays, Tech Mahindra and Intellect as we found relatively better mix of risk-reward in the names mentioned above.
The following annexure presents a brief on our top holdings:
Garware Technical Fibres
Garware delivered revenue growth of 33% YoY to Rs.335cr. EBITDA and Operating PBT registered growth of 29% YoY and 35% YoY to Rs.71cr and Rs.63cr, respectively. Both domestic and export business contributed to growth in Q4FY21. While gross margin declined by 440bps YoY with increase in the price of polymers and a change in product-mix, EBITDA growth was strong driven by favourable operating leverage. The company successfully completed buyback of Rs. 73 Cr during the quarter. We remain positive on Garware given the company's focus towards value added products (which now makes 70% of overall business), its leadership position in technical textile segment, its relationship with international clientele builds over the past decades and strong balance sheet with cash of Rs. 530cr. The company continues to win new patents and launch new products, which we believe will drive growth and profitability. Key risks: Decline in the prices of Salmon, sharp increase in raw material price and failure of newer products to garner higher market share.
JB Chemicals JB Chemicals reported revenue growth of 19% YoY to Rs.528cr. EBITDA and Operating PBT registered growth of 35% YoY and 44% YoY to Rs.124cr and Rs.107cr respectively. Domestic business delivered growth of 9% YoY driven by key chronic segments - cardiovascular/anti-hypertensive. MR Productivity had improved from Rs. 3.6 Lakh in FY20 to Rs. 4.4 Lakh in FY21. Exports grew by 31% YoY. Exports Growth was driven by US
5 Private and Confidential – Circulation to Unit Holders only
UNIFI AIF – BLEND Fund
June 2021
and South Africa formulations business. Growth in Russia continues to remain muted due to covid as anti-infectives accounts for a major part of Russia business. The company registered 23.4% EBITDA margin as against 20.7% last year on the account of operating leverage and cost optimization initiatives by the new management. We like the company due to the strength of its 4 key brands (Cilacar | Nicardia | Rantac | Metrogyl) and the potential for KKR to accelerate its growth momentum. Key risks: Supply chain disruptions, Pricing pressure in Domestic Business and unexpected regulatory developments.
ICICI Sec ICICI Securities delivered a good quarter, with the broking segment growing by 37% YoY
and 9% QoQ to Rs.395cr. The company surprised positively with strong client additions at 354,000 clients, primarily through the digital channel. The distribution revenue was up 23% YoY and 31% QoQ due to improvement in mutual fund and insurance revenues. The focus for the times ahead would continue to be on rationalization of human resources and push to digital initiatives. On the back of robust revenue growth and measured operating expenses, PBT was up 112% YoY at Rs.441cr., and PAT was higher by 111% YoY at Rs.329cr. I-Sec is a leading tech-based securities player offering a range of financial services including brokerage, financial products distribution, and investment banking, with a focus on both retail and institutional clients. As of March 2021, the proprietary electronic brokerage platform ICICI Direct had approx. 5.4 Mn operational accounts of whom about 1.6 Mn had traded on NSE in last 12 months. I-Sec is also the second largest non-bank MF distributor with an AUM of Rs.413 Bn. We like the business due to its absolute technology leadership, continuing consolidation of user base, high RoE of more than 50%+ and access to ICICI Bank’s franchise for customer acquisition. Key risks would arise from a prolonged downcycle in equity markets leading to lower turnover, and heightened competition leading to loss of market share.
Suven Pharma Suven Pharma reported good in-line results w.r.t Q4FY21. Sales and EBIDTA were up 38% and 19% on a YoY basis. Standalone PAT grew by 27% YoY. The impressive revenue growth was broad-based with CDMO pharma and CDMO specialty chemicals growing 51% and 37% YoY, respectively. US Formulation business is gaining traction gradually. Margins were impacted because of steep rise in the cost of key starting materials [KSMs] due to supply disruption. The company has the option to go back to innovators and pass on the cost. Suven’s strategy has been to look at long term relationships and not mechanically pass on any short-term cost increases. If the prices continue to go up, they will certainly use their option to pass-on. The nature of Suven’s research services segment and campaign based commercial supplies necessitates tracking its annual progress rather than quarter-wise. From that standpoint, the FY21 numbers indicate a growth of 20% and 15% YoY in terms of revenues and profits which is as per our expectations. Suven currently has seven commercially launched intermediates and specialty chemicals and is looking to add one more in FY-2022. In addition, the company 3 phase-3 candidates where at least one could see a commercial launch in the next 12-18 months. Suven has also diversified into formulations by building appropriate capacities and obtained USFDA approvals. Company has launched 4 ANDAs (formulation drugs) in FY21. It also targets to launch 3-4 ANDAs every year over the next 5 years. The company has filed 11 ANDAs till the end of FY21 and targets to file more 5 in the next financial year.
6 Private and Confidential – Circulation to Unit Holders only
UNIFI AIF – BLEND Fund
June 2021
The pace of additions to research projects has seen slowdown due to the second wave. The performance of Seven’s associate Rising Pharma (USA) is progressing well and opportunities for commercial contracts could arise in the future from them. Key risks - Management bandwidth (COO hiring delayed), slow acceptance of products in US formulation business and low traction in research activities due to covid are the key concerns.
Wipro WIPRO delivered YoY Revenue/EBIT/PAT growth of 3.1%/ 31%/26.9% to Rs. 16,425 / 3,328 / 2,974cr. They reported +367bps YoY (-64bp QoQ) expansion in EBIT margins to 21.0% aided by tailwinds from efficiencies, offshoring, currency benefits partially offset by wage hikes/promotion (QoQ). Except health, manufacturing and communications, all other industry segments posted healthy growth of 2.7-9.9% QoQ in CC terms. For the full year FY21, earnings came in at Rs. 10,796cr (11% YoY). Wipro’s recent focus on driving sales growth through large deal wins seem to be bearing fruit. Key risks: Slowdown across major markets such as Europe and US and rupee appreciation could also pose a challenge.
ICICI Bank ICICI Bank reported NII growth of 17% YoY and 5% QoQ at Rs.10,431cr, while their non-interest income was up 6% sequentially led by a recovery in business volumes. Their cost to income ratio fell to 41% from 44% in Q4 FY20, on the back of lower employee expenses. Overall, operating profit was higher by 20% YoY at Rs.8,565cr. Advances were up 14% YoY & 5% QoQ at 7.4Tn with retail forming 67% of the same. The bank continues to enjoy a strong consumer franchise with a CASA ratio of 43%, one of the highest within the banking industry. The stress in the corporate book has already been adequately provided for and the listed status of its subsidiaries has provided good liquidity window to the bank enabling higher provisions. The Banks is likely to manage its overdue and restructured book well in the coming cycle given its collection management standards. Key risks would include deterioration of asset quality, higher than expected credit costs and decline in NIMs due to falling yields.
Axis Bank Axis Bank reported NII growth of 11% YoY and 2% QoQ to Rs.7,555cr on the back of healthy loan book growth and stable NIMs. Advances grew by 9% YoY to Rs.6.23Trillion with retail advances forming 54% of the same. Operating profit increased 17% YoY and 13% QoQ to Rs.6,865cr. On the back of lower provisions [down by 28% QoQ at Rs.3,295cr.], PAT was up 140% QoQ at Rs.2,677cr. The bank's asset quality improved with GNPA and NNPA at 4.06% and 1.12% respectively. The bank surprised positively on the restructured accounts, which was lower sequentially at 0.3% of the loan book and have been adequately provided for at 26%. With an additional COVID-provision buffer of Rs.5,012cr, the bank is in a comfortable position to take care of any incremental stress in asset quality in FY22. The collection efficiency was stable at 98% in March, which is at par with pre-covid levels of 97%. Axis Bank is well placed to get back to normalcy from FY-22 onwards. Given the low cost of deposits and access to capital, the bank is expected to deliver on all parameters from the forthcoming year, and eventually migrate to higher double-digit ROEs. Key risks would include deterioration of asset quality in the covid second wave leading to higher-than-expected credit costs and decline in NIMs due to falling yields.
7 Private and Confidential – Circulation to Unit Holders only
UNIFI AIF – BLEND Fund
June 2021
CG Consumer Crompton Greaves consumer delivered revenue, EBIDTA and adjusted PAT growth of 48% / 61% and 66% YoY respectively, and reported sharp improvement on all parameters, led by structural efficiency initiatives, core demand and a good pricing environment. Both the segments, Lighting (up 15% YoY) and Consumer durables (up 61% YoY), delivered ahead of industry growth led by consolidation of the larger players. In each of the key product segments [Fans (59% YoY), Lighting, Pumps, and other Electric Appliances (74%YoY)], the company delivered ahead of industry growth rates, on the back of product innovation, premiumization and market reach initiatives. For the full year, the company delivered revenues of Rs. 4,800cr (6% YoY) and earnings of Rs.540cr (22% YoY). We expect this trend to continue, along with headline growth that is ahead of the industry. Crompton is amongst India’s most profitable players in the consumer durables space with best-in-class growth, margins, and capital efficiency. We continue to like the company as we expect it to benefit from this phase of consolidation. Key risks to the investment could emanate from drop in consumer sentiment, and steep inflation in raw materials.
JK Paper JK Paper reported revenue growth of 22% YoY to Rs. 898cr. EBIDTA and PBT increased by 29% YoY and 41% YoY to Rs. 228cr and Rs. 194cr, respectively. The key highlight of Q4FY21 performance was strong turnaround of their subsidiary - Sirpur Paper Mills which broke even at the EBITDA level. JK Paper is play on revival on domestic paper consumption driven by reopening of offices and educational institutions. Further the company is increasing its capacity from 4.36 lakh tonne to 7.42 lakh tonne driven by green field packaging board expansion in Gujarat with capacity of 1.7 lakh tonne and addition of 1.36 lakh tonne from inorganic acquisition of Sirpur paper mills. The medium-term earnings growth would be driven by volume increase, cost optimization and better realization. Key risks would be delay in capacity addition, decline in realization and extended impact of COVID-19.
SBI SBI reported NII growth of 19% YoY and down 6% QoQ to Rs.27,067cr on interest reversals pertaining to NPAs and impact of interest-on-interest waiver. Hence, NIM was lower at 2.9% compared to 3.1% in Q3. Advances grew by 5% YoY to Rs.25.3 trillion with retail advances forming 43% of the same. The fee income recovered to previous year’s levels and was at Rs 8,455cr. Operating profit was up by 7% YoY and 14% QoQ at Rs 19,700cr and PAT was up 80% YoY & 24% QoQ at Rs 6,451cr. The bank surprised positively on the total covid related stress being lower than anticipated at Rs.46,416cr. In a covid hit year, the gross slippages were at 1.1% of the book, which is the lowest amongst the top banks in the country. Overall, asset quality improved QoQ with GNPA reducing from 5.44% to 4.98%. The bank made provision of Rs.11,000cr to increase the coverage to 71% on GNPA. With an additional COVID-provision buffer of Rs.11,000cr, the bank is in a comfortable position to take care of any incremental stress in asset quality in FY22. Given the superior performance in controlling stress and improving asset quality in a covid hit year, the bank is expected to deliver on all parameters from the forthcoming year, and eventually migrate to higher double-digit RoEs. The bank has cleaned up its stress in corporate loan book and will be a likely beneficiary in the upcoming credit cycle, thanks to its strong franchise and better underwriting practices. Key risks would include deterioration of asset quality leading to higher-than-expected credit costs and decline in NIMs due to falling yields.
8 Private and Confidential – Circulation to Unit Holders only
UNIFI AIF – BLEND Fund
June 2021
Tata Comm Tata Comm's 4QFY21 revenues were slightly lower in both the Data and Voice segments. Voice segment revenue was down 17.2% QoQ to Rs. 5600cr while Data segment revenue was down 1% QoQ at Rs 3520cr. The latter was impacted on account of on account of slower deal conversion cycles and moderation in UCC (Unified Communications and Collaboration) traffic. EBIDTA was down 3% QoQ to Rs 1020cr on account of 4.6% decline in the data segment to Rs 980 cr. Voice segment EBIDTA came in at Rs 36cr. Net debt declined by Rs 190cr QoQ to Rs. 7800cr. FY21 revenue at Rs 17,100cr was flat YoY while the EBIDTA increased 30% YoY to Rs. 4,300cr. Full-year FY21 capex was at Rs 1420cr, down 11% as against Rs 1600cr in FY20. The company has pretty much resolved its legacy Balance Sheet issues and we are confident that the company should deliver on its double-digit growth targets with steady margins as the economy opens up given strong demand in most of the segments that the company operates in including high quality internet connectivity, network transformation/connectivity, voice solutions, cloud hosting related offerings, security solutions, IoT etc. Key risks would be slower to negative growth in the data segment on account of covid related stress and lower usage of Tata Comm's services e.g., data streaming of live sports or reduced international travel or delays in deal conversion.
Sheela Foam Sheela Foam delivered 37% YoY growth in domestic revenue, performing strongly across all product categories. Gross margin was down to 39% levels due to increase in raw material prices. However, EBITDA was up 68% YoY to Rs.70cr, aided by better cost control and operating leverage. The Spanish and Australian subsidiary faced constraints from higher raw material prices and contributed only Rs.5cr to PAT. Overall, consolidated PAT was up 79% YoY to Rs.59cr. Incorporated in 1971, Sheela Foam is one of the leading manufacturers of mattresses in India marketed under its flagship brand ‘Sleepwell’. The company also manufactures other foam-based home comfort products as well as technical grades of polyurethane foam (PU Foam) for use in a wide range of industries. The Indian mattress market is about Rs.10,000cr in size of which 65% is unorganized. We like the company due to its net debt free status with a RoE of 20% and an industry leading market share of 23%. The company has also launched low-priced brands ‘Starlite’ and ‘Featherfoam’ to take on unorganized players. Key risks for the business would arise from higher raw material costs, intensive competitive pressure leading to loss of market share and slump in discretionary consumption spends.
9 Private and Confidential – Circulation to Unit Holders only
UNIFI AIF – BLEND Fund
June 2021
Key Portfolio Metrics It is important to note that each investment in the fund has been made on its own merit and the portfolio characteristics are merely a by-product of the process. In sync with Unifi’s philosophy, the aggregate portfolio has low leverage, demonstrates potential for strong earning’s growth and has reasonable valuations.
Valuation Parameters* (As on 15th June 2021)
FY2021 FY2022E
P/E Ratio 29.4 23.0
Earnings Growth 23.8% 38.4%
Debt Equity Ratio 0.11 0.09
ROE % 21.8% 23.2%
*Adjusted for one-off to make figures representative.
We are continually monitoring the environment for any opportunities that have potential to materially improve the portfolio composition. We will be writing to you again post the Q1FY22 results. In closing, we encourage you to write to us, or your relationship manager for a detailed review of the portfolio and understanding of our proposition in greater granularity. With best wishes, K. Sarath Reddy | Founder & CIO
Annexures:
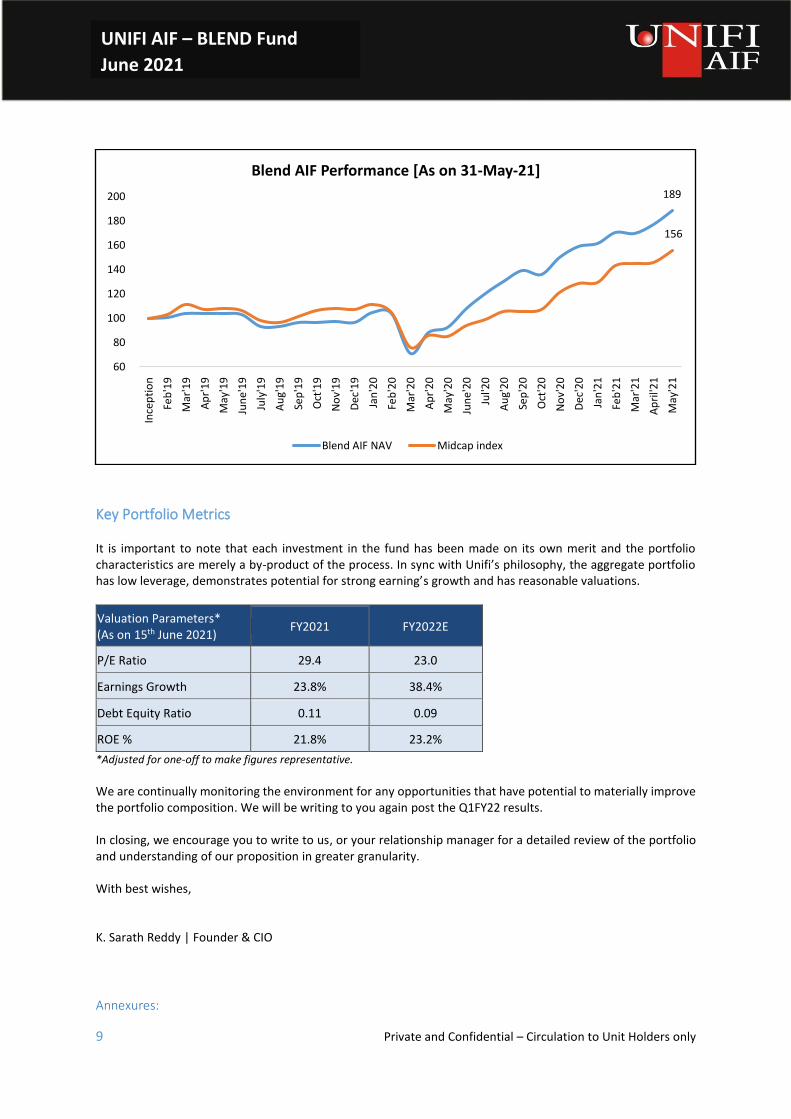
189
156
60
80
100
120
140
160
180
200
Ince
pti
on
Fe
b'1
9
Mar
'19
Ap
r'1
9
May
'19
Ju
ne'
19
Ju
ly'1
9
Au
g'1
9
Se
p'1
9
Oct
'19
No
v'1
9
Dec
'19
Jan
'20
Fe
b'2
0
Mar
'20
Ap
r'2
0
May
'20
Ju
ne'
20
Ju
l'20
Au
g'2
0
Se
p'2
0
Oct
'20
No
v'2
0
Dec
'20
Jan
'21
Fe
b'2
1
Mar
'21
Ap
ril'2
1
May
'21
Blend AIF Performance [As on 31-May-21]
Blend AIF NAV Midcap index
10 Private and Confidential – Circulation to Unit Holders only
UNIFI AIF – BLEND Fund
June 2021
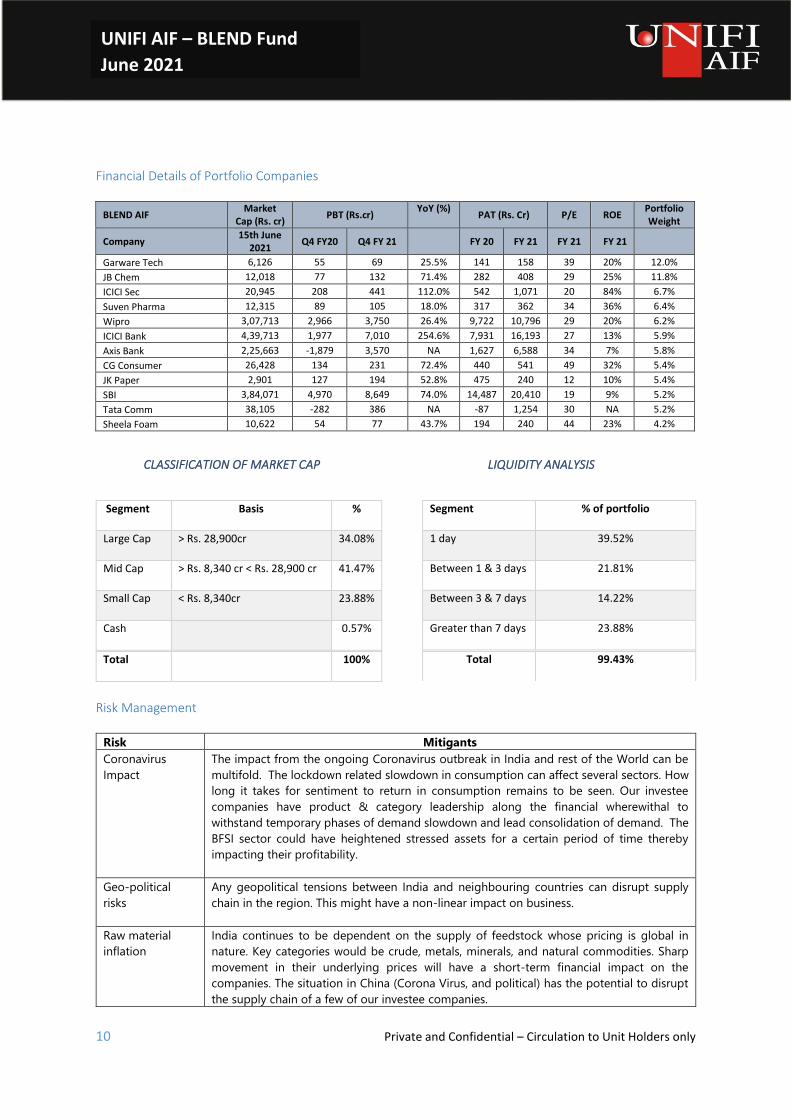
Financial Details of Portfolio Companies
BLEND AIF Market
Cap (Rs. cr) PBT (Rs.cr)
YoY (%) PAT (Rs. Cr) P/E ROE
Portfolio Weight
Company 15th June
2021 Q4 FY20 Q4 FY 21 FY 20 FY 21 FY 21 FY 21
Garware Tech 6,126 55 69 25.5% 141 158 39 20% 12.0%
JB Chem 12,018 77 132 71.4% 282 408 29 25% 11.8%
ICICI Sec 20,945 208 441 112.0% 542 1,071 20 84% 6.7%
Suven Pharma 12,315 89 105 18.0% 317 362 34 36% 6.4%
Wipro 3,07,713 2,966 3,750 26.4% 9,722 10,796 29 20% 6.2%
ICICI Bank 4,39,713 1,977 7,010 254.6% 7,931 16,193 27 13% 5.9%
Axis Bank 2,25,663 -1,879 3,570 NA 1,627 6,588 34 7% 5.8%
CG Consumer 26,428 134 231 72.4% 440 541 49 32% 5.4%
JK Paper 2,901 127 194 52.8% 475 240 12 10% 5.4%
SBI 3,84,071 4,970 8,649 74.0% 14,487 20,410 19 9% 5.2%
Tata Comm 38,105 -282 386 NA -87 1,254 30 NA 5.2%
Sheela Foam 10,622 54 77 43.7% 194 240 44 23% 4.2%
CLASSIFICATION OF MARKET CAP LIQUIDITY ANALYSIS
Segment Basis %
Large Cap > Rs. 28,900cr 34.08%
Mid Cap > Rs. 8,340 cr < Rs. 28,900 cr 41.47%
Small Cap < Rs. 8,340cr 23.88%
Cash 0.57%
Total 100%
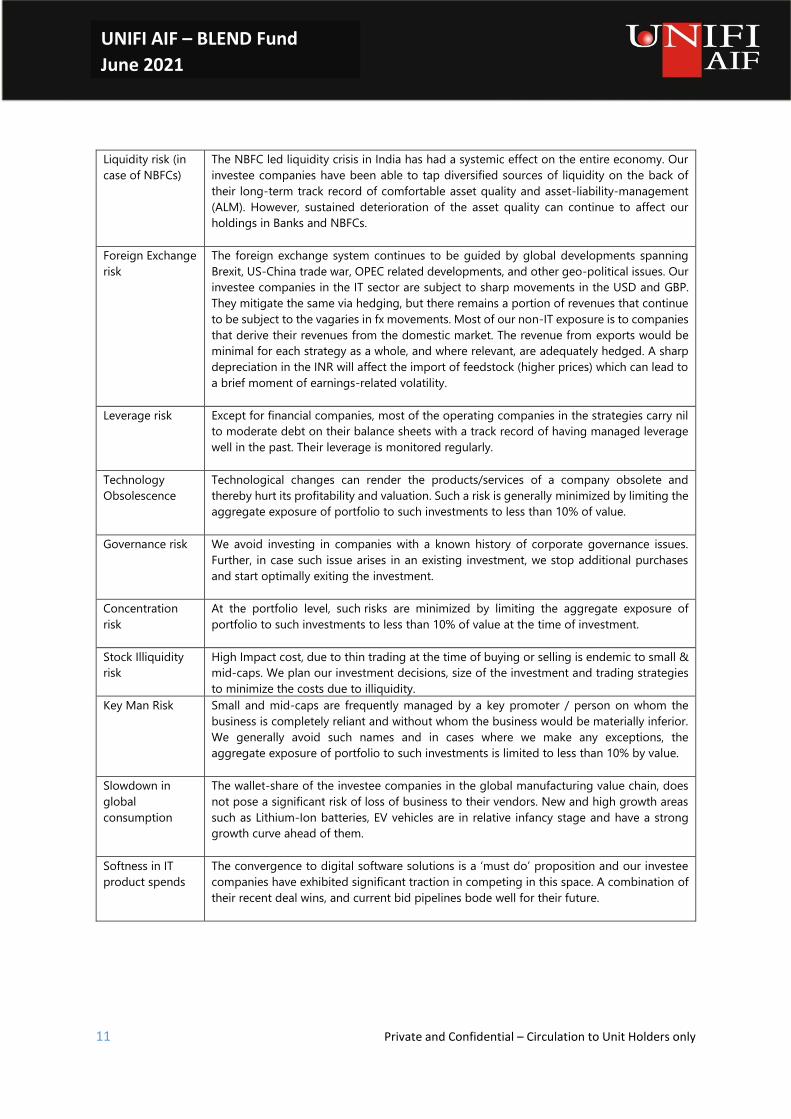
Risk Management
Risk Mitigants
Coronavirus
Impact
The impact from the ongoing Coronavirus outbreak in India and rest of the World can be
multifold. The lockdown related slowdown in consumption can affect several sectors. How
long it takes for sentiment to return in consumption remains to be seen. Our investee
companies have product & category leadership along the financial wherewithal to
withstand temporary phases of demand slowdown and lead consolidation of demand. The
BFSI sector could have heightened stressed assets for a certain period of time thereby
impacting their profitability.
Geo-political
risks
Any geopolitical tensions between India and neighbouring countries can disrupt supply
chain in the region. This might have a non-linear impact on business.
Raw material
inflation
India continues to be dependent on the supply of feedstock whose pricing is global in
nature. Key categories would be crude, metals, minerals, and natural commodities. Sharp
movement in their underlying prices will have a short-term financial impact on the
companies. The situation in China (Corona Virus, and political) has the potential to disrupt
the supply chain of a few of our investee companies.
Segment % of portfolio
1 day 39.52%
Between 1 & 3 days 21.81%
Between 3 & 7 days 14.22%
Greater than 7 days 23.88%
Total 99.43%
11 Private and Confidential – Circulation to Unit Holders only
UNIFI AIF – BLEND Fund
June 2021
Liquidity risk (in
case of NBFCs)
The NBFC led liquidity crisis in India has had a systemic effect on the entire economy. Our
investee companies have been able to tap diversified sources of liquidity on the back of
their long-term track record of comfortable asset quality and asset-liability-management
(ALM). However, sustained deterioration of the asset quality can continue to affect our
holdings in Banks and NBFCs.
Foreign Exchange
risk
The foreign exchange system continues to be guided by global developments spanning
Brexit, US-China trade war, OPEC related developments, and other geo-political issues. Our
investee companies in the IT sector are subject to sharp movements in the USD and GBP.
They mitigate the same via hedging, but there remains a portion of revenues that continue
to be subject to the vagaries in fx movements. Most of our non-IT exposure is to companies
that derive their revenues from the domestic market. The revenue from exports would be
minimal for each strategy as a whole, and where relevant, are adequately hedged. A sharp
depreciation in the INR will affect the import of feedstock (higher prices) which can lead to
a brief moment of earnings-related volatility.
Leverage risk Except for financial companies, most of the operating companies in the strategies carry nil
to moderate debt on their balance sheets with a track record of having managed leverage
well in the past. Their leverage is monitored regularly.
Technology
Obsolescence
Technological changes can render the products/services of a company obsolete and
thereby hurt its profitability and valuation. Such a risk is generally minimized by limiting the
aggregate exposure of portfolio to such investments to less than 10% of value.
Governance risk We avoid investing in companies with a known history of corporate governance issues.
Further, in case such issue arises in an existing investment, we stop additional purchases
and start optimally exiting the investment.
Concentration
risk
At the portfolio level, such risks are minimized by limiting the aggregate exposure of
portfolio to such investments to less than 10% of value at the time of investment.
Stock Illiquidity
risk
High Impact cost, due to thin trading at the time of buying or selling is endemic to small &
mid-caps. We plan our investment decisions, size of the investment and trading strategies
to minimize the costs due to illiquidity.
Key Man Risk Small and mid-caps are frequently managed by a key promoter / person on whom the
business is completely reliant and without whom the business would be materially inferior.
We generally avoid such names and in cases where we make any exceptions, the
aggregate exposure of portfolio to such investments is limited to less than 10% by value.
Slowdown in
global
consumption
The wallet-share of the investee companies in the global manufacturing value chain, does
not pose a significant risk of loss of business to their vendors. New and high growth areas
such as Lithium-Ion batteries, EV vehicles are in relative infancy stage and have a strong
growth curve ahead of them.
Softness in IT
product spends
The convergence to digital software solutions is a ‘must do’ proposition and our investee
companies have exhibited significant traction in competing in this space. A combination of
their recent deal wins, and current bid pipelines bode well for their future.