Embed Size (px)
Citation preview

1 © | January 2017 © | November 2016
UniCredit und Kepler Cheuvreux German Corporate Conference
Frankfurt | January 17, 2017
2 © | January 2017 2 © | January 2017
Safe harbor statement: This presentation includes certain forward-looking statements within the
meaning of Section 27A of the U.S. Securities Act of 1933, as amended, and Section 21E of the U.S.
Securities Act of 1934, as amended. The Company has based these forward-looking statements on its views
with respect to future events and financial performance. Actual results could differ materially from those
included in the forward-looking statements due to various risk factors and uncertainties, including changes
in business, economic competitive conditions, regulatory reforms, foreign exchange rate fluctuations,
uncertainties in litigation or investigative proceedings and the availability of financing. Given these
uncertainties, readers should not put undue reliance on any forward-looking statements. These and other
risks and uncertainties are discussed in detail in Fresenius Medical Care AG & Co. KGaA’s (FMC AG & Co.
KGaA) reports filed with the Securities and Exchange Commission (SEC) and the German Exchange
Commission (Deutsche Börse).
Forward-looking statements represent estimates and assumptions only as of the date that they were made.
The information contained in this presentation is subject to change without notice and the Company does
not undertake any duty to update the forward-looking statements, and the estimates and assumptions
associated with them, except to the extent required by applicable law and regulations.
If not mentioned differently the term net income after minority interests refers to the net income
attributable to the shareholders of Fresenius Medical Care AG Co. KGaA independent of being the reported
or the adjusted number. The term EMEA refers to the region Europe, Middle East and Africa. Amounts are
in US-$ if not mentioned otherwise.

3 © | January 2017
Every 0.7 seconds we provide a dialysis
treatment somewhere on the globe
Fresenius Medical Care today
306,366 patients
34,654,614 dialysis treatments
(9m 2016)
108,851 employees
37 Production sites
3,579 clinics

4 © | January 2017
Dialysis services Dialysis products
Therapies & laboratory services for patients with
chronic kidney failure
Care Coordination
Businesses supporting dialysis,
e.g. vascular services
e.g., dialysis machines, dialyzers &
bloodline systems
Health care services Products
19% 13% 68%
Our business profile Percentage of 9m 2016 revenue
$2.5bn $9.0bn $1.7bn

5 © | January 2017 5 © | January 2017
AGENDA
Dialysis facts & figures
Business update: Q3 2016
Outlook & growth strategy 3
2
1

6 © | January 2017
Expected patient growth of around 6% p.a.
Driven by age, lifestyle and higher life expectancy
1 Internal estimates
1970 1975 1980 1985 1990 1995 2000 2005 2010 2015 2020
0
1
2
3
4 Dialysis patients in 2020e:
~3.8 million CAGR (2012 – 2020e)1
Asia Pacific 8.6%
North America 4.6%
Latin America 5.3%
EMEA 4.4%
Expected global dialysis patient growth

7 © | January 2017
9m 2016 Patients Treatments (m) Clinics
North America 187,611 21.5 2,277
EMEA 59,233 6.6 701
Asia-Pacific 29,358 3.0 369
Latin America 30,164 3.6 232
Total 306,366 34.7 3,579
Fresenius Medica Care - global footprint
2010 2011 2012 2013 2014 2015 9m
2016
2,757
3,579
CAGR +4%
2010 2011 2012 2013 2014 2015 9m
2016
215‘
306‘
CAGR +7%
2010 2011 2012 2013 2014 2015 LTM
2016
31.7
46.0
CAGR +7%

© | January 2017 8
Dialysis services worldwide: Patients treated1
1 based on company statements and FME estimates
We lead in every major market, treating > 306,000 patients worldwide
USD ~73bn Market
North America EMEA
Latin America Asia-Pacific
24,000
187,300
187,611
US Renal Care
DaVita
FMC
18,300
22,300
59,233
KfH
Diaverum
FMC
4,730
8,270
30,164
Diaverum
Baxter
FMC
5,150
5,300
29,358
Showai-Kai
B.Braun
FMC

9 © | January 2017
Market position by major product groups 2015
Position 1
Dialyzers FME
Dialysis machines FME
Hemodialysis concentrates FME
Bloodlines FME
Peritoneal dialysis products Baxter
Dialyzers Dialysis machines
54%
46% 45%
55%
FME
Competitors

© | January 2017 10 10 © | January 2017
AGENDA
Dialysis facts & figures
Business update: Q3 2016
Outlook & growth strategy 3
2
1

© | January 2017 11
Revenue in $m
EBIT in $m
Net income in $m
+9%
+9%
+27%
Q3: Strong performance to deliver on fiscal year
2015 2016
614 670
2015 2016
4,231 4,598
Strong revenue growth due to positive results in Health Care services
Segments Asia-Pacific and Latin America with very strong performance
Care Coordination again with significant top-line growth
On track to achieve full-year guidance
262 333
2015 2016

© | January 2017 12
Revenue split Q3 2016
81% Services
19% Products
72%
9%
15%
4%
in % of total revenue
Services Products
Latin America
Asia-Pacific
EMEA
North America
$ 4.6bn
© | January 2017 13
Q3 2016 US$ million
Q3 2015 US$ million
Growth in %
Growth in %cc
Organic growth
in %
Same market growth
in %
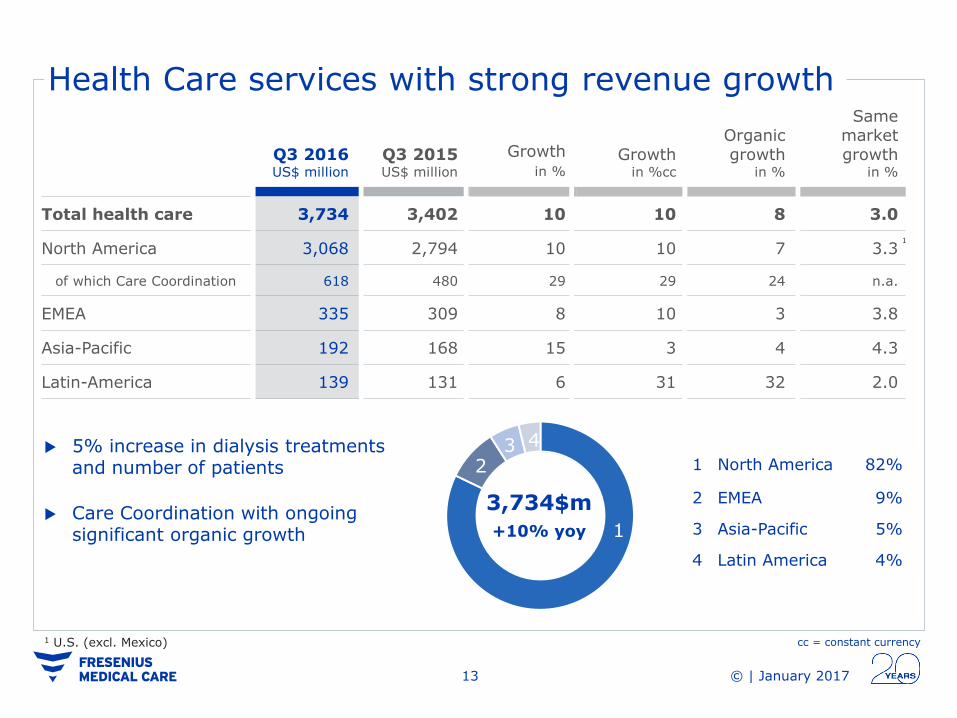
Total health care 3,734 3,402 10 10 8 3.0
North America 3,068 2,794 10 10 7 3.3
of which Care Coordination 618 480 29 29 24 n.a.
EMEA 335 309 8 10 3 3.8
Asia-Pacific 192 168 15 3 4 4.3
Latin-America 139 131 6 31 32 2.0
Health Care services with strong revenue growth
cc = constant currency
5% increase in dialysis treatments and number of patients
Care Coordination with ongoing significant organic growth
1 North America 82%
2 EMEA 9%
3 Asia-Pacific 5%
4 Latin America 4%
1
4 3 2
3,734$m
+10% yoy
1 U.S. (excl. Mexico)
1
© | January 2017 14
Dialysis products with robust growth
Q3 2016 US$ million
Q3 2015 US$ million
Growth in %
Growth in %cc
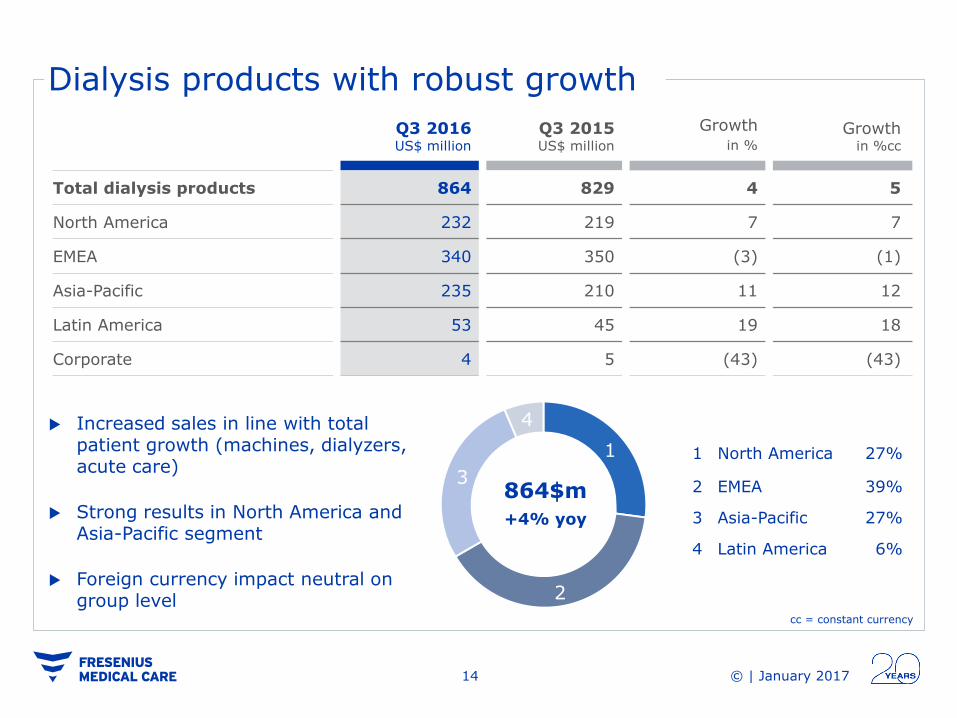
Total dialysis products 864 829 4 5
North America 232 219 7 7
EMEA 340 350 (3) (1)
Asia-Pacific 235 210 11 12
Latin America 53 45 19 18
Corporate 4 5 (43) (43)
27%
73% Increased sales in line with total patient growth (machines, dialyzers, acute care)
Strong results in North America and Asia-Pacific segment
Foreign currency impact neutral on group level
cc = constant currency
1
4
3
2
864$m
+4% yoy
1 North America 27%
2 EMEA 39%
3 Asia-Pacific 27%
4 Latin America 6%

© | January 2017 15
Q3 – regional margin profile
68
85
Q3 2015 Q3 2016
Asia-Pacific (11% of EBIT*)
130
125
Q3 2015 Q3 2016
EMEA (16% of EBIT*)
-8
20
Q3 2015 Q3 2016
Latin America (3% of EBIT*)
EBIT
EBIT-margin
Diagrams: different scales applied
in US$ million
515 536
Q3 2015 Q3 2016
North America (70% of EBIT*)
*excl. Corporate
17.1% 16.2%
19.7%
18.5%
%
17.9%
19.8%
(4.7%)
10.5%

© | January 2017 16
Q3 2016 Q3 2015 9m 2016 9m 2015
US$ million US$ million US$ million US$ million
Operating cash flow 439 579 1,296 1,412
in % of revenue 9.5 13.7 9.8 11.4
Capital expenditures, net (236) (224) (734) (636)
Free cash flow 203 355 562 776
Free cash flow, after acquisitions and investments 166 298 368 652
Cash flow development and credit profile
A reconciliation to the most directly comparable U.S. GAAP financial measures is provided in the attachments.
Total debt/EBITDA-ratio
3.0
2014 2015
2.8
Q3 2016
2.6 S&P Moody‘s Fitch
Company BBB- Ba1 BBB-
Outlook stable stable stable
Current ratings

© | January 2017 17 17 © | January 2017
AGENDA
Dialysis facts & figures
Business update: Q3 2016
Outlook & growth strategy 3
2
1
© | January 2017 18
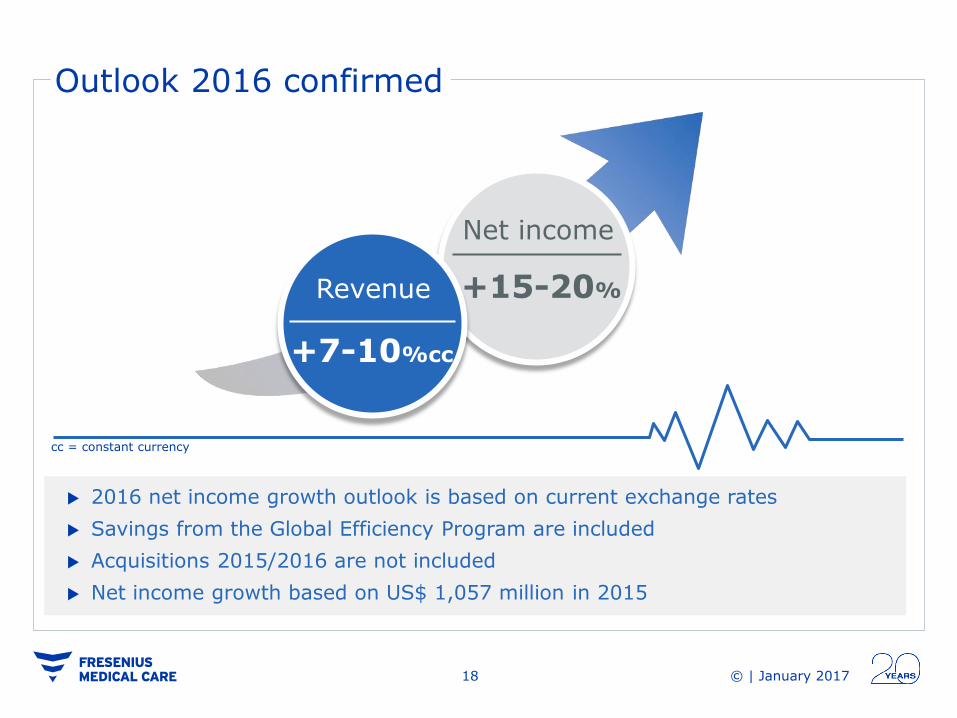
2016 net income growth outlook is based on current exchange rates
Savings from the Global Efficiency Program are included
Acquisitions 2015/2016 are not included
Net income growth based on US$ 1,057 million in 2015
+15-20%
Net income
+7-10%cc
Revenue
cc = constant currency
Outlook 2016 confirmed

© | January 2017 19
Changing health care systems C
om
ple
xit
y
Responsibility
Example: Reimbursement in the U.S. health care system

© | January 2017 20
Dialysis services
Dialysis products
Care Coordination
Revenue in $ billion
~10% p.a.
We expect an average increase in net income in the high single-digit percentage range for the same period.
We will continue to grow our dialysis services and products business.
We plan to further expand our Care Coordination activities.
2000 2015 2020e
4.2
28.0
16.7
Long-term goals up to 2020

© | January 2017 21 21 © | January 2017

© | January 2017 22 22 © | January 2017
Back up

© | January 2017 23
EBIT increase in line with revenue growth
Revenue for the first nine months increased by 8% at constant currency, in line with full-year guidance
Net income growth of +17% in Q3, excluding special items
Q3 2016 US$ million
Q3 2015 US$ million
Growth in %
9m 2016 US$ million
9m 2015 US$ million
Growth in %
Net revenue 4,598 4,231 9 13,224 12,390 7
Operating income (EBIT)
670 614 9 1,851 1,665 11
EBIT-margin in % 14.6 14.5 10bp 14.0 13.4 60bp
Net interest expense 100 100 1 308 304 1
Income before taxes 570 514 11 1,543 1,361 13
Income tax expense 164 168 (2) 471 441 7
Tax rate in % 28.8 32.8 (400bp) 30.5 32.4 (190bp)
Non-controlling interest 73 84 (13) 217 207 5
Net income 333 262 27 855 713 20

© | January 2017 24
Attachment 1
Reconciliation of non-US-GAAP financial measures to the most comparable US-GAAP measure
US$ million
Debt FY 2014 1) FY 2015 9m 2016
Short term debt 133 109 721
+ Short term debt from related parties 5 19 99
+ Current portion of long-term debt and capital lease obligations
314 664 891
+ Long-term debt and capital lease obligations less current portion
9,014 7,854 7,174
TOTAL debt 9,466 8,646 8,885
EBITDA FY 2014 2) FY 2015 2) 9m 2016 2)
Last twelve month operating income (EBIT) 2,347 2,327 2,519
+ Last twelve month depreciation and amortization 716 717 755
+ Non-cash charges 57 83 101
EBITDA (annualized) 3,120 3,127 3,375
Total Debt 1) / EBITDA 3.0 2.8 2.6
1) Reclassification of debt issuance costs from current / non-current assets to long-term liabilities 2) EBITDA: including largest acquisitions

© | January 2017 25
Attachment 2
Reconciliation of non-US-GAAP financial measures to the most comparable US-GAAP measure
US$ million
Cash flow Q3 2015 Q3 2016 9m 2015 9m 2016
Acquisitions, investments and net purchases of intangible assets
(65) (83) (166) (387)
+ Proceeds from divestitures 8 46 42 193
= Acquisitions and investments, net of divestitures (57) (37) (124) (194)
Capital expenditures, net Q3 2015 Q3 2016 9m 2015 9m 2016
Purchase of property, plant and equipment (230) (242) (647) (748)
- Proceeds from sale of property, plant & equipment 6 6 11 14
= Capital expenditure, net (224) (236) (636) (734)

© | January 2017 26
Reconciliation of non US-GAAP financial measures to the most directly comparable US-GAAP financial measures: impact of divestment of dialysis business in Venezuela and sale of the European marketing rights for certain renal pharmaceuticals to our joint venture Vifor Fresenius Medical Care Renal Pharma in 2015.
US$ million
Attachment 3
Q3 2015 Q3 2016 9M 2015 9M 2016
Operating income (EBIT) 614 670 1,665 1,851
Special items 18 - 18 -
Divestment of dialysis service business in Venezuela 26 - 26 -
Sale of European marketing rights to JV (8) - (8) -
Operating income (EBIT) excluding special items 632 670 1,683 1,851
Q3 2015 Q3 2016 9M 2015 9M 2016
Net income 262 333 713 855
Special items 22 - 22 -
Divestment of dialysis service business in Venezuela 27 - 27 -
Sale of European marketing rights to JV (5) - (5) -
Net income excluding special items 284 333 735 855

© | January 2017 27
9M 2016 US$
million
9M 2015 US$
million
Growth in %
Growth in %cc
Organic growth
in %
Same market growth
in %
Total health care services 10,720 9,929 8 9 7 3.3
North America 8,838 8,087 9 9 7 3.7
of which Care Coordination 1,704 1,382 23 23 19 -
EMEA 967 919 5 9 3 3.7
Asia-Pacific 538 496 9 3 4 4.9
Latin-America 377 427 (12) 16 22 1.9
9m 2016 - Health Care services & product revenue
cc = constant currency
9M 2016 US$ million
9M 2015 US$ million
Growth in %
Growth in %cc
Total dialysis products 2,504 2,461 2 4
North America 674 643 5 5
EMEA 1,015 1,037 (2) -
Asia-Pacific 660 611 8 12
Latin America 143 149 (4) 7
Corporate 12 21 (47) (47)
1 U.S. (excl. Mexico)
1

© | January 2017 28
405 395
9m 2015 9m 2016
9m 2016 - maintaining high margin profile
219 225
9m 2015 9m 2016
Asia-Pacific (11% of EBIT*)
EMEA (18% of EBIT*)
25 47
9m 2015 9m 2016
Latin America (2% of EBIT*)
Diagrams: different scales applied
1,284
1,486
9m 2015 9m 2016
North America (69% of EBIT*)
14.7%
15.6%
20.7%
19.9%
19.8% 18.7% 4.4%
9.1%
EBIT
EBIT-margin
in US$ million
%
EBIT-margin** (adjusted)
%
20.3%
9.0%
*excl. Corporate // ** for details see attachment 3, page 27

© | January 2017 29
Day sales outstanding (DSO)
The DSO increase is largely due to ordinary business fluctuations.
in days
North America
Asia-Pacific
TOTAL
Q2 2016 Q2 2015 Q3 2015 Q4 2015
71 71 71 74 70 72
40
60
80
100
120
140
160
Q1 2016
Latin America
EMEA
Q3 2016

© | January 2017 30
Q3 2015 9m 2015 Q3 2016 9m 2016
Period end 1.120 1.120 1.116 1.116
Average 1.112 1.114 1.117 1.116
Period end 9.450 9.450 15.297 15.297
Average 9.246 8.968 14.940 14.536
Period end 6.356 6.356 6.672 6.672
Average 6.304 6.249 6.666 6.582
Period end 65.377 65.377 63.179 63.179
Average 63.242 59.761 64.583 68.252
Exchange rates
$:CNY
€:$
$:ARS
$:RUB
© | January 2017 31
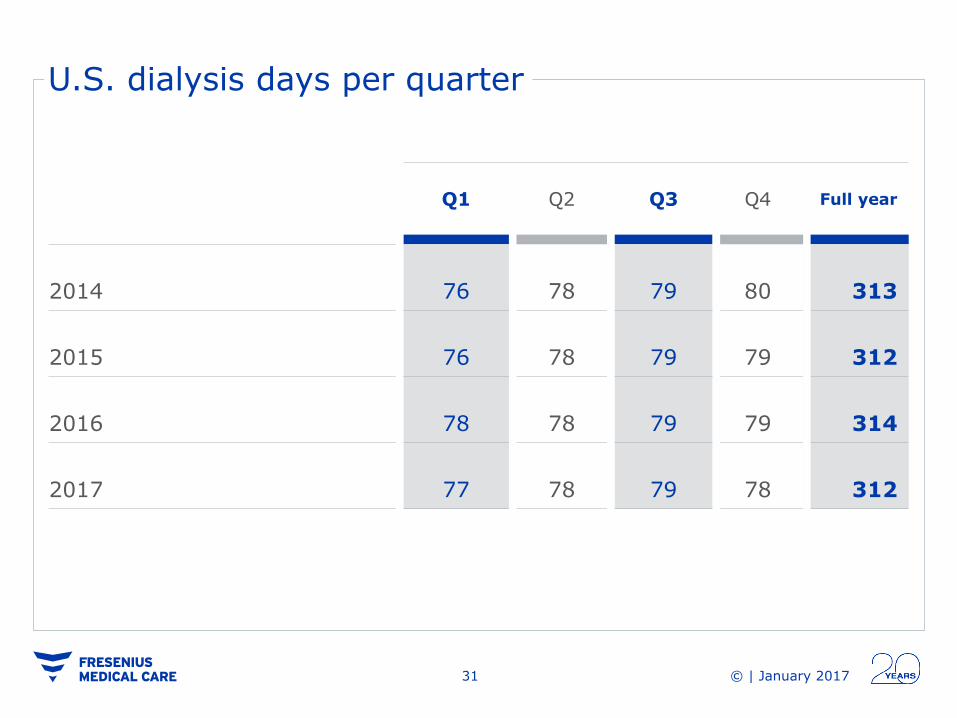
U.S. dialysis days per quarter
Q1 Q2 Q3 Q4
Full year
2014 76 78 79 80 313
2015 76 78 79 79 312
2016 78 78 79 79 314
2017 77 78 79 78 312

© | January 2017 32 32 © | January 2017
Constant currency: Changes in revenue include the impact of changes in foreign currency exchange rates. We
use the non-GAAP financial measure “at constant exchange rates” in our filings to show changes in our revenue without
giving effect to period-to-period currency fluctuations. Under U.S. GAAP, revenues received in local (non-U.S. dollar)
currency are translated into U.S. dollars at the average exchange rate for the period presented. When we use the term
“constant currency,” it means that we have translated local currency revenues for the current reporting period into U.S.
dollars using the same average foreign currency exchange rates for the conversion of revenues into U.S. dollars that we
used to translate local currency revenues for the comparable reporting period of the prior year. We then calculate the
change, as a percentage, of the current period revenues using the prior period exchange rates versus the prior period
revenues. This resulting percentage is a non-GAAP measure referring to a change as a percentage “at constant exchange
rates.”
We believe that revenue growth is a key indication of how a company is progressing from period to period and that the non-
GAAP financial measure constant currency is useful to investors, lenders, and other creditors because such information
enables them to gauge the impact of currency fluctuations on its revenue from period to period. However, we also believe
that data on constant currency period-over-period changes have limitations, particularly as the currency effects that are
eliminated could constitute a significant element of our revenue and could significantly impact our performance. We
therefore limit our use of constant currency period-over-period changes to a measure for the impact of currency fluctuations
on the translation of local currency revenue into U.S. dollars. We do not evaluate our results and performance without
considering both constant currency period-over-period changes in non-U.S. GAAP revenue on the one hand and changes in
revenue prepared in accordance with U.S. GAAP on the other. We caution the readers of this report to follow a similar
approach by considering data on constant currency period-over-period changes only in addition to, and not as a substitute
for or superior to, changes in revenue prepared in accordance with U.S. GAAP. We present the fluctuation derived from U.S.
GAAP revenue next to the fluctuation derived from non-GAAP revenue. Because the reconciliation is inherent in the
disclosure, we believe that a separate reconciliation would not provide any additional benefit.

© | January 2017 33
Financial calendar *
Feb 22, 2017 Report on 4th quarter 2016
May 3, 2017 Report on 1st quarter 2017
May 11, 2017 Annual General Meeting, Frankfurt
Jan 17-18, 2017 Kepler Cheuvreux German Corporate Conference, Frankfurt
Feb 28, 2017 JP Morgan High Yield & Lev Finance Conference, Miami
Mar 15, 2017 Exane BNPP Healthcare Conference, Paris
* Please note that dates and/or participation might be subject to change

© | January 2017 34
Contacts
Dr. Dominik Heger
Head of Investor Relations and Corporate Communications Tel: +49–(0) 6172–609–2601 Email: [email protected]
Robert Adolph Director Investor Relations Tel.: +49–(0) 6172–609–2477 Email: [email protected]
Juliane Beckmann Senior Manager Investor Relations Tel.: +49–(0) 6172–609–5216 Email: [email protected]
Terry Morris
VP Investor Relations North America Tel: +1– 800–948–2538 Email: [email protected]
Ticker: FME or FMS (NYSE) WKN: 578 580 ISIN: DE00057858002
FME Investor Relations Else-Kröner-Str. 1 61352 Bad Homburg v.d.H. Germany

35 © | January 2017 © | November 2016
UniCredit und Kepler Cheuvreux German Corporate Conference
Frankfurt | January 17, 2017