Embed Size (px)
Citation preview

#splunkconf – Las Vegas, 23rd September 2015
UniCredit and V-TServices: Four Years of Splunk Integration Facing Heterogeneous Use Cases Stefano Guidobaldi, Advanced Engineering – UniCredit Group ICT & Security Officer Mirko Carrara, Service Reliability & Splunk Team – V-TServices
Agenda • About us • Our journey with Splunk • Splunk deployment topology • Use cases: overview
o Business Analytics o Application Delivery o IT Operational Analytics o Accounting o APInthusiasts
• Recap and Takeaways • Q&A

About us Stefano Guidobaldi
• Current position: IT System Architect at UniCredit • Formerly advisor for UniCredit, working on Splunk projects/
developments • Area of expertise: system administration, tuning and automation,
analytics • Contact: [email protected]
Mirko Carrara
• Current position: IT Ops Architect & Splunk Lead at V-TServices • Formerly working at UniCredit Business Integrated Solutions on IT
Ops and Splunk • Area of expertise: troubleshooting, root cause analysis, monitoring,
analytics. • Contact: [email protected]

UniCredit: at a Glance
§ Employees: more than 127,000*
§ Branches: 7,100*
§ Banking operations in 17 countries
§ International network spanning: ~ 50 countries
§ Global player in asset management: € 221 bn in managed assets*
§ Market leader in Central and Eastern Europe leveraging on the region's structural strengths
* Source: UniCredit Company Profile, data as at June 30, 2015

Value Transformation Services: at a Glance
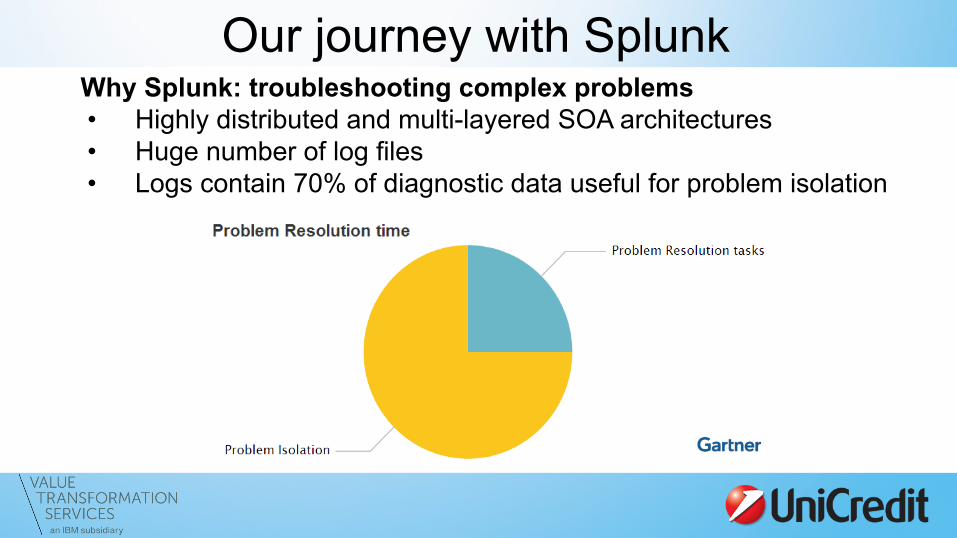
Why Splunk: troubleshooting complex problems • Highly distributed and multi-layered SOA architectures • Huge number of log files • Logs contain 70% of diagnostic data useful for problem isolation
Our journey with Splunk
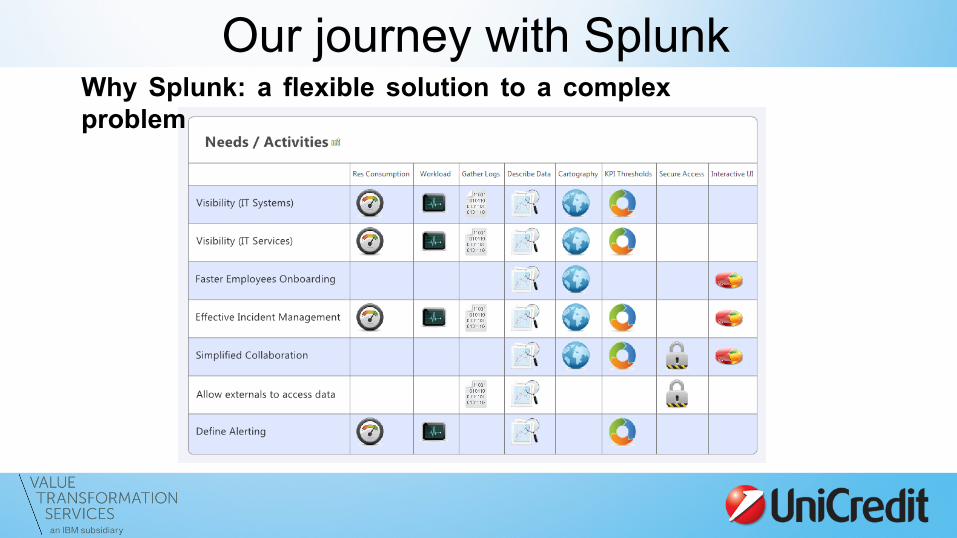
Our journey with Splunk Why Splunk: a flexible solution to a complex problem
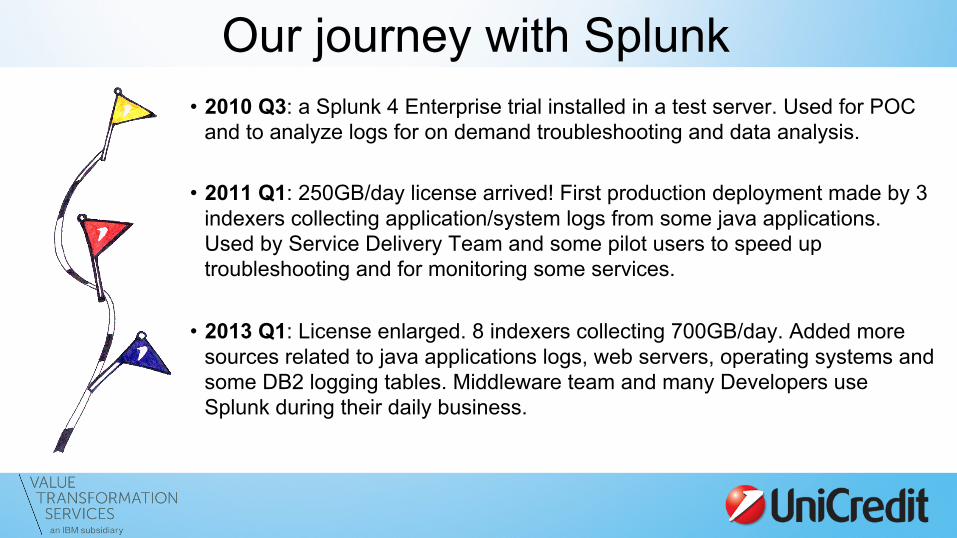
Our journey with Splunk • 2010 Q3: a Splunk 4 Enterprise trial installed in a test server. Used for POC
and to analyze logs for on demand troubleshooting and data analysis.
• 2011 Q1: 250GB/day license arrived! First production deployment made by 3 indexers collecting application/system logs from some java applications. Used by Service Delivery Team and some pilot users to speed up troubleshooting and for monitoring some services.
• 2013 Q1: License enlarged. 8 indexers collecting 700GB/day. Added more sources related to java applications logs, web servers, operating systems and some DB2 logging tables. Middleware team and many Developers use Splunk during their daily business.
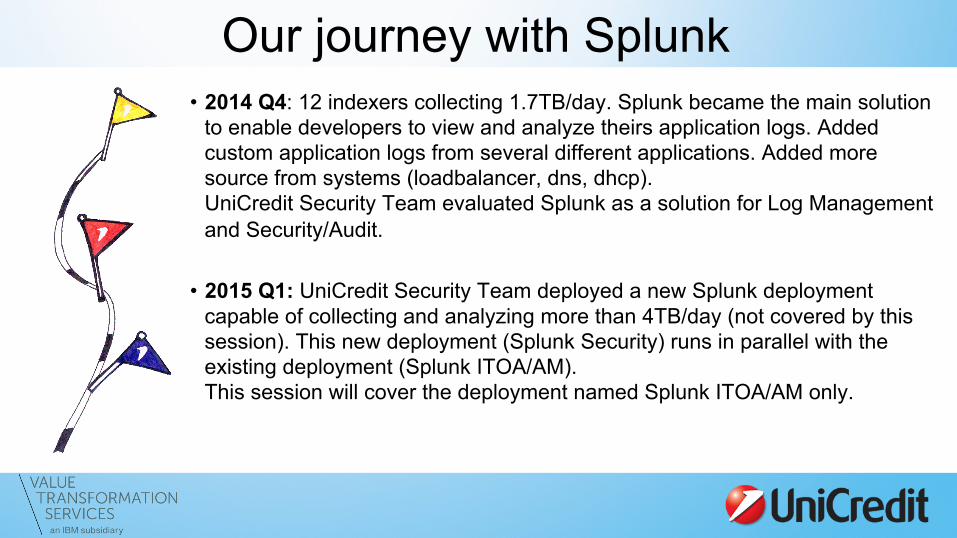
Our journey with Splunk • 2014 Q4: 12 indexers collecting 1.7TB/day. Splunk became the main solution
to enable developers to view and analyze theirs application logs. Added custom application logs from several different applications. Added more source from systems (loadbalancer, dns, dhcp). UniCredit Security Team evaluated Splunk as a solution for Log Management and Security/Audit.
• 2015 Q1: UniCredit Security Team deployed a new Splunk deployment capable of collecting and analyzing more than 4TB/day (not covered by this session). This new deployment (Splunk Security) runs in parallel with the existing deployment (Splunk ITOA/AM). This session will cover the deployment named Splunk ITOA/AM only.
Our journey with Splunk • Today: Splunk is one of the main solution for:
o IT Operational Analytics o Application Management.
• It is widely used by Developers, System Administrators, Service Delivery
Analysts, Network and Network Security Engineers, etc. • Still important to boost troubleshooting and problem isolation. • It has a crucial role in the monitoring and reporting area. • Many new projects include Splunk as an important component for
production readiness.

Our journey with Splunk Splunk scope as today:
Splunk ITOA/AM deployment in UniCredit
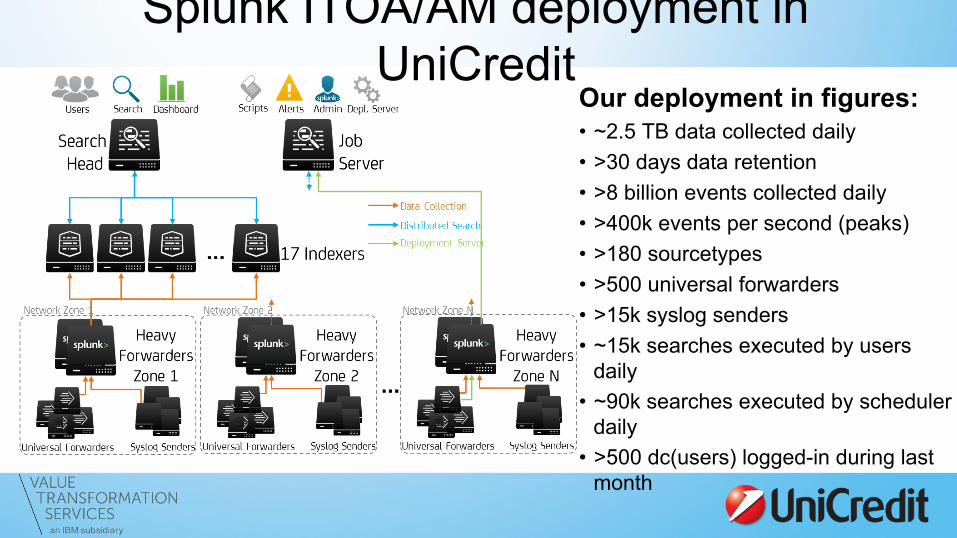
Our deployment in figures: • ~2.5 TB data collected daily • >30 days data retention • >8 billion events collected daily • >400k events per second (peaks) • >180 sourcetypes • >500 universal forwarders • >15k syslog senders • ~15k searches executed by users
daily • ~90k searches executed by scheduler
daily • >500 dc(users) logged-in during last
month
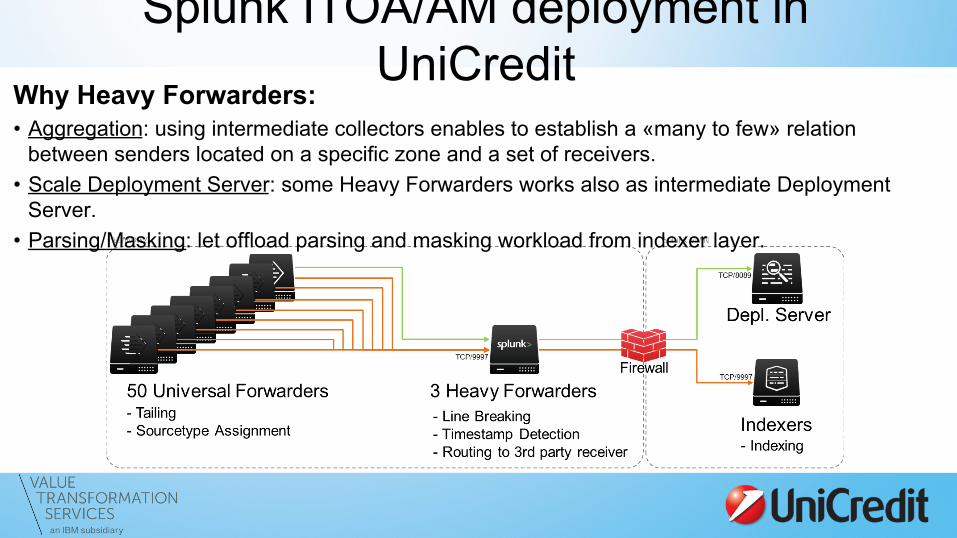
Why Heavy Forwarders: • Aggregation: using intermediate collectors enables to establish a «many to few» relation
between senders located on a specific zone and a set of receivers. • Scale Deployment Server: some Heavy Forwarders works also as intermediate Deployment
Server. • Parsing/Masking: let offload parsing and masking workload from indexer layer.
Splunk ITOA/AM deployment in UniCredit
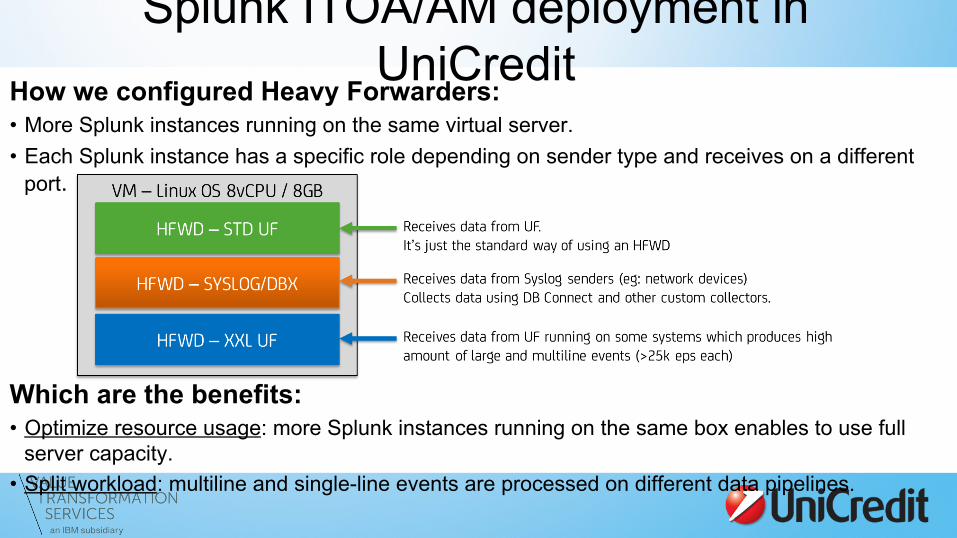
How we configured Heavy Forwarders: • More Splunk instances running on the same virtual server. • Each Splunk instance has a specific role depending on sender type and receives on a different
port.
Which are the benefits: • Optimize resource usage: more Splunk instances running on the same box enables to use full
server capacity. • Split workload: multiline and single-line events are processed on different data pipelines.
Splunk ITOA/AM deployment in UniCredit
Splunk ITOA/AM deployment in UniCredit
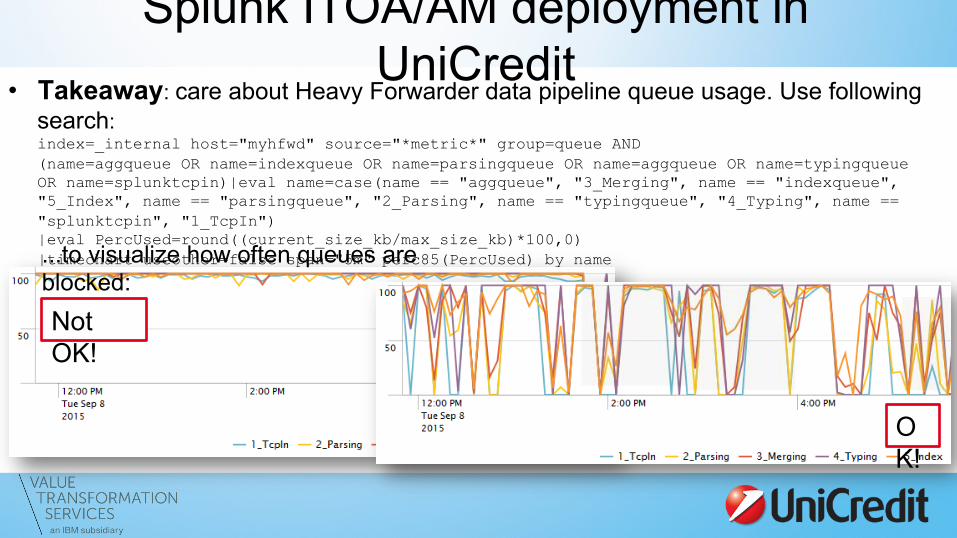
• Takeaway: care about Heavy Forwarder data pipeline queue usage. Use following search: index=_internal host="myhfwd" source="*metric*" group=queue AND (name=aggqueue OR name=indexqueue OR name=parsingqueue OR name=aggqueue OR name=typingqueue OR name=splunktcpin)|eval name=case(name == "aggqueue", "3_Merging", name == "indexqueue", "5_Index", name == "parsingqueue", "2_Parsing", name == "typingqueue", "4_Typing", name == "splunktcpin", "1_TcpIn") |eval PercUsed=round((current_size_kb/max_size_kb)*100,0) |timechart useother=false span="5m" perc85(PercUsed) by name
Not OK!
OK!
...to visualize how often queues are blocked:
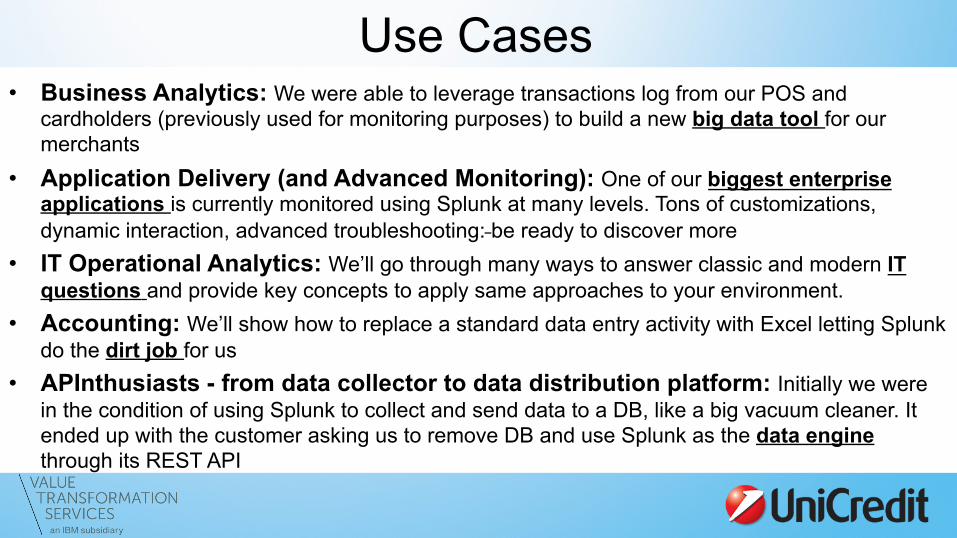
Use Cases • Business Analytics: We were able to leverage transactions log from our POS and
cardholders (previously used for monitoring purposes) to build a new big data tool for our merchants
• Application Delivery (and Advanced Monitoring): One of our biggest enterprise applications is currently monitored using Splunk at many levels. Tons of customizations, dynamic interaction, advanced troubleshooting: be ready to discover more
• IT Operational Analytics: We’ll go through many ways to answer classic and modern IT questions and provide key concepts to apply same approaches to your environment.
• Accounting: We’ll show how to replace a standard data entry activity with Excel letting Splunk do the dirt job for us
• APInthusiasts - from data collector to data distribution platform: Initially we were in the condition of using Splunk to collect and send data to a DB, like a big vacuum cleaner. It ended up with the customer asking us to remove DB and use Splunk as the data engine through its REST API
Business Analytics: How a single data-source served different purposes
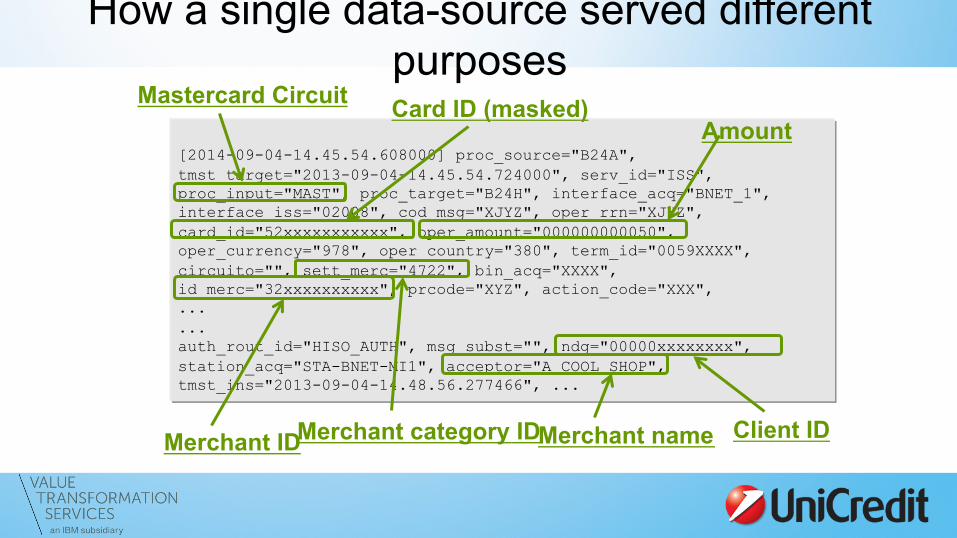
How a single data-source served different purposes
[2014-09-04-14.45.54.608000] proc_source="B24A", tmst_target="2013-09-04-14.45.54.724000", serv_id="ISS", proc_input="MAST", proc_target="B24H", interface_acq="BNET_1", interface_iss="02008", cod_msg="XJYZ", oper_rrn="XJYZ", card_id="52xxxxxxxxxxx", oper_amount="000000000050", oper_currency="978", oper_country="380", term_id="0059XXXX", circuito="", sett_merc="4722", bin_acq="XXXX", id_merc="32xxxxxxxxxx", prcode="XYZ", action_code="XXX", ... ... auth_rout_id="HISO_AUTH", msg_subst="", ndg="00000xxxxxxxx", station_acq="STA-BNET-MI1", acceptor="A COOL SHOP", tmst_ins="2013-09-04-14.48.56.277466", ...
Mastercard Circuit
Client ID Merchant name
Amount Card ID (masked)
Merchant category ID Merchant ID
How a single data-source served different purposes
[2014-09-04-14.45.54.608000] proc_source="B24A", tmst_target="2013-09-04-14.45.54.724000", serv_id="ISS", proc_input="MAST", proc_target="B24H", interface_acq="BNET_1", interface_iss="02008", cod_msg="1110", ... id_merc="32xxxxxxxx", prcode="003000", action_code="000", approval_code="X", oper_mod_input="1", channel="O", flag_dupl="Y", flag_onus="N", auth_rout_dst="XXXX", auth_rout_id="HISO_AUTH", msg_subst="", ndg="00000xxxxxxxx", station_acq="STA-BNET-MI1", acceptor="COOL SHOP" 380", tmst_ins="2013-09-04-14.48.56.277466", ...
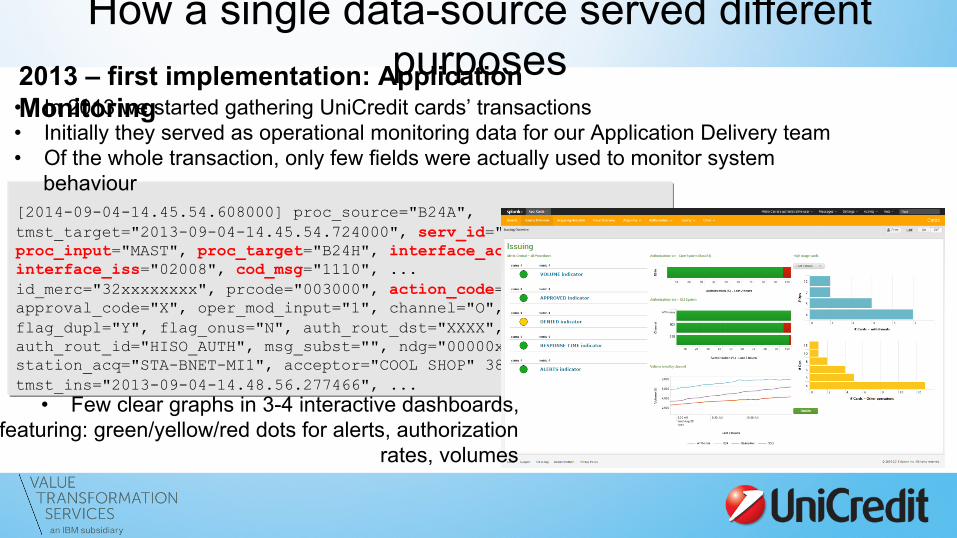
2013 – first implementation: Application Monitoring • In 2013 we started gathering UniCredit cards’ transactions • Initially they served as operational monitoring data for our Application Delivery team • Of the whole transaction, only few fields were actually used to monitor system
behaviour
• Few clear graphs in 3-4 interactive dashboards, featuring: green/yellow/red dots for alerts, authorization
rates, volumes
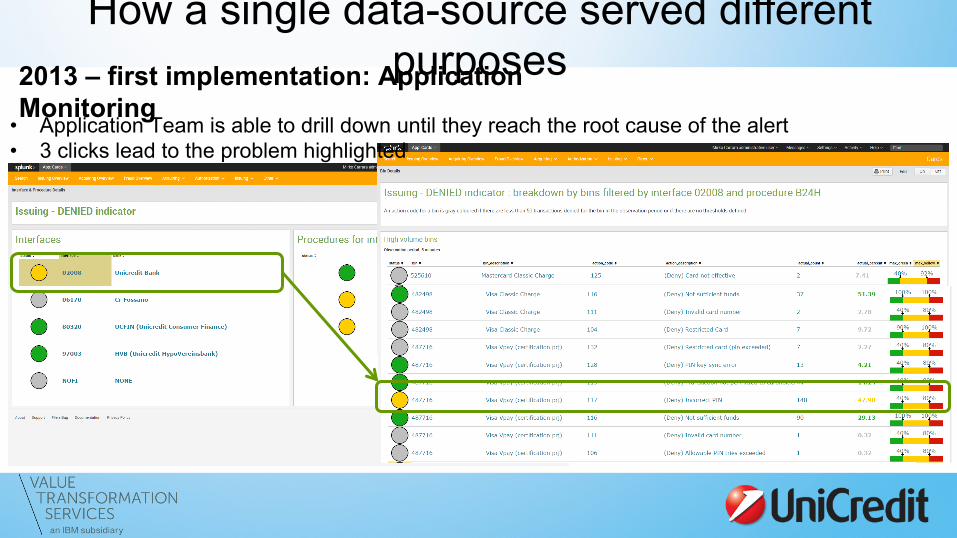
How a single data-source served different purposes 2013 – first implementation: Application
Monitoring • Application Team is able to drill down until they reach the root cause of the alert • 3 clicks lead to the problem highlighted
[2014-09-04-14.45.54.608000] proc_source="B24A", tmst_target="2013-09-04-14.45.54.724000", serv_id="ISS", proc_input="MAST", proc_target="B24H", interface_acq="BNET_1", interface_iss="02008", cod_msg="XJYZ", oper_rrn="XJYZ", card_id="52xxxxxxxxxxx", oper_amount="000000000050", oper_currency="978", oper_country="380", term_id="0059XXXX", circuito="", sett_merc="4722", bin_acq="XXXX", id_merc="32xxxxxxxxxx", prcode="XYZ", action_code="XXX", ... ... auth_rout_id="HISO_AUTH", msg_subst="", ndg="00000xxxxxxxx", station_acq="STA-BNET-MI1", acceptor="A COOL SHOP", tmst_ins="2013-09-04-14.48.56.277466", ...
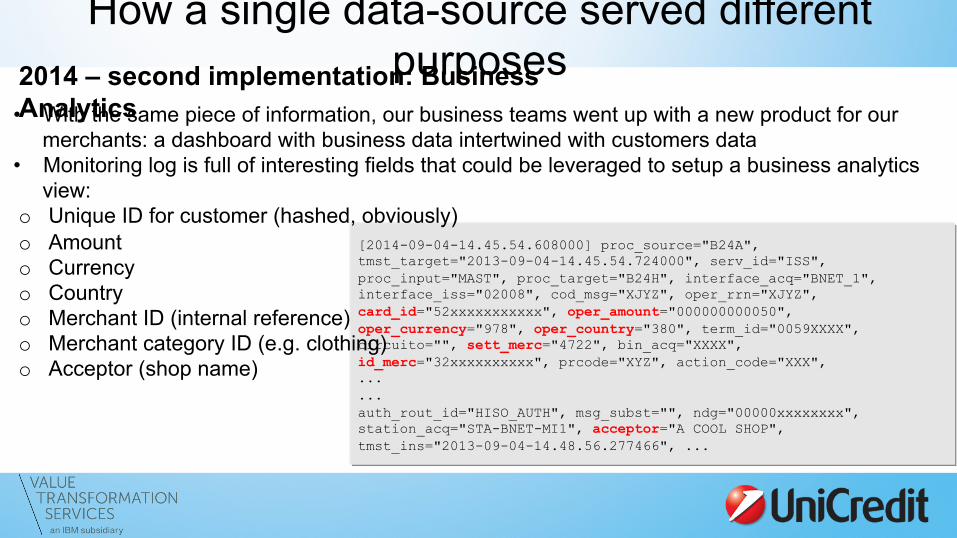
How a single data-source served different purposes 2014 – second implementation: Business
Analytics • With the same piece of information, our business teams went up with a new product for our merchants: a dashboard with business data intertwined with customers data
• Monitoring log is full of interesting fields that could be leveraged to setup a business analytics view:
o Unique ID for customer (hashed, obviously) o Amount o Currency o Country o Merchant ID (internal reference) o Merchant category ID (e.g. clothing) o Acceptor (shop name)
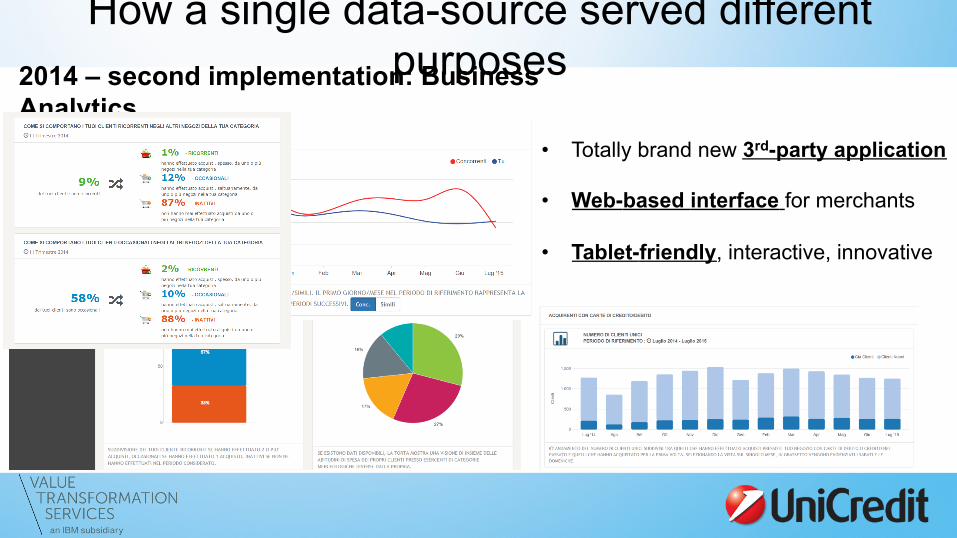
How a single data-source served different purposes 2014 – second implementation: Business
Analytics • Totally brand new 3rd-party application
• Web-based interface for merchants
• Tablet-friendly, interactive, innovative
How a single data-source served different purposes
Key takeaways
• Many use cases share the same set of data
• When preparing a new log include anything that can be valuable in the future
• Use summary indexes to aggregate data

Application Delivery: See the forest *AND* the trees
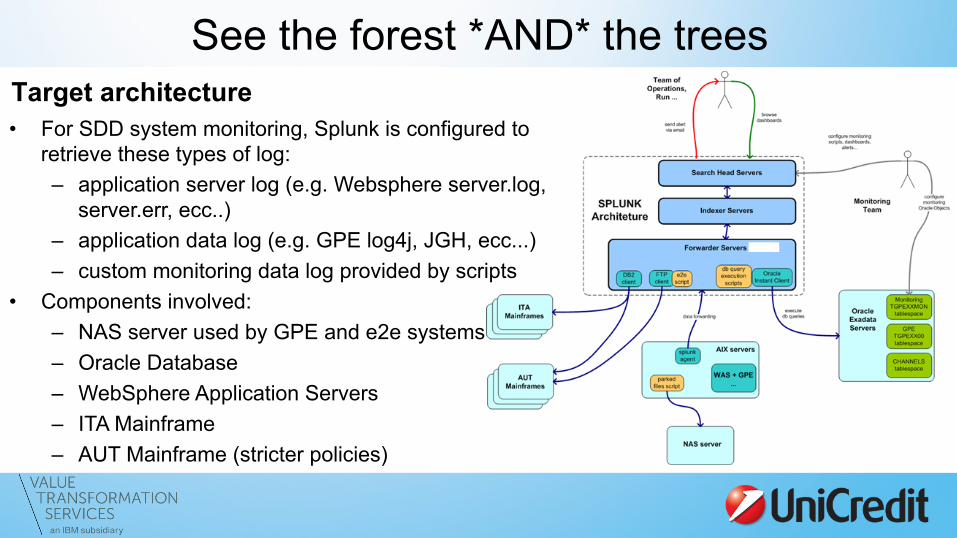
See the forest *AND* the trees Target architecture • For SDD system monitoring, Splunk is configured to
retrieve these types of log: – application server log (e.g. Websphere server.log,
server.err, ecc..) – application data log (e.g. GPE log4j, JGH, ecc...) – custom monitoring data log provided by scripts
• Components involved: – NAS server used by GPE and e2e systems – Oracle Database – WebSphere Application Servers – ITA Mainframe – AUT Mainframe (stricter policies)
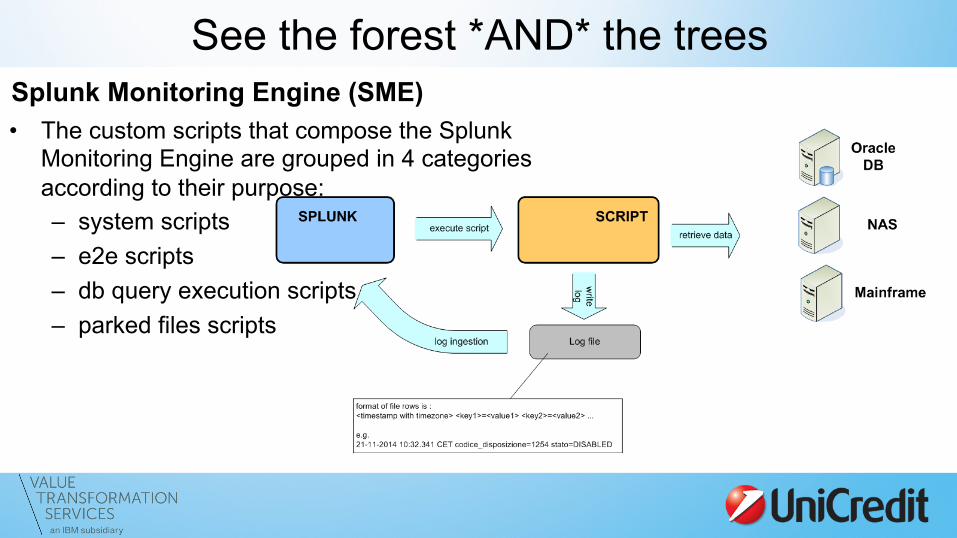
See the forest *AND* the trees Splunk Monitoring Engine (SME) • The custom scripts that compose the Splunk
Monitoring Engine are grouped in 4 categories according to their purpose: – system scripts – e2e scripts – db query execution scripts – parked files scripts
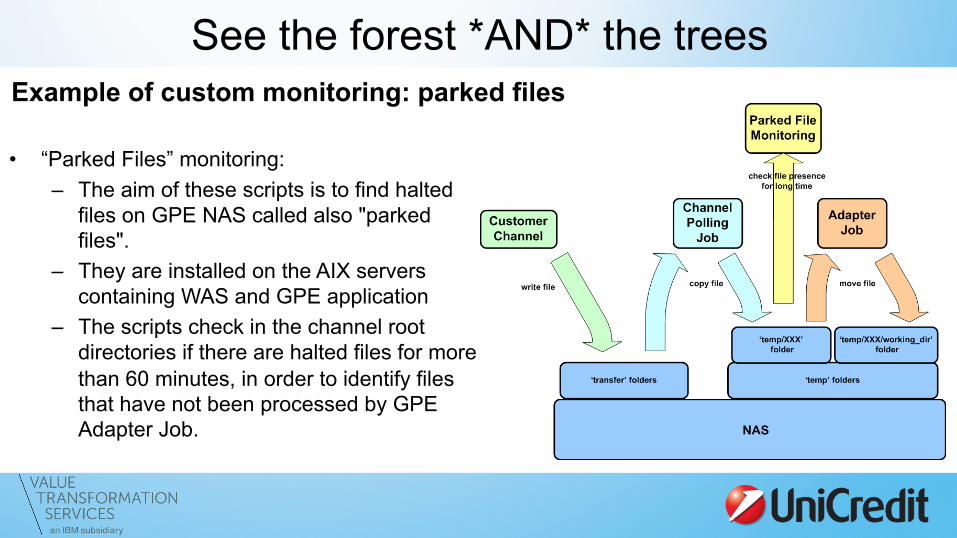
See the forest *AND* the trees Example of custom monitoring: parked files
• “Parked Files” monitoring: – The aim of these scripts is to find halted
files on GPE NAS called also "parked files".
– They are installed on the AIX servers containing WAS and GPE application
– The scripts check in the channel root directories if there are halted files for more than 60 minutes, in order to identify files that have not been processed by GPE Adapter Job.
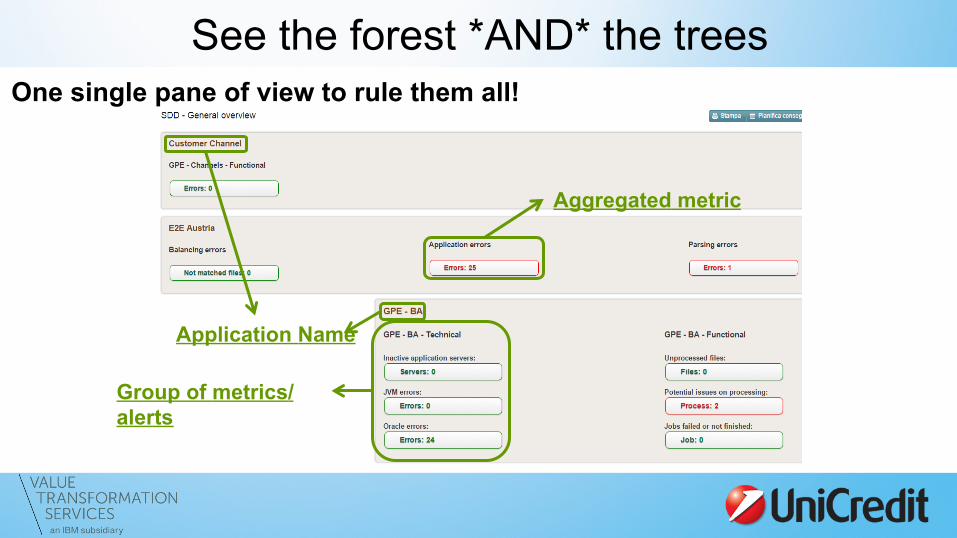
Application Name
Aggregated metric
Group of metrics/alerts
See the forest *AND* the trees One single pane of view to rule them all!
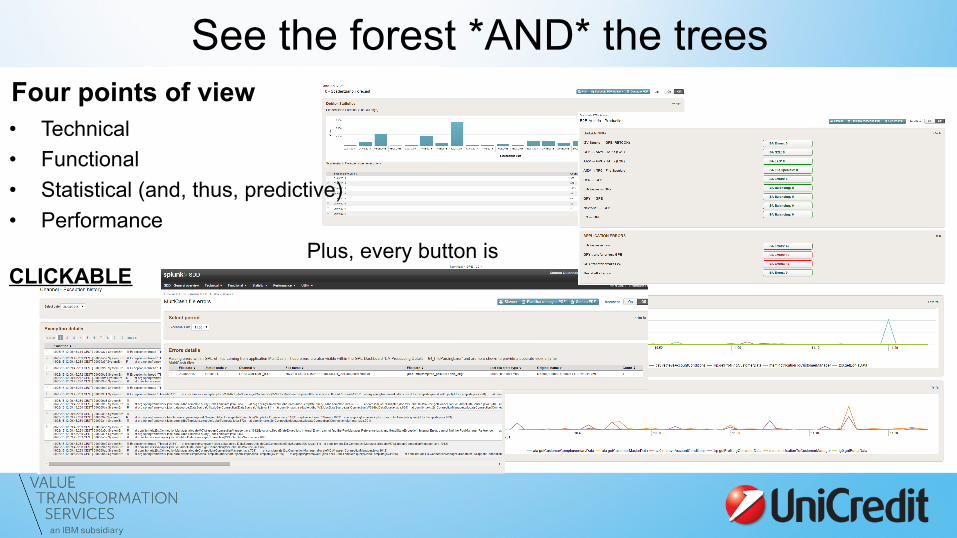
See the forest *AND* the trees Four points of view • Technical • Functional • Statistical (and, thus, predictive) • Performance
Plus, every button is CLICKABLE
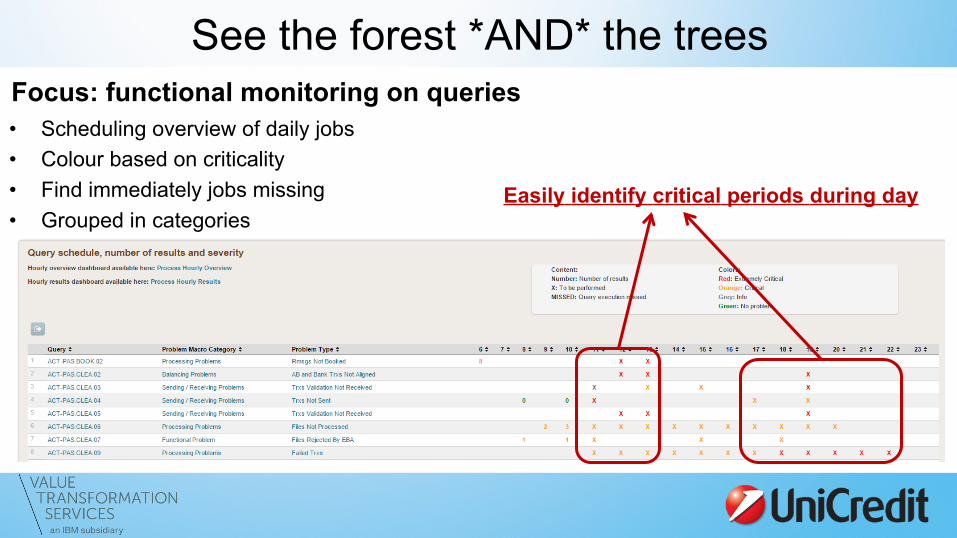
See the forest *AND* the trees Focus: functional monitoring on queries • Scheduling overview of daily jobs • Colour based on criticality • Find immediately jobs missing • Grouped in categories
Easily identify critical periods during day
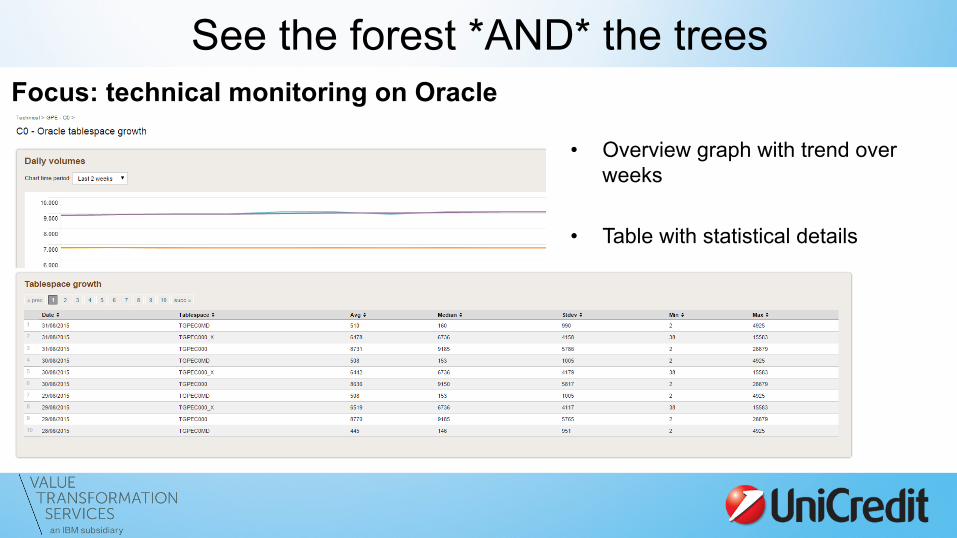
See the forest *AND* the trees Focus: technical monitoring on Oracle
• Overview graph with trend over weeks
• Table with statistical details
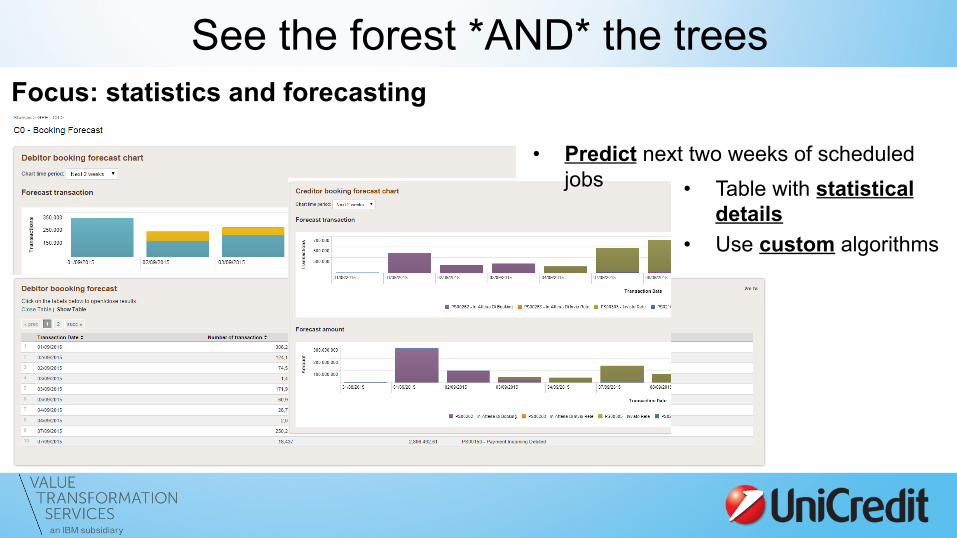
See the forest *AND* the trees Focus: statistics and forecasting
• Predict next two weeks of scheduled jobs • Table with statistical
details • Use custom algorithms
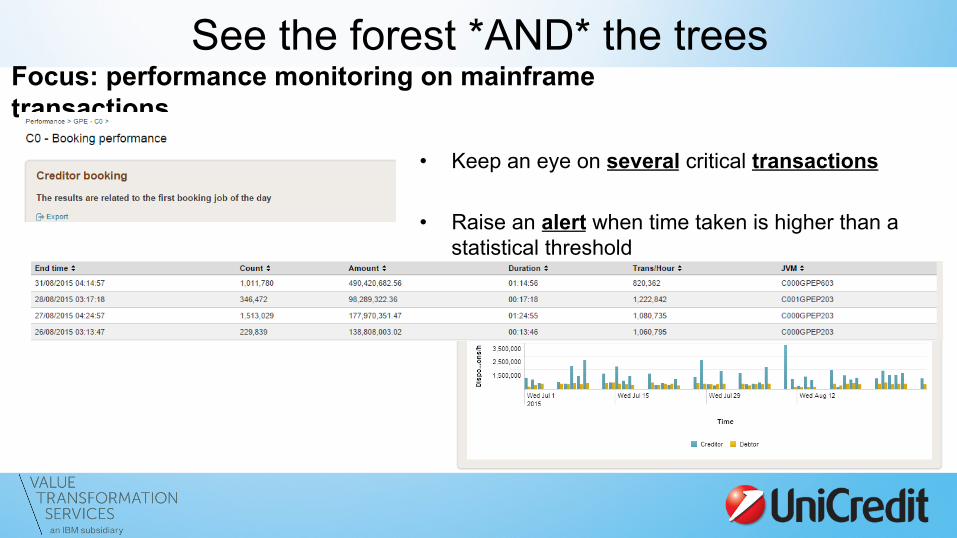
See the forest *AND* the trees Focus: performance monitoring on mainframe transactions
• Keep an eye on several critical transactions
• Raise an alert when time taken is higher than a statistical threshold
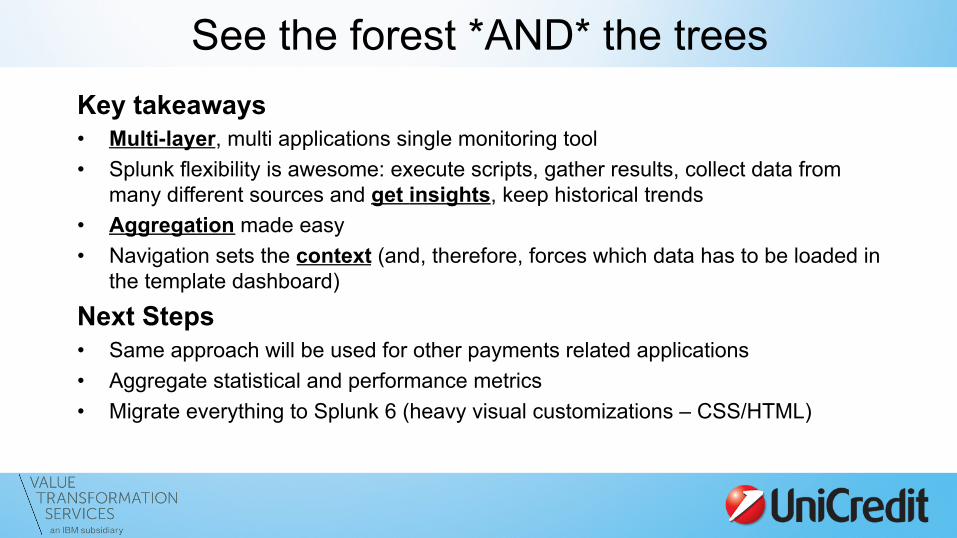
See the forest *AND* the trees Key takeaways • Multi-layer, multi applications single monitoring tool • Splunk flexibility is awesome: execute scripts, gather results, collect data from
many different sources and get insights, keep historical trends • Aggregation made easy • Navigation sets the context (and, therefore, forces which data has to be loaded in
the template dashboard)
Next Steps • Same approach will be used for other payments related applications • Aggregate statistical and performance metrics • Migrate everything to Splunk 6 (heavy visual customizations – CSS/HTML)
IT Operational Analytics: Proactive is way better than reactive
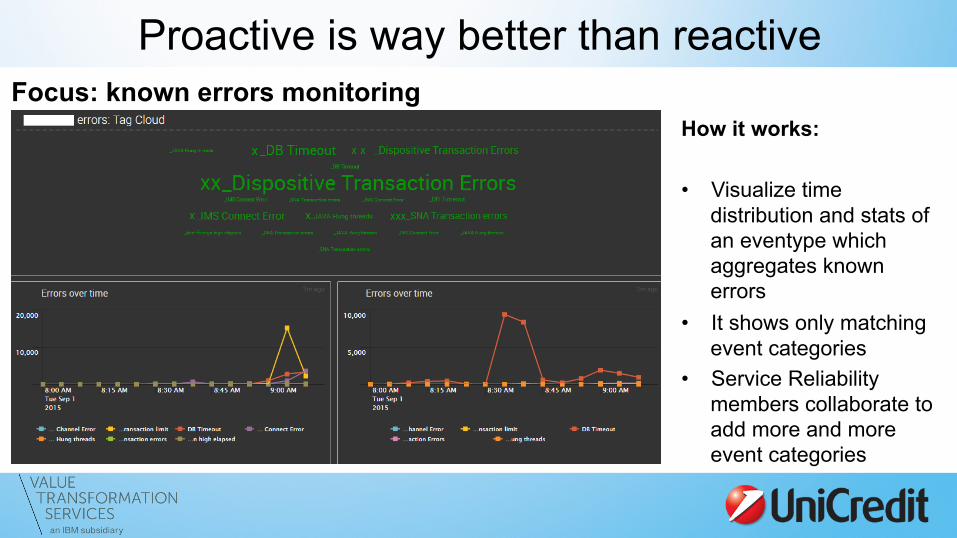
Proactive is way better than reactive Focus: known errors monitoring
How it works: • Visualize time
distribution and stats of an eventype which aggregates known errors
• It shows only matching event categories
• Service Reliability members collaborate to add more and more event categories
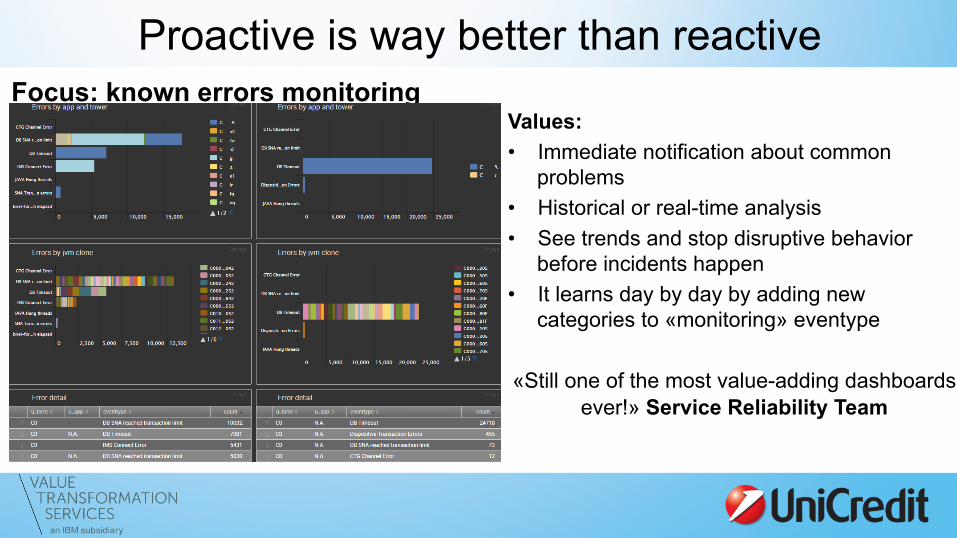
Proactive is way better than reactive Focus: known errors monitoring
Values: • Immediate notification about common
problems • Historical or real-time analysis • See trends and stop disruptive behavior
before incidents happen • It learns day by day by adding new
categories to «monitoring» eventype
«Still one of the most value-adding dashboards ever!» Service Reliability Team
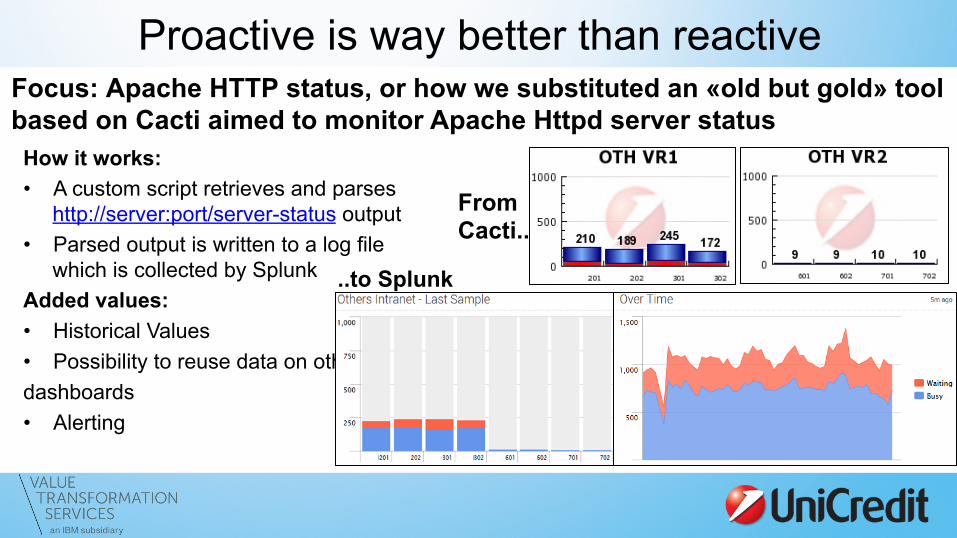
Proactive is way better than reactive Focus: Apache HTTP status, or how we substituted an «old but gold» tool based on Cacti aimed to monitor Apache Httpd server status
How it works: • A custom script retrieves and parses
http://server:port/server-status output • Parsed output is written to a log file
which is collected by Splunk Added values: • Historical Values • Possibility to reuse data on other dashboards • Alerting
..to Splunk
From Cacti..
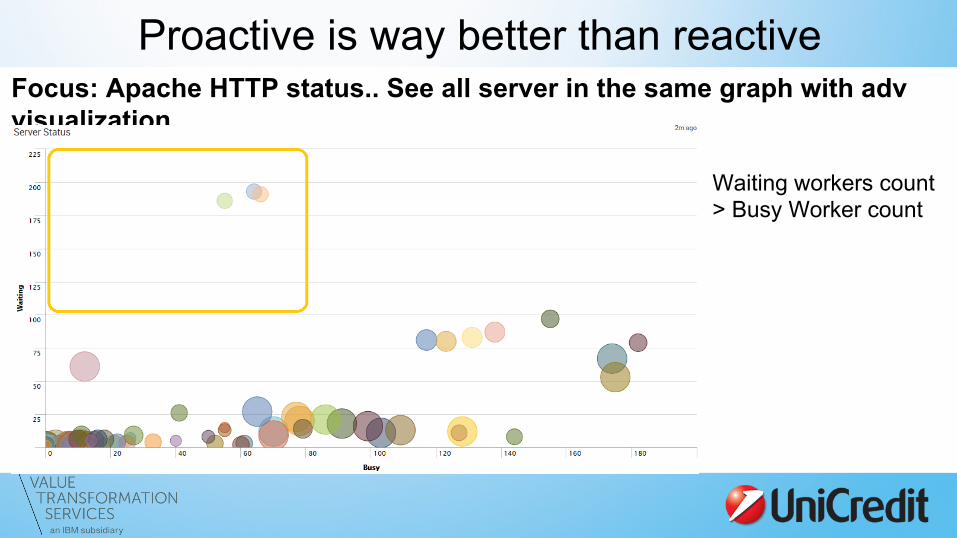
Proactive is way better than reactive Focus: Apache HTTP status.. See all server in the same graph with adv visualization
Waiting workers count > Busy Worker count
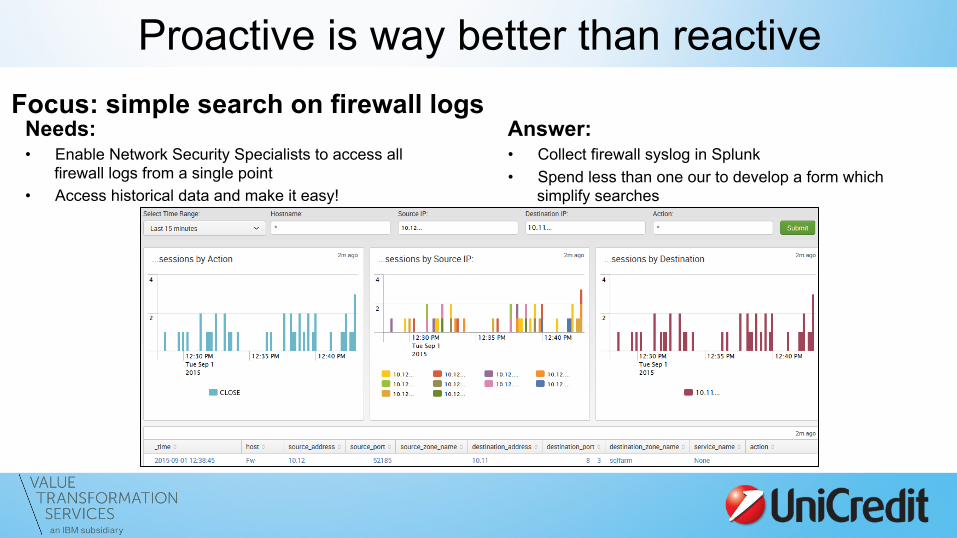
Proactive is way better than reactive Focus: simple search on firewall logs
Needs: • Enable Network Security Specialists to access all
firewall logs from a single point • Access historical data and make it easy!
Answer: • Collect firewall syslog in Splunk • Spend less than one our to develop a form which
simplify searches
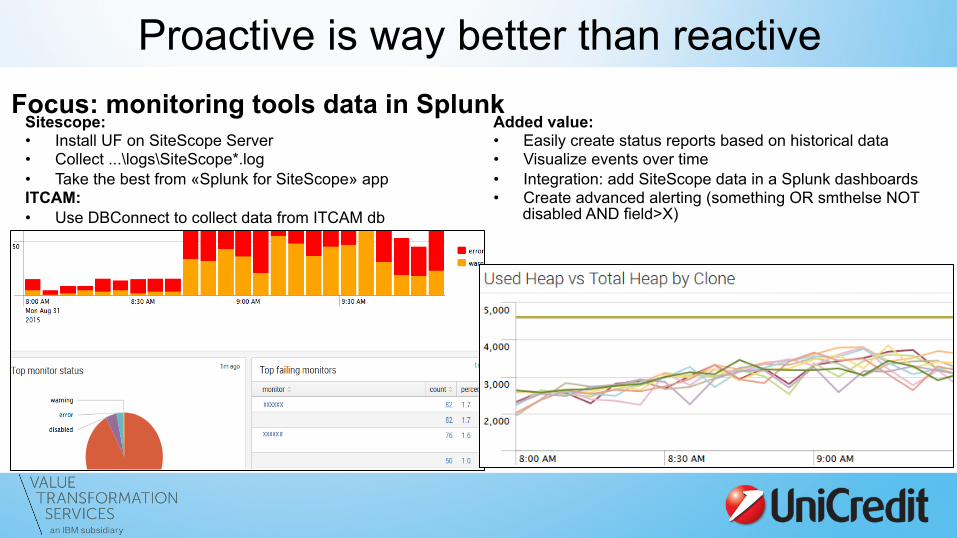
Proactive is way better than reactive Focus: monitoring tools data in Splunk
Sitescope: • Install UF on SiteScope Server • Collect ...\logs\SiteScope*.log • Take the best from «Splunk for SiteScope» app ITCAM: • Use DBConnect to collect data from ITCAM db
Added value: • Easily create status reports based on historical data • Visualize events over time • Integration: add SiteScope data in a Splunk dashboards • Create advanced alerting (something OR smthelse NOT
disabled AND field>X)
Proactive is way better than reactive Key takeaways
• Same approaches, different purposes
• DevOps re-mastered: IT Ops and Dev teams sharing the same perspective
• Always involve people who knows the data

Accounting: Build reports like never before
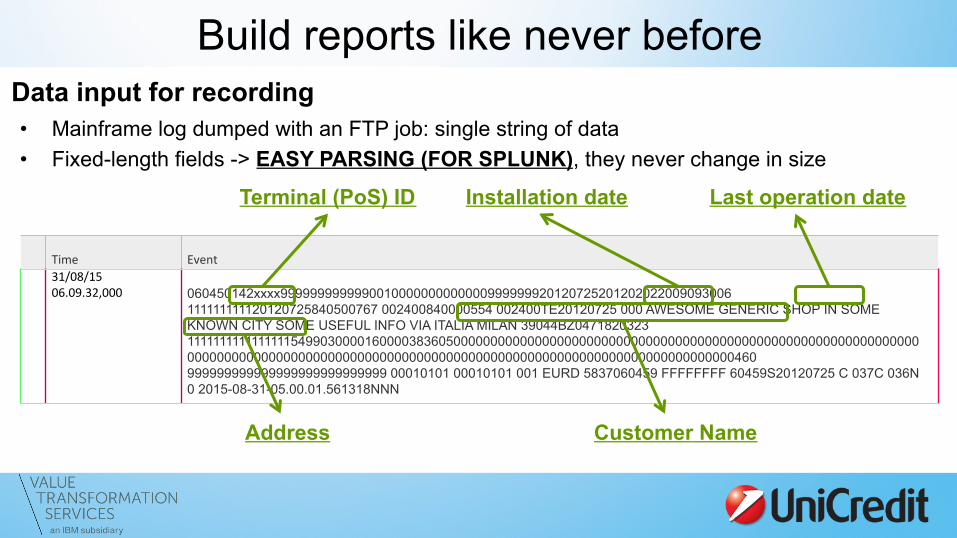
Build reports like never before Data input for recording • Mainframe log dumped with an FTP job: single string of data • Fixed-length fields -> EASY PARSING (FOR SPLUNK), they never change in size
Time Event 31/08/15 06.09.32,000
060450142xxxx9999999999990010000000000000999999920120725201202022009093006 111111111120120725840500767 002400840000554 002400TE20120725 000 AWESOME GENERIC SHOP IN SOME KNOWN CITY SOME USEFUL INFO VIA ITALIA MILAN 39044BZ0471820323 1111111111111111549903000016000038360500000000000000000000000000000000000000000000000000000000000000000000000000000000000000000000000000000000000000000000000000000000000000000460 999999999999999999999999999 00010101 00010101 001 EURD 5837060459 FFFFFFFF 60459S20120725 C 037C 036N 0 2015-08-31-05.00.01.561318NNN
Terminal (PoS) ID Last operation date
Address
Installation date
Customer Name
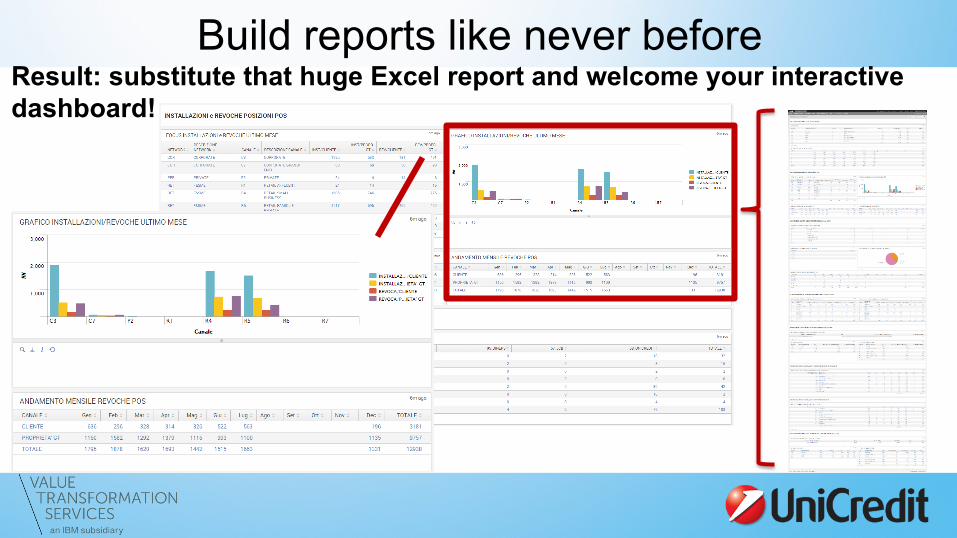
Build reports like never before Result: substitute that huge Excel report and welcome your interactive dashboard!
APInthusiasts: From data collector to data engine
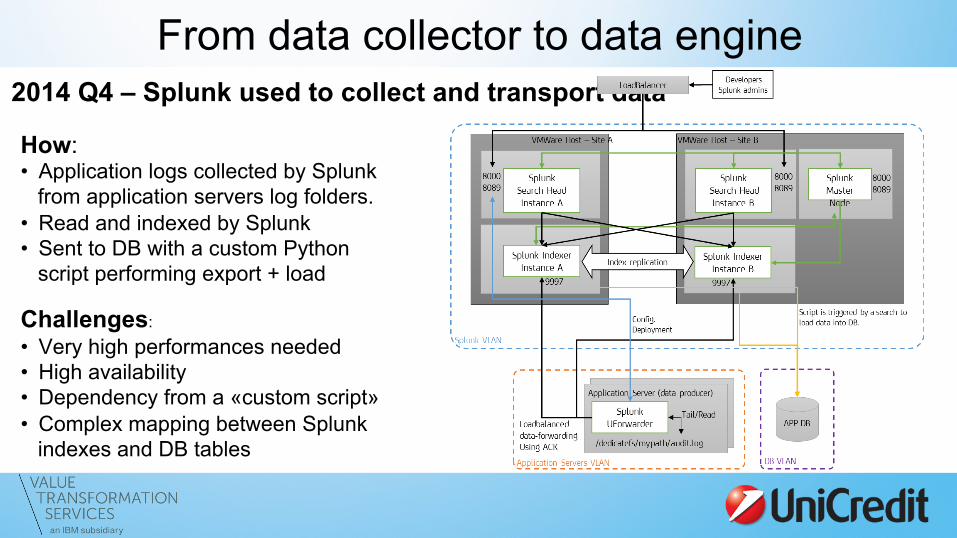
From data collector to data engine 2014 Q4 – Splunk used to collect and transport data
How: • Application logs collected by Splunk
from application servers log folders. • Read and indexed by Splunk • Sent to DB with a custom Python
script performing export + load
Challenges:
• Very high performances needed • High availability • Dependency from a «custom script» • Complex mapping between Splunk
indexes and DB tables
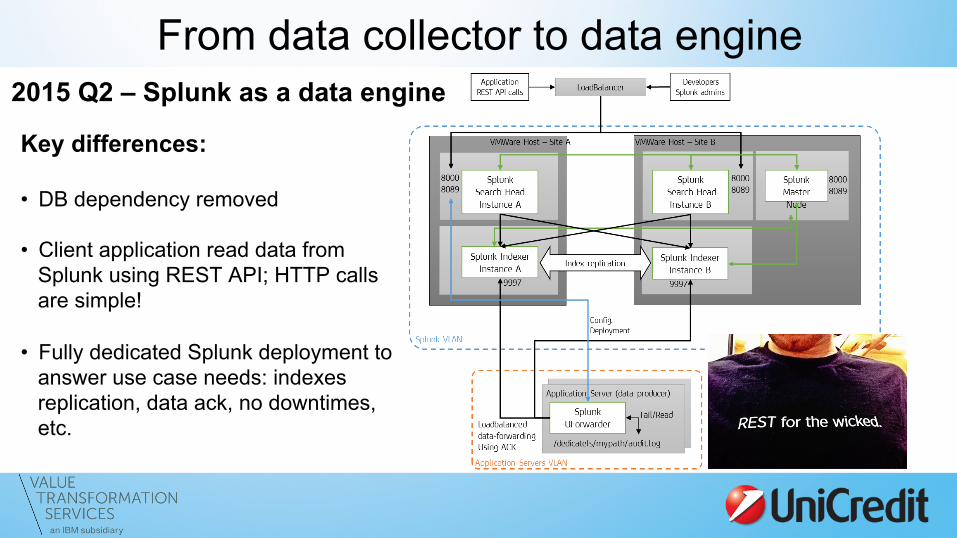
From data collector to data engine 2015 Q2 – Splunk as a data engine
Key differences: • DB dependency removed
• Client application read data from
Splunk using REST API; HTTP calls are simple!
• Fully dedicated Splunk deployment to answer use case needs: indexes replication, data ack, no downtimes, etc.
Recap and final takeaways What we’ve learned and what we believe you should interiorize:
«Be sure to add as many information (i.e. fields) to every input stream
available. Only God (or your best data scientists) know how you can exploit them, in
the future» (Somewhere in the Bible)
«Knowledge is power, use it well (and often)»
(Someone in the far future, ca. 40,000 AD)
«Why do it with a random tool when you can do it with Splunk?» (Mirko)

Questions?

#splunkconf – Las Vegas, 23rd September 2015
THANK YOU! Stefano Guidobaldi, Advanced Engineering – UniCredit Group ICT & Security Officer Mirko Carrara, Service Reliability & Splunk Team – V-TServices