Embed Size (px)
Citation preview

May 24, 2016
ICICI Securities Ltd | Retail Equity Research
Result Update
Revenues in line but margins under pressure… • Revenues grew 17.8% YoY to | 301.5 crore (I-direct estimate: | 311.1
crore) on account of 17.1% YoY growth in domestic sales to | 171.3 crore (I-direct estimate: | 171.1 crore) and 21.7% growth in export sales to | 100.7 crore (I-direct estimate: | 114.8 crore).
• EBITDA margins increased 456 bps YoY to 10.4% (I-direct estimate: 12.3%) due to high gross margins and low other expenditure. EBITDA increased 110.6% YoY to | 31.2 crore (I-direct estimate: | 38.1 crore).
• Net profit witnessed a YoY increase of 186.7% to | 28.1 crore (I-direct estimate: | 28.1 crore) owing to tax write-back.
Domestic formulations crawling back to normal post NLEM, realignment Domestic formulations, which constitute ~55% of total revenues, are at the core of overall performance. The acute: chronic: sub-chronic ratio for the company is 37:57:6. Despite having higher proportion of chronic therapies, the core business have grown at a CAGR of just ~5% between FY11-16P on account of 1) restructuring exercise and inventory rationalisation in FY10 / FY11 and 2) NLEM implementation and the resulting channel disturbances in FY13 / FY14. The situation is likely to change going ahead as the company plans to convert from distribution-driven model to C&F driven model for better working capital management. It plans to realign its portfolio to minimise the losses on account of NLEM by strengthening the MR team and pushing for more non-NLEM products (~21% of Domestic portfolio is currently under NLEM). However things are taking much more time than earlier estimated. We expect branded formulations to grow at a CAGR of 13.5% to | 957 crore between FY16P-18E.
Formulation exports still evolving but growing Export Formulations (~27% of total revenue) have grown at a CAGR of 27% during FY11-16P on the back of significant investments in the infrastructure to push exports. New product launches in the US and a ramp-up in CRAMS for US and EU based customers have contributed to the growth. CRAMS business off-late has struggled though, with customers postponing or cancelling the requirements. For the rest of the exports the company is looking for US generics traction. Unichem has filed 36 ANDAs with the USFDA and received approval for 20 ANDAs. It has so far launched 14 products. We expect formulation exports to grow at CAGR of 26.4% between FY16P-18E to | 587.7 crore on the back of incremental US launches. Margin improvement the key for re-rating… Q4 revenues were driven by strong growth in Domestic formulations (62% of total sales). Domestic formulations growth has shown sign of recovery in FY16. The management’s focus on restructuring the matured portfolio which accounts for 46% of the overall pie and which comprises of legacy but slow moving brands seems working. Despite better product mix the margin remained under pressure. Higher employee expenses and one-off pertaining to provision of subsidiary investment have dent in margins. The next task for the management is to bring the dwindling margins to the industry level. Export formulations are likely to maintain the growth tempo on the back of incremental US filings and subsequent launches. We expect revenues, EBITDA, profit to grow at a CAGR of 16.8%, 29.1% and 34.1% respectively, in FY16P-18E. We maintain our target price of | 310, based on 14x FY18E EPS of | 22.1.
Rating matrix Rating : BuyTarget : | 310Target Period : 12 monthsPotential Upside : 17%
What’s Changed? Target UnchangedEPS FY16P Changed from | 11.0 to | 12.3EPS FY17E Changed from | 15.7 to | 15.5EPS FY18E UnchangedRating Unchanged
Quarterly Performance
Q4FY16 Q4FY15 YoY (%) Q3FY16 QoQ (%)Revenue 301.5 256.0 17.8 306.3 -1.5EBITDA 31.2 14.8 110.6 34.1 -8.5EBITDA (%) 10.4 5.8 456 bps 11.1 -78 bpsAdj. Net Profit 28.1 9.8 186.7 22.7 24.1
Key Financials (| crore) FY15 FY16P FY17E FY18ERevenues 1201.8 1334.6 1569.4 1821.7EBITDA 101.3 163.9 204.0 273.2Adj. Net Profit 75.3 111.6 140.9 200.6Adj. EPS (|) 8.3 12.3 15.5 22.1
Valuation summary
FY15 FY16E FY17E FY18EPE (x) 31.8 22.0 17.0 12.0Target PE (x) 37.3 25.2 19.9 14.0EV to EBITDA (x) 23.3 14.7 11.7 8.4Price to book (x) 2.8 2.5 2.3 2.0RoNW (%) 8.7 11.7 13.4 16.8RoCE (%) 8.5 13.8 16.2 20.4
Stock data ParticularMarket CapitalisationDebt (FY16P)Cash (FY16P)EV52 week H/L (|) 334/174Equity capitalFace value | 2
| 18.2 crore
| 2418 crore
Amount| 2402 crore
| 36 crore| 20 crore
Price performance (%)
1M 3M 6M 1YUnichem Labs 14.2 31.3 -7.7 32.8Indoco Remedies -7.4 -1.0 -13.9 -30.1Alembic Pharma -1.3 -8.6 -14.4 4.6
Research Analyst
Siddhant Khandekar [email protected] Mitesh Shah [email protected]
Nandan Kamat [email protected]
Unichem Laboratories (UNILAB) | 264
ICICI Securities Ltd | Retail Equity Research Page 2
Variance analysis Q4FY16 Q4FY16E Q4FY15 Q3FY16 YoY (%) QoQ (%) Comments
Revenue 301.5 311.1 256.0 306.3 17.8 -1.5 YoY growth was mainly due to 21.7% YoY growth in export formulations and 17.1% growth in domestic formulations
Raw Material Expenses 107.8 112.0 96.6 108.4 11.6 -0.5 YoY improvement in gross margin (197 bps) was mainly due to better product mix
Employee Expenses 56.3 54.4 46.3 58.9 21.6 -4.5Other Expenditure 106.2 106.5 98.3 104.9 8.1 1.3 Provided for | 22.78 crore in FY16 for diminition of long term investment in Brazilan
Subsidery. Major portion of this provision has been registered in Q4FY16
EBITDA 31.2 38.1 14.8 34.1 110.6 -8.5EBITDA (%) 10.4 12.3 5.8 11.1 456 bps -78 bps Increase in EBITDA margin was mianly due to improvement in gross margin and
lower base. Miss vis-à-vis I-Direct estimates was due to higher-than-expected employee cost and other expenditure
Interest 0.8 0.4 0.4 0.4 85.4 77.1Depreciation 8.8 8.7 8.0 8.7 10.4 1.0Other Income 5.8 6.2 5.5 4.6 5.7 26.9PBT before Exceptional Items 27.4 35.2 11.9 29.5 130.1 -7.0EO 0.0 0.0 0.0 2.8 0.0 0.0PBT after Exceptional Items 27.4 35.2 11.9 26.7 130.1 2.6Tax -0.7 7.0 2.1 6.2 PL PLEffective Tax Rate (%) -2.6 20.0 17.7 23.2 PL PL Tax right back was due to higher deferred tax owing to postponement of Goa plant
capitalization and some R&D spend Adj. Net Profit 28.1 28.1 9.8 22.7 186.7 24.1 Strong YoY growth was largely due to robust operational performance and tax write-
backEPS (|) 3.1 3.1 1.1 2.3 186.2 37.0Key MetricsDomestic formulations 171.3 171.1 146.2 188.9 17.1 -9.3 Domestic growth was driven by ~7% price hike, 2% due to new products launches
and more than 5% YoY growth in volume
Exports formulations 100.7 114.8 82.8 93.8 21.7 7.4 In constant currency terms, US, UK and Brazil revenue increased 8.0%, 15.0% and 80.6% to US$ 8.8 million, GBP 2.5 million and Real 0.7 million respectively. Miss vis-à-vis our expectation was mainly due to lower-than-expected US sales
APIs 11.3 23.2 10.3 10.7 9.5 6.2
Source: Company, ICICIdirect.com Research Change in estimates
(| Crore) Old New % Change Old New % Change CommentsRevenue 1,570.1 1,569.4 0.0 1,824.1 1,821.7 -0.1EBITDA 202.4 204.0 0.8 273.6 273.2 -0.1EBITDA Margin (%) 12.9 13.0 10 bps 15.0 15.0 0 bpsPAT 142.2 140.9 -0.9 200.5 200.6 0.1EPS (|) 15.7 15.5 -1.0 22.1 22.1 0.2
FY17E FY18E
Source: Company, ICICIdirect.com Research Assumptions
Comments(| crore) FY15 FY16P FY17E FY18E FY17E FY18EDomestic formulations 651.0 742.9 839.5 957.0 843.4 961.5Exports formulations 312.8 368.1 475.0 587.7 481.6 597.6
APIs 113.1 93.4 98.0 102.9 101.3 106.3
Current Earlier
Source: Company, ICICIdirect.com Research
ICICI Securities Ltd | Retail Equity Research Page 3
Company Analysis
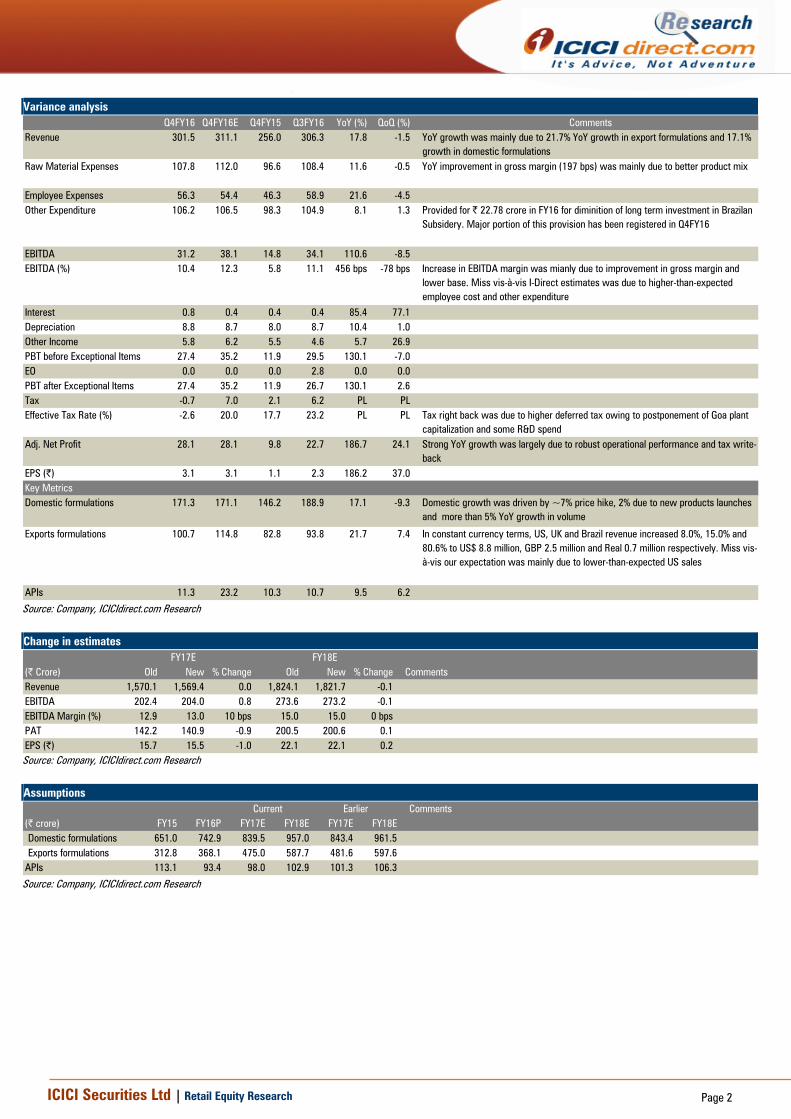
Established in 1944, the company has five subsidiaries and one associate company. It remained confined to selected therapeutic groups such as Anti-hypertensives, Anti-infectves, Neurology, Gastrointerology etc. with some legacy products Losar, Telsar and Trika. Despite having higher proportion of chronic therapies in domestic market, slow growth in domestic Pharma over past five years was mainly due to restructuring and NLEM impact. However, as per the management, the situation is likely to change going ahead as the company has converted majority of its domestic business from distribution-driven model to C&F driven model for better working capital management. Also, It focus on restructuring the matured portfolio which accounts for 46% of the overall pie and comprises of legacy but slow moving brands started providing traction. Export business is largely driven by the US followed by Europe and Brazil. Despite being in the business for a long period, the company is yet to achieve the kind of scalability achieved by other Indian peers with similar pedigree given the infrastructure it owns i.e. 4 formulation plants (2 USFDA, UKMHRA approved) with no critical observations from USFDA and 2 USFDA approved API plants. However, US sales have started giving tractions, which increased more six fold to US$ 33 million from 12-16P mainly due to enhanced USFDA approvals and improvement in product pipeline. Emerging traction especially from the US is likely to neutralize the self-inflicted pains in the domestic formulations. Overall we expect revenues to grow at a CAGR of 16.8% in FY16P-18E to | 1821.7 crore. Exhibit 1: Revenues growth to be driven by traction from formulation exports
747.4824.0 875.5
1080.8 1133.4 1201.81334.6
1569.4
1821.7
0
200
400
600
800
1000
1200
1400
1600
1800
2000
FY10 FY11 FY12 FY13 FY14 FY15 FY16P FY17E FY18E
(| c
rore
)
Revenue
Source: Company, ICICIdirect.com Research
Domestic formulations- The company ranks 29th in the IPM with a market share of 0.91%. Domestic formulations constitute ~55% of the standalone turnover. The acute: chronic: sub-chronic ratio for the company is 37:57:6. Despite having higher proportion of chronic therapies, the core business have grown at a CAGR of just 5.2% between FY11-16P on account of 1) restructuring exercise and inventory rationalisation in FY10 / FY11 and 2) NLEM implementation and the resulting channel disturbances in FY13 / FY14. It plans to realign its portfolio to minimise the losses on account of NLEM by strengthening the MR team and pushing for more non-NLEM products. We expect domestic formulations to grow at a CAGR of 13.5% to | 957 crore between FY16P-18E. Formulation Exports They constitute 27.3% of standalone sales. As the CRAMS business (~30% of Exports formulations) struggles to get momentum, the company is looking for US generics traction to push formulation exports. It has filed 36 ANDAs with the USFDA and received approval for 20 ANDAs. We expect formulation exports to grow at CAGR of 26.4% to | 587.7 crore between FY16P-18E on the back of incremental US launches.
10.1% CAGR
16.8% CAGR

ICICI Securities Ltd | Retail Equity Research Page 4
Exhibit 3: US to provide impetus for formulation exports growth
81.8111.8
161.9
252.7 255.2312.8
368.1
475.0
587.7
0
100
200
300
400
500
600
700
FY10 FY11 FY12 FY13 FY14 FY15 FY16P FY17E FY18E
(| c
rore
)
Export Formulations
Source: Company, ICICIdirect.com Research
Exhibit 2: Domestic formulation growth likely to improve going ahead
538.5 575.8 534.3635.3 655.0 651.0
742.9839.5
957.0
0
200
400
600
800
1000
1200
FY10 FY11 FY12 FY13 FY14 FY15 FY16P FY17E FY18E
(| c
rore
)Domestic Formulations
Source: Company, ICICIdirect.com Research
Exhibit 4: API to grow at 5% CAGR in FY16P-18E es
63.670.3
98.7108.9
118.7113.1
93.4 98.0 102.9
0
20
40
60
80
100
120
140
FY10 FY11 FY12 FY13 FY14 FY15 FY16P FY17E FY18E
(| c
rore
)
APIs
Source: Company, ICICIdirect.com Research
5.2% CAGR13.5% CAGR
26.9% CAGR
26.4% CAGR

ICICI Securities Ltd | Retail Equity Research Page 5
EBITDA to grow at a CAGR of 29.1% in FY16P-18E
170.9150.1
118.3
174.3 177.8
101.3
163.9
204.0
273.222.9
18.2
13.5
16.1 15.7
8.4
12.3 13.015.0
0
50
100
150
200
250
300
FY10 FY11 FY12 FY13 FY14 FY15 FY16E FY17E FY18E(|
cro
re)
0
5
10
15
20
25
(%)
EBITDA EBITDA margins (%)
Source: Company, ICICIdirect.com Research
Exhibit 5: Adjusted net profit to grow at a CAGR of 34.1% in FY16P-18E
122.9
95.1
71.2
113.1
136.5
75.3
111.6
140.9
200.616.4
11.5
8.1
10.512.0
6.3
8.4 9.0
11.0
0
40
80
120
160
200
240
FY10 FY11 FY12 FY13 FY14 FY15 FY16E FY17E FY18E
(| c
rore
)
0
2
4
6
8
10
12
14
16
18
(%)
Adj. Net profit Adj. Net profit margins (%)
Source: Company, ICICIdirect.com Research
Exhibit 6: Trends in return ratios
15.616.7
8.7
13.4
17.9
12.6
21.8
15.4
10.811.7
16.8
24.4
18.019.0
8.5
13.8
16.2
20.4
6
12
18
24
FY10 FY11 FY12 FY13 FY14 FY15 FY16E FY17E FY18E
%
RoNW (%) RoCE (%)
Source: Company, ICICIdirect.com Research

ICICI Securities Ltd | Retail Equity Research Page 6
Exhibit 7: Trends in quarterly financials (| crore) Q1FY14 Q2FY14 Q3FY14 Q4FY14 Q1FY15 Q2FY15 Q3FY15 Q4FY15 Q1FY16 Q2FY16 Q3FY16 Q4FY16 YoY (%) QoQ (%)Net Sales 262.2 266.2 263.0 237.5 288.5 274.9 262.9 250.6 304.8 303.5 303.9 292.1 16.6 -3.9Other Operating income 3.4 3.4 1.9 6.6 2.5 3.2 3.0 5.4 4.3 2.0 2.3 9.4 72.7 302.8Revenues 265.6 269.6 264.9 244.1 291.0 278.2 265.9 256.0 309.1 305.6 306.3 301.5 17.8 -1.5Raw Material Expenses 95.96 94.20 91.07 89.82 114.66 110.32 106.24 96.58 114.69 121.15 108.37 107.81 11.6 -0.5% to revenues 36.1 34.9 34.4 36.8 39.4 39.7 40.0 37.7 37.1 39.6 35.4 35.8 -197 bps 37 bpsGross Profit 169.6 175.4 173.8 154.3 176.3 167.8 159.6 159.4 194.4 184.4 197.9 193.7 21.5 -2.1Gross Profit Margin (%) 63.9 65.1 65.6 63.2 60.6 60.3 60.0 62.3 62.9 60.4 64.6 64.2Employee Expenses 41.3 41.4 40.0 39.4 49.9 46.1 49.0 46.3 55.0 55.5 58.9 56.3 21.6 -4.5% to revenues 15.6 15.4 15.1 16.1 17.2 16.6 18.4 18.1 17.8 18.2 19.2 18.7 58 bps -58 bpsOther Expenditure 77.4 83.7 85.8 83.2 82.7 88.3 102.1 98.3 96.7 94.4 104.9 106.2 8.1 1.3% to revenues 29.2 31.1 32.4 34.1 28.4 31.7 38.4 38.4 31.3 30.9 34.2 35.2 -317 bps 99 bpsTotal Expenditure 214.7 219.4 216.8 212.4 247.3 244.8 257.4 241.2 266.4 271.1 272.2 270.3 12.1 -0.7% to revenues 80.9 81.4 81.8 87.0 85.0 88.0 96.8 94.2 86.2 88.7 88.9 89.6EBITDA 50.9 50.2 48.1 31.7 43.7 33.4 8.5 14.8 42.7 34.4 34.1 31.2 110.6 -8.5EBITDA margins ( %) 19.1 18.6 18.2 13.0 15.0 12.0 3.2 5.8 13.8 11.3 11.1 10.4 456 bps -78 bpsOther Income 7.6 7.7 3.3 24.5 5.2 5.6 5.0 5.5 6.2 6.1 4.6 5.8 5.7 26.9Interest 0.6 0.6 0.6 0.6 0.7 0.6 0.7 0.4 0.5 0.5 0.4 0.8 85.4 77.1Depreciation 10.7 11.0 10.1 10.9 8.5 10.7 10.5 8.0 8.8 8.7 8.7 8.8 10.4 1.0EO 0.0 0.0 0.0 0.0 0.0 0.0 0.0 0.0 0.0 0.0 0.0 0.0PBT 47.2 46.3 40.7 44.7 39.6 27.6 2.3 11.9 39.5 31.3 29.5 27.4 130.1 -7.0Total Tax 11.1 10.1 15.7 14.0 9.5 5.3 0.2 2.1 10.7 8.2 6.2 -0.7 -133.2 -111.3Tax rate (%) 23.5 21.8 38.5 31.4 23.8 19.3 9.1 17.7 27.1 26.2 21.0 -2.6PAT 36.1 36.2 25.0 30.6 30.2 22.3 2.1 9.8 28.8 23.1 23.3 28.1 186.7 20.7PAT Margin (%) 13.6 13.4 9.4 12.6 10.4 8.0 0.8 3.8 9.3 7.6 7.6 9.3EPS (|) 4.0 4.0 2.8 3.4 3.3 2.5 0.2 1.1 3.2 2.5 2.6 3.1 186.2 20.7
Source: Company, ICICIdirect.com Research
SWOT Analysis Strengths- Chronic focus, clean balance sheet, decent dividend payout ratio, Availability of facilities to scale up the operations. Weakness- One of the lowest MR productivity, matured domestic portfolio. US traction still in nascent state. Opportunities- The US Generics space. Threats- Increased USFDA scrutiny across the globe regarding cGMP issues and consolidation in the US pharmacy space. Increased competition in the domestic formulations space. Quarter / Concall Highlights
• Total ANDAs filing stood at 36 of which, the company has launched 14 products and awaiting approvals for 16 ANDAs. The company reported cumulative DMF filings to 46.
• CRAMS business accounts for 10% of total stand alone sales of | 1222.4 crore. YoY growth for CRAMS was flat in FY16
• The company plans 1-2 ANDA filings every quarter and 6-8 filings annually. The company plans two product launches in Q1FY17 and 1-2 launches in Q2FY17.
• The company received Establishment Inspection Report (EIR) post re-inspection of three plants in Goa, Ghaziabad and Roha.
• 6-7 new products were added in the NLEM list in FY16. Currently, 21-22% of the domestic portfolio is under NLEM, while 2-2.5% of the portfolio is under the FDCs banned by the Indian government.

ICICI Securities Ltd | Retail Equity Research Page 7
• The company’s domestic business growth was on account of 7-7.5% price increase and ~5% due to volume increase each and ~2% due to new product launches.
• The company has ~250 scientists, more than 2500 MRs and a total of ~5500 employee strength.
• The company plans | 150-200 crore of capex for FY17 and FY18, mostly for API facility in Kolhapur. Rest of the capex would be utilized for maintenance and de-bottlenecking of its existing facilities.
• The capacity utilization at the company level is 60-70%. • ~90% of the company’s formulation business is backward
integrated. • The company has launched two products in the Brazilian markets
and plans to launch two more products (approved by ENVISA) by Q2FY17.
• The company has launched more than 15 products from its Niche Generics subsidiary, UK.
• Operating margins are expected to improve 100-150 bps in FY17 on account of better product mix and sales growth.
• R&D expenses for FY16 were 4-5% of total sales. It has guided R&D spend to be ~5% of total sales going forward.
• The company guided for tax rate of ~24% for FY17 and FY18.
Exhibit 8: Facilities Location Segment Regulatory Approvals TypeGoa Formulations USFDA, MCC-SA, UKMHRA, TGA-Aus,
ANVISA-Brazil, WHO GenevTablets, Capsules
Baddi Formulations WHO (Geneva), MCC-SA, UKMHRA Tablets, Capsules, Dry Syrup, Vials
Ghaziabad Formulations USFDA, UKMHRA, ANVISA-Brazil, WHO-Geneva
Tablets, Capsules, Injectables, Liquid Syrup
Sikkim Formulations Tablets, Capsules
Roha API ISO 9001 - 2000, WHO cGMP, TGA, USFDA, ISO 14001 - 2004, ISO 18001 – 1999, EDQM
Pithampur API USFDA , EUGMP, COFEPRIS
Ireland Formulations Irish Medical Board and Kazakhstan
Source: Company, ICICIdirect.com Research
ICICI Securities Ltd | Retail Equity Research Page 8
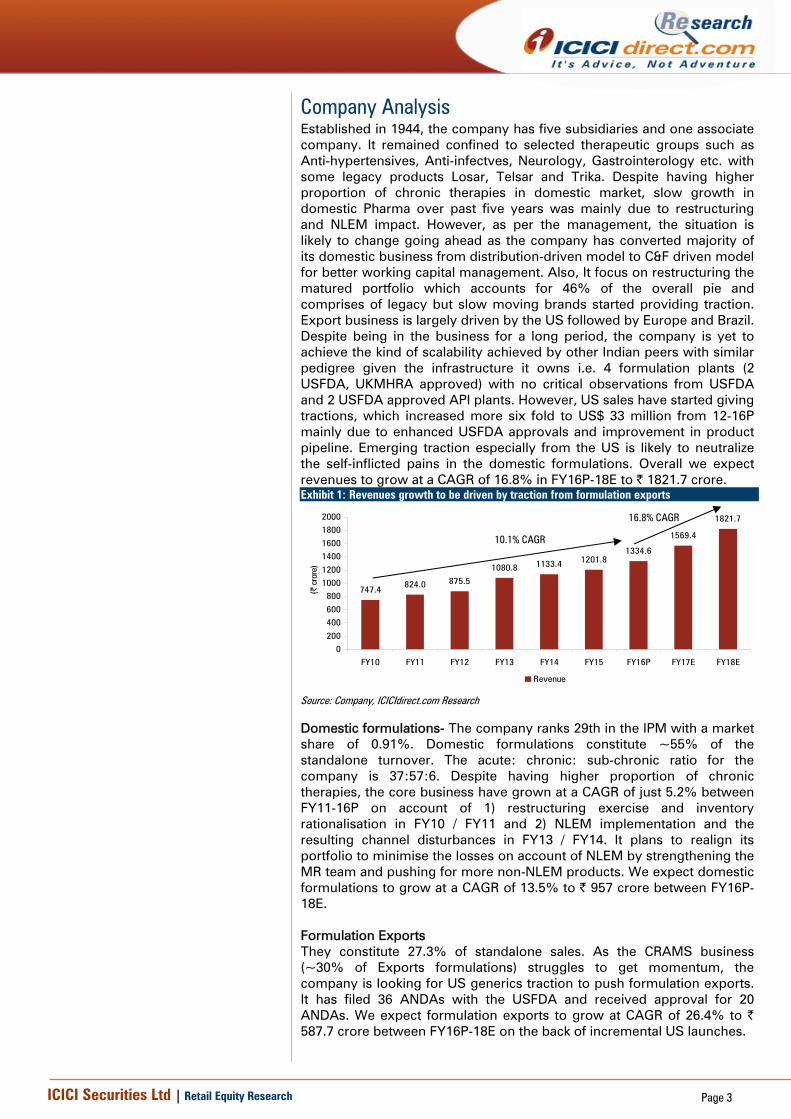
Valuation Q4 revenues were driven by strong growth in Domestic formulations (62% of total sales). Domestic formulations growth has shown sign of recovery in FY16. The management’s focus on restructuring the matured portfolio which accounts for 46% of the overall pie and which comprises of legacy but slow moving brands seems working. Despite better product mix the margin remained under pressure. Higher employee expenses and one-off pertaining to provision of subsidiary investment have dent in margins. The next task for the management is to bring the dwindling margins to the industry level. Export formulations are likely to maintain the growth tempo on the back of incremental US filings and subsequent launches. We expect revenues, EBITDA, profit to grow at a CAGR of 16.8%, 29.1% and 34.1% respectively, in FY16P-18E. We maintain our target price of | 310, based on 14x FY18E EPS of | 22.1. Exhibit 9: One year forward PE [
0
50
100
150
200
250
300
350
Mar
-06
Sep-
06
Mar
-07
Sep-
07
Mar
-08
Sep-
08
Mar
-09
Sep-
09
Mar
-10
Sep-
10
Mar
-11
Sep-
11
Mar
-12
Sep-
12
Mar
-13
Sep-
13
Mar
-14
Sep-
14
Mar
-15
Sep-
15
Mar
-16
|
Price 18.8x 6.4x 15.7x 12.6x 9.5x
Source: Company, ICICIdirect.com Research
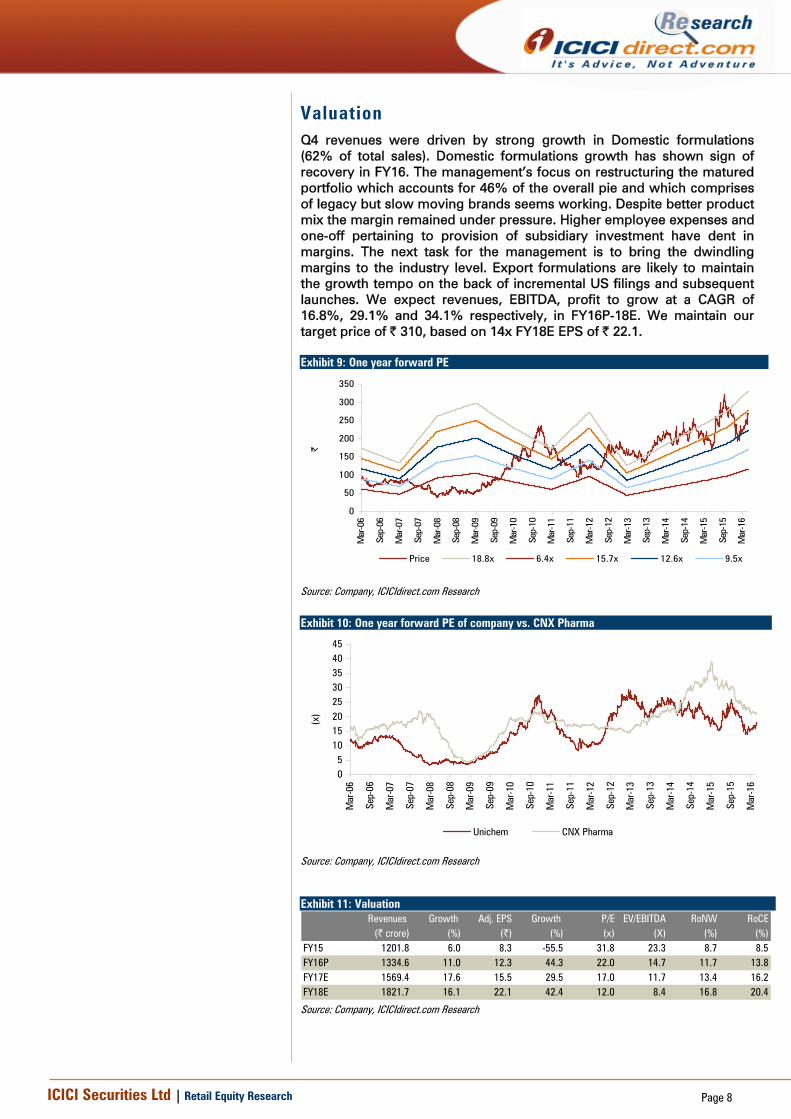
Exhibit 10: One year forward PE of company vs. CNX Pharma
05
1015202530354045
Mar
-06
Sep-
06
Mar
-07
Sep-
07
Mar
-08
Sep-
08
Mar
-09
Sep-
09
Mar
-10
Sep-
10
Mar
-11
Sep-
11
Mar
-12
Sep-
12
Mar
-13
Sep-
13
Mar
-14
Sep-
14
Mar
-15
Sep-
15
Mar
-16
(x)
Unichem CNX Pharma
Source: Company, ICICIdirect.com Research
Exhibit 11: Valuation
Revenues Growth Adj. EPS Growth P/E EV/EBITDA RoNW RoCE(| crore) (%) (|) (%) (x) (X) (%) (%)
FY15 1201.8 6.0 8.3 -55.5 31.8 23.3 8.7 8.5FY16P 1334.6 11.0 12.3 44.3 22.0 14.7 11.7 13.8FY17E 1569.4 17.6 15.5 29.5 17.0 11.7 13.4 16.2FY18E 1821.7 16.1 22.1 42.4 12.0 8.4 16.8 20.4
Source: Company, ICICIdirect.com Research
ICICI Securities Ltd | Retail Equity Research Page 9
Company snapshot
Target Price: | 310
0
50
100
150
200
250
300
350
Jan-
10
Apr-1
0
Jul-1
0
Oct-1
0
Jan-
11
Apr-1
1
Jul-1
1
Oct-1
1
Jan-
12
Apr-1
2
Jul-1
2
Oct-1
2
Jan-
13
Apr-1
3
Jul-1
3
Oct-1
3
Jan-
14
Apr-1
4
Jul-1
4
Oct-1
4
Jan-
15
Apr-1
5
Jul-1
5
Oct-1
5
Jan-
16
Apr-1
6
Jul-1
6
Oct-1
6
Jan-
17
Apr-1
7
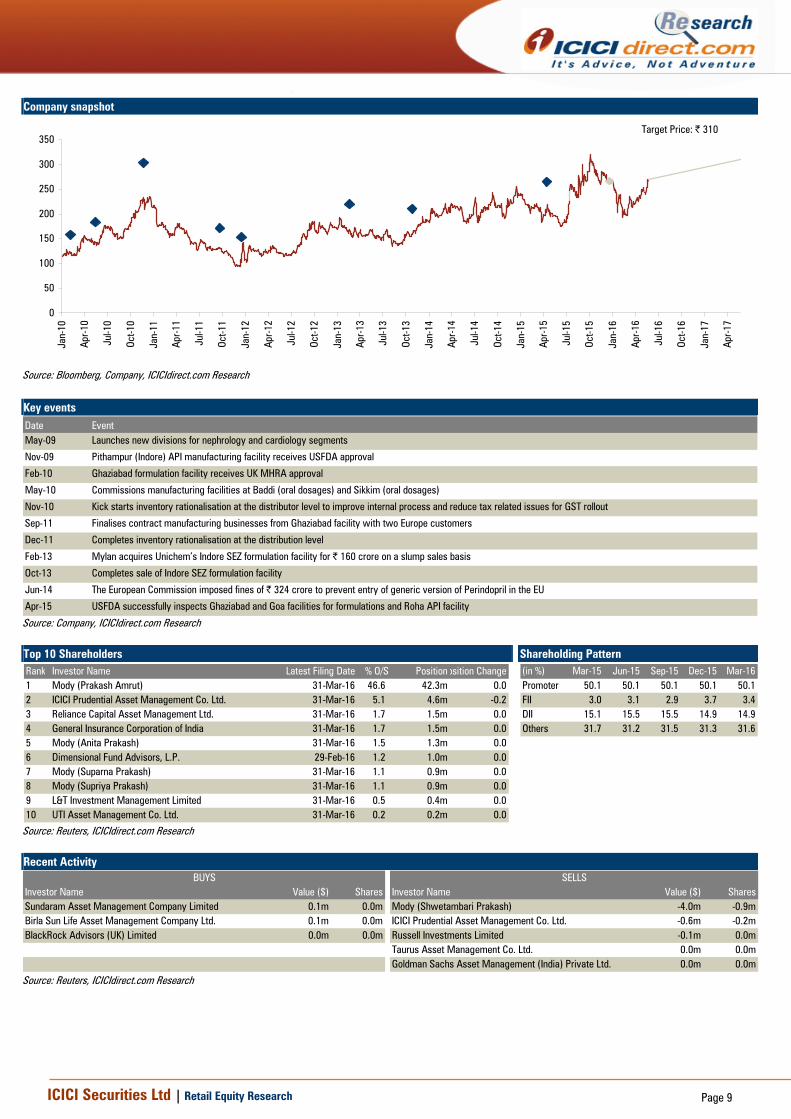
Source: Bloomberg, Company, ICICIdirect.com Research Key events Date EventMay-09 Launches new divisions for nephrology and cardiology segments
Nov-09 Pithampur (Indore) API manufacturing facility receives USFDA approval
Feb-10 Ghaziabad formulation facility receives UK MHRA approval
May-10 Commissions manufacturing facilities at Baddi (oral dosages) and Sikkim (oral dosages)
Nov-10 Kick starts inventory rationalisation at the distributor level to improve internal process and reduce tax related issues for GST rollout
Sep-11 Finalises contract manufacturing businesses from Ghaziabad facility with two Europe customers
Dec-11 Completes inventory rationalisation at the distribution level
Feb-13 Mylan acquires Unichem’s Indore SEZ formulation facility for | 160 crore on a slump sales basis
Oct-13 Completes sale of Indore SEZ formulation facility
Jun-14 The European Commission imposed fines of | 324 crore to prevent entry of generic version of Perindopril in the EU
Apr-15 USFDA successfully inspects Ghaziabad and Goa facilities for formulations and Roha API facility
Source: Company, ICICIdirect.com Research Top 10 Shareholders Shareholding Pattern Rank Investor Name Latest Filing Date % O/S Positionosition Change1 Mody (Prakash Amrut) 31-Mar-16 46.6 42.3m 0.02 ICICI Prudential Asset Management Co. Ltd. 31-Mar-16 5.1 4.6m -0.23 Reliance Capital Asset Management Ltd. 31-Mar-16 1.7 1.5m 0.04 General Insurance Corporation of India 31-Mar-16 1.7 1.5m 0.05 Mody (Anita Prakash) 31-Mar-16 1.5 1.3m 0.06 Dimensional Fund Advisors, L.P. 29-Feb-16 1.2 1.0m 0.07 Mody (Suparna Prakash) 31-Mar-16 1.1 0.9m 0.08 Mody (Supriya Prakash) 31-Mar-16 1.1 0.9m 0.09 L&T Investment Management Limited 31-Mar-16 0.5 0.4m 0.010 UTI Asset Management Co. Ltd. 31-Mar-16 0.2 0.2m 0.0
(in %) Mar-15 Jun-15 Sep-15 Dec-15 Mar-16Promoter 50.1 50.1 50.1 50.1 50.1FII 3.0 3.1 2.9 3.7 3.4DII 15.1 15.5 15.5 14.9 14.9Others 31.7 31.2 31.5 31.3 31.6
Source: Reuters, ICICIdirect.com Research Recent Activity
Investor Name Value ($) Shares Investor Name Value ($) SharesSundaram Asset Management Company Limited 0.1m 0.0m Mody (Shwetambari Prakash) -4.0m -0.9mBirla Sun Life Asset Management Company Ltd. 0.1m 0.0m ICICI Prudential Asset Management Co. Ltd. -0.6m -0.2mBlackRock Advisors (UK) Limited 0.0m 0.0m Russell Investments Limited -0.1m 0.0m
Taurus Asset Management Co. Ltd. 0.0m 0.0mGoldman Sachs Asset Management (India) Private Ltd. 0.0m 0.0m
BUYS SELLS
Source: Reuters, ICICIdirect.com Research
ICICI Securities Ltd | Retail Equity Research Page 10
.
Financial summary
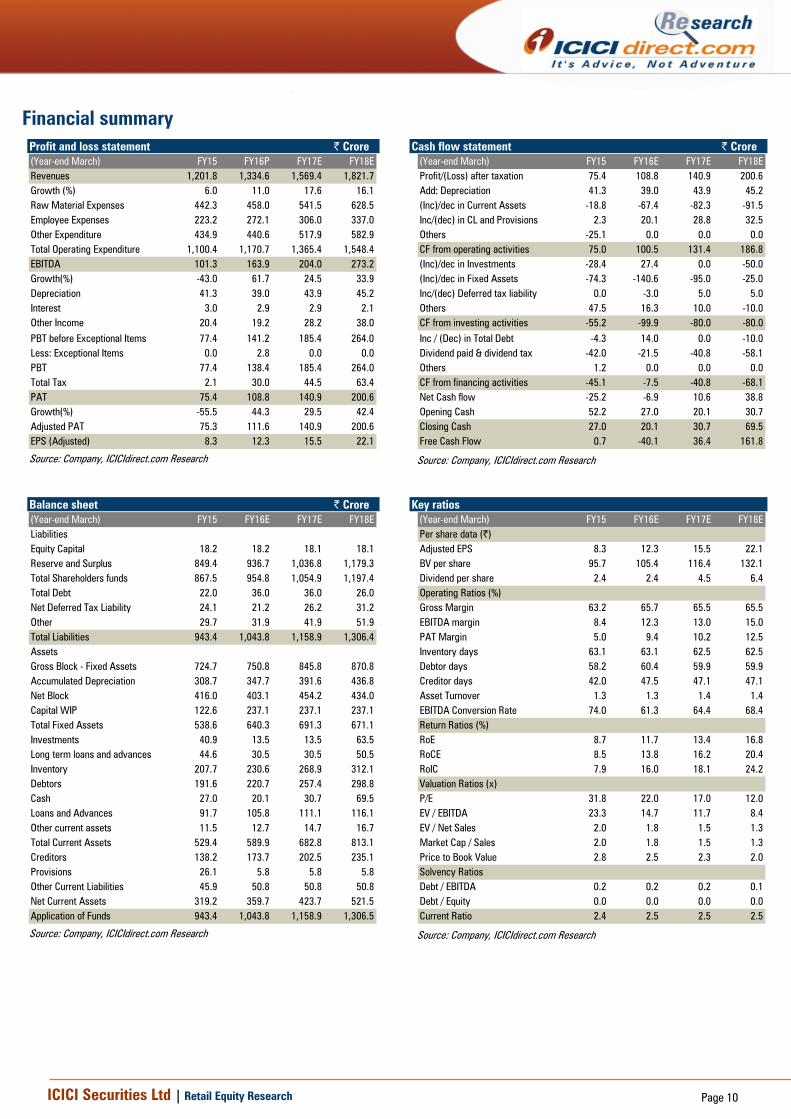
Profit and loss statement | Crore (Year-end March) FY15 FY16P FY17E FY18ERevenues 1,201.8 1,334.6 1,569.4 1,821.7Growth (%) 6.0 11.0 17.6 16.1Raw Material Expenses 442.3 458.0 541.5 628.5Employee Expenses 223.2 272.1 306.0 337.0Other Expenditure 434.9 440.6 517.9 582.9Total Operating Expenditure 1,100.4 1,170.7 1,365.4 1,548.4EBITDA 101.3 163.9 204.0 273.2Growth(%) -43.0 61.7 24.5 33.9Depreciation 41.3 39.0 43.9 45.2Interest 3.0 2.9 2.9 2.1Other Income 20.4 19.2 28.2 38.0PBT before Exceptional Items 77.4 141.2 185.4 264.0Less: Exceptional Items 0.0 2.8 0.0 0.0PBT 77.4 138.4 185.4 264.0Total Tax 2.1 30.0 44.5 63.4PAT 75.4 108.8 140.9 200.6Growth(%) -55.5 44.3 29.5 42.4Adjusted PAT 75.3 111.6 140.9 200.6EPS (Adjusted) 8.3 12.3 15.5 22.1
Source: Company, ICICIdirect.com Research
Cash flow statement | Crore (Year-end March) FY15 FY16E FY17E FY18EProfit/(Loss) after taxation 75.4 108.8 140.9 200.6Add: Depreciation 41.3 39.0 43.9 45.2(Inc)/dec in Current Assets -18.8 -67.4 -82.3 -91.5Inc/(dec) in CL and Provisions 2.3 20.1 28.8 32.5Others -25.1 0.0 0.0 0.0CF from operating activities 75.0 100.5 131.4 186.8(Inc)/dec in Investments -28.4 27.4 0.0 -50.0(Inc)/dec in Fixed Assets -74.3 -140.6 -95.0 -25.0Inc/(dec) Deferred tax liability 0.0 -3.0 5.0 5.0Others 47.5 16.3 10.0 -10.0CF from investing activities -55.2 -99.9 -80.0 -80.0Inc / (Dec) in Total Debt -4.3 14.0 0.0 -10.0Dividend paid & dividend tax -42.0 -21.5 -40.8 -58.1Others 1.2 0.0 0.0 0.0CF from financing activities -45.1 -7.5 -40.8 -68.1Net Cash flow -25.2 -6.9 10.6 38.8Opening Cash 52.2 27.0 20.1 30.7Closing Cash 27.0 20.1 30.7 69.5Free Cash Flow 0.7 -40.1 36.4 161.8
Source: Company, ICICIdirect.com Research
Balance sheet | Crore (Year-end March) FY15 FY16E FY17E FY18ELiabilitiesEquity Capital 18.2 18.2 18.1 18.1Reserve and Surplus 849.4 936.7 1,036.8 1,179.3Total Shareholders funds 867.5 954.8 1,054.9 1,197.4Total Debt 22.0 36.0 36.0 26.0Net Deferred Tax Liability 24.1 21.2 26.2 31.2Other 29.7 31.9 41.9 51.9Total Liabilities 943.4 1,043.8 1,158.9 1,306.4AssetsGross Block - Fixed Assets 724.7 750.8 845.8 870.8Accumulated Depreciation 308.7 347.7 391.6 436.8Net Block 416.0 403.1 454.2 434.0Capital WIP 122.6 237.1 237.1 237.1Total Fixed Assets 538.6 640.3 691.3 671.1Investments 40.9 13.5 13.5 63.5Long term loans and advances 44.6 30.5 30.5 50.5Inventory 207.7 230.6 268.9 312.1Debtors 191.6 220.7 257.4 298.8Cash 27.0 20.1 30.7 69.5Loans and Advances 91.7 105.8 111.1 116.1Other current assets 11.5 12.7 14.7 16.7Total Current Assets 529.4 589.9 682.8 813.1Creditors 138.2 173.7 202.5 235.1Provisions 26.1 5.8 5.8 5.8Other Current Liabilities 45.9 50.8 50.8 50.8Net Current Assets 319.2 359.7 423.7 521.5Application of Funds 943.4 1,043.8 1,158.9 1,306.5
Source: Company, ICICIdirect.com Research
Key ratios (Year-end March) FY15 FY16E FY17E FY18EPer share data (|)Adjusted EPS 8.3 12.3 15.5 22.1BV per share 95.7 105.4 116.4 132.1Dividend per share 2.4 2.4 4.5 6.4Operating Ratios (%)Gross Margin 63.2 65.7 65.5 65.5EBITDA margin 8.4 12.3 13.0 15.0PAT Margin 5.0 9.4 10.2 12.5Inventory days 63.1 63.1 62.5 62.5Debtor days 58.2 60.4 59.9 59.9Creditor days 42.0 47.5 47.1 47.1Asset Turnover 1.3 1.3 1.4 1.4EBITDA Conversion Rate 74.0 61.3 64.4 68.4Return Ratios (%)RoE 8.7 11.7 13.4 16.8RoCE 8.5 13.8 16.2 20.4RoIC 7.9 16.0 18.1 24.2Valuation Ratios (x)P/E 31.8 22.0 17.0 12.0EV / EBITDA 23.3 14.7 11.7 8.4EV / Net Sales 2.0 1.8 1.5 1.3Market Cap / Sales 2.0 1.8 1.5 1.3Price to Book Value 2.8 2.5 2.3 2.0Solvency RatiosDebt / EBITDA 0.2 0.2 0.2 0.1Debt / Equity 0.0 0.0 0.0 0.0Current Ratio 2.4 2.5 2.5 2.5
Source: Company, ICICIdirect.com Research

ICICI Securities Ltd | Retail Equity Research Page 11
ICICIdirect.com coverage universe (Healthcare) Company I-Direct CMP TP Rating M Cap
Code (|) (|) (| Cr) FY15 FY16E FY17E FY15 FY16E FY17E FY15 FY16E FY17E FY15 FY16E FY17E FY15 FY16E FY
Ajanta Pharma AJAPHA 1569 1,780 Buy 13811.1 36.0 45.7 52.4 43.6 34.4 30.0 26.8 23.3 19.9 50.3 43.7 37.9 37.8 34.4 3
Apollo Hospitals APOHOS 1329 1,420 Hold 18491.1 23.7 27.6 34.6 56.0 48.2 38.4 27.6 23.9 18.9 9.9 11.2 13.0 10.4 11.1 1
Aurobindo Pharma AURPHA 770.4 990 Buy 45081.5 28.1 33.9 37.7 27.4 22.7 20.4 30.7 25.1 22.0 23.4 24.7 25.0 31.7 28.7 2
Alembic Pharma ALEMPHA 564 620 Hold 10638.0 15.1 38.2 19.6 37.4 14.8 28.8 32.2 12.6 23.9 30.7 58.0 24.8 32.1 51.5 2
Biocon BIOCON 621.9 560 Hold 12438.0 20.4 22.1 28.3 30.5 28.2 22.0 8.3 7.6 6.4 10.4 9.1 10.9 12.5 10.9 1
Cadila Healthcare CADHEA 321 390 Buy 32862.1 11.2 15.0 15.5 28.7 21.5 20.7 20.3 14.5 14.4 20.7 27.9 24.6 27.0 28.6 2Cipla CIPLA 507.3 690 Buy 40755.3 14.7 21.5 25.7 34.5 23.6 19.7 19.4 15.6 13.1 13.8 14.8 16.5 10.9 14.1 1
Divi's Laboratories DIVLAB 1045 1,320 Buy 27745.5 32.1 40.2 46.7 32.6 26.0 22.4 22.3 18.7 15.9 29.4 31.3 31.1 24.4 25.6 2
Dr Reddy's Labs DRREDD 2974 3,480 Buy 51779.4 129.0 142.1 139.2 23.0 20.9 21.4 14.4 12.6 12.3 16.7 15.1 15.1 22.3 18.9 1
Glenmark Pharma GLEPHA 858 1,000 Buy 24307.2 23.1 32.2 41.4 37.1 26.7 20.7 22.2 16.8 13.8 13.3 16.2 18.8 21.7 21.2 2
Indoco Remedies INDREM 258.4 390 Buy 2381.2 9.0 9.3 15.6 28.8 27.9 16.6 15.9 14.8 10.7 16.4 15.4 22.2 16.0 14.7 2
Ipca Laboratories IPCLAB 450 515 Hold 5677.1 19.9 12.1 24.7 22.6 37.2 18.2 13.5 18.2 12.2 11.5 6.7 11.7 11.4 6.6 1
Jubilant Life Sciences VAMORG 371.5 375 Hold 5917.2 -0.6 31.0 43.0 NA 12.0 8.6 15.9 8.1 6.5 5.8 13.4 15.8 NA 17.1 1
Lupin LUPIN 1505 1,850 Buy 67836.6 53.6 50.4 66.0 28.1 29.9 22.8 18.3 19.8 13.8 35.1 18.6 22.5 27.1 20.7 2
Natco Pharma NATPHA 452.7 630 Buy 7884.0 8.3 7.5 11.6 54.5 60.7 38.9 35.3 29.3 21.6 15.4 13.0 16.5 17.9 10.0 1
Sun Pharma SUNPHA 792 845 Hold 190627.0 19.8 23.6 28.4 40.0 33.6 27.9 24.1 21.2 17.7 18.8 20.0 21.1 18.6 18.8 1
Syngene International SYNINT 399 445 Buy 7971.0 8.8 11.1 15.6 43.3 34.2 24.3 26.6 20.9 17.0 19.5 13.3 16.7 20.7 21.2 2
Torrent Pharma TORPHA 1323 1,650 Buy 22394.6 44.4 115.3 67.1 29.8 11.5 19.7 25.6 8.8 14.1 20.1 43.7 24.4 30.2 50.3 2
Unichem Laboratories UNILAB 264.5 310 Buy 2402.4 8.3 12.3 15.5 31.8 21.5 17.0 23.3 14.7 11.7 8.5 13.8 16.2 8.7 11.7 1
RoE (%)EPS (|) PE(x) EV/EBITDA (x) RoCE (%)
Source: Company, ICICIdirect.com Research
ICICI Securities Ltd | Retail Equity Research Page 12
RATING RATIONALE ICICIdirect.com endeavours to provide objective opinions and recommendations. ICICIdirect.com assigns ratings to its stocks according to their notional target price vs. current market price and then categorises them as Strong Buy, Buy, Hold and Sell. The performance horizon is two years unless specified and the notional target price is defined as the analysts' valuation for a stock. Strong Buy: >15%/20% for large caps/midcaps, respectively, with high conviction; Buy: >10%/15% for large caps/midcaps, respectively; Hold: Up to +/-10%; Sell: -10% or more;
Pankaj Pandey Head – Research [email protected]
ICICIdirect.com Research Desk, ICICI Securities Limited, 1st Floor, Akruti Trade Centre, Road No 7, MIDC, Andheri (East) Mumbai – 400 093
ICICI Securities Ltd | Retail Equity Research Page 13
ANALYST CERTIFICATION We /I, Siddhant Khandekar, CA INTER and Mitesh Shah, MS (finance), Nandan Kamat MBA Research Analysts, authors and the names subscribed to this report, hereby certify that all of the views expressed in this research report accurately reflect our views about the subject issuer(s) or securities. We also certify that no part of our compensation was, is, or will be directly or indirectly related to the specific recommendation(s) or view(s) in this report.
Terms & conditions and other disclosures: ICICI Securities Limited is a Sebi registered Research Analyst having registration no. INH000000990. ICICI Securities Limited (ICICI Securities) is full-service, integrated investment banking and is, inter alia, engaged in the business of stock brokering and distribution of financial products. ICICI Securities is a wholly-owned subsidiary of ICICI Bank which is India’s largest private sector bank and has its various subsidiaries engaged in businesses of housing finance, asset management, life insurance, general insurance, venture capital fund management, etc. (“associates”), the details in respect of which are available on www.icicibank.com. ICICI Securities is one of the leading merchant bankers/ underwriters of securities and participate in virtually all securities trading markets in India. We and our associates might have investment banking and other business relationship with a significant percentage of companies covered by our Investment Research Department. ICICI Securities generally prohibits its analysts, persons reporting to analysts and their relatives from maintaining a financial interest in the securities or derivatives of any companies that the analysts cover. The information and opinions in this report have been prepared by ICICI Securities and are subject to change without any notice. The report and information contained herein is strictly confidential and meant solely for the selected recipient and may not be altered in any way, transmitted to, copied or distributed, in part or in whole, to any other person or to the media or reproduced in any form, without prior written consent of ICICI Securities. While we would endeavour to update the information herein on a reasonable basis, ICICI Securitiesis is under no obligation to update or keep the information current. Also, there may be regulatory, compliance or other reasons that may prevent ICICI Securities from doing so. Non-rated securities indicate that rating on a particular security has been suspended temporarily and such suspension is in compliance with applicable regulations and/or ICICI Securities policies, in circumstances where ICICI Securities might be acting in an advisory capacity to this company, or in certain other circumstances. This report is based on information obtained from public sources and sources believed to be reliable, but no independent verification has been made nor is its accuracy or completeness guaranteed. This report and information herein is solely for informational purpose and shall not be used or considered as an offer document or solicitation of offer to buy or sell or subscribe for securities or other financial instruments. Though disseminated to all the customers simultaneously, not all customers may receive this report at the same time. ICICI Securities will not treat recipients as customers by virtue of their receiving this report. Nothing in this report constitutes investment, legal, accounting and tax advice or a representation that any investment or strategy is suitable or appropriate to your specific circumstances. The securities discussed and opinions expressed in this report may not be suitable for all investors, who must make their own investment decisions, based on their own investment objectives, financial positions and needs of specific recipient. This may not be taken in substitution for the exercise of independent judgment by any recipient. The recipient should independently evaluate the investment risks. The value and return on investment may vary because of changes in interest rates, foreign exchange rates or any other reason. ICICI Securities accepts no liabilities whatsoever for any loss or damage of any kind arising out of the use of this report. Past performance is not necessarily a guide to future performance. Investors are advised to see Risk Disclosure Document to understand the risks associated before investing in the securities markets. Actual results may differ materially from those set forth in projections. Forward-looking statements are not predictions and may be subject to change without notice. ICICI Securities or its associates might have managed or co-managed public offering of securities for the subject company or might have been mandated by the subject company for any other assignment in the past twelve months. ICICI Securities or its associates might have received any compensation from the companies mentioned in the report during the period preceding twelve months from the date of this report for services in respect of managing or co-managing public offerings, corporate finance, investment banking or merchant banking, brokerage services or other advisory service in a merger or specific transaction. ICICI Securities or its associates might have received any compensation for products or services other than investment banking or merchant banking or brokerage services from the companies mentioned in the report in the past twelve months. ICICI Securities encourages independence in research report preparation and strives to minimize conflict in preparation of research report. ICICI Securities or its analysts did not receive any compensation or other benefits from the companies mentioned in the report or third party in connection with preparation of the research report. Accordingly, neither ICICI Securities nor Research Analysts have any material conflict of interest at the time of publication of this report. It is confirmed that Siddhant Khandekar, CA INTER and Mitesh Shah, MS (finance), Nandan Kamat MBA, Research Analysts of this report have not received any compensation from the companies mentioned in the report in the preceding twelve months. Compensation of our Research Analysts is not based on any specific merchant banking, investment banking or brokerage service transactions. ICICI Securities or its subsidiaries collectively or Research Analysts do not own 1% or more of the equity securities of the Company mentioned in the report as of the last day of the month preceding the publication of the research report. Since associates of ICICI Securities are engaged in various financial service businesses, they might have financial interests or beneficial ownership in various companies including the subject company/companies mentioned in this report. It is confirmed that Siddhant Khandekar, CA INTER and Mitesh Shah, MS (finance), Nandan Kamat MBA, Research Analysts do not serve as an officer, director or employee of the companies mentioned in the report. ICICI Securities may have issued other reports that are inconsistent with and reach different conclusion from the information presented in this report. Neither the Research Analysts nor ICICI Securities have been engaged in market making activity for the companies mentioned in the report. We submit that no material disciplinary action has been taken on ICICI Securities by any Regulatory Authority impacting Equity Research Analysis activities. This report is not directed or intended for distribution to, or use by, any person or entity who is a citizen or resident of or located in any locality, state, country or other jurisdiction, where such distribution, publication, availability or use would be contrary to law, regulation or which would subject ICICI Securities and affiliates to any registration or licensing requirement within such jurisdiction. The securities described herein may or may not be eligible for sale in all jurisdictions or to certain category of investors. Persons in whose possession this document may come are required to inform themselves of and to observe such restriction.