Embed Size (px)
Citation preview
Asia Pacific Equity Research 21 August 2010
Uni President Enterprises Corp Initiation
Neutral 1216.TW, 1216 TT
No pain, no gain
Price: NT$37.30
Price Target: NT$42.00
Taiwan Food & Food Manufacture
Caren HuangAC
(886-2) 2725-9872 [email protected]
J.P. Morgan Securities (Taiwan) Limited.
Ebru Sener Kurumlu (852) 2800-8521 [email protected]
J.P. Morgan Securities (Asia Pacific) Limited
30
34
38
NT$
Aug-09 Nov-09 Feb-10 May-10 Aug-10
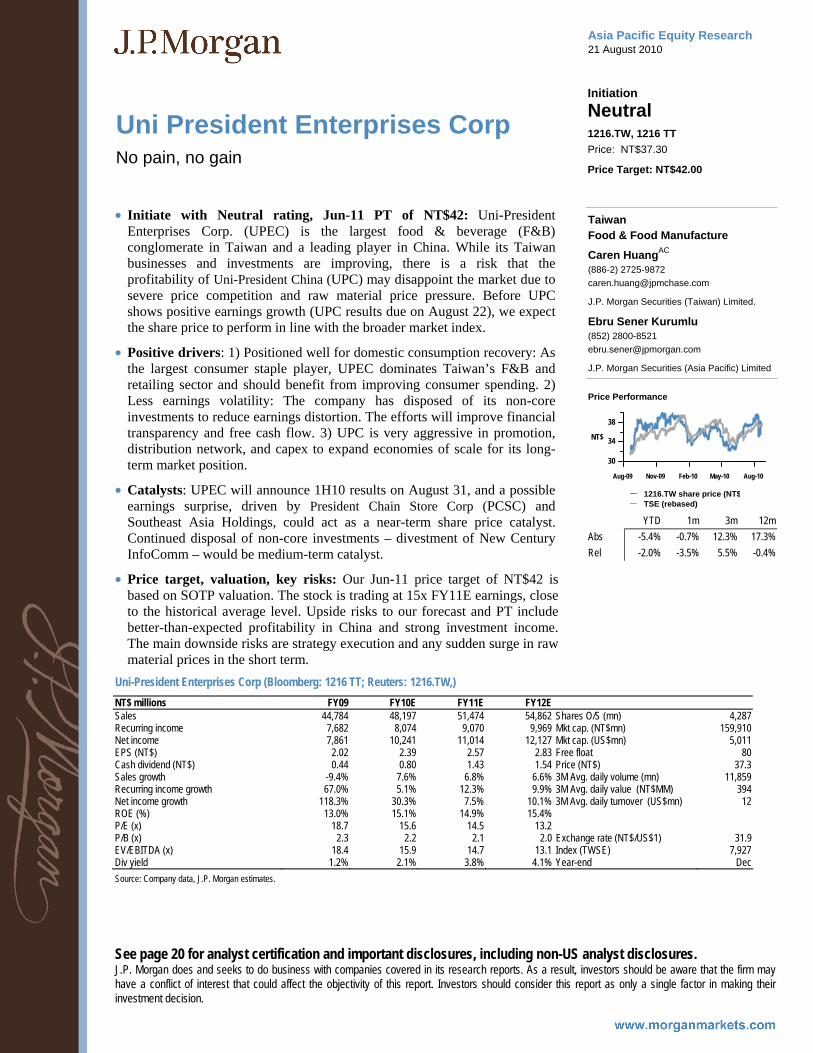
Price Performance
1216.TW share price (NT$TSE (rebased)
YTD 1m 3m 12mAbs -5.4% -0.7% 12.3% 17.3%Rel -2.0% -3.5% 5.5% -0.4%
See page 20 for analyst certification and important disclosures, including non-US analyst disclosures. J.P. Morgan does and seeks to do business with companies covered in its research reports. As a result, investors should be aware that the firm may have a conflict of interest that could affect the objectivity of this report. Investors should consider this report as only a single factor in making their investment decision.
• Initiate with Neutral rating, Jun-11 PT of NT$42: Uni-President Enterprises Corp. (UPEC) is the largest food & beverage (F&B) conglomerate in Taiwan and a leading player in China. While its Taiwan businesses and investments are improving, there is a risk that the profitability of Uni-President China (UPC) may disappoint the market due to severe price competition and raw material price pressure. Before UPC shows positive earnings growth (UPC results due on August 22), we expect the share price to perform in line with the broader market index.
• Positive drivers: 1) Positioned well for domestic consumption recovery: As the largest consumer staple player, UPEC dominates Taiwan’s F&B and retailing sector and should benefit from improving consumer spending. 2) Less earnings volatility: The company has disposed of its non-core investments to reduce earnings distortion. The efforts will improve financial transparency and free cash flow. 3) UPC is very aggressive in promotion, distribution network, and capex to expand economies of scale for its long-term market position.
• Catalysts: UPEC will announce 1H10 results on August 31, and a possible earnings surprise, driven by President Chain Store Corp (PCSC) and Southeast Asia Holdings, could act as a near-term share price catalyst. Continued disposal of non-core investments – divestment of New Century InfoComm – would be medium-term catalyst.
• Price target, valuation, key risks: Our Jun-11 price target of NT$42 is based on SOTP valuation. The stock is trading at 15x FY11E earnings, close to the historical average level. Upside risks to our forecast and PT include better-than-expected profitability in China and strong investment income. The main downside risks are strategy execution and any sudden surge in raw material prices in the short term.
Uni-President Enterprises Corp (Bloomberg: 1216 TT; Reuters: 1216.TW,) NT$ millions FY09 FY10E FY11E FY12E Sales 44,784 48,197 51,474 54,862 Shares O/S (mn) 4,287Recurring income 7,682 8,074 9,070 9,969 Mkt cap. (NT$mn) 159,910Net income 7,861 10,241 11,014 12,127 Mkt cap. (US$mn) 5,011EPS (NT$) 2.02 2.39 2.57 2.83 Free float 80Cash dividend (NT$) 0.44 0.80 1.43 1.54 Price (NT$) 37.3Sales growth -9.4% 7.6% 6.8% 6.6% 3M Avg. daily volume (mn) 11,859Recurring income growth 67.0% 5.1% 12.3% 9.9% 3M Avg. daily value (NT$MM) 394Net income growth 118.3% 30.3% 7.5% 10.1% 3M Avg. daily turnover (US$mn) 12ROE (%) 13.0% 15.1% 14.9% 15.4% P/E (x) 18.7 15.6 14.5 13.2 P/B (x) 2.3 2.2 2.1 2.0 Exchange rate (NT$/US$1) 31.9EV/EBITDA (x) 18.4 15.9 14.7 13.1 Index (TWSE) 7,927Div yield 1.2% 2.1% 3.8% 4.1% Year-end DecSource: Company data, J.P. Morgan estimates.
2
Asia Pacific Equity Research 21 August 2010
Caren Huang (886-2) 2725-9872 [email protected]
Company Description P&L sensitivity metrics
EBITDA Impact (%)
Net income Impact (%)
Revenue growth Impact of each 10% increase 2.0 1.7 Operating expenses Impact of each 10% increase -7.9 -8.6 Investment income Impact of each 10% increase 7.2 6.6 Source: J.P. Morgan estimates.
Price target and valuation analysis
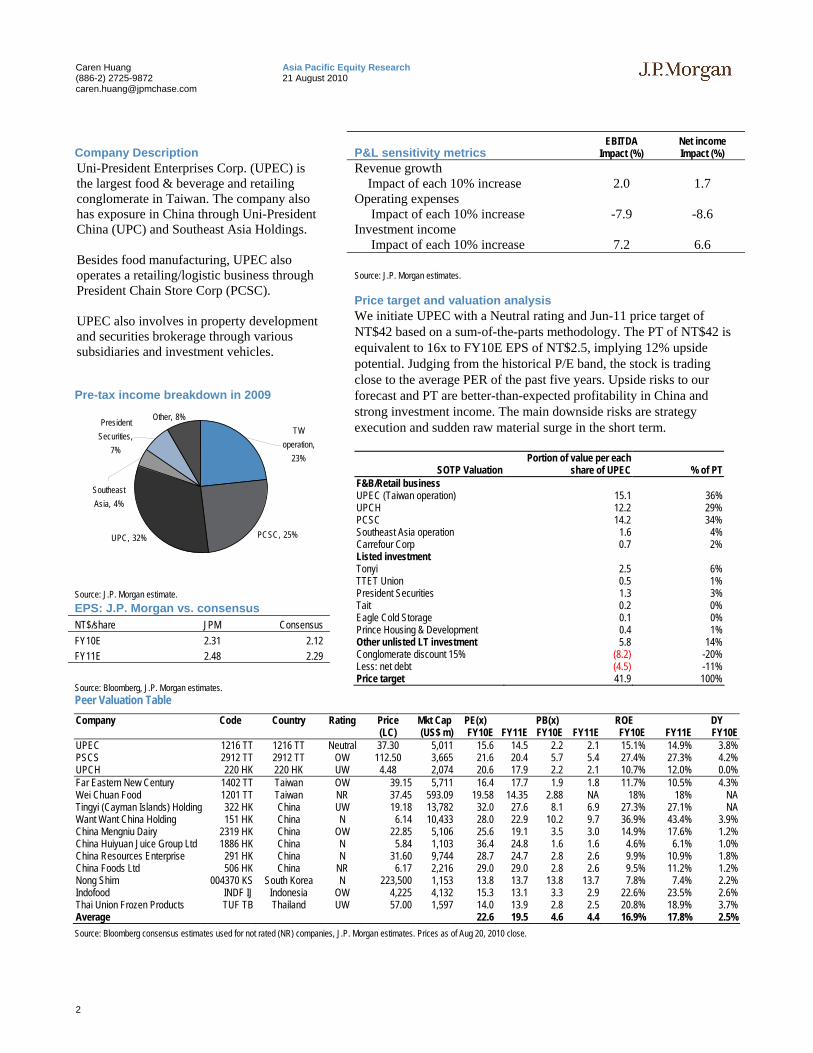
Uni-President Enterprises Corp. (UPEC) is the largest food & beverage and retailing conglomerate in Taiwan. The company also has exposure in China through Uni-President China (UPC) and Southeast Asia Holdings. Besides food manufacturing, UPEC also operates a retailing/logistic business through President Chain Store Corp (PCSC). UPEC also involves in property development and securities brokerage through various subsidiaries and investment vehicles.
Pre-tax income breakdown in 2009
PCSC, 25%UPC, 32%
PresidentSecurities,
7%
Other, 8%TW
operation,23%
SoutheastAsia, 4%
Source: J.P. Morgan estimate. EPS: J.P. Morgan vs. consensus NT$/share JPM Consensus FY10E 2.31 2.12 FY11E 2.48 2.29
Source: Bloomberg, J.P. Morgan estimates.
We initiate UPEC with a Neutral rating and Jun-11 price target of NT$42 based on a sum-of-the-parts methodology. The PT of NT$42 is equivalent to 16x to FY10E EPS of NT$2.5, implying 12% upside potential. Judging from the historical P/E band, the stock is trading close to the average PER of the past five years. Upside risks to our forecast and PT are better-than-expected profitability in China and strong investment income. The main downside risks are strategy execution and sudden raw material surge in the short term.
SOTP Valuation Portion of value per each
share of UPEC % of PTF&B/Retail business UPEC (Taiwan operation) 15.1 36%UPCH 12.2 29%PCSC 14.2 34%Southeast Asia operation 1.6 4%Carrefour Corp 0.7 2%Listed investment Tonyi 2.5 6%TTET Union 0.5 1%President Securities 1.3 3%Tait 0.2 0%Eagle Cold Storage 0.1 0%Prince Housing & Development 0.4 1%Other unlisted LT investment 5.8 14%Conglomerate discount 15% (8.2) -20%Less: net debt (4.5) -11%Price target 41.9 100%
Peer Valuation Table Company Code Country Rating Price Mkt Cap PE(x) PB(x) ROE DY (LC) (US$ m) FY10E FY11E FY10E FY11E FY10E FY11E FY10EUPEC 1216 TT 1216 TT Neutral 37.30 5,011 15.6 14.5 2.2 2.1 15.1% 14.9% 3.8%PSCS 2912 TT 2912 TT OW 112.50 3,665 21.6 20.4 5.7 5.4 27.4% 27.3% 4.2%UPCH 220 HK 220 HK UW 4.48 2,074 20.6 17.9 2.2 2.1 10.7% 12.0% 0.0%Far Eastern New Century 1402 TT Taiwan OW 39.15 5,711 16.4 17.7 1.9 1.8 11.7% 10.5% 4.3%Wei Chuan Food 1201 TT Taiwan NR 37.45 593.09 19.58 14.35 2.88 NA 18% 18% NATingyi (Cayman Islands) Holding 322 HK China UW 19.18 13,782 32.0 27.6 8.1 6.9 27.3% 27.1% NAWant Want China Holding 151 HK China N 6.14 10,433 28.0 22.9 10.2 9.7 36.9% 43.4% 3.9%China Mengniu Dairy 2319 HK China OW 22.85 5,106 25.6 19.1 3.5 3.0 14.9% 17.6% 1.2%China Huiyuan Juice Group Ltd 1886 HK China N 5.84 1,103 36.4 24.8 1.6 1.6 4.6% 6.1% 1.0%China Resources Enterprise 291 HK China N 31.60 9,744 28.7 24.7 2.8 2.6 9.9% 10.9% 1.8%China Foods Ltd 506 HK China NR 6.17 2,216 29.0 29.0 2.8 2.6 9.5% 11.2% 1.2%Nong Shim 004370 KS South Korea N 223,500 1,153 13.8 13.7 13.8 13.7 7.8% 7.4% 2.2%Indofood INDF IJ Indonesia OW 4,225 4,132 15.3 13.1 3.3 2.9 22.6% 23.5% 2.6%Thai Union Frozen Products TUF TB Thailand UW 57.00 1,597 14.0 13.9 2.8 2.5 20.8% 18.9% 3.7%Average 22.6 19.5 4.6 4.4 16.9% 17.8% 2.5%Source: Bloomberg consensus estimates used for not rated (NR) companies, J.P. Morgan estimates. Prices as of Aug 20, 2010 close.
3
Asia Pacific Equity Research 21 August 2010
Caren Huang (886-2) 2725-9872 [email protected]
Investment Positives Domestic consumption recovery drives strong investment income We believe Taiwan’s domestic consumption will continue to expand, given the intensifying cross-Strait activity on the back of: 1) normalized recovery of the global economy; and 2) the signing of the Economic Cooperation Framework Agreement (ECFA) between Taiwan and China. The sequential growth of consumer confidence and employment evidently confirmed recovery of domestic demand. (For more details, please see “Taiwan’s recovery broadens with closer cross strait links”, GDW, July 2)
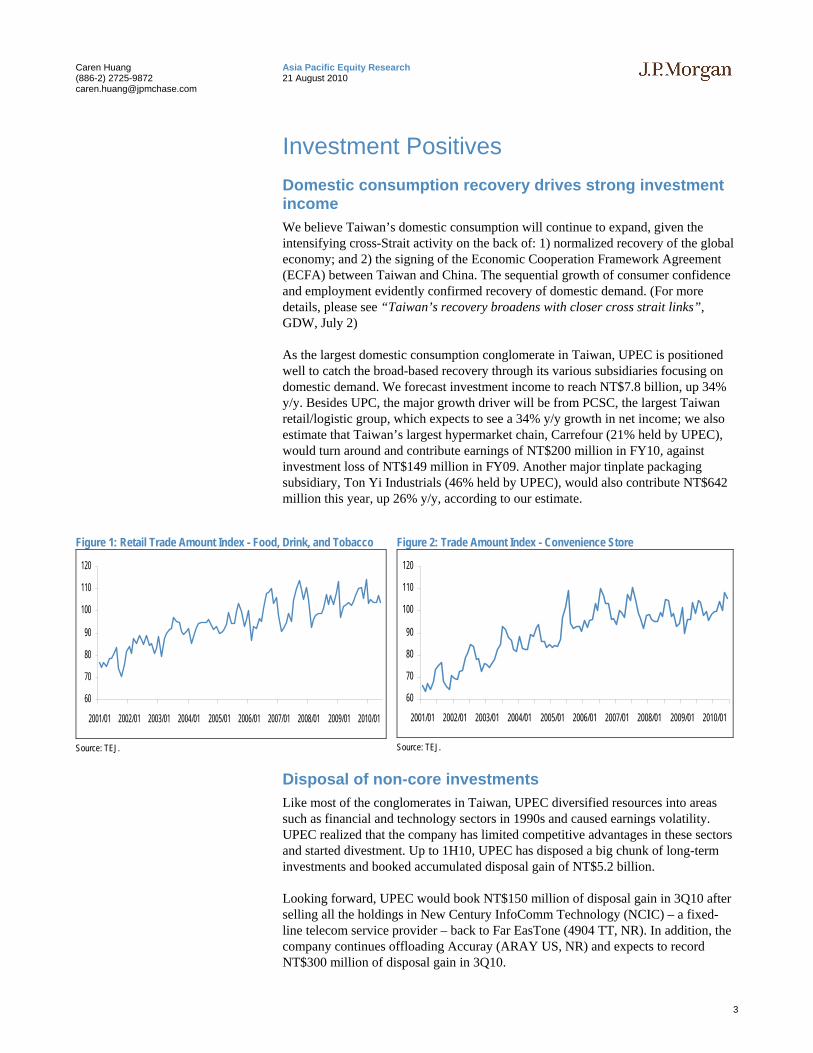
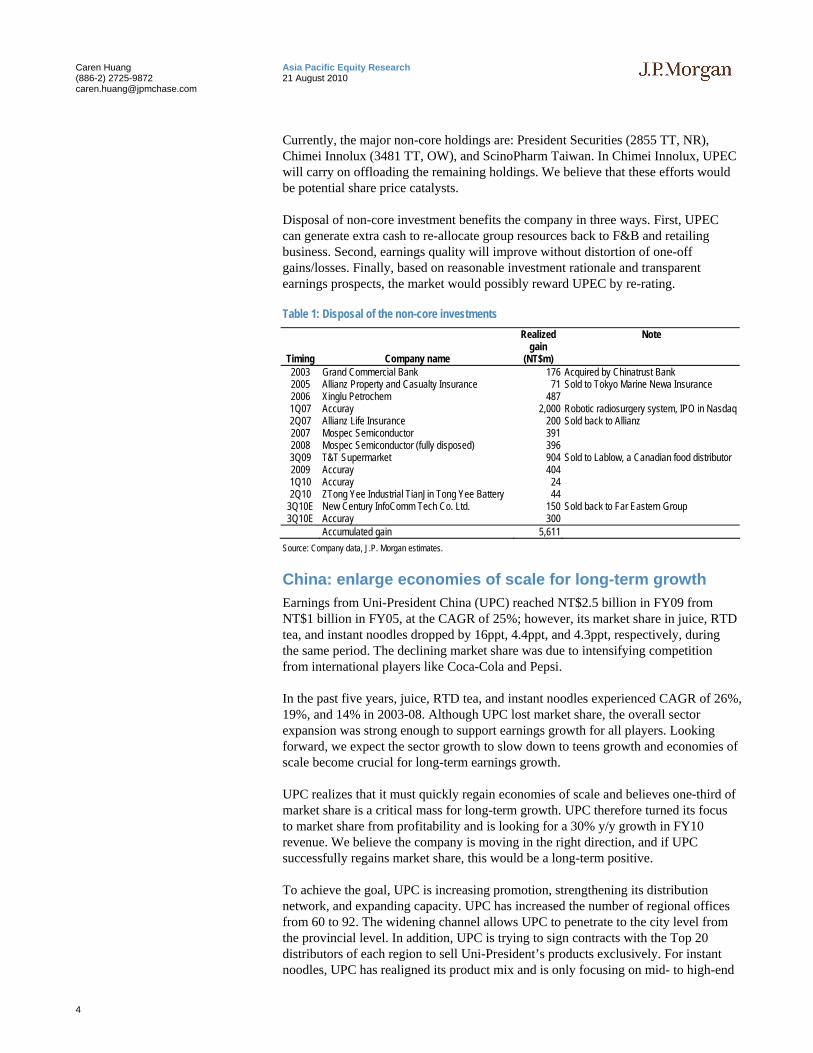
As the largest domestic consumption conglomerate in Taiwan, UPEC is positioned well to catch the broad-based recovery through its various subsidiaries focusing on domestic demand. We forecast investment income to reach NT$7.8 billion, up 34% y/y. Besides UPC, the major growth driver will be from PCSC, the largest Taiwan retail/logistic group, which expects to see a 34% y/y growth in net income; we also estimate that Taiwan’s largest hypermarket chain, Carrefour (21% held by UPEC), would turn around and contribute earnings of NT$200 million in FY10, against investment loss of NT$149 million in FY09. Another major tinplate packaging subsidiary, Ton Yi Industrials (46% held by UPEC), would also contribute NT$642 million this year, up 26% y/y, according to our estimate.
Figure 1: Retail Trade Amount Index - Food, Drink, and Tobacco
60
70
80
90
100
110
120
2001/01 2002/01 2003/01 2004/01 2005/01 2006/01 2007/01 2008/01 2009/01 2010/01
Source: TEJ.
Figure 2: Trade Amount Index - Convenience Store
60
70
80
90
100
110
120
2001/01 2002/01 2003/01 2004/01 2005/01 2006/01 2007/01 2008/01 2009/01 2010/01
Source: TEJ.
Disposal of non-core investments Like most of the conglomerates in Taiwan, UPEC diversified resources into areas such as financial and technology sectors in 1990s and caused earnings volatility. UPEC realized that the company has limited competitive advantages in these sectors and started divestment. Up to 1H10, UPEC has disposed a big chunk of long-term investments and booked accumulated disposal gain of NT$5.2 billion.
Looking forward, UPEC would book NT$150 million of disposal gain in 3Q10 after selling all the holdings in New Century InfoComm Technology (NCIC) – a fixed-line telecom service provider – back to Far EasTone (4904 TT, NR). In addition, the company continues offloading Accuray (ARAY US, NR) and expects to record NT$300 million of disposal gain in 3Q10.
4
Asia Pacific Equity Research 21 August 2010
Caren Huang (886-2) 2725-9872 [email protected]
Currently, the major non-core holdings are: President Securities (2855 TT, NR), Chimei Innolux (3481 TT, OW), and ScinoPharm Taiwan. In Chimei Innolux, UPEC will carry on offloading the remaining holdings. We believe that these efforts would be potential share price catalysts.
Disposal of non-core investment benefits the company in three ways. First, UPEC can generate extra cash to re-allocate group resources back to F&B and retailing business. Second, earnings quality will improve without distortion of one-off gains/losses. Finally, based on reasonable investment rationale and transparent earnings prospects, the market would possibly reward UPEC by re-rating.
Table 1: Disposal of the non-core investments
Timing Company name
Realized gain
(NT$m)
Note
2003 Grand Commercial Bank 176 Acquired by Chinatrust Bank 2005 Allianz Property and Casualty Insurance 71 Sold to Tokyo Marine Newa Insurance 2006 Xinglu Petrochem 487 1Q07 Accuray 2,000 Robotic radiosurgery system, IPO in Nasdaq2Q07 Allianz Life Insurance 200 Sold back to Allianz 2007 Mospec Semiconductor 391 2008 Mospec Semiconductor (fully disposed) 396 3Q09 T&T Supermarket 904 Sold to Lablow, a Canadian food distributor 2009 Accuray 404 1Q10 Accuray 24 2Q10 ZTong Yee Industrial TianJin Tong Yee Battery 44
3Q10E New Century InfoComm Tech Co. Ltd. 150 Sold back to Far Eastern Group 3Q10E Accuray 300
Accumulated gain 5,611 Source: Company data, J.P. Morgan estimates.
China: enlarge economies of scale for long-term growth Earnings from Uni-President China (UPC) reached NT$2.5 billion in FY09 from NT$1 billion in FY05, at the CAGR of 25%; however, its market share in juice, RTD tea, and instant noodles dropped by 16ppt, 4.4ppt, and 4.3ppt, respectively, during the same period. The declining market share was due to intensifying competition from international players like Coca-Cola and Pepsi.
In the past five years, juice, RTD tea, and instant noodles experienced CAGR of 26%, 19%, and 14% in 2003-08. Although UPC lost market share, the overall sector expansion was strong enough to support earnings growth for all players. Looking forward, we expect the sector growth to slow down to teens growth and economies of scale become crucial for long-term earnings growth.
UPC realizes that it must quickly regain economies of scale and believes one-third of market share is a critical mass for long-term growth. UPC therefore turned its focus to market share from profitability and is looking for a 30% y/y growth in FY10 revenue. We believe the company is moving in the right direction, and if UPC successfully regains market share, this would be a long-term positive.
To achieve the goal, UPC is increasing promotion, strengthening its distribution network, and expanding capacity. UPC has increased the number of regional offices from 60 to 92. The widening channel allows UPC to penetrate to the city level from the provincial level. In addition, UPC is trying to sign contracts with the Top 20 distributors of each region to sell Uni-President’s products exclusively. For instant noodles, UPC has realigned its product mix and is only focusing on mid- to high-end
5
Asia Pacific Equity Research 21 August 2010
Caren Huang (886-2) 2725-9872 [email protected]
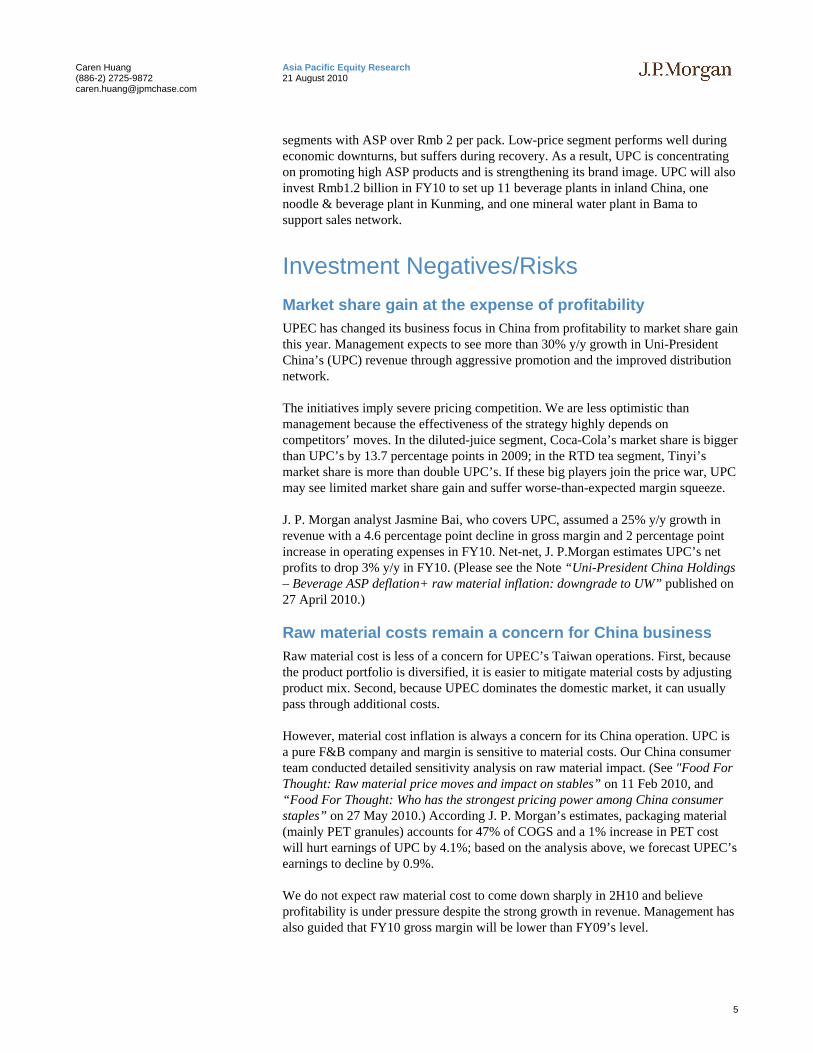
segments with ASP over Rmb 2 per pack. Low-price segment performs well during economic downturns, but suffers during recovery. As a result, UPC is concentrating on promoting high ASP products and is strengthening its brand image. UPC will also invest Rmb1.2 billion in FY10 to set up 11 beverage plants in inland China, one noodle & beverage plant in Kunming, and one mineral water plant in Bama to support sales network.
Investment Negatives/Risks Market share gain at the expense of profitability UPEC has changed its business focus in China from profitability to market share gain this year. Management expects to see more than 30% y/y growth in Uni-President China’s (UPC) revenue through aggressive promotion and the improved distribution network.
The initiatives imply severe pricing competition. We are less optimistic than management because the effectiveness of the strategy highly depends on competitors’ moves. In the diluted-juice segment, Coca-Cola’s market share is bigger than UPC’s by 13.7 percentage points in 2009; in the RTD tea segment, Tinyi’s market share is more than double UPC’s. If these big players join the price war, UPC may see limited market share gain and suffer worse-than-expected margin squeeze.
J. P. Morgan analyst Jasmine Bai, who covers UPC, assumed a 25% y/y growth in revenue with a 4.6 percentage point decline in gross margin and 2 percentage point increase in operating expenses in FY10. Net-net, J. P.Morgan estimates UPC’s net profits to drop 3% y/y in FY10. (Please see the Note “Uni-President China Holdings – Beverage ASP deflation+ raw material inflation: downgrade to UW” published on 27 April 2010.)
Raw material costs remain a concern for China business Raw material cost is less of a concern for UPEC’s Taiwan operations. First, because the product portfolio is diversified, it is easier to mitigate material costs by adjusting product mix. Second, because UPEC dominates the domestic market, it can usually pass through additional costs.
However, material cost inflation is always a concern for its China operation. UPC is a pure F&B company and margin is sensitive to material costs. Our China consumer team conducted detailed sensitivity analysis on raw material impact. (See "Food For Thought: Raw material price moves and impact on stables” on 11 Feb 2010, and “Food For Thought: Who has the strongest pricing power among China consumer staples” on 27 May 2010.) According J. P. Morgan’s estimates, packaging material (mainly PET granules) accounts for 47% of COGS and a 1% increase in PET cost will hurt earnings of UPC by 4.1%; based on the analysis above, we forecast UPEC’s earnings to decline by 0.9%.
We do not expect raw material cost to come down sharply in 2H10 and believe profitability is under pressure despite the strong growth in revenue. Management has also guided that FY10 gross margin will be lower than FY09’s level.
6
Asia Pacific Equity Research 21 August 2010
Caren Huang (886-2) 2725-9872 [email protected]
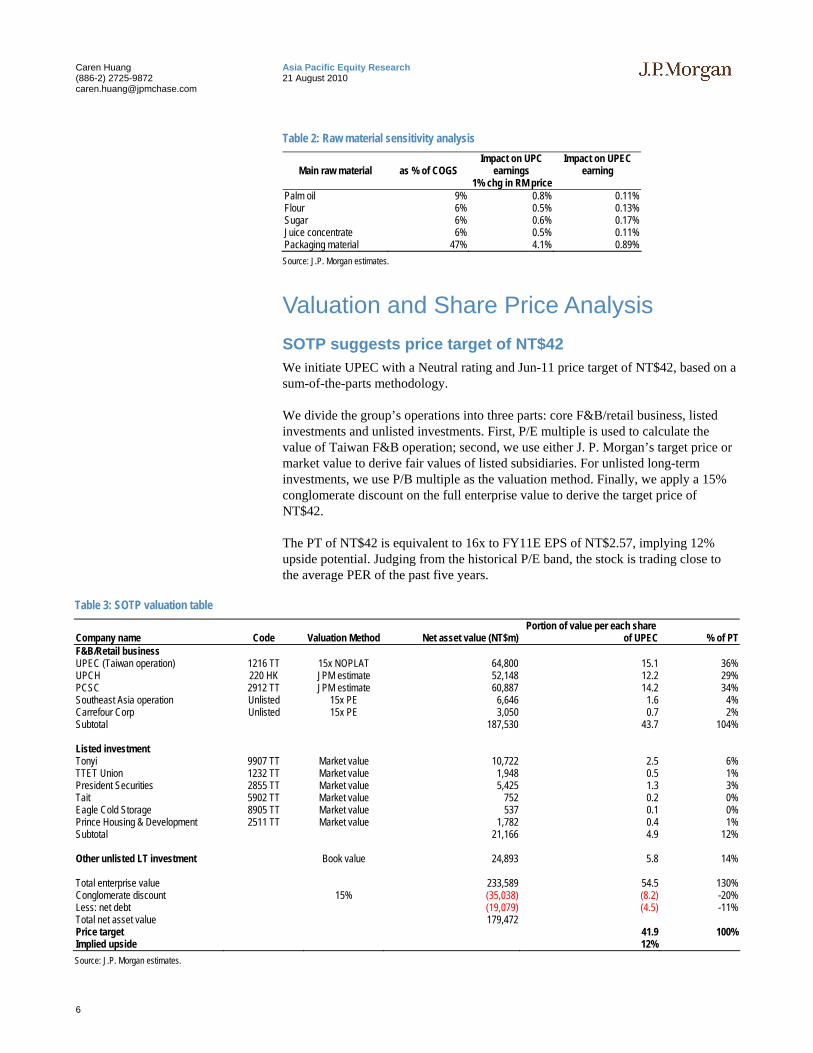
Table 2: Raw material sensitivity analysis
Main raw material as % of COGS Impact on UPC
earnings Impact on UPEC
earning 1% chg in RM price Palm oil 9% 0.8% 0.11% Flour 6% 0.5% 0.13% Sugar 6% 0.6% 0.17% Juice concentrate 6% 0.5% 0.11% Packaging material 47% 4.1% 0.89% Source: J.P. Morgan estimates.
Valuation and Share Price Analysis SOTP suggests price target of NT$42 We initiate UPEC with a Neutral rating and Jun-11 price target of NT$42, based on a sum-of-the-parts methodology.
We divide the group’s operations into three parts: core F&B/retail business, listed investments and unlisted investments. First, P/E multiple is used to calculate the value of Taiwan F&B operation; second, we use either J. P. Morgan’s target price or market value to derive fair values of listed subsidiaries. For unlisted long-term investments, we use P/B multiple as the valuation method. Finally, we apply a 15% conglomerate discount on the full enterprise value to derive the target price of NT$42.
The PT of NT$42 is equivalent to 16x to FY11E EPS of NT$2.57, implying 12% upside potential. Judging from the historical P/E band, the stock is trading close to the average PER of the past five years.
Table 3: SOTP valuation table
Company name Code Valuation Method Net asset value (NT$m)Portion of value per each share
of UPEC % of PTF&B/Retail business UPEC (Taiwan operation) 1216 TT 15x NOPLAT 64,800 15.1 36%UPCH 220 HK JPM estimate 52,148 12.2 29%PCSC 2912 TT JPM estimate 60,887 14.2 34%Southeast Asia operation Unlisted 15x PE 6,646 1.6 4%Carrefour Corp Unlisted 15x PE 3,050 0.7 2%Subtotal 187,530 43.7 104% Listed investment Tonyi 9907 TT Market value 10,722 2.5 6%TTET Union 1232 TT Market value 1,948 0.5 1%President Securities 2855 TT Market value 5,425 1.3 3%Tait 5902 TT Market value 752 0.2 0%Eagle Cold Storage 8905 TT Market value 537 0.1 0%Prince Housing & Development 2511 TT Market value 1,782 0.4 1%Subtotal 21,166 4.9 12% Other unlisted LT investment Book value 24,893 5.8 14% Total enterprise value 233,589 54.5 130%Conglomerate discount 15% (35,038) (8.2) -20%Less: net debt (19,079) (4.5) -11%Total net asset value 179,472 Price target 41.9 100%Implied upside 12%Source: J.P. Morgan estimates.
7
Asia Pacific Equity Research 21 August 2010
Caren Huang (886-2) 2725-9872 [email protected]
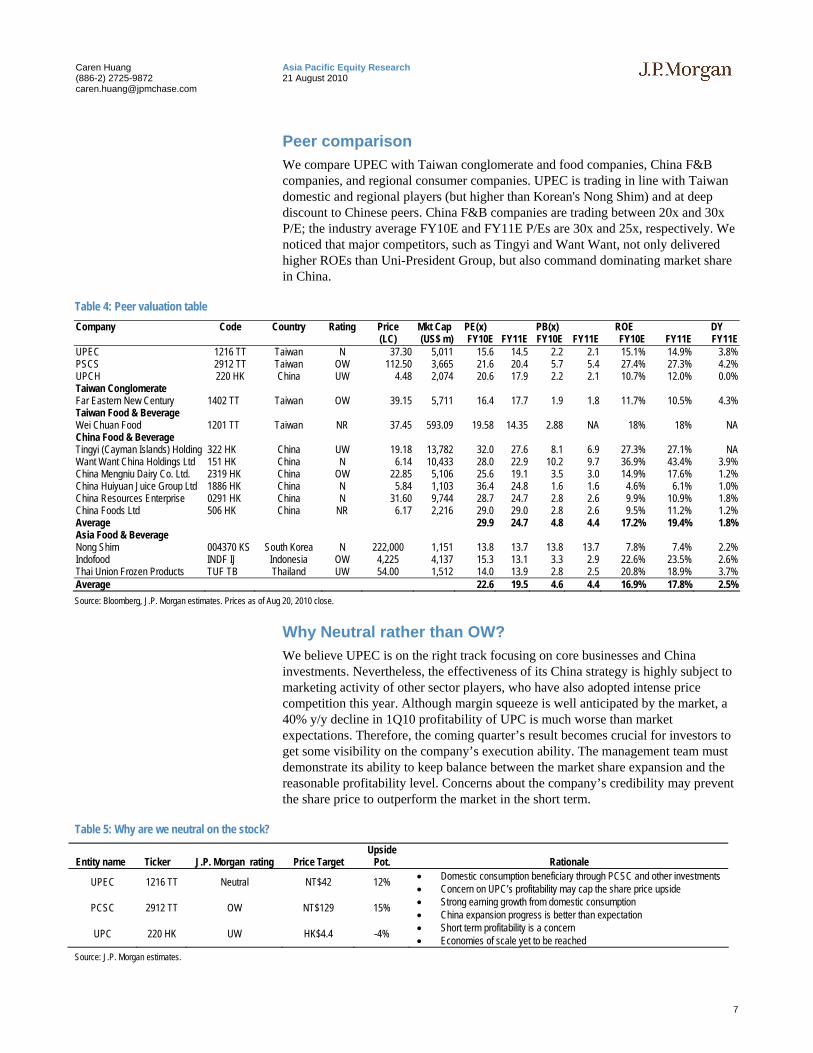
Peer comparison We compare UPEC with Taiwan conglomerate and food companies, China F&B companies, and regional consumer companies. UPEC is trading in line with Taiwan domestic and regional players (but higher than Korean's Nong Shim) and at deep discount to Chinese peers. China F&B companies are trading between 20x and 30x P/E; the industry average FY10E and FY11E P/Es are 30x and 25x, respectively. We noticed that major competitors, such as Tingyi and Want Want, not only delivered higher ROEs than Uni-President Group, but also command dominating market share in China.
Table 4: Peer valuation table Company Code Country Rating Price Mkt Cap PE(x) PB(x) ROE DY (LC) (US$ m) FY10E FY11E FY10E FY11E FY10E FY11E FY11EUPEC 1216 TT Taiwan N 37.30 5,011 15.6 14.5 2.2 2.1 15.1% 14.9% 3.8%PSCS 2912 TT Taiwan OW 112.50 3,665 21.6 20.4 5.7 5.4 27.4% 27.3% 4.2%UPCH 220 HK China UW 4.48 2,074 20.6 17.9 2.2 2.1 10.7% 12.0% 0.0%Taiwan Conglomerate Far Eastern New Century 1402 TT Taiwan OW 39.15 5,711 16.4 17.7 1.9 1.8 11.7% 10.5% 4.3%Taiwan Food & Beverage Wei Chuan Food 1201 TT Taiwan NR 37.45 593.09 19.58 14.35 2.88 NA 18% 18% NAChina Food & Beverage Tingyi (Cayman Islands) Holding 322 HK China UW 19.18 13,782 32.0 27.6 8.1 6.9 27.3% 27.1% NAWant Want China Holdings Ltd 151 HK China N 6.14 10,433 28.0 22.9 10.2 9.7 36.9% 43.4% 3.9%China Mengniu Dairy Co. Ltd. 2319 HK China OW 22.85 5,106 25.6 19.1 3.5 3.0 14.9% 17.6% 1.2%China Huiyuan Juice Group Ltd 1886 HK China N 5.84 1,103 36.4 24.8 1.6 1.6 4.6% 6.1% 1.0%China Resources Enterprise 0291 HK China N 31.60 9,744 28.7 24.7 2.8 2.6 9.9% 10.9% 1.8%China Foods Ltd 506 HK China NR 6.17 2,216 29.0 29.0 2.8 2.6 9.5% 11.2% 1.2%Average 29.9 24.7 4.8 4.4 17.2% 19.4% 1.8%Asia Food & Beverage Nong Shim 004370 KS South Korea N 222,000 1,151 13.8 13.7 13.8 13.7 7.8% 7.4% 2.2%Indofood INDF IJ Indonesia OW 4,225 4,137 15.3 13.1 3.3 2.9 22.6% 23.5% 2.6%Thai Union Frozen Products TUF TB Thailand UW 54.00 1,512 14.0 13.9 2.8 2.5 20.8% 18.9% 3.7%Average 22.6 19.5 4.6 4.4 16.9% 17.8% 2.5%Source: Bloomberg, J.P. Morgan estimates. Prices as of Aug 20, 2010 close.
Why Neutral rather than OW? We believe UPEC is on the right track focusing on core businesses and China investments. Nevertheless, the effectiveness of its China strategy is highly subject to marketing activity of other sector players, who have also adopted intense price competition this year. Although margin squeeze is well anticipated by the market, a 40% y/y decline in 1Q10 profitability of UPC is much worse than market expectations. Therefore, the coming quarter’s result becomes crucial for investors to get some visibility on the company’s execution ability. The management team must demonstrate its ability to keep balance between the market share expansion and the reasonable profitability level. Concerns about the company’s credibility may prevent the share price to outperform the market in the short term.
Table 5: Why are we neutral on the stock?
Entity name Ticker J.P. Morgan rating Price Target Upside
Pot. Rationale
UPEC 1216 TT Neutral NT$42 12% • Domestic consumption beneficiary through PCSC and other investments • Concern on UPC’s profitability may cap the share price upside
PCSC 2912 TT OW NT$129 15% • Strong earning growth from domestic consumption • China expansion progress is better than expectation
UPC 220 HK UW HK$4.4 -4% • Short term profitability is a concern • Economies of scale yet to be reached
Source: J.P. Morgan estimates.
8
Asia Pacific Equity Research 21 August 2010
Caren Huang (886-2) 2725-9872 [email protected]
What could make us more positive? We would become more positive on the company if we see the following data points:
(1) Positive earnings surprise in China
We understand that economies of scale are essential for UPEC to strengthen its position in China in the long term. Therefore, the company is focusing on market share expansion at the expense of profitability in the short term and we expect to see a 6% y/y decline in net profit for China business accordingly. If UPC reports positive earnings growth without market share loss in this competitive environment, we will become more positive on the company.
(2) Easing of raw material pressure
Raw material accounts for more than 50% of COGS in F&B business. Although UPEC can offset/pass-through costs through product mix change and ASP adjustment, it is always a concern that shadows profitability, especially for its China operation. If we see a downward trend of major commodity prices, or UPEC can secure material supply through vertical M&A, we will become more positive on the margins.
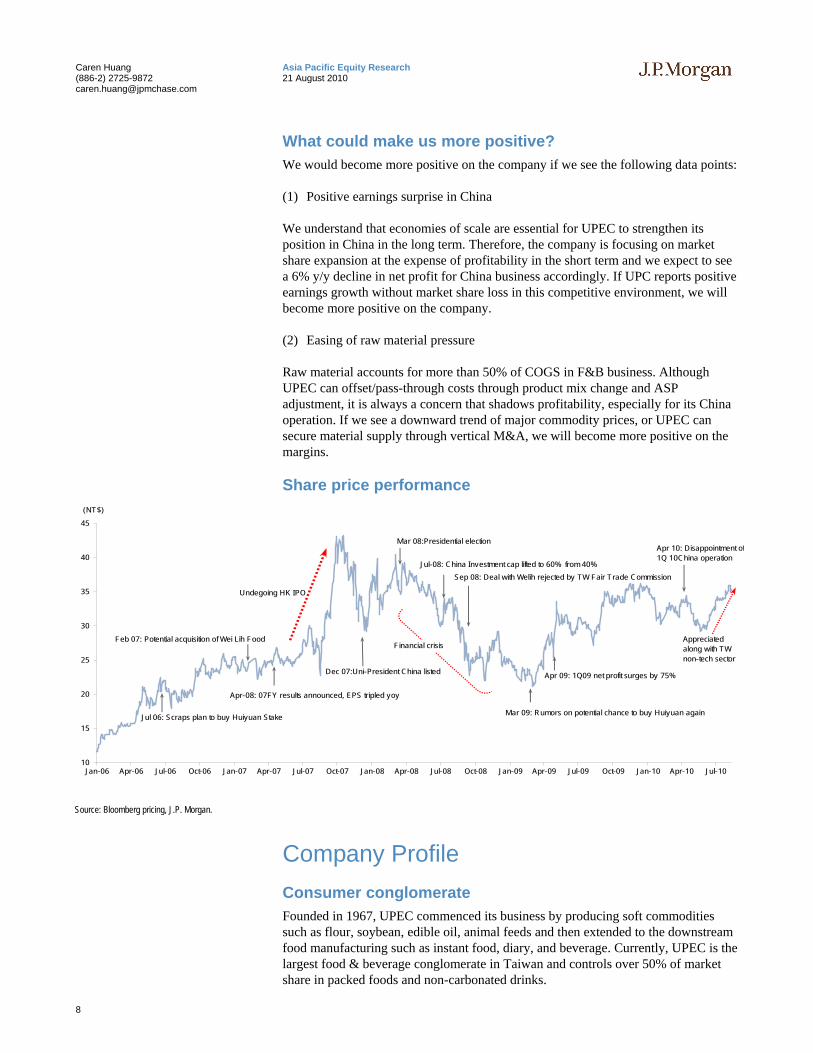
Share price performance
10
15
20
25
30
35
40
45
Jan-06 Apr-06 Jul-06 Oct-06 Jan-07 Apr-07 Jul-07 Oct-07 Jan-08 Apr-08 Jul-08 Oct-08 Jan-09 Apr-09 Jul-09 Oct-09 Jan-10 Apr-10 Jul-10
(NT$)
Mar 08:Presidential election
Feb 07: Potential acquisition of Wei Lih Food
Jul-08: China Investment cap lifted to 60% from 40%
Undegoing HK IPO
Sep 08: Deal with Welih rejected by TW Fair Trade Commission
Dec 07:Uni-President China listed
Financial crisis
Apr-08: 07FY results announced, EPS tripled yoy
Jul 06: Scraps plan to buy Huiyuan Stake Mar 09: Rumors on potential chance to buy Huiyuan again
Appreciatedalong with TWnon-tech sector
Apr 10: Disappointment of1Q 10China operation
Apr 09: 1Q09 net profit surges by 75%
Source: Bloomberg pricing, J.P. Morgan.
Company Profile Consumer conglomerate Founded in 1967, UPEC commenced its business by producing soft commodities such as flour, soybean, edible oil, animal feeds and then extended to the downstream food manufacturing such as instant food, diary, and beverage. Currently, UPEC is the largest food & beverage conglomerate in Taiwan and controls over 50% of market share in packed foods and non-carbonated drinks.
9
Asia Pacific Equity Research 21 August 2010
Caren Huang (886-2) 2725-9872 [email protected]
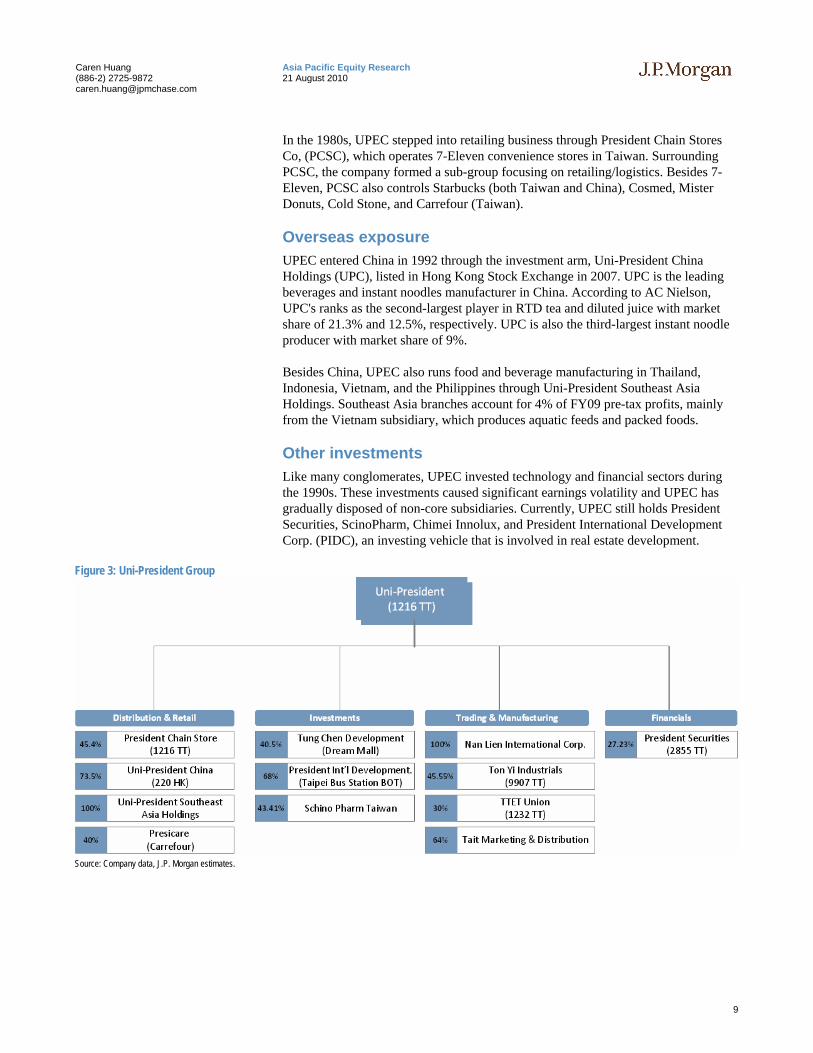
In the 1980s, UPEC stepped into retailing business through President Chain Stores Co, (PCSC), which operates 7-Eleven convenience stores in Taiwan. Surrounding PCSC, the company formed a sub-group focusing on retailing/logistics. Besides 7-Eleven, PCSC also controls Starbucks (both Taiwan and China), Cosmed, Mister Donuts, Cold Stone, and Carrefour (Taiwan).
Overseas exposure UPEC entered China in 1992 through the investment arm, Uni-President China Holdings (UPC), listed in Hong Kong Stock Exchange in 2007. UPC is the leading beverages and instant noodles manufacturer in China. According to AC Nielson, UPC's ranks as the second-largest player in RTD tea and diluted juice with market share of 21.3% and 12.5%, respectively. UPC is also the third-largest instant noodle producer with market share of 9%.
Besides China, UPEC also runs food and beverage manufacturing in Thailand, Indonesia, Vietnam, and the Philippines through Uni-President Southeast Asia Holdings. Southeast Asia branches account for 4% of FY09 pre-tax profits, mainly from the Vietnam subsidiary, which produces aquatic feeds and packed foods.
Other investments Like many conglomerates, UPEC invested technology and financial sectors during the 1990s. These investments caused significant earnings volatility and UPEC has gradually disposed of non-core subsidiaries. Currently, UPEC still holds President Securities, ScinoPharm, Chimei Innolux, and President International Development Corp. (PIDC), an investing vehicle that is involved in real estate development.
Figure 3: Uni-President Group
Source: Company data, J.P. Morgan estimates.
10
Asia Pacific Equity Research 21 August 2010
Caren Huang (886-2) 2725-9872 [email protected]
Taiwan Operations Business strategy Table 6: UPEC's market position in Taiwan Market share Mar-10 Instant noodles 49% RTD tea 44% RTD coffee 26% Yogurt drink 59% Soy milk 40% Fresh milk 23% Juice 17% Source: AC Nielsen, Company data.
UPEC is a dominating leader in Taiwan F&B industry, commanding significant market share in different segments. The priority for Taiwan business is to protect market share and profitability from price competition.
Profitability – Taiwan F&B market is mature. Only RTD tea and coffee still show some growth potential. Nevertheless, customers are price sensitive and it is difficult to raise ASPs. The strategy to expand margins is to keep launching new products and cutting inefficient stock keeping units (SKUs). UPEC had more than 1300 SKUs in 2006 and initiated SKU restructure to eliminate inefficient categories. Currently, UPEC carries 1000 SKUs.
Other F&B investments – UPEC also invests in other F&B companies vertically and horizontally to strengthen its market position and pricing power. For example, the combined market share of UPEC and Wei Li Food in instant noodles is over 70% and this prevents second-tier players from initiating irrational pricing competition.
Table 7: Other F&B Investments in Taiwan
Company name UPEC’s stake Market position Joint market position Kuang Chuan 31% With 28% market share in fresh and flavored milk
The 3rd largest convenience store chain (Hi-Life) with 13.6% market share
Controlled more than 50% of dairy products Controlled 65% of CVS markets
Wei Li Food (1244 TT) 33% The 2nd largest instant noodles player with 22% market share Controlled 71% of instant noodles market TTET Union 38% The largest soybean crushing manufacturer OEM partner for edible oil products Source: Company data, J.P. Morgan estimates.
Earnings outlook From 2000 to 2009, the retail trade amount of food, beverage, and tobacco grew at a CAGR of 5%. We forecast UPEC to report revenue of NT$48bn in FY10 and NT$51bn in FY11, up 8% y/y and 7% y/y, respectively, and slightly higher than the long-term sector growth rate.
In terms of profitability, we estimate that gross margin would decline to 22.6% in FY10 from 24% in FY09, given higher raw material cost (PET, orange juice, sugar, and palm oil) in 1H10. On the contrary, we expect to see operating margin decline to 19% in FY10 from 20% last year because of reduction in promotion and marketing expenses while the economy gradually recovers.
11
Asia Pacific Equity Research 21 August 2010
Caren Huang (886-2) 2725-9872 [email protected]
China Operations UPC entered China market in 1992 and targeted three segments: RTD tea, diluted juice, and instant noodles. Currently, it ranks as the No. 2 player in diluted juice and RTD tea market, after Coca-Cola and Tingyi.
Table 8: UPC's market position in China Diluted Juice By value By volume RTD Tea By value By volume Instant noodles By valueCoca-Cola 26.2% 26.7% Tingyi 47.4% 48.7% Tingyi 56%UPC 12.5% 15.3% UPC 21.3% 21.3% Hualong 12%Tingyi 11.0% 13.7% Wahaha 15.5% 14.7% UPC 9%China Huiyuan 9.9% 10.9% Coca-Cola 7.0% 6.9% Wahaha 8.0% 6.9% Jinmailang 2.4% 2.5% Source: Tingyi, AC Nielsen Dec 2009, Company data.
Business strategy Focus on market share gain This year UPC is focusing on market share expansion, aiming to secure one-third of the China market in the long term. UPC’s sales team does not have profit in their scorecard, but revenue and market share. We understand that UPC must gain economies of scale to narrow the gap between itself and the sector leaders. However, competitors’ reaction is a determining factor in this price war.
Strengthening the distribution network UPC has been restructuring the salesforce since 2007. (See “Uni-President China Holdings Ltd Cocktail hour: Initiating at Overweight” on 22 March 2009.) After the first stage of restructuring, the next step is to expand the distribution network. By 2012, UPC aims to set up one production base in each province and build up 250 distributing offices (from the current 92) around China. The company also announced plans to set up 11 plants in 2Q10.
M&A Besides organic growth, UPC is also active in strategic alliances. We believe the company is trying to duplicate its Taiwan business model. Management does not rule out more M&As to strengthen its position in China.
Table 9: Strategic alliance in China Company name UPC’s stake Company’s market position Investment rationale JV in Guilin 45% JV with Shanghai Ziquan, the beverage bottler Vertical integration in beverage production Jinmailang JV 50% JV with “Nissin Hualong Food”, the 2nd largest instant noodle
producer in China UPC's OEM partner in bottled water
Andre Juice (8259 HK) 15% Major apple juice concentrate suppliers in China Secure and diversify juice concentrate supply Wondersun Dairy 9% Regional milk provider and milk powder brand in China Exposure to dairy market Source: Company data, J.P. Morgan estimates.
Earnings Outlook In 1Q10, revenue grew more than 25% y/y, but net income fell by 40%, mostly due to ASP cut and hiking raw material costs. Jasmine Bai remains cautious on UPC's FY10 results, given the double pressure of ASP and margin. She estimates revenue and net income to reach Rmb11.4 billion and Rmb684 million, up 25% y/y and down 3% y/y, respectively in FY10.
12
Asia Pacific Equity Research 21 August 2010
Caren Huang (886-2) 2725-9872 [email protected]
Southeast Asia Operations UPEC has exposure in Thailand, Indonesia, Vietnam, and the Philippines through Uni-President Southeast Asia Holdings. Southeast Asia subsidiaries accounted for 4% of FY09 UPEC’s pre-tax profit. Vietnam operation reported net income of NT$254 million, accounting for more than 73% of Southeast Asia profits, as it is the largest aquatic feeds producer locally. According to management, the Vietnam subsidiary reported 60% y/y growth in 1Q10 revenue. We believe that the Southeast Asia arm will be the next growth driver for the group.
13
Asia Pacific Equity Research 21 August 2010
Caren Huang (886-2) 2725-9872 [email protected]
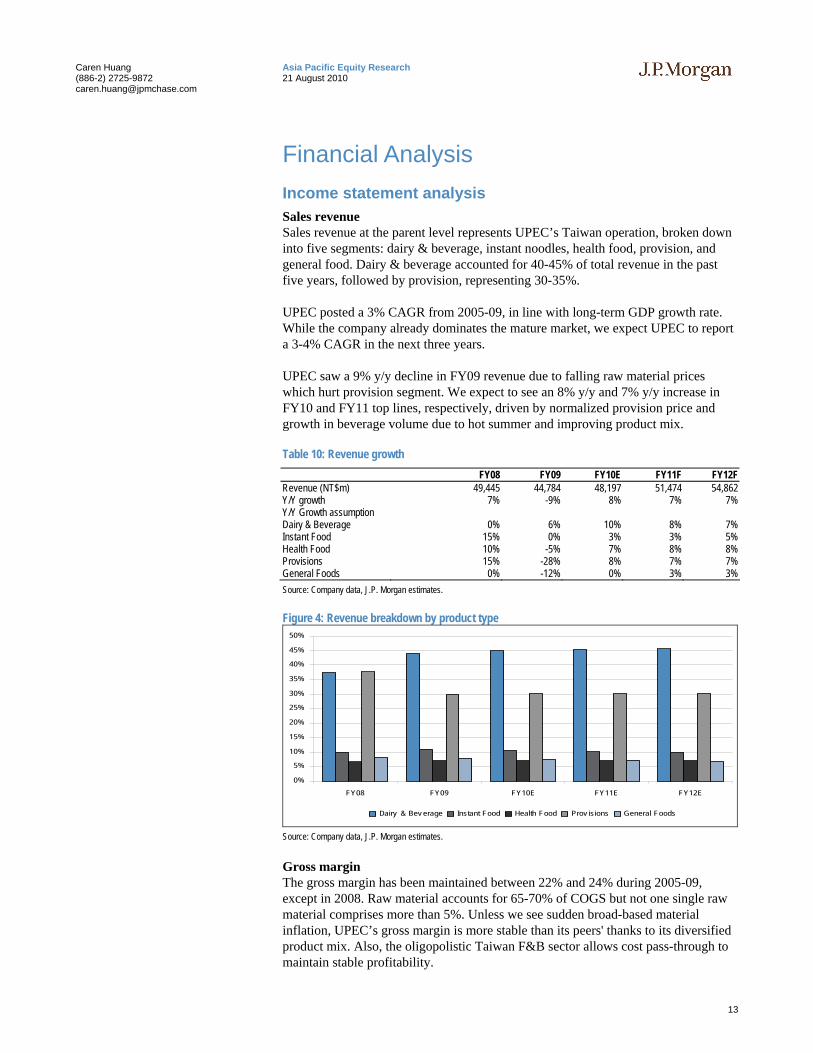
Financial Analysis Income statement analysis Sales revenue Sales revenue at the parent level represents UPEC’s Taiwan operation, broken down into five segments: dairy & beverage, instant noodles, health food, provision, and general food. Dairy & beverage accounted for 40-45% of total revenue in the past five years, followed by provision, representing 30-35%.
UPEC posted a 3% CAGR from 2005-09, in line with long-term GDP growth rate. While the company already dominates the mature market, we expect UPEC to report a 3-4% CAGR in the next three years.
UPEC saw a 9% y/y decline in FY09 revenue due to falling raw material prices which hurt provision segment. We expect to see an 8% y/y and 7% y/y increase in FY10 and FY11 top lines, respectively, driven by normalized provision price and growth in beverage volume due to hot summer and improving product mix.
Table 10: Revenue growth FY08 FY09 FY10E FY11F FY12FRevenue (NT$m) 49,445 44,784 48,197 51,474 54,862 Y/Y growth 7% -9% 8% 7% 7%Y/Y Growth assumption Dairy & Beverage 0% 6% 10% 8% 7%Instant Food 15% 0% 3% 3% 5%Health Food 10% -5% 7% 8% 8%Provisions 15% -28% 8% 7% 7%General Foods 0% -12% 0% 3% 3%Source: Company data, J.P. Morgan estimates.
Figure 4: Revenue breakdown by product type
0%
5%
10%
15%
20%
25%
30%
35%
40%
45%
50%
FY08 FY09 FY10E FY11E FY12E
Dairy & Bev erage Instant Food Health Food Prov isions General Foods
Source: Company data, J.P. Morgan estimates.
Gross margin The gross margin has been maintained between 22% and 24% during 2005-09, except in 2008. Raw material accounts for 65-70% of COGS but not one single raw material comprises more than 5%. Unless we see sudden broad-based material inflation, UPEC’s gross margin is more stable than its peers' thanks to its diversified product mix. Also, the oligopolistic Taiwan F&B sector allows cost pass-through to maintain stable profitability.
14
Asia Pacific Equity Research 21 August 2010
Caren Huang (886-2) 2725-9872 [email protected]
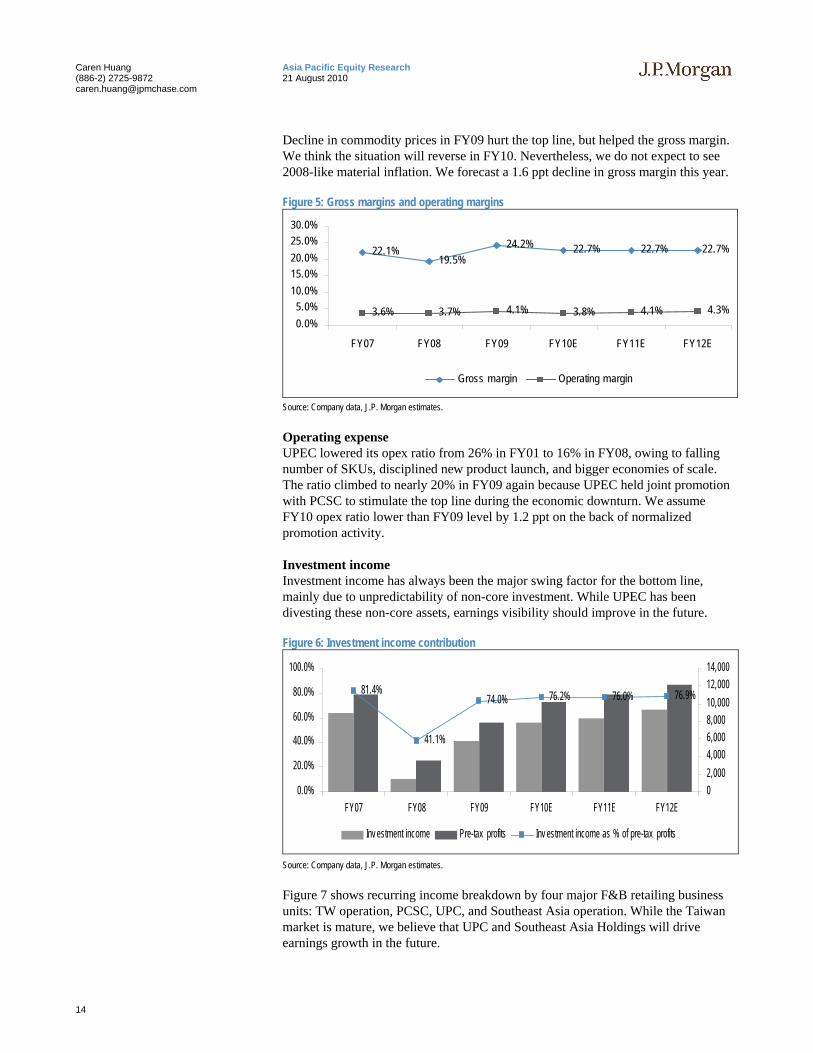
Decline in commodity prices in FY09 hurt the top line, but helped the gross margin. We think the situation will reverse in FY10. Nevertheless, we do not expect to see 2008-like material inflation. We forecast a 1.6 ppt decline in gross margin this year.
Figure 5: Gross margins and operating margins
22.1%19.5%
24.2% 22.7% 22.7% 22.7%
3.6% 3.7% 4.1% 3.8% 4.1% 4.3%0.0%5.0%
10.0%15.0%20.0%25.0%30.0%
FY07 FY08 FY09 FY10E FY11E FY12E
Gross margin Operating margin
Source: Company data, J.P. Morgan estimates.
Operating expense UPEC lowered its opex ratio from 26% in FY01 to 16% in FY08, owing to falling number of SKUs, disciplined new product launch, and bigger economies of scale. The ratio climbed to nearly 20% in FY09 again because UPEC held joint promotion with PCSC to stimulate the top line during the economic downturn. We assume FY10 opex ratio lower than FY09 level by 1.2 ppt on the back of normalized promotion activity.
Investment income Investment income has always been the major swing factor for the bottom line, mainly due to unpredictability of non-core investment. While UPEC has been divesting these non-core assets, earnings visibility should improve in the future.
Figure 6: Investment income contribution
81.4%
41.1%
74.0% 76.2% 76.0% 76.9%
0.0%
20.0%
40.0%
60.0%
80.0%
100.0%
FY07 FY08 FY09 FY10E FY11E FY12E02,0004,0006,0008,00010,00012,00014,000
Inv estment income Pre-tax profits Inv estment income as % of pre-tax profits
Source: Company data, J.P. Morgan estimates.
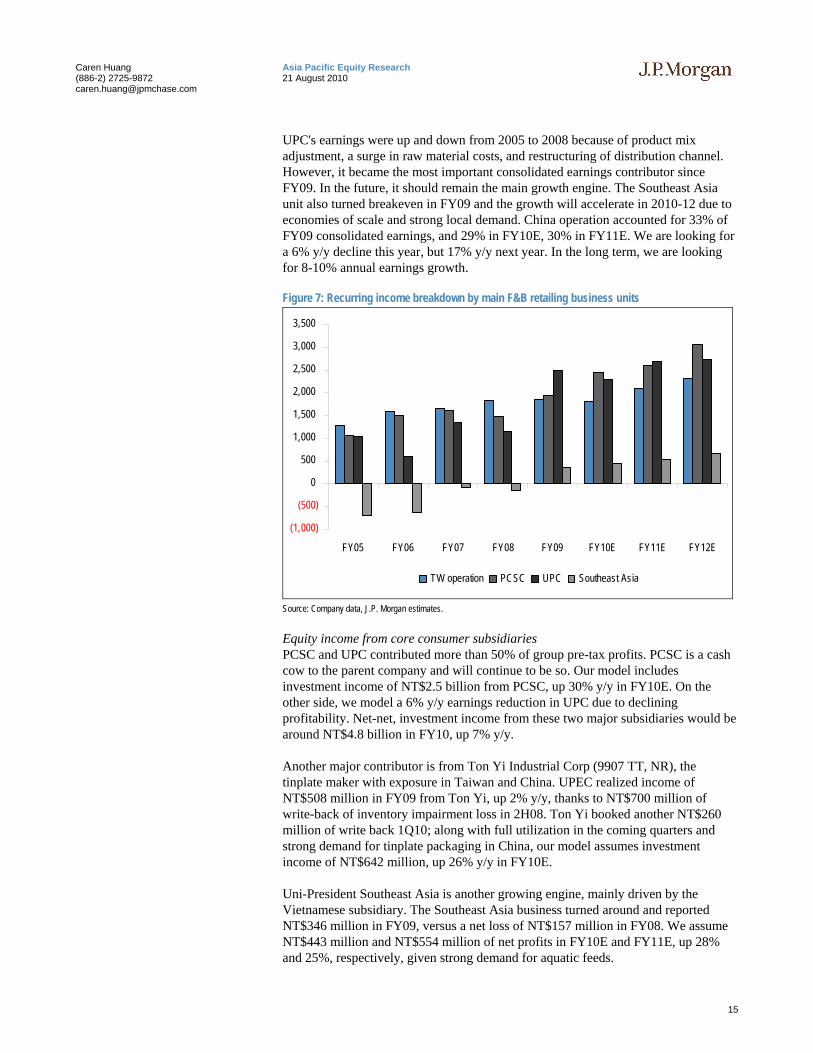
Figure 7 shows recurring income breakdown by four major F&B retailing business units: TW operation, PCSC, UPC, and Southeast Asia operation. While the Taiwan market is mature, we believe that UPC and Southeast Asia Holdings will drive earnings growth in the future.
15
Asia Pacific Equity Research 21 August 2010
Caren Huang (886-2) 2725-9872 [email protected]
UPC's earnings were up and down from 2005 to 2008 because of product mix adjustment, a surge in raw material costs, and restructuring of distribution channel. However, it became the most important consolidated earnings contributor since FY09. In the future, it should remain the main growth engine. The Southeast Asia unit also turned breakeven in FY09 and the growth will accelerate in 2010-12 due to economies of scale and strong local demand. China operation accounted for 33% of FY09 consolidated earnings, and 29% in FY10E, 30% in FY11E. We are looking for a 6% y/y decline this year, but 17% y/y next year. In the long term, we are looking for 8-10% annual earnings growth.
Figure 7: Recurring income breakdown by main F&B retailing business units
(1,000)
(500)
0
500
1,000
1,500
2,000
2,500
3,000
3,500
FY05 FY06 FY07 FY08 FY09 FY10E FY11E FY12E
TW operation PCSC UPC Southeast Asia
Source: Company data, J.P. Morgan estimates.
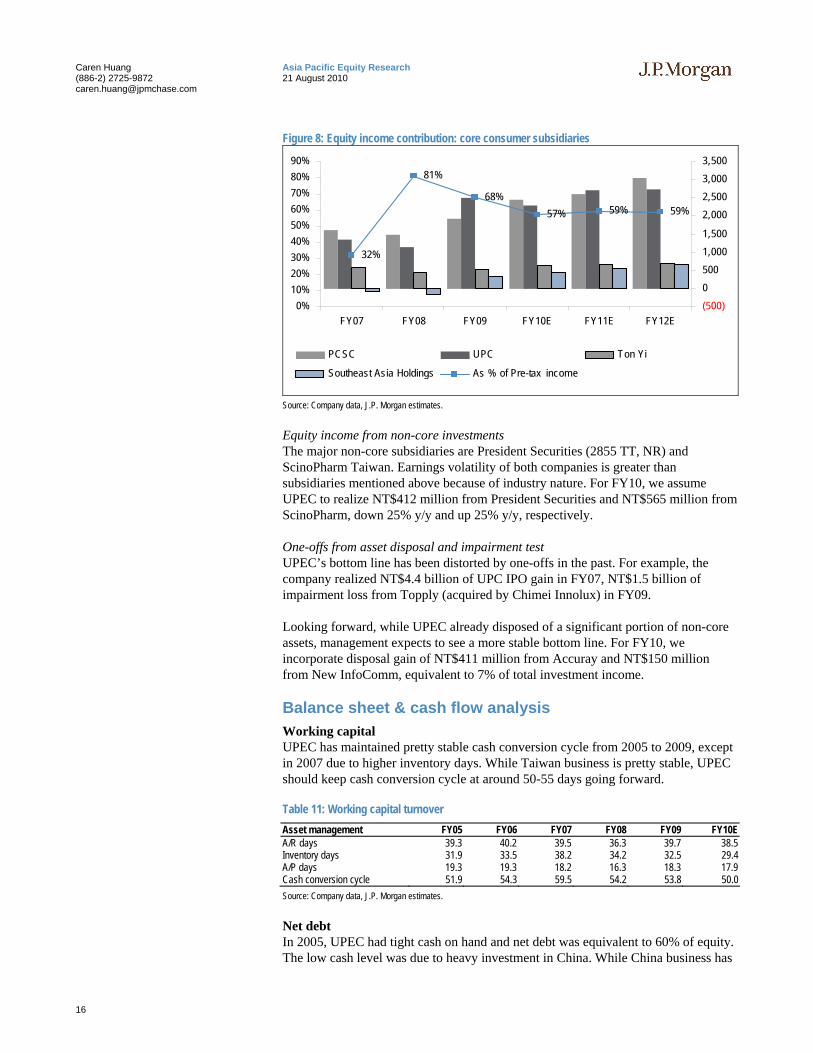
Equity income from core consumer subsidiaries PCSC and UPC contributed more than 50% of group pre-tax profits. PCSC is a cash cow to the parent company and will continue to be so. Our model includes investment income of NT$2.5 billion from PCSC, up 30% y/y in FY10E. On the other side, we model a 6% y/y earnings reduction in UPC due to declining profitability. Net-net, investment income from these two major subsidiaries would be around NT$4.8 billion in FY10, up 7% y/y.
Another major contributor is from Ton Yi Industrial Corp (9907 TT, NR), the tinplate maker with exposure in Taiwan and China. UPEC realized income of NT$508 million in FY09 from Ton Yi, up 2% y/y, thanks to NT$700 million of write-back of inventory impairment loss in 2H08. Ton Yi booked another NT$260 million of write back 1Q10; along with full utilization in the coming quarters and strong demand for tinplate packaging in China, our model assumes investment income of NT$642 million, up 26% y/y in FY10E.
Uni-President Southeast Asia is another growing engine, mainly driven by the Vietnamese subsidiary. The Southeast Asia business turned around and reported NT$346 million in FY09, versus a net loss of NT$157 million in FY08. We assume NT$443 million and NT$554 million of net profits in FY10E and FY11E, up 28% and 25%, respectively, given strong demand for aquatic feeds.
16
Asia Pacific Equity Research 21 August 2010
Caren Huang (886-2) 2725-9872 [email protected]
Figure 8: Equity income contribution: core consumer subsidiaries
32%
81%
68%57% 59% 59%
0%10%20%30%40%50%60%70%80%90%
FY07 FY08 FY09 FY10E FY11E FY12E(500)05001,0001,500
2,0002,5003,0003,500
PCSC UPC Ton Yi
Southeast Asia Holdings As % of Pre-tax income
Source: Company data, J.P. Morgan estimates.
Equity income from non-core investments The major non-core subsidiaries are President Securities (2855 TT, NR) and ScinoPharm Taiwan. Earnings volatility of both companies is greater than subsidiaries mentioned above because of industry nature. For FY10, we assume UPEC to realize NT$412 million from President Securities and NT$565 million from ScinoPharm, down 25% y/y and up 25% y/y, respectively.
One-offs from asset disposal and impairment test UPEC’s bottom line has been distorted by one-offs in the past. For example, the company realized NT$4.4 billion of UPC IPO gain in FY07, NT$1.5 billion of impairment loss from Topply (acquired by Chimei Innolux) in FY09.
Looking forward, while UPEC already disposed of a significant portion of non-core assets, management expects to see a more stable bottom line. For FY10, we incorporate disposal gain of NT$411 million from Accuray and NT$150 million from New InfoComm, equivalent to 7% of total investment income.
Balance sheet & cash flow analysis Working capital UPEC has maintained pretty stable cash conversion cycle from 2005 to 2009, except in 2007 due to higher inventory days. While Taiwan business is pretty stable, UPEC should keep cash conversion cycle at around 50-55 days going forward.
Table 11: Working capital turnover Asset management FY05 FY06 FY07 FY08 FY09 FY10EA/R days 39.3 40.2 39.5 36.3 39.7 38.5 Inventory days 31.9 33.5 38.2 34.2 32.5 29.4 A/P days 19.3 19.3 18.2 16.3 18.3 17.9 Cash conversion cycle 51.9 54.3 59.5 54.2 53.8 50.0 Source: Company data, J.P. Morgan estimates.
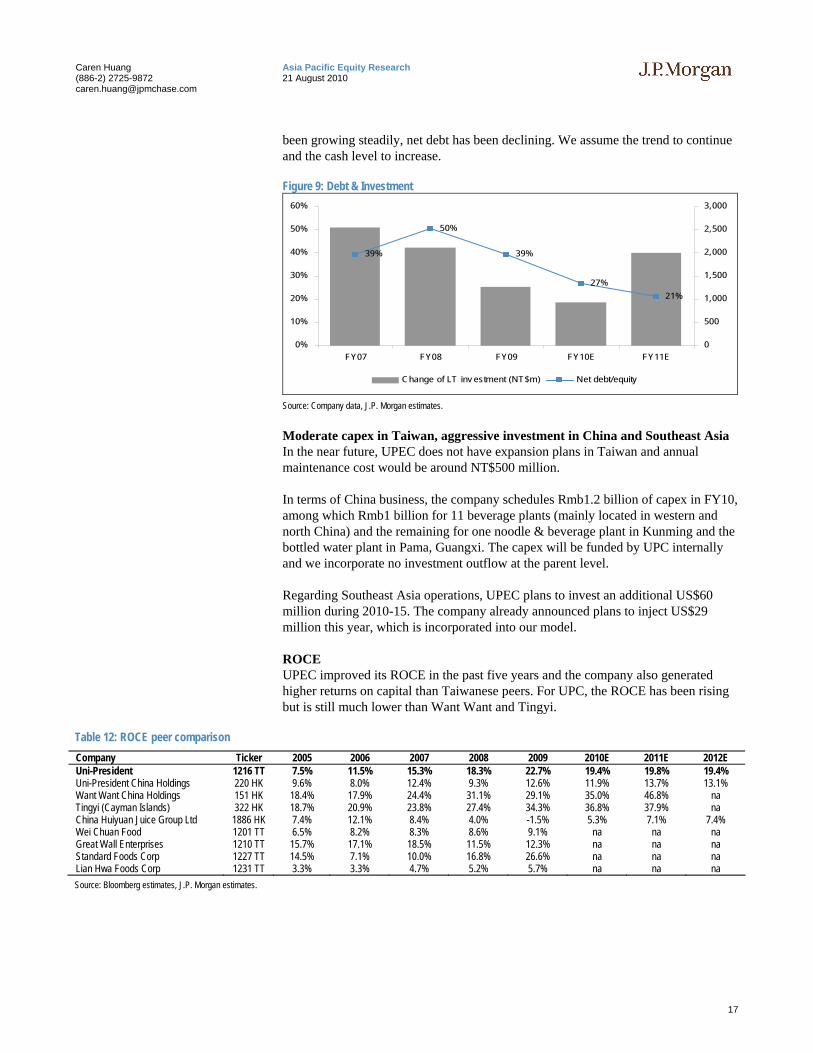
Net debt In 2005, UPEC had tight cash on hand and net debt was equivalent to 60% of equity. The low cash level was due to heavy investment in China. While China business has
17
Asia Pacific Equity Research 21 August 2010
Caren Huang (886-2) 2725-9872 [email protected]
been growing steadily, net debt has been declining. We assume the trend to continue and the cash level to increase.
Figure 9: Debt & Investment
39%
50%
39%
27%21%
0%
10%
20%
30%
40%
50%
60%
FY07 FY08 FY09 FY10E FY11E0
500
1,000
1,500
2,000
2,500
3,000
Change of LT inv estment (NT$m) Net debt/equity
Source: Company data, J.P. Morgan estimates.
Moderate capex in Taiwan, aggressive investment in China and Southeast Asia In the near future, UPEC does not have expansion plans in Taiwan and annual maintenance cost would be around NT$500 million.
In terms of China business, the company schedules Rmb1.2 billion of capex in FY10, among which Rmb1 billion for 11 beverage plants (mainly located in western and north China) and the remaining for one noodle & beverage plant in Kunming and the bottled water plant in Pama, Guangxi. The capex will be funded by UPC internally and we incorporate no investment outflow at the parent level.
Regarding Southeast Asia operations, UPEC plans to invest an additional US$60 million during 2010-15. The company already announced plans to inject US$29 million this year, which is incorporated into our model.
ROCE UPEC improved its ROCE in the past five years and the company also generated higher returns on capital than Taiwanese peers. For UPC, the ROCE has been rising but is still much lower than Want Want and Tingyi.
Table 12: ROCE peer comparison Company Ticker 2005 2006 2007 2008 2009 2010E 2011E 2012E Uni-President 1216 TT 7.5% 11.5% 15.3% 18.3% 22.7% 19.4% 19.8% 19.4% Uni-President China Holdings 220 HK 9.6% 8.0% 12.4% 9.3% 12.6% 11.9% 13.7% 13.1% Want Want China Holdings 151 HK 18.4% 17.9% 24.4% 31.1% 29.1% 35.0% 46.8% na Tingyi (Cayman Islands) 322 HK 18.7% 20.9% 23.8% 27.4% 34.3% 36.8% 37.9% na China Huiyuan Juice Group Ltd 1886 HK 7.4% 12.1% 8.4% 4.0% -1.5% 5.3% 7.1% 7.4% Wei Chuan Food 1201 TT 6.5% 8.2% 8.3% 8.6% 9.1% na na na Great Wall Enterprises 1210 TT 15.7% 17.1% 18.5% 11.5% 12.3% na na na Standard Foods Corp 1227 TT 14.5% 7.1% 10.0% 16.8% 26.6% na na na Lian Hwa Foods Corp 1231 TT 3.3% 3.3% 4.7% 5.2% 5.7% na na na Source: Bloomberg estimates, J.P. Morgan estimates.
18
Asia Pacific Equity Research 21 August 2010
Caren Huang (886-2) 2725-9872 [email protected]
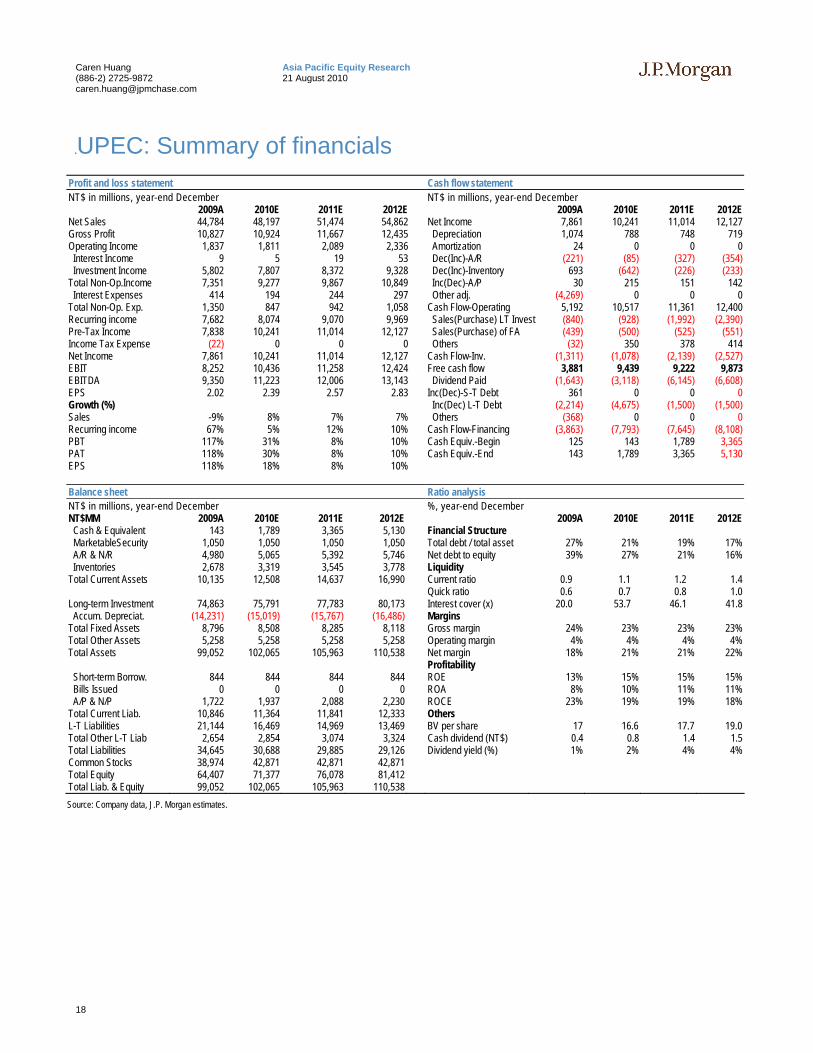
.UPEC: Summary of financials
Profit and loss statement Cash flow statement NT$ in millions, year-end December NT$ in millions, year-end December 2009A 2010E 2011E 2012E 2009A 2010E 2011E 2012ENet Sales 44,784 48,197 51,474 54,862 Net Income 7,861 10,241 11,014 12,127Gross Profit 10,827 10,924 11,667 12,435 Depreciation 1,074 788 748 719Operating Income 1,837 1,811 2,089 2,336 Amortization 24 0 0 0 Interest Income 9 5 19 53 Dec(Inc)-A/R (221) (85) (327) (354) Investment Income 5,802 7,807 8,372 9,328 Dec(Inc)-Inventory 693 (642) (226) (233)Total Non-Op.Income 7,351 9,277 9,867 10,849 Inc(Dec)-A/P 30 215 151 142 Interest Expenses 414 194 244 297 Other adj. (4,269) 0 0 0Total Non-Op. Exp. 1,350 847 942 1,058 Cash Flow-Operating 5,192 10,517 11,361 12,400Recurring income 7,682 8,074 9,070 9,969 Sales(Purchase) LT Invest (840) (928) (1,992) (2,390)Pre-Tax Income 7,838 10,241 11,014 12,127 Sales(Purchase) of FA (439) (500) (525) (551)Income Tax Expense (22) 0 0 0 Others (32) 350 378 414 Net Income 7,861 10,241 11,014 12,127 Cash Flow-Inv. (1,311) (1,078) (2,139) (2,527)EBIT 8,252 10,436 11,258 12,424 Free cash flow 3,881 9,439 9,222 9,873 EBITDA 9,350 11,223 12,006 13,143 Dividend Paid (1,643) (3,118) (6,145) (6,608)EPS 2.02 2.39 2.57 2.83 Inc(Dec)-S-T Debt 361 0 0 0 Growth (%) Inc(Dec) L-T Debt (2,214) (4,675) (1,500) (1,500)Sales -9% 8% 7% 7% Others (368) 0 0 0 Recurring income 67% 5% 12% 10% Cash Flow-Financing (3,863) (7,793) (7,645) (8,108)PBT 117% 31% 8% 10% Cash Equiv.-Begin 125 143 1,789 3,365 PAT 118% 30% 8% 10% Cash Equiv.-End 143 1,789 3,365 5,130 EPS 118% 18% 8% 10% Balance sheet Ratio analysis NT$ in millions, year-end December %, year-end December NT$MM 2009A 2010E 2011E 2012E 2009A 2010E 2011E 2012E Cash & Equivalent 143 1,789 3,365 5,130 Financial Structure MarketableSecurity 1,050 1,050 1,050 1,050 Total debt / total asset 27% 21% 19% 17% A/R & N/R 4,980 5,065 5,392 5,746 Net debt to equity 39% 27% 21% 16% Inventories 2,678 3,319 3,545 3,778 Liquidity Total Current Assets 10,135 12,508 14,637 16,990 Current ratio 0.9 1.1 1.2 1.4 Quick ratio 0.6 0.7 0.8 1.0 Long-term Investment 74,863 75,791 77,783 80,173 Interest cover (x) 20.0 53.7 46.1 41.8 Accum. Depreciat. (14,231) (15,019) (15,767) (16,486) Margins Total Fixed Assets 8,796 8,508 8,285 8,118 Gross margin 24% 23% 23% 23%Total Other Assets 5,258 5,258 5,258 5,258 Operating margin 4% 4% 4% 4%Total Assets 99,052 102,065 105,963 110,538 Net margin 18% 21% 21% 22% Profitability Short-term Borrow. 844 844 844 844 ROE 13% 15% 15% 15% Bills Issued 0 0 0 0 ROA 8% 10% 11% 11% A/P & N/P 1,722 1,937 2,088 2,230 ROCE 23% 19% 19% 18%Total Current Liab. 10,846 11,364 11,841 12,333 Others L-T Liabilities 21,144 16,469 14,969 13,469 BV per share 17 16.6 17.7 19.0 Total Other L-T Liab 2,654 2,854 3,074 3,324 Cash dividend (NT$) 0.4 0.8 1.4 1.5 Total Liabilities 34,645 30,688 29,885 29,126 Dividend yield (%) 1% 2% 4% 4%Common Stocks 38,974 42,871 42,871 42,871 Total Equity 64,407 71,377 76,078 81,412 Total Liab. & Equity 99,052 102,065 105,963 110,538 Source: Company data, J.P. Morgan estimates.
19
Asia Pacific Equity Research 21 August 2010
Caren Huang (886-2) 2725-9872 [email protected]
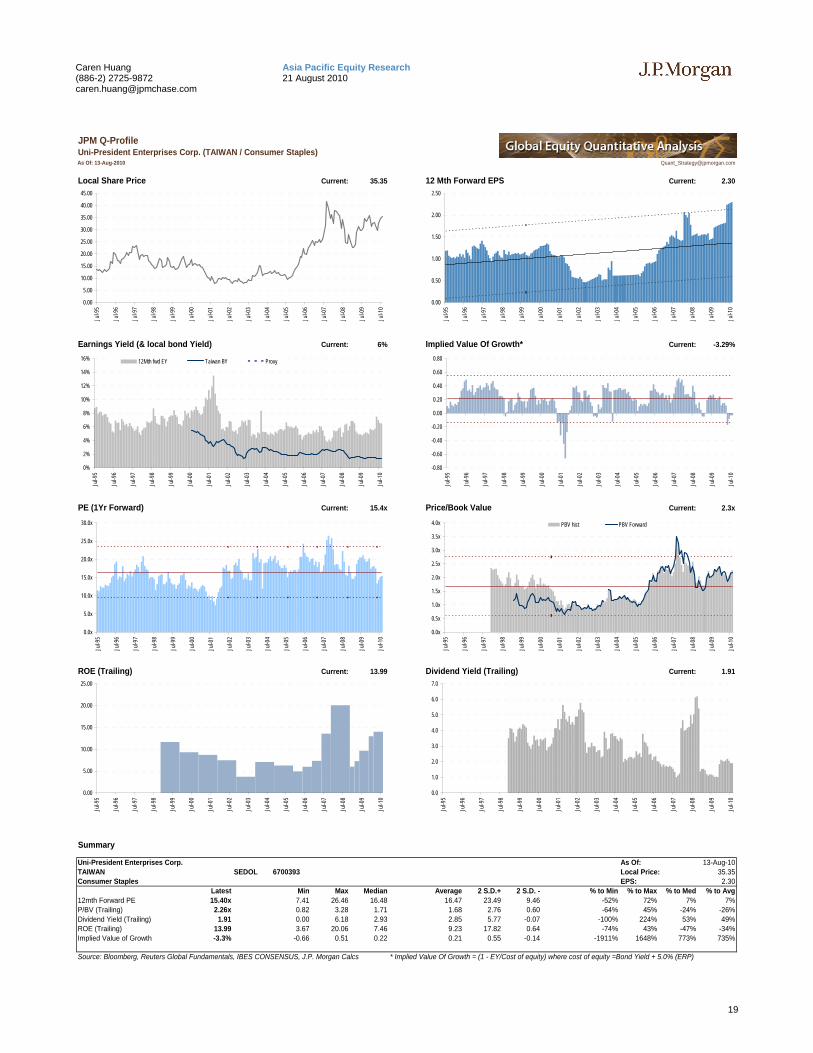
JPM Q-ProfileUni-President Enterprises Corp. (TAIWAN / Consumer Staples)As Of: 13-Aug-2010 [email protected]
Local Share Price Current: 35.35 12 Mth Forward EPS Current: 2.30
Earnings Yield (& local bond Yield) Current: 6% Implied Value Of Growth* Current: -3.29%
PE (1Yr Forward) Current: 15.4x Price/Book Value Current: 2.3x
ROE (Trailing) Current: 13.99 Dividend Yield (Trailing) Current: 1.91
Summary
Uni-President Enterprises Corp. 4702.80 As Of:TAIWAN 12.033047 SEDOL 6700393 Local Price: 35.35Consumer Staples Food Products EPS: 2.30
Latest Min Max Median Average 2 S.D.+ 2 S.D. - % to Min % to Max % to Med % to Avg12mth Forward PE 15.40x 7.41 26.46 16.48 16.47 23.49 9.46 -52% 72% 7% 7%P/BV (Trailing) 2.26x 0.82 3.28 1.71 1.68 2.76 0.60 -64% 45% -24% -26%Dividend Yield (Trailing) 1.91 0.00 6.18 2.93 2.85 5.77 -0.07 -100% 224% 53% 49%ROE (Trailing) 13.99 3.67 20.06 7.46 9.23 17.82 0.64 -74% 43% -47% -34%Implied Value of Growth -3.3% -0.66 0.51 0.22 0.21 0.55 -0.14 -1911% 1648% 773% 735%
Source: Bloomberg, Reuters Global Fundamentals, IBES CONSENSUS, J.P. Morgan Calcs * Implied Value Of Growth = (1 - EY/Cost of equity) where cost of equity =Bond Yield + 5.0% (ERP)
13-Aug-10
0.00
0.50
1.00
1.50
2.00
2.50
Jul-9
5
Jul-9
6
Jul-9
7
Jul-9
8
Jul-9
9
Jul-0
0
Jul-0
1
Jul-0
2
Jul-0
3
Jul-0
4
Jul-0
5
Jul-0
6
Jul-0
7
Jul-0
8
Jul-0
9
Jul-1
0
0%
2%
4%
6%
8%
10%
12%
14%
16%
Jul-9
5
Jul-9
6
Jul-9
7
Jul-9
8
Jul-9
9
Jul-0
0
Jul-0
1
Jul-0
2
Jul-0
3
Jul-0
4
Jul-0
5
Jul-0
6
Jul-0
7
Jul-0
8
Jul-0
9
Jul-1
0
12Mth fwd EY Taiwan BY Proxy
0.00
5.00
10.00
15.00
20.00
25.00
30.00
35.00
40.00
45.00
Jul-9
5
Jul-9
6
Jul-9
7
Jul-9
8
Jul-9
9
Jul-0
0
Jul-0
1
Jul-0
2
Jul-0
3
Jul-0
4
Jul-0
5
Jul-0
6
Jul-0
7
Jul-0
8
Jul-0
9
Jul-1
0
-0.80
-0.60
-0.40
-0.20
0.00
0.20
0.40
0.60
0.80
Jul-9
5
Jul-9
6
Jul-9
7
Jul-9
8
Jul-9
9
Jul-0
0
Jul-0
1
Jul-0
2
Jul-0
3
Jul-0
4
Jul-0
5
Jul-0
6
Jul-0
7
Jul-0
8
Jul-0
9
Jul-1
0
0.0x
5.0x
10.0x
15.0x
20.0x
25.0x
30.0x
Jul-9
5
Jul-9
6
Jul-9
7
Jul-9
8
Jul-9
9
Jul-0
0
Jul-0
1
Jul-0
2
Jul-0
3
Jul-0
4
Jul-0
5
Jul-0
6
Jul-0
7
Jul-0
8
Jul-0
9
Jul-1
0
0.0x
0.5x
1.0x
1.5x
2.0x
2.5x
3.0x
3.5x
4.0x
Jul-9
5
Jul-9
6
Jul-9
7
Jul-9
8
Jul-9
9
Jul-0
0
Jul-0
1
Jul-0
2
Jul-0
3
Jul-0
4
Jul-0
5
Jul-0
6
Jul-0
7
Jul-0
8
Jul-0
9
Jul-1
0
PBV hist PBV Forward
0.00
5.00
10.00
15.00
20.00
25.00
Jul-9
5
Jul-9
6
Jul-9
7
Jul-9
8
Jul-9
9
Jul-0
0
Jul-0
1
Jul-0
2
Jul-0
3
Jul-0
4
Jul-0
5
Jul-0
6
Jul-0
7
Jul-0
8
Jul-0
9
Jul-1
0
0.0
1.0
2.0
3.0
4.0
5.0
6.0
7.0
Jul-9
5
Jul-9
6
Jul-9
7
Jul-9
8
Jul-9
9
Jul-0
0
Jul-0
1
Jul-0
2
Jul-0
3
Jul-0
4
Jul-0
5
Jul-0
6
Jul-0
7
Jul-0
8
Jul-0
9
Jul-1
0
20
Asia Pacific Equity Research 21 August 2010
Caren Huang (886-2) 2725-9872 [email protected]
Analyst Certification: The research analyst(s) denoted by an “AC” on the cover of this report certifies (or, where multiple research analysts are primarily responsible for this report, the research analyst denoted by an “AC” on the cover or within the document individually certifies, with respect to each security or issuer that the research analyst covers in this research) that: (1) all of the views expressed in this report accurately reflect his or her personal views about any and all of the subject securities or issuers; and (2) no part of any of the research analyst’s compensation was, is, or will be directly or indirectly related to the specific recommendations or views expressed by the research analyst(s) in this report.
Important Disclosures
0
13
26
39
52
65
78
Price(NT$)
Jun07
Sep07
Dec07
Mar08
Jun08
Sep08
Dec08
Mar09
Jun09
Sep09
Dec09
Mar10
Jun10
Sep10
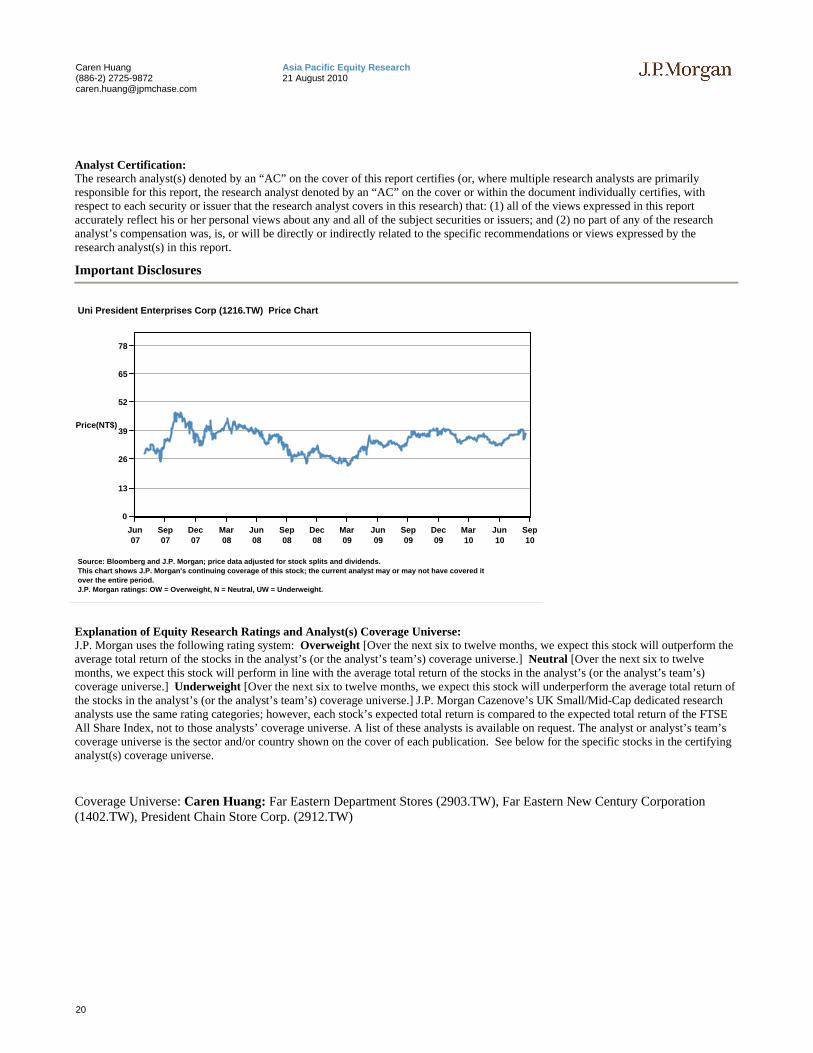
Uni President Enterprises Corp (1216.TW) Price Chart
Source: Bloomberg and J.P. Morgan; price data adjusted for stock splits and dividends.This chart shows J.P. Morgan's continuing coverage of this stock; the current analyst may or may not have covered itover the entire period.J.P. Morgan ratings: OW = Overweight, N = Neutral, UW = Underweight.
Explanation of Equity Research Ratings and Analyst(s) Coverage Universe: J.P. Morgan uses the following rating system: Overweight [Over the next six to twelve months, we expect this stock will outperform the average total return of the stocks in the analyst’s (or the analyst’s team’s) coverage universe.] Neutral [Over the next six to twelve months, we expect this stock will perform in line with the average total return of the stocks in the analyst’s (or the analyst’s team’s) coverage universe.] Underweight [Over the next six to twelve months, we expect this stock will underperform the average total return of the stocks in the analyst’s (or the analyst’s team’s) coverage universe.] J.P. Morgan Cazenove’s UK Small/Mid-Cap dedicated research analysts use the same rating categories; however, each stock’s expected total return is compared to the expected total return of the FTSE All Share Index, not to those analysts’ coverage universe. A list of these analysts is available on request. The analyst or analyst’s team’s coverage universe is the sector and/or country shown on the cover of each publication. See below for the specific stocks in the certifying analyst(s) coverage universe.
Coverage Universe: Caren Huang: Far Eastern Department Stores (2903.TW), Far Eastern New Century Corporation (1402.TW), President Chain Store Corp. (2912.TW)
21
Asia Pacific Equity Research 21 August 2010
Caren Huang (886-2) 2725-9872 [email protected]
J.P. Morgan Equity Research Ratings Distribution, as of June 30, 2010
Overweight (buy)
Neutral (hold)
Underweight (sell)
JPM Global Equity Research Coverage 46% 42% 12% IB clients* 49% 46% 31% JPMSI Equity Research Coverage 44% 48% 9% IB clients* 68% 61% 53%
*Percentage of investment banking clients in each rating category. For purposes only of NASD/NYSE ratings distribution rules, our Overweight rating falls into a buy rating category; our Neutral rating falls into a hold rating category; and our Underweight rating falls into a sell rating category.
Valuation and Risks: Please see the most recent company-specific research report for an analysis of valuation methodology and risks on any securities recommended herein. Research is available at http://www.morganmarkets.com , or you can contact the analyst named on the front of this note or your J.P. Morgan representative.
Analysts’ Compensation: The equity research analysts responsible for the preparation of this report receive compensation based upon various factors, including the quality and accuracy of research, client feedback, competitive factors, and overall firm revenues, which include revenues from, among other business units, Institutional Equities and Investment Banking.
Registration of non-US Analysts: Unless otherwise noted, the non-US analysts listed on the front of this report are employees of non-US affiliates of JPMSI, are not registered/qualified as research analysts under NASD/NYSE rules, may not be associated persons of JPMSI, and may not be subject to NASD Rule 2711 and NYSE Rule 472 restrictions on communications with covered companies, public appearances, and trading securities held by a research analyst account.
Other Disclosures
J.P. Morgan is the global brand name for J.P. Morgan Securities Inc. (JPMSI) and its non-US affiliates worldwide. J.P. Morgan Cazenove is a brand name for equity research produced by J.P. Morgan Securities Ltd.; J.P. Morgan Equities Limited; JPMorgan Chase Bank, N.A., Dubai Branch; and J.P. Morgan Bank International LLC.
Options related research: If the information contained herein regards options related research, such information is available only to persons who have received the proper option risk disclosure documents. For a copy of the Option Clearing Corporation’s Characteristics and Risks of Standardized Options, please contact your J.P. Morgan Representative or visit the OCC’s website at http://www.optionsclearing.com/publications/risks/riskstoc.pdf.
Legal Entities Disclosures U.S.: JPMSI is a member of NYSE, FINRA and SIPC. J.P. Morgan Futures Inc. is a member of the NFA. JPMorgan Chase Bank, N.A. is a member of FDIC and is authorized and regulated in the UK by the Financial Services Authority. U.K.: J.P. Morgan Securities Ltd. (JPMSL) is a member of the London Stock Exchange and is authorised and regulated by the Financial Services Authority. Registered in England & Wales No. 2711006. Registered Office 125 London Wall, London EC2Y 5AJ. South Africa: J.P. Morgan Equities Limited is a member of the Johannesburg Securities Exchange and is regulated by the FSB. Hong Kong: J.P. Morgan Securities (Asia Pacific) Limited (CE number AAJ321) is regulated by the Hong Kong Monetary Authority and the Securities and Futures Commission in Hong Kong. Korea: J.P. Morgan Securities (Far East) Ltd, Seoul Branch, is regulated by the Korea Financial Supervisory Service. Australia: J.P. Morgan Australia Limited (ABN 52 002 888 011/AFS Licence No: 238188) is regulated by ASIC and J.P. Morgan Securities Australia Limited (ABN 61 003 245 234/AFS Licence No: 238066) is a Market Participant with the ASX and regulated by ASIC. Taiwan: J.P.Morgan Securities (Taiwan) Limited is a participant of the Taiwan Stock Exchange (company-type) and regulated by the Taiwan Securities and Futures Bureau. India: J.P. Morgan India Private Limited is a member of the National Stock Exchange of India Limited and Bombay Stock Exchange Limited and is regulated by the Securities and Exchange Board of India. Thailand: JPMorgan Securities (Thailand) Limited is a member of the Stock Exchange of Thailand and is regulated by the Ministry of Finance and the Securities and Exchange Commission. Indonesia: PT J.P. Morgan Securities Indonesia is a member of the Indonesia Stock Exchange and is regulated by the BAPEPAM LK. Philippines: J.P. Morgan Securities Philippines Inc. is a member of the Philippine Stock Exchange and is regulated by the Securities and Exchange Commission. Brazil: Banco J.P. Morgan S.A. is regulated by the Comissao de Valores Mobiliarios (CVM) and by the Central Bank of Brazil. Mexico: J.P. Morgan Casa de Bolsa, S.A. de C.V., J.P. Morgan Grupo Financiero is a member of the Mexican Stock Exchange and authorized to act as a broker dealer by the National Banking and Securities Exchange Commission. Singapore: This material is issued and distributed in Singapore by J.P. Morgan Securities Singapore Private Limited (JPMSS) [MICA (P) 020/01/2010 and Co. Reg. No.: 199405335R] which is a member of the Singapore Exchange Securities Trading Limited and is regulated by the Monetary Authority of Singapore (MAS) and/or JPMorgan Chase Bank, N.A., Singapore branch (JPMCB Singapore) which is regulated by the MAS. Malaysia: This material is issued and distributed in Malaysia by JPMorgan Securities (Malaysia) Sdn Bhd (18146-X) which is a Participating Organization of Bursa Malaysia Berhad and a holder of Capital Markets Services License issued by the Securities Commission in Malaysia. Pakistan: J. P. Morgan Pakistan Broking (Pvt.) Ltd is a member of the Karachi Stock Exchange and regulated by the Securities and Exchange Commission of Pakistan. Saudi Arabia: J.P. Morgan Saudi Arabia Ltd. is authorised by the Capital Market Authority of the Kingdom of Saudi Arabia (CMA) to carry out dealing as an agent, arranging, advising and custody, with respect to securities business under licence number
22
Asia Pacific Equity Research 21 August 2010
Caren Huang (886-2) 2725-9872 [email protected]
35-07079 and its registered address is at 8th Floor, Al-Faisaliyah Tower, King Fahad Road, P.O. Box 51907, Riyadh 11553, Kingdom of Saudi Arabia. Dubai: JPMorgan Chase Bank, N.A., Dubai Branch is regulated by the Dubai Financial Services Authority (DFSA) and its registered address is Dubai International Financial Centre - Building 3, Level 7, PO Box 506551, Dubai, UAE.
Country and Region Specific Disclosures U.K. and European Economic Area (EEA): Unless specified to the contrary, issued and approved for distribution in the U.K. and the EEA by JPMSL. Investment research issued by JPMSL has been prepared in accordance with JPMSL's policies for managing conflicts of interest arising as a result of publication and distribution of investment research. Many European regulators require that a firm to establish, implement and maintain such a policy. This report has been issued in the U.K. only to persons of a kind described in Article 19 (5), 38, 47 and 49 of the Financial Services and Markets Act 2000 (Financial Promotion) Order 2005 (all such persons being referred to as "relevant persons"). This document must not be acted on or relied on by persons who are not relevant persons. Any investment or investment activity to which this document relates is only available to relevant persons and will be engaged in only with relevant persons. In other EEA countries, the report has been issued to persons regarded as professional investors (or equivalent) in their home jurisdiction. Australia: This material is issued and distributed by JPMSAL in Australia to “wholesale clients” only. JPMSAL does not issue or distribute this material to “retail clients.” The recipient of this material must not distribute it to any third party or outside Australia without the prior written consent of JPMSAL. For the purposes of this paragraph the terms “wholesale client” and “retail client” have the meanings given to them in section 761G of the Corporations Act 2001. Germany: This material is distributed in Germany by J.P. Morgan Securities Ltd., Frankfurt Branch and J.P.Morgan Chase Bank, N.A., Frankfurt Branch which are regulated by the Bundesanstalt für Finanzdienstleistungsaufsicht. Hong Kong: The 1% ownership disclosure as of the previous month end satisfies the requirements under Paragraph 16.5(a) of the Hong Kong Code of Conduct for Persons Licensed by or Registered with the Securities and Futures Commission. (For research published within the first ten days of the month, the disclosure may be based on the month end data from two months’ prior.) J.P. Morgan Broking (Hong Kong) Limited is the liquidity provider for derivative warrants issued by J.P. Morgan Structured Products B.V. and listed on the Stock Exchange of Hong Kong Limited. An updated list can be found on HKEx website: http://www.hkex.com.hk/prod/dw/Lp.htm. Japan: There is a risk that a loss may occur due to a change in the price of the shares in the case of share trading, and that a loss may occur due to the exchange rate in the case of foreign share trading. In the case of share trading, JPMorgan Securities Japan Co., Ltd., will be receiving a brokerage fee and consumption tax (shouhizei) calculated by multiplying the executed price by the commission rate which was individually agreed between JPMorgan Securities Japan Co., Ltd., and the customer in advance. Financial Instruments Firms: JPMorgan Securities Japan Co., Ltd., Kanto Local Finance Bureau (kinsho) No. 82 Participating Association / Japan Securities Dealers Association, The Financial Futures Association of Japan. Korea: This report may have been edited or contributed to from time to time by affiliates of J.P. Morgan Securities (Far East) Ltd, Seoul Branch. Singapore: JPMSS and/or its affiliates may have a holding in any of the securities discussed in this report; for securities where the holding is 1% or greater, the specific holding is disclosed in the Important Disclosures section above. India: For private circulation only, not for sale. Pakistan: For private circulation only, not for sale. New Zealand: This material is issued and distributed by JPMSAL in New Zealand only to persons whose principal business is the investment of money or who, in the course of and for the purposes of their business, habitually invest money. JPMSAL does not issue or distribute this material to members of "the public" as determined in accordance with section 3 of the Securities Act 1978. The recipient of this material must not distribute it to any third party or outside New Zealand without the prior written consent of JPMSAL. Canada: The information contained herein is not, and under no circumstances is to be construed as, a prospectus, an advertisement, a public offering, an offer to sell securities described herein, or solicitation of an offer to buy securities described herein, in Canada or any province or territory thereof. Any offer or sale of the securities described herein in Canada will be made only under an exemption from the requirements to file a prospectus with the relevant Canadian securities regulators and only by a dealer properly registered under applicable securities laws or, alternatively, pursuant to an exemption from the dealer registration requirement in the relevant province or territory of Canada in which such offer or sale is made. The information contained herein is under no circumstances to be construed as investment advice in any province or territory of Canada and is not tailored to the needs of the recipient. To the extent that the information contained herein references securities of an issuer incorporated, formed or created under the laws of Canada or a province or territory of Canada, any trades in such securities must be conducted through a dealer registered in Canada. No securities commission or similar regulatory authority in Canada has reviewed or in any way passed judgment upon these materials, the information contained herein or the merits of the securities described herein, and any representation to the contrary is an offence. Dubai: This report has been issued to persons regarded as professional clients as defined under the DFSA rules.
General: Additional information is available upon request. Information has been obtained from sources believed to be reliable but JPMorgan Chase & Co. or its affiliates and/or subsidiaries (collectively J.P. Morgan) do not warrant its completeness or accuracy except with respect to any disclosures relative to JPMSI and/or its affiliates and the analyst’s involvement with the issuer that is the subject of the research. All pricing is as of the close of market for the securities discussed, unless otherwise stated. Opinions and estimates constitute our judgment as of the date of this material and are subject to change without notice. Past performance is not indicative of future results. This material is not intended as an offer or solicitation for the purchase or sale of any financial instrument. The opinions and recommendations herein do not take into account individual client circumstances, objectives, or needs and are not intended as recommendations of particular securities, financial instruments or strategies to particular clients. The recipient of this report must make its own independent decisions regarding any securities or financial instruments mentioned herein. JPMSI distributes in the U.S. research published by non-U.S. affiliates and accepts responsibility for its contents. Periodic updates may be provided on companies/industries based on company specific developments or announcements, market conditions or any other publicly available information. Clients should contact analysts and execute transactions through a J.P. Morgan subsidiary or affiliate in their home jurisdiction unless governing law permits otherwise.
“Other Disclosures” last revised March 1, 2010.
Copyright 2010 JPMorgan Chase & Co. All rights reserved. This report or any portion hereof may not be reprinted, sold or redistributed without the written consent of J.P. Morgan.