Embed Size (px)
Citation preview
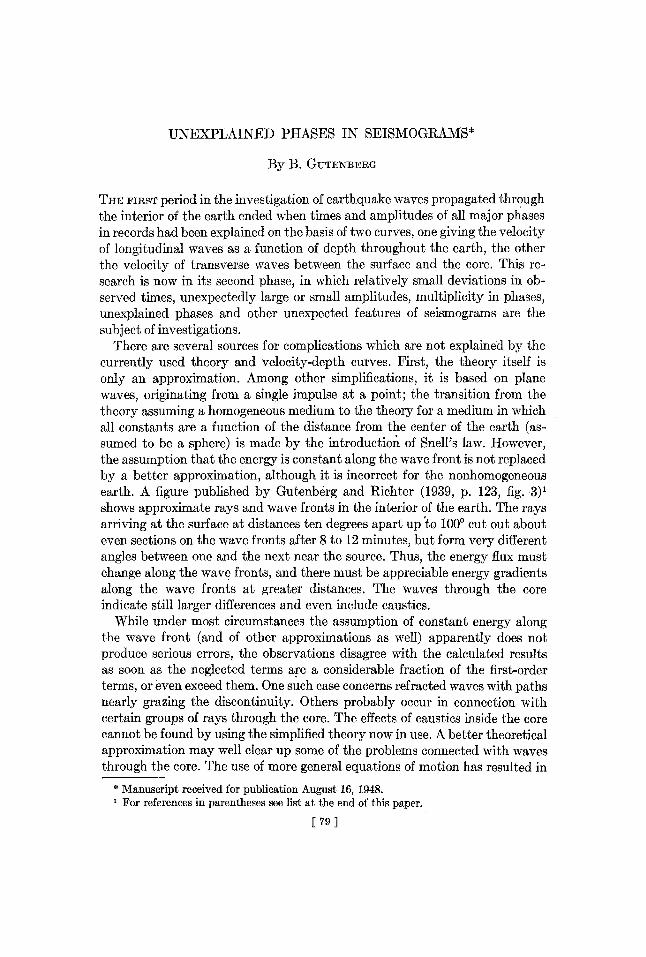
UNEXPLAINED PHASES IN SEISMOGRAMS*
By B. GUTENBERG
TH~ FIRST period in the investigation of earthquake waves propagated through the interior of the earth ended when times and amplitudes of all major phases in records had been explained on the basis of two curves, one giving the velocity of longitudinal waves as a function of depth throughout the earth, the other the velocity of transverse waves between the surface and the core. This re- search is now in its second phase, in which relatively small deviations in ob- served times, unexpectedly large or small amplitudes, multiplicity in phases, unexplained phases and other unexpected features of seismograms are the subject of investigations.
There are several sources for complications which are not explained by the currently used theory and velocity-depth curves. First, the theory itself is only an approximation. Among other simplifications, it is based on plane waves, originating from a single impulse at a point; the transition from the theory assuming a homogeneous medium to the theory for a medium in which all constants are a function of the distance from the center of the earth (as- sumed to be a sphere) is made by the introduction of Snell's law. However, the assumption that the energy is constant along the wave front is not replaced by a better approximation, although it is incorrect for the nonhomogeneous earth. A figure published by Gutenberg and Richter (1939, p. 123, fig. 3) 1 shows approximate rays and wave fronts in the interior of the earth. The rays arriving at the surface at distances ten degrees apart up to 100 ° cut out about even sections on the wave fronts after 8 to 12 minutes, but form very different angles between one and the next near the source. Thus, the energy flux must change along the wave fronts, and there must be appreciable energy gradients along the wave fronts at greater distances. The waves through the core indicate still larger differences and even include caustics.
While under most circumstances the assumption of constant energy along the wave front (and of other approximations as well) apparently does not produce serious errors, the observations disagree with the calculated results as soon as the neglected terms are a considerable fraction of the first-order terms, or even exceed them. One such case concerns refracted waves with paths nearly grazing the discontinuity. Others probably occur in connection with certain groups of rays through the core. The effects of caustics inside the core cannot be found by using the simplified theory now in use. A better theoretical approximation may well clear up some of the problems connected with waves through the core. The use of more general equations of motion has resulted in
* Manuscript received for publication August 16, 1948. i For references in parentheses see list at the end of this paper.
[~9]
80 BULLETI1N ~ OF TI=IE S E I S M O L O G I C A L S O C I E T Y OF A~c[ERICA
much better approximations for refracted waves (see, e.g., Fu, 1947). Unfor- tunately, the resulting equations are too complicated for practical use without electronic calculating machines.
Other sources of complications in seismograms have to do with the dis- continuities of the earth's crust and local differences in structure. The Mohoro- viii5 discontinuity and the boundaries between layers in the crust must be the locus of reflections and refractions, both including changes from longi- tudinM to transverse waves and vice versa. Although waves resulting from
changes from one wave type to the other usually carry only a smM1 fraction of the originM energy, they frequently will be a source of small "unexplained" phases, and are one potential factor in the observed multiplicity of phases. If there are additional discontinuities at a depth of about 80 kin. or about 160 km. (Gutenberg, 1948), still more phases would be added. In the longitudinal waves all these phases should follow the direct unchanged phase, in the trans- verse phases they should precede it; they may partly be the cause of the multi- plicity described by Gutenberg and Richter (1934) and Bath (1947). Investi- gations by Vesanen (1942, 1946) leave no doubt that it is more the structure of the earth than the mechanism of the earthquake which is responsible for the multiplicity of phases. In addition, Gutenberg and Richter found evidence for a relatively large number of travel-time curves for small phases with un- explained paths; they were indicated by letters. Many of these phases are observed regularly in routine measuring of seismograms.
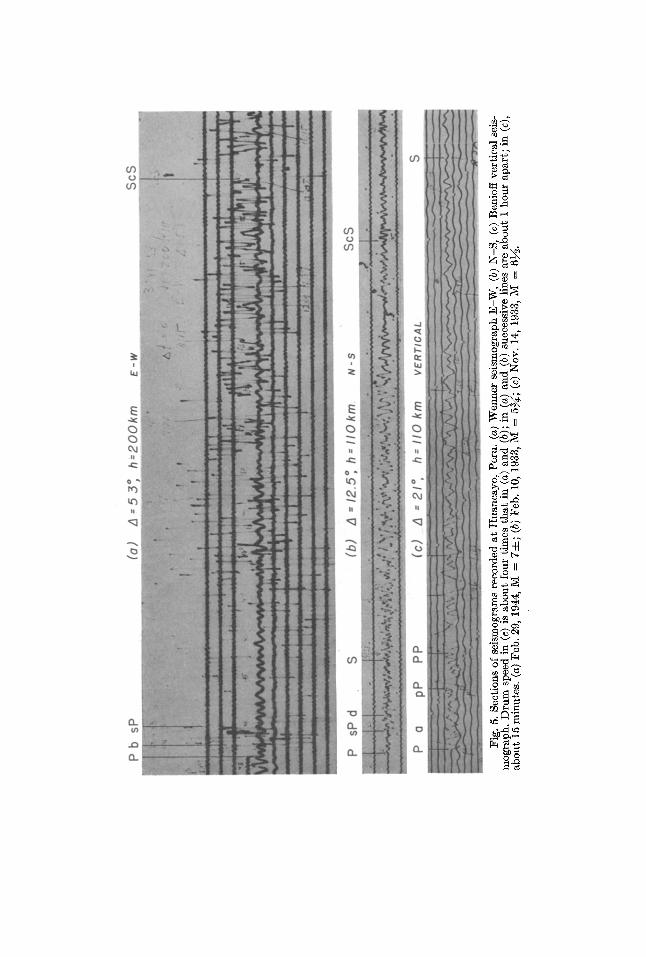
For an investigation of the various kinds of unexplained phases the author selected more than 100 deep-focus earthquakes originating at epicentral dis- tanees from 1 ° to about 30 ° from Huancayo, Peru, and recorded there at the station of the Carnegie Institution of Washington between 1933 and 1944; for this period the records of the two horizontal Wenner instruments (maximum magnification about 1400 for periods of 5 to 8 seconds; drum speed about 15 mm. per minute) and the Benioff vertical (drum speed 60 mm. per minute) are on file at the Seismological Laboratory, Pasadena. The records of the hori- zontal instruments with their rather low drum speed and frequently not sharply defined minute marks (figs. 2 to 5, b) provide less accurate time data than those of the vertical (fig. 5, c). However, the latter was not always oper- ating, and for a longer period it was not properly adjusted.
The elements of the shocks were taken from Gutenberg and Richter (1948). Deep4ocus earthquakes were selected, since surface waves do not cover the later phases so much as in shallow shocks. Besides, it was expected that the changes of travel times t with focM depth h at a given distance A may aid in the interpretation of new phases. A table given by Gutenberg and Richter (1936, table 5, p. 346) can be used to calculate the velocity with which a wave starts at a given depth, if Ot/OA and Ot/Oh for given h and A are known. Thus, it can be decided whether the wave under consideration leaves the focus as a

U~TEXPLAINED PHASES IN SEISMOGRAMS 81
longitudinal or transverse wave. On the other hand, the focal depth introduces a new element with its errors, and the var ie ty of its values necessitates the combination of da ta f rom a larger range of depths than tha t used in shallow shocks.
5 5
4 4
2 ~ 2 • o
h -" 2 0 0 k in.
8 ° 15 ° '° A :~ 15 ° 4 ° 7 .5"
Fig. 1. Travel times of phases recorded at Huancayo, Peru. Circles correspond to hori- zontal components, crosses to vertical components; full circles and .larger crosses indicate stronger or clearer phases; barred curves are calculated travel-time curves for reflections at a depth of 1,000 kin.
Phases on the records were measured and graded, and their t ravel times were calculated as well as t ravel- t ime differences against the observed t ime of P. Such t ravel- t ime differences eliminate errors in the assumed origin time, and the calculated t ime differences are less affected b y errors in the location of the epicenters and the assumed focal depth than the travel t imes themselves.

J~
Q 0
" ~ I I I I
0
I I I I
o
Q
I I I !
"i ~
ko~
~ga
~ - .® ® Z ~
re e " ~ tl
~au4~

I !
I !
"4-.
Q.
. 0
n
~OC~
T~
0 .
c~
~o

II
I
O
~ oo
0
0
UNEXPLAINED PI tASE$ IN SEISMOGRAMS 85
Both kinds of time data were plotted for certain ranges of focal depth (80 to 150 kin.; 160 to 250 km.; 550 to 650 kin.) as a function of epicentral distance, as well as for given ranges of distance (mainly 4 ° to 6°; 14 ° to 15°; 18 ?2 to 21 .°6) as a function of focal depth. Data for four shocks with focal depths between 260 and 290 km. were included in the latter curves only. No shocks are known distant less than 40 ° from I-Iuancayo with focal depths between 300 and 550 kin. Figure 1 gives sections of travel-time curves, and in figures 2 to 5 parts of seismograms are reproduced.
Most of the observed times of P are close to the calculated travel-time curves. This was to be expected, since they were used in the calculations of the elements of the ear}hquakes; and together with the times of P at La Paz they were of considerable influence in the resulting locations. However, the assumed origin times and focal depths of the shocks depend rather little on the data for Huancayo.
Accurate determination of the travel-time curves for S is rather difficult. Frequently, the impulse considered to correspond to S in measuring the seis- mograms was found to belong to a different phase when it was plotted. Appar- ently rather large phases with travel times close to those for S exist at certain distances (see, e.g., fig. 2, b), and may be taken as S especially where S is rela- tively small. Consequently, in the range of distances corresponding to the shadow zone of S, amplitudes of S should not be used for determinations of earthquake magnitudes.
The seismograms used in the present investigation confirm previous findings of many authors that S frequently begins with relatively small waves ("eS"), followed by one or more larger impulses (see, e.g., fig. 5). It is often difficult to decide where the "S group" begins. Some of the earlier waves have probably traveled as longitudinal waves through part or all of the crustal layers, and possibly even through part of the deeper material. Consequently, it is not unlikely that the travel times considered now to be those for direct transverse waves are too small, and the calculated velocities of S in the interior of the earth slightly too high. Fortunately, the apparent velocity of S plays a much greater role in the velocity calculations than its travel time; the latter is more significant mainly in calculations concerning the crust and at distances imme- diately following the shadow zone where previous calculations indicated that the arrival times of the phase considered to be S were rather early (Gutenberg, 1948, p. 145).
In general, good agreement between observed and calculated travel times was found for sP. This is due to the fact that sP follows P after a time interval depending mainly on the focal depth, which is relatively well known for the shocks under investigation. The most outstanding later phase in many records is ScS (see, e.g., figs. 4 and 5), but its observed travel times scatter some- what about the calculated curves, with deviations occasionally exceeding
v O
0 ~2 •
~vo
"~.~

U N E X P L A I N E D P H A S E S I N SEISMOGRA~IS 87
10 seconds. This can be expected for the same reasons which were mentioned in connection with S. The large impulse of ScS is usually later than given by the travel-time curves, the emergent beginning of ScS frequently too early.
In many records there are definite impulses at times when other phases re- flected from the core are to be expected (PEP, pPcP, sPcP, ScP, PcS, etc); sScS is frequently a clear phase; it has been described by Hayes (1936). The distance at which PP and pP begin depends on the focal depth. Where they exist, they have been observed close to the time given by the calculated curves. The reason for the good agreement is the same as for sP. A phase which has been interpreted as pP is frequently observed at much shorter distances than the minimum given by the theory. Although some diffracted pP waves are to be expected at distances slightly shorter than the theoretical minimum dis- tance, it is not likely that these waves have appreciable amplitudes, since the corresponding P waves are very small; the shadow zone for pP and PP in shocks at focal depths less than 200 km. is expected to be even more strongly developed than that for P, and must occur near the shortest distances where pP and PP exist. However, for certain focal depths other phases to be dis- cussed next are recorded approximately at the time when pP would be ex- pected, if its theoretical travel-time curve could be extrapolated to smaller distances.
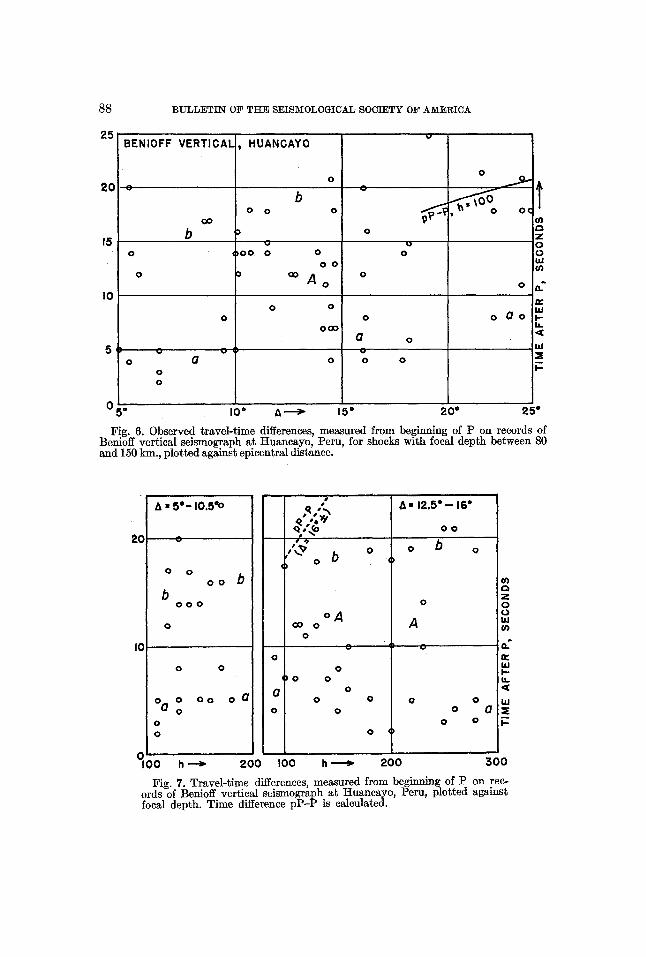
The first prominent phase following P has been marked by "a" in the present paper. In records of shocks originating at depths of about 100 km., a arrives about 4 seconds after P at distances near 4 °, and this interval increases to about 5 seconds at 15 °. Data are not as yet sufficient to permit us to decide whether this time interval continues to increase to about 10 seconds at 30 ° or whether observations there belong to a different phase. The time interval a-P does not change noticeably with increasing focal depth h between 100 and 200 km. at epicentral distances A from 5 to 10 ° (fig. 7). Near A = 15 ° the time interval seems to decrease slightly when h increases from 100 to 300 kin. (fig. 7).
The phase a is frequently clear in the records of the horizontal components, which were not used in figures 6 and 7 on account of the lower time accuracy. In general, a shows properties that are to be expected from a phase which has changed from longitudinal to transverse at a discontinuity in the crust. I t is not possible to calculate the depth of this discontinuity accurately, since the velocities in the surface layers in South America are not well enough known. The time interval between P and a phase refracted from P to S at a discon- tinuity shallower than the focus should have a minimum for vertical rays and should increase with increasing angle of incidence. In addition, it depends on the apparent velocity of P. Thus, it should have a minimum at zero distance, increase slightly with distance roughly to the point of inflection of the travel- time curve of P, and there depend on changes in the apparent velocity of P.
88 B U L L E T I N O F T H E S E I S M O L O G I C A L S O C I E T Y O F AMEI%ICA
B E N I O F F V E R T I C A L 25
2 0 o
O0
b ;5
o
0
I0
0
5 o o o O
0 0
0 5 °
, H U A N G A Y O
b O o
)
O ~OO O O
O O
/.4 O
o
0 0 o 0
a
0 0
o
0
O (
o a o
£3
,o, ¢n
. r
=£ ! -
I 0 ° ,~ > 15 = 2 0 ° 2 5 =
Fig. 6. Observed travel-time differences, measured from beginning of P on records of Benioff vertical seismograph at Huancayo, Peru, for shocks with focal depth between 80 and 150 km., plotted against epicentral distance.
2 0
IC
A • 5 * - 10.5"o
0
o o o o b
b 0 o o
0
0
o 0 o 0
0
0
0100 h
0
o o o a a
o
/
0
o,4 O0 0
0 0
0 0 0
0 0
0
A= 12.5"- - 16"
O 0
o o b o (
0
A
O 0 0 0
0 O
0
,,o
a" IZ
H O :E
p
2 0 0 I 0 0 h ~ 2 0 0 3 0 0
Fig. 7. Travel-time differences, measured from beginning of P on rec- ords of Benioff vertical seismograph at tIuancayo, Peru, plotted against focal depth. Time difference pP-P is calculated.

UNEXPLAINED PHASES IN SEISMOGRAMS 89
In intermediate and deep shocks this time interval should not depend much on focal depth, since for loci below about 100 kin. the angle of incidence changes only slowly with focal depth h. In shocks at intermediate depth in regions of continental structure longitudinal waves changing to transverse at a depth d kilometers (d < h) should arrive roughly d/9 seconds after P near the epicenter, and roughly d/7 seconds at a distance of 30 °. This would give approximately d = 40 kin. for a. Under the Andes, such a depth could cor- respond either to the NfohoroviSi6 discontinuity or to an internal crustal dis- continuity.
There are a few distinct impulses about 10 seconds after P which are marked A in figures 6 and 7. If they, too, originate from refraction of a P wave to S, the corresponding discontinuity should be at a depth of about 80 km. The next Clear phase has been marked b (examples in fig. 2). If the interval b-P is plotted against distance for shocks with a focal depth near 100 km., the points fall close to the extrapolated curve for pP-P (fig. 6); however, the change of b-P with focal depth for a given distance differs distinctly from that of pP-P (fig. 7). This excludes the possibility that b at the shorter distances is pP. If it is another phase transformed from P into S, the corresponding depth would be roughly 140 km. The depths of about 80 and about 150 to 180 kin. had been considered previously (Gutenberg, 1948, p. 147) as possible locations for dis- continuities, the first with a small sudden decrease, the second with a corre- sponding increase in velocity.
There are phases later than b which may belong to this group (for example, d in figs. 2 and 5), but their interpretation is doubtful.
Another group of phases is characterized by travel-time curves beginning about horizontally for distances of a few degrees and then approaching a direc- tion similar to that of the P or S curve. These phases could have been reflected from a discontinuity deeper than the focus. Similarly to the reflections from the core, each such discontinuity would produce ten distinct phases. The data do not permit us to identify any such phase from the observations. As a test, travel-time curves were constructed for the ten phases reflected from an assumed discontinuity at a depth of 1,000 kin. These calculated curves, marked P1P, PP1P, etc., are entered in figure 1. There is little doubt that several of them-are followed by clusters of observed points, but other clusters of points seem to follow lines of similar trend but not given by the calculations (e.g., about 20 seconds preceding P1P in fig. 1, h = 100 km.). Possibly, the depth of reflection is somewhat shallower; but no definite conclusion can be drawn. Savarenskii (1941) found indications of a boundary at a depth of about 900 km., but, owing to insufficiency of material, could not make a more exact determination.
A discontinuity at a depth between 900 and 1,000 kin. is not improbable. Wiechert and Zoeppritz (1907) had observed in 1906 tha t at an epicentra]

90 BULLETIN OF T H E SEISMOLOGICAL SOCIETY OF AMERICA
distance of about 44 ° the apparent velocity of P waves suddenly ceases to increase, and that a similar change occurs at about 48 ° for S. They calculated for the rays emerging there a maximum depth of about 1,500 km., and found that the wave velocities become about constant below this critical depth. Recent calculations based on more accurate material (for a summary see Macelwane, 1939, fig. 14, p. 264) indicate that the corresponding critical depth is only about 1,000 kin. deep or even slightly less. I t seems that already at an epicentral distance of about 40 ° the travel-time curve begins to approach a straight line, and in shallow shocks the amplitudes of P decrease by a factor 1/2 or even stronger between distances of about 40 ° and 43 ° (for a summary, data, and references see Gutenberg and Richter, 1935, esp. p. 314). A similar decrease in amplitudes has been observed for PP at a distance of about 85 °. With increasing focal depth the zone with relatively small P waves moves to shorter distances (Gutenberg, 1945, fig. 2, p. 123). The whole group of ampli- tude and time observations has been explained by Gutenberg and Richter (1939, p. 134), under the assumption that the velocity of the waves becomes about constant at a depth of about 900 km. and increases below a depth of 1,000 km. at a rate smaller than that in the upper mantle. Results of Jeffreys (1939, p. 511) give a somewhat smoother curve, with a change in curvature at a depth of about 900 km. With the possibility of waves reflected at a depth between 900 and 1,000 km., a different interpretation must be considered; all results could be explained under the assumption that the P phases observed at distances between about 40 ° and 43 ° are diffracted waves, that the velocity of P (and possibly S) decreases suddenly by a relatively small amount near a depth of 900 km., and that below that critical depth the velocity increases more slowly with depth than above.
The old interpretation was consistent with the assumption that below the critical depth the composition is changing at a rate different from that above; the new interpretation would rather indicate a sudden change in material or state. In the previous interpretation the small amplitudes would have been caused by an approximately constant velocity between 900 and 1,000 km. depth, with velocities increasing with depth on both sides, but at different rates; in the new interpretation there would be an actual ~hadow zone with diffracted waves, and with reflections and refractions at the discontinuity. Further investigations are needed to decide which type of interpretation is correct.
The seismograms used in the present s~udy show many more definite phases, many of which have been marked and measured but thus far have not been investigated in detail.
Those preceding S probably include waves which have changed from trans- verse to longitudinal in the upper layers. However, the latter are expected to be less numerous than the corresponding phases following P, since the ratio of the

UNEXPLAINED PHASES IN SEISMOGRAMS 91
transverse velocity on the side of the incident wave to the longitudinal ve- locity on the other side gives an upper limit for the sine of the angle of incidence for the incident transverse wave, usually corresponding to an angle of less than 40 ° .
Another group of interesting waves are those arriving late in the seismo- grams. In the records of shocks from a depth of about 600 km., where no short- period surface waves can be expected, there are waves arriving well over one hour after ]) even at short epicentral distances (see, e.g., the line below the beginning of the shock in fig. 4, b). Most of these are probably multiple re- flected waves and probably include waves through the core.
SUMMARY
Seismograms of more than 100 deep-focus earthquakes originating at epicentral distances from 1 ° to about 30 ° from Huancayo, Peru, and recorded there, are used in an investigation of unexplained phases. Three groups of waves, fol- lowing P after about 5, 10, and 20 seconds, are possibly waves which have changed from longitudinal to transverse at depths of roughly 40, 80, and 150 km., respectively. Other phases may be waves reflected at a depth of between 900 and 1,000 kin. The possibility of a sudden small decrease in wave velocity there is discussed. Other observed unexplained phases are mentioned. Reasons are discussed for usually minor disagreements between observed and calculated times, as well as amplitudes of phases in seismograms.
REFERENCES B~,TH, M.
1947. "Travel times of the principal earthquake waves ~for Uppsala," Bull. Geol. Inst. of Upsala, 32:105-129.
Fu, C. Y. 1947. "On seismic rays and waves," Bull. Seism. Soc. Am., 37:331-346.
GUTENBERG, B. 1945. "Magnitude determination for deep-focus earthquakes," Bull. Seism. Soc. Am.,
35:117-130. 1948. "On the layer of relatively low wave velocity at a depth of about 80 km.," Bull.
Seism. Soc. Am., 38:121-148. GUTENBERG, B., and RICHTER, C. F.
1935. "On seismic waves. II," Gerlands Beitr. z. Geophysik, 45:280-360. 1936. "Materials for the study of deep-focus earthquakes," Bull. Seism. Soc. Am.,
26:341-390. 1938. "P' and the earth's inner core," Mon. Not. Roy. Astron. Soc., Geophys. Suppl.,
4:363-372. 1939. "On seismic waves. IV," Gerlancls Beitr. z. Geophysik, 54:94-136. 1948. Seismicity of the Earth and Related Phenomena, Princeton University Press (in
press). HAYES, R. H.
1936. "A new phase in deep-focus earthquakes," Dominion Obs., Wellington, Bull. 107. [Reprinted from New Zealand Jour. of Sci. and Technology, Vol. 17, pp. 553-562 (1935).]

92 BULLETIN OF THE SEISMOLOGICAL SOCIETY OF A~C~ERICA
JEFFREYS, H. 1939. "Times of P, S, SKS, and velocities of P and S," Mon. Not. Roy. Astron. Soc.,
Geophys. Suppl., 4: 498-547. MAC~LWAN~, J. B.
1939. "Evidence on the interior of the earth derived from seismic sources," in Internal Constitution of the Earth, New York, McGraw-Hill Book Co.
SAVARENSKII, E. F. 1941. "Seismic waves reflected from a boundary at a depth of 900 km.," Acad. Nauk,
S.S.S.R., Trudy Seismol. Inst. Moscow, No. 106:6-8; abstract in "Geophysical Abstracts 121," U" S. Bureau of Mines, I.C. 7338 (1945), abs. no. 7982.
VESANEN, E. 1942. "Ueber die typenanalytische Auswertung der Seismogramme," Ann. Acad. Sci.
Fennicae, Ser. A, III, No. 5, 244 pp. 1946. "On seismogram types and focal depth of earthquakes in the north Japan and
Manchuria region, ibid., No. 12: 7-25. 1947. "OnAlaska earthquakes," ibid., No. 14: 5-21.
WmCHERT, E., and ZOEPFnITZ, K. 1907. "Ueber Erdbebenwellen," Nachr. Ges. d. Wiss. GSttingen, 135 pp.
CALIFORNIA INSTITUTE OF TECHNOLOGY~ PAsADENA~ .CALIFORNIA. (Balch Graduate School of the Geological Sciences, Contribution No. 462.)