Embed Size (px)
Citation preview
Unexpected Diversity and Expression of Avian EndogenousRetroviruses
Mohan Bolisetty,a Jonas Blomberg,b Farid Benachenhou,b Göran Sperber,c and Karen Beemona
Department of Biology, Johns Hopkins University, Baltimore, Maryland, USAa; Section of Virology, Department of Medical Sciences, Uppsala University, Uppsala, Swedenb;and Section of Physiology, Department of Neuroscience, Uppsala University, Uppsala, Swedenc
ABSTRACT Endogenous retroviruses (ERVs) were identified and characterized in three avian genomes to gain insight into earlyretroviral evolution. Using the computer program RetroTector to detect relatively intact ERVs, we identified 500 ERVs in thechicken genome, 150 in the turkey genome, and 1,200 in the zebra finch genome. Previous studies suggested that endogenousalpharetroviruses were present in chicken genomes. In this analysis, a small number of alpharetroviruses were seen in thechicken and turkey genomes; however, these were greatly outnumbered by beta-like, gamma-like, and alphabeta proviruses.While the avian ERVs belonged to the same major groups as mammalian ERVs, they were more heterogeneous. In particular, thebeta-like viruses revealed an evolutionary continuum with the gradual acquisition and loss of betaretroviral markers and a tran-sition from beta to alphabeta and then to alpharetroviruses. Thus, it appears that birds may resemble a melting pot for early ERVevolution. Many of the ERVs were integrated in clusters on chromosomes, often near centromeres. About 25% of the chickenERVs were in or near cellular transcription units; this is nearly random. The majority of these integrations were in the sense ori-entation in introns. A higher-than-random number of integrations were >100 kb from the nearest gene. Deep-sequencing stud-ies of chicken embryo fibroblasts revealed that about 20% of the 500 ERVs were transcribed and translated. A subset of thesewere also transcribed in vivo in chickens, showing tissue-specific patterns of expression.
IMPORTANCE Studies of avian endogenous retroviruses (ERVs) have given us a glimpse of an earlier retroviral world. Three dif-ferent classes of ERVs were observed with many features of mammalian retroviruses, as well as some important differences.Many avian ERVs were transcribed and translated.
Received 9 September 2012 Accepted 11 September 2012 Published 16 October 2012
Citation Bolisetty M, Blomberg J, Benachenhou F, Sperber G, and Beemon K. 2012. Unexpected diversity and expression of avian endogenous retroviruses. mBio 3(5):e00344-12. doi:10.1128/mBio.00344-12.
Editor Stephen Goff, Columbia University
Copyright © 2012 Bolisetty et al. This is an open-access article distributed under the terms of the Creative Commons Attribution-Noncommercial-Share Alike 3.0 UnportedLicense, which permits unrestricted noncommercial use, distribution, and reproduction in any medium, provided the original author and source are credited.
Address correspondence to Karen Beemon, [email protected].
M.B. and J.B. contributed equally to this article.
Chromosomal integration, an essential part of the retrovirallifestyle, generates endogenous retroviruses (ERVs) when
germ line cells are infected; this leads to their vertical transmission(1, 2). Because of this intimate connection between host and virus,a predominant evolutionary pattern is that the virus follows theevolution of its host. Thus, the expected major avian retroviralrepertoire should be based on retroviral variants extant in verte-brates �100 million years ago (3, 4). However, horizontal transferbetween highly divergent branches in the vertebrate tree can alsooccur. Prime examples are the infection of birds by the reticulo-endotheliosis virus (5) and the infection of marsupials (koalas) (6)and primates (gibbons) (6, 7) by a murine leukemia virus. Thus,avian retroviral evolution is expected to be a composite of verticaland horizontal transmission.
Endogenous proviruses once contained the full set of regula-tory elements present in exogenous viruses. However, over manymillions of years of evolution, most of these regulatory elementshave mutated and are thought to have little impact on currentgene expression or regulation (8). Random integration events cre-ate genetic diversity and variance in gene expression that can im-pact the reproductive fitness of an organism. For example, the
expression of salivary amylase in humans is controlled by a retro-virus inserted upstream of the salivary amylase gene (9).
In the present work, we examined the evolution of avian ret-roviruses on the basis of their fossil remnants in the three aviangenomes that have been completely sequenced: two galliformbirds, the chicken (Gallus gallus) (10) and the turkey (Meleagrisgallopavo) (11), and a passeriform bird, the zebra finch (Taeniopy-gia guttata) (12). The chicken and turkey are separated by around40 million years (13), while the zebra finch is separated from theothers by around 100 million years (13–15). The chicken and tur-key, but not the zebra finch, were found to have a lower ERVdensity than most vertebrates. Avian ERVs had features of thethree major exogenous retroviral classes: gammaretroviruses, be-taretroviruses, and spuma-like retroviruses (16 –17). However,most of the avian ERVs were distinct from those of other verte-brates. We also saw ERVs with mixed genomes. Retroviral taxo-nomic markers, developed for mammalian retroviruses, segre-gated independently, suggesting steps of marker acquisition andloss during retroviral evolution. The well-studied alpharetrovi-ruses (ALVs) seem to have evolved from beta-like precursors lateduring avian evolution. An alphabeta clade, intermediate between
RESEARCH ARTICLE
September/October 2012 Volume 3 Issue 5 e00344-12 ® mbio.asm.org 1
Dow
nloa
ded
from
http
s://j
ourn
als.
asm
.org
/jour
nal/m
bio
on 0
2 Ja
nuar
y 20
22 b
y 49
.232
.174
.201
.
alpha and beta proviruses, included some earlier recognized en-dogenous avian (EAV) proviruses (18).
We saw a random number of ERV integrations in chicken tran-scription units but a greater-than-random number of integrations�100 kb away from annotated genes. There were also clusteredintegrations in the bird chromosomes; some of these were near thecentromeres. Interestingly, 20% of the endogenous provirusesidentified were transcribed and translated in chicken embryo fi-broblasts (CEFs); a subset of these were also transcribed in vivo inchickens.
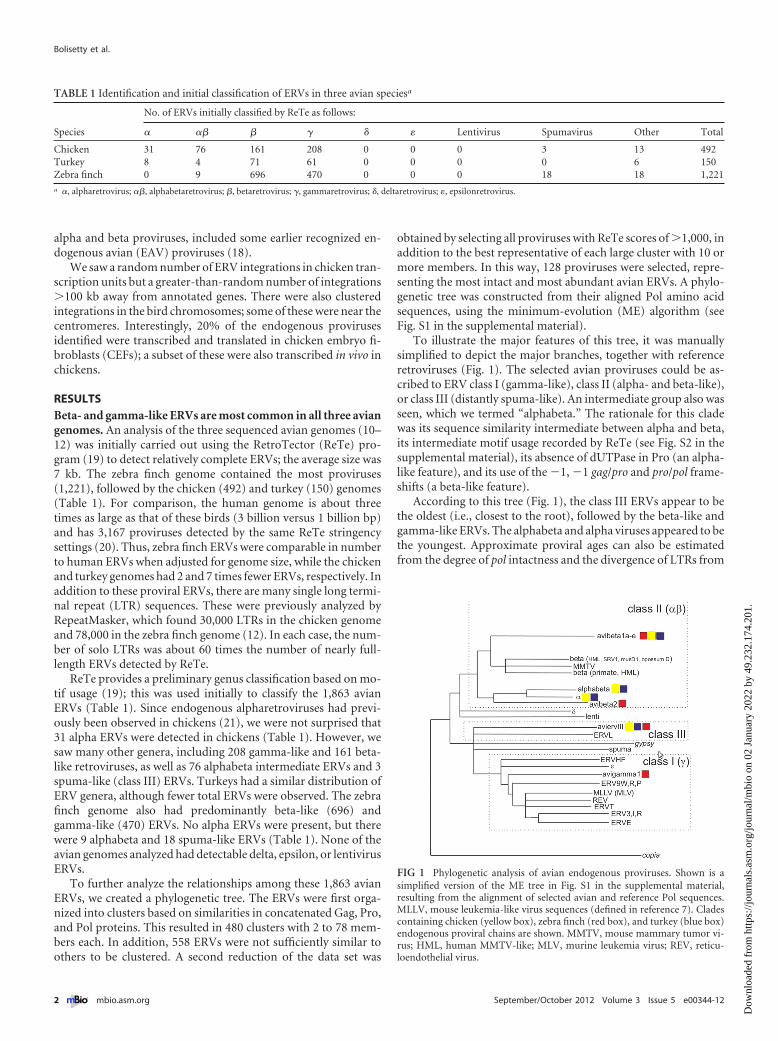
RESULTSBeta- and gamma-like ERVs are most common in all three aviangenomes. An analysis of the three sequenced avian genomes (10–12) was initially carried out using the RetroTector (ReTe) pro-gram (19) to detect relatively complete ERVs; the average size was7 kb. The zebra finch genome contained the most proviruses(1,221), followed by the chicken (492) and turkey (150) genomes(Table 1). For comparison, the human genome is about threetimes as large as that of these birds (3 billion versus 1 billion bp)and has 3,167 proviruses detected by the same ReTe stringencysettings (20). Thus, zebra finch ERVs were comparable in numberto human ERVs when adjusted for genome size, while the chickenand turkey genomes had 2 and 7 times fewer ERVs, respectively. Inaddition to these proviral ERVs, there are many single long termi-nal repeat (LTR) sequences. These were previously analyzed byRepeatMasker, which found 30,000 LTRs in the chicken genomeand 78,000 in the zebra finch genome (12). In each case, the num-ber of solo LTRs was about 60 times the number of nearly full-length ERVs detected by ReTe.
ReTe provides a preliminary genus classification based on mo-tif usage (19); this was used initially to classify the 1,863 avianERVs (Table 1). Since endogenous alpharetroviruses had previ-ously been observed in chickens (21), we were not surprised that31 alpha ERVs were detected in chickens (Table 1). However, wesaw many other genera, including 208 gamma-like and 161 beta-like retroviruses, as well as 76 alphabeta intermediate ERVs and 3spuma-like (class III) ERVs. Turkeys had a similar distribution ofERV genera, although fewer total ERVs were observed. The zebrafinch genome also had predominantly beta-like (696) andgamma-like (470) ERVs. No alpha ERVs were present, but therewere 9 alphabeta and 18 spuma-like ERVs (Table 1). None of theavian genomes analyzed had detectable delta, epsilon, or lentivirusERVs.
To further analyze the relationships among these 1,863 avianERVs, we created a phylogenetic tree. The ERVs were first orga-nized into clusters based on similarities in concatenated Gag, Pro,and Pol proteins. This resulted in 480 clusters with 2 to 78 mem-bers each. In addition, 558 ERVs were not sufficiently similar toothers to be clustered. A second reduction of the data set was
obtained by selecting all proviruses with ReTe scores of �1,000, inaddition to the best representative of each large cluster with 10 ormore members. In this way, 128 proviruses were selected, repre-senting the most intact and most abundant avian ERVs. A phylo-genetic tree was constructed from their aligned Pol amino acidsequences, using the minimum-evolution (ME) algorithm (seeFig. S1 in the supplemental material).
To illustrate the major features of this tree, it was manuallysimplified to depict the major branches, together with referenceretroviruses (Fig. 1). The selected avian proviruses could be as-cribed to ERV class I (gamma-like), class II (alpha- and beta-like),or class III (distantly spuma-like). An intermediate group also wasseen, which we termed “alphabeta.” The rationale for this cladewas its sequence similarity intermediate between alpha and beta,its intermediate motif usage recorded by ReTe (see Fig. S2 in thesupplemental material), its absence of dUTPase in Pro (an alpha-like feature), and its use of the �1, �1 gag/pro and pro/pol frame-shifts (a beta-like feature).
According to this tree (Fig. 1), the class III ERVs appear to bethe oldest (i.e., closest to the root), followed by the beta-like andgamma-like ERVs. The alphabeta and alpha viruses appeared to bethe youngest. Approximate proviral ages can also be estimatedfrom the degree of pol intactness and the divergence of LTRs from
TABLE 1 Identification and initial classification of ERVs in three avian speciesa
Species
No. of ERVs initially classified by ReTe as follows:
� �� � � � � Lentivirus Spumavirus Other Total
Chicken 31 76 161 208 0 0 0 3 13 492Turkey 8 4 71 61 0 0 0 0 6 150Zebra finch 0 9 696 470 0 0 0 18 18 1,221a �, alpharetrovirus; ��, alphabetaretrovirus; �, betaretrovirus; �, gammaretrovirus; �, deltaretrovirus; �, epsilonretrovirus.
FIG 1 Phylogenetic analysis of avian endogenous proviruses. Shown is asimplified version of the ME tree in Fig. S1 in the supplemental material,resulting from the alignment of selected avian and reference Pol sequences.MLLV, mouse leukemia-like virus sequences (defined in reference 7). Cladescontaining chicken (yellow box), zebra finch (red box), and turkey (blue box)endogenous proviral chains are shown. MMTV, mouse mammary tumor vi-rus; HML, human MMTV-like; MLV, murine leukemia virus; REV, reticu-loendothelial virus.
Bolisetty et al.
2 ® mbio.asm.org September/October 2012 Volume 3 Issue 5 e00344-12
Dow
nloa
ded
from
http
s://j
ourn
als.
asm
.org
/jour
nal/m
bio
on 0
2 Ja
nuar
y 20
22 b
y 49
.232
.174
.201
.
one another (see Table S1 in the supplemental material). Thisanalysis suggested an evolutionary continuum leading from be-taretroviruses to alphabetaretroviruses to alpharetroviruses,where the latter two steps occurred mainly in galliform birds.
Major branches of this tree were used to group the ERVs intosix Pol-based clades (Fig. 1) using a custom tree-directed groupingalgorithm (J. Blomberg, unpublished data). The clades werenamed avibeta1a to -e (avibeta1 contains five subclades), avibeta2,alphabeta, alpha, avian ERV III (aviervIII), and avigamma1. Themembers of each clade had related pol sequences and other pro-viral features, as shown in Table S1. The total of 1,863 provirusesidentified were next distributed into six clades and five subclades,where possible, by BLAST analysis of proviral DNA, as well as Gag,Pro, and Pol consensus amino acid sequences. The highest-scoring representative of each clade was compared with each ofthe 1,863 proviruses. Table S1 shows the number of ERVs in thetotal set that could be mapped to one of these clades. The BLASTscore limits for inclusion in a clade varied according to the se-quence compared (see Materials and Methods). The classificationwas based mainly on proviral DNA similarity, but concatenatedGag, Pro, and Pol sequences were also used and yielded very sim-ilar results. Altogether, 46% of the 1,863 proviruses could be clas-sified into one of the clades in this fashion (see Table S1).
We also searched in GenBank for previously published avianERVs (22–25). All 23 ERVs identified previously were representedin minor clades within the 1,863 sequences (see Table S2 in thesupplemental material). In two cases (FET-1 and Chirv1), anoverlap with avigamma1 occurred. Otherwise, these clades did notoverlap the major clades identified in this paper (see Table S1).
The avian class I sequences included one clade, the aviangamma clade (avigamma1), which was observed in all three avianspecies but was most common in the zebra finch. The avigamma1clade was quite homogeneous, and members commonly demon-strated the typical gammaretrovirus 0, 0 frameshift strategy and agamma env gene containing the conserved immunosuppressivedomain in the transmembrane protein (26). All members also hada GPY/F domain in integrase, which is common among gamma-retroviruses. Their closest relatives were the gammaretrovirus-likehuman ERV HERV-W, an opossum ERV, and the walleye dermalsarcoma virus, an epsilonretrovirus.
In contrast, the avian class II ERVs were classified into fourmajor clades, alpha-like, alphabeta-like, avian beta-like 1 (avi-beta1), and avibeta2. Further, the avibeta1 clade was divided intofive subclades (see Table S1 in the supplemental material) basedon sequence similarity, the host, and the presence or absence oftaxonomic markers. Four of these subclades contained zebra finchERVs, while avibeta1c was most common in chickens and turkeys.Avibeta1e contained mainly chicken and zebra finch ERVs. Thefive subclades illustrated that some of the beta taxonomic markers,including Pol similarity and the presence of dUTPase in Pro andtwo zinc fingers in the Gag nucleocapsid protein, were representedin specific patterns in each of the subclades (see Table S1), whilethe beta �1, �1 frameshift pattern was common to all. None ofthe avian ERVs we identified had the mammalian betaretroviralmarker Gpatch in protease (data not shown), as previously ob-served (27).
The avibeta2 clade was more homogeneous than avibeta1. Itlacked dUTPase in Pro, had two zinc fingers in Gag, and fre-quently had the �1, �1 frameshift combination, although 0, �1frameshifts also occurred. Its most closely related exogenous ret-
rovirus was the lymphoproliferative disease virus of turkeys,which used a �1, �1 frameshift (data not shown). Even closer tothe origin of the betaretroviral branch was a Python molurus ret-roviral sequence (see Fig. S1 in the supplemental material), whichalso used the �1, �1 strategy. This suggests that the frameshiftpatterns of late offshoots from the beta branch were acquired latein evolution. The primer-binding site of avibeta2 was frequentlycomplementary to the phenylalanine tRNA; in contrast, mamma-lian betaretroviruses typically use a lysine tRNA primer for reversetranscription.
Interestingly, the avibeta2 envelope proteins were very similarto the envelopes of the avigamma1 clade. Thus, a recombinationevent between beta and gamma ERVs appears to have occurredduring the evolution of the zebra finch. Several of the avibeta2proviruses were also recombinants with EAV51-like (18, 28) al-phabeta proviruses in the distal portion of Pol (data not shown).Cross-clade recombinations were also detected in other clades,including the alphabeta, avibeta1, and aviervIII clades, and usuallyinvolved envelope (see Table S1 in the supplemental material).
Envelope genes were delineated by ReTe in only a few of the128 selected proviruses, belonging to the avibeta1c, avibeta1e, av-igamma1, and aviervIII clades. However, transmembrane se-quences were detected in the avibeta2 clade. When the whole set of1,863 proviruses was reclassified by BLASTing with the 10 consen-sus viral protein sequences derived from the 128 selected provi-ruses, more envelope sequences were detected in each of the 10clades (see Table S1).
Alpha- and alphabeta-like retroviruses occurred only in thetwo galliform birds (chicken and turkey). The likely immediatepredecessors of alpharetroviruses, the alphabeta clade, commonlyused the �1, �1 frameshift strategy, as did the betaretroviruses. Incontrast, 0, �1 is the strategy used by exogenous (8) and endoge-nous (see Table S1) alpharetroviruses. The alpha clade includedtwo RAV-0-like viruses and five ALV-like viruses, with either an Aor an E envelope, as well as nine EAV-HP-like viruses. Two-thirdsof the alphabetaretroviruses were highly similar to the previouslydescribed EAV ERVs, EAV0 and EAV51 (28) (see Fig. S4 in thesupplemental material). The EAV0 provirus sequence was 94%identical to the alphabeta consensus sequence and also uses the�1, �1 frameshift strategy (data not shown). This is of interestbecause recombinants of exogenous ALVs with envelopes fromendogenous alphabeta proviruses have become important patho-genic exogenous retroviruses (ALV subgroup J) (28, 29).
The avian class III sequences contained one clade, aviervIII(Fig. 1), which clustered with the murine ERV class III virusMERV-L and also had motifs similar to those of gamma- andbetaretroviruses. The aviervIII proviruses were most similar toHERV-S and HERV-L Pol amino acid sequences and to humanspumaretrovirus DNA. The best fit among human Repbase LTRrepeats was with HERV18. A previously described turkey provi-rus, birddawg (30), clustered with aviervIII.
When pro/pol portions of our avian retroviral clades were an-alyzed together with 136 pro/pol sequences (900 to 1,000 bp) froma wide variety of host species (27), nearly all of the avian retroviralsequences clustered into two major groups, beta-like and gamma-like (see Fig. S3 in the supplemental material). The beta-like vi-ruses included alpha and alphabeta sequences. Thus, it seems thatthe alphabeta, avibeta, and avigamma clades identified here arealso present in many other birds and reveal some major generalfeatures of avian retroviruses.
Avian Endogenous Retroviruses
September/October 2012 Volume 3 Issue 5 e00344-12 ® mbio.asm.org 3
Dow
nloa
ded
from
http
s://j
ourn
als.
asm
.org
/jour
nal/m
bio
on 0
2 Ja
nuar
y 20
22 b
y 49
.232
.174
.201
.
To assist further work with the avian ERVs, a tree based onconsensus sequences and the most intact avian ERVs is providedin Fig. S4 in the supplemental material. In addition, diagrams ofrepresentative genomes for each clade are shown in Fig. S5 in thesupplemental material.
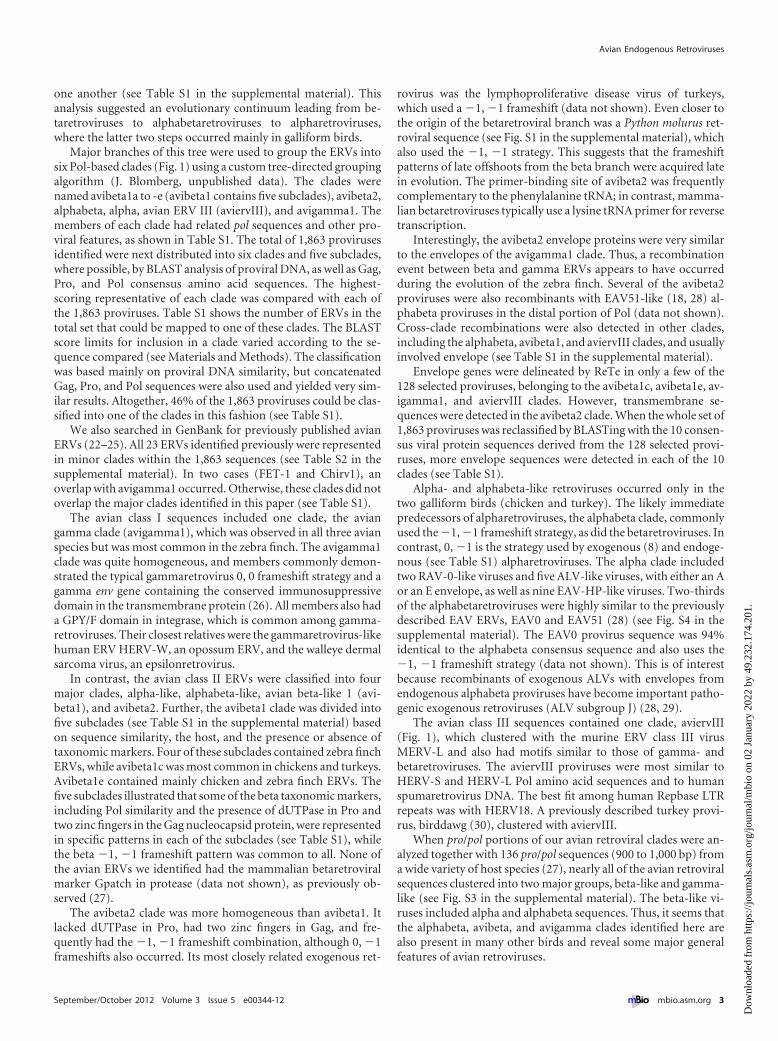
One-fourth of chicken ERVs are within or near cellulargenes. The 492 chicken endogenous proviruses identified wereindividually mapped, using BLAT, to the galGal3.0 genome on theUniversity of California Santa Cruz (UCSC) Genome Browser.For all of the analyses, a transcription unit was defined as either aRefSeq gene or an mRNA or microRNA transcribed from thisregion. The distance of each provirus from the nearest transcrip-tion unit was determined, and the data were catalogued in 10-kbintervals (Fig. 2A, bars). Approximately 25% of these integrationswere either in transcription units or within 10 kb of each end,including promoters and 3= regulatory sequences. These weregrouped together and called transcription units because of uncer-tainties in the annotation of many gene endpoints.
To determine if this distribution had been subject to selectivepressure, we compared it to a simulation of 10,000,000 randomintegrations. These simulated integrations were mapped onto thegenome and similarly tabulated and plotted with respect to dis-tance from the nearest transcription unit (Fig. 2A, dotted line). Asindicated by the �2 analysis, the distribution of the endogenous
proviruses was nearly random, except for proviruses that wereintegrated �100 kb away from the nearest transcription unit. Ac-cording to our simulation of random integrations, 26% of all in-tegrations should be greater than 100 kb away from transcriptionunits if there was no selection; however, 49% of the observed in-tegrations were �100 kb away. This indicates selection againstintegrations within 100 kb of transcription units. Surprisingly, thenumber of integrations within transcription units was slightlyhigher than random and integrations between 10 and 50 kb fromtranscription units were slightly less frequent than random. Thismay, in part, reflect the integration preferences of the differentERVs; for example, exogenous gammaretroviruses, such as mu-rine leukemia virus, prefer to integrate near transcriptional startsites (31).
Next, we extended this analysis to the zebra finch genome.ReTe identified a total of 1,200 proviruses in the zebra finch ge-nome. These integrations were mapped onto the genome, and thedistance from the transcription units was catalogued as describedabove. In contrast to the chicken integrations, only 16% of allzebra finch integrations were found in transcription units (orwithin 10 kb of either end), in comparison to 28% in the randomdata set, which is a significant difference (P � 0.01 by �2 test)(Fig. 2B). This indicated a strong selection against ERVs withintranscription units in the zebra finch genome. Further analysisshowed that 23% of the integrations in the zebra finch genomewere within 10 kb of either end of a transcription unit. Thus, thetotal number of integrations either within or near genes was com-parable for the chicken and the zebra finch. Since the zebra finchwas more recently sequenced and annotated, it is possible that theends of the genes are not as well defined as in the chicken, resultingin an elevated number of integrations near but not in genes. Al-ternatively, the zebra finch ERVs may have a preference for pro-moters or 3= ends of genes, possibly reflecting the different types ofERVs in the two birds. In contrast to the chicken, the zebra finchintegrations were somewhat below random at sites �100 kb awayfrom transcription units.
Endogenous proviruses in or near chicken genes are morerecent integrations. Since many of these ERVs have been sub-jected to mutations during evolution, it is important to determinehow much these sequences have diverged. The more diverged asequence, the lower the possibility of retaining functional generegulatory elements. The age of a proviral integration can be ap-proximated from LTR divergence, intactness of proviral openreading frames (ORFs) (see Table S1 in the supplemental mate-rial), and the presence of secondary integrations of other trans-posable elements. We used LTR divergence to assess age in thisstudy, calculating the differences between the 5= and 3= LTRs ofeach provirus as described previously (19). The calculation is de-pendent on an exact delineation of LTRs, which ReTe cannotachieve in all cases. Secondary transposon integrations create afurther uncertainty. Still, an LTR divergence of 0 to 10% suggestsa relatively recent origin of the integration. Around 50% of theavian proviruses detected lacked two discernible LTRs and couldnot be used for this analysis. These ERVs are probably much olderand more evolved, thereby precluding LTR comparison.
Almost 70% of the chicken proviruses with two LTRs showed�90% LTR identity, indicating that they are relatively recent in-tegrations (Fig. 3B). Next, we were interested in investigating theage of proviruses integrated in and near transcription units. Inter-estingly, 70% of the chicken proviruses with two LTRs that inte-
FIG 2 Distribution of endogenous proviruses with respect to transcriptionunits in the chicken (A) and zebra finch (B) genomes. The endogenous provi-ruses were mapped with respect to distance from the nearest transcription (Tx)unit and binned into 10-kb segments (bar). Ten million random integrationswere simulated and were binned on the basis of distance from the nearest gene(dashed line). Differences that were statistically significant (P value of �0.05;�2) are indicated by asterisks.
Bolisetty et al.
4 ® mbio.asm.org September/October 2012 Volume 3 Issue 5 e00344-12
Dow
nloa
ded
from
http
s://j
ourn
als.
asm
.org
/jour
nal/m
bio
on 0
2 Ja
nuar
y 20
22 b
y 49
.232
.174
.201
.

grated within a transcription unit have relatively similar LTRs(less than 20% divergent). In contrast, 60% of the more divergentLTRs (greater than 30% divergent) are found farther away fromgenes.
Next, we looked at the relative age of proviruses integrated�100 kb away from chicken genes. These areas probably have verylittle selective pressure to maintain LTR sequence. The ERVs withmore divergent LTRs were more prevalent �100 kb away fromgenes. In addition, almost 50% of retroviral chains with less diver-gent LTRs (less than 20%) are found in this region. Thus, theyounger proviruses appeared to be more common within genesand the older proviruses were enriched �100 kb away from genes.
The distribution of these proviruses with respect to transcrip-tion units was similar between genera (as defined in Table 1) andrandom, with the exception of the alphabeta clade. Seventy-eight percent of the alphabeta proviruses were �100 kb away fromchicken transcription units (Fig. 3A), which is significantly higherthan random (26%). This indicates a strong selection against al-phabeta integrations in or close to transcription units.
Many chicken endogenous proviruses are found in promot-ers and introns. We next characterized the distribution of provi-ruses in the chicken within and around (�10 kb) transcriptionunits. Some of these integrations could alter gene expression by
inserting new promoter elements, as well as splicing, polyadenyl-ation, or other regulatory elements. In addition, the insertionscould disrupt genes. We found that 62% of the proviruses withinor near a transcription unit in the chicken were in introns(Fig. 4A); introns make up 42% of these transcription units. Sur-prisingly, 77% of these intronic proviruses are in the same orien-tation as the transcription unit (Fig. 4B), increasing the possibilitythat they may provide regulatory sites.
Interestingly, 20% of the ERVs in or near transcription unitswere in the promoter region (up to 10 kb upstream). Irrespectiveof the orientation, both of the LTRs have regulatory elements thatcan affect gene transcription. More than 60% of these provirusesin the promoter regions are in the opposite orientation, raising thepossibility that the enhancer elements in the 5= LTR could regulategene transcription. In addition, a small number of proviruses ac-tually flanked exons. This raises the interesting possibility that theexon may have evolved from the provirus.
Around 15% of retroviral chains within or near transcriptionunits were within 10 kb of the annotated 3= end of the gene, whichin many cases does not include the 3= untranslated region (UTR).Recently, it has become increasingly apparent that 3= UTRs play abig role in gene regulation, since they are targeted by microRNAs(miRNAs) and RNA binding proteins. The 3= UTRs of many tran-scriptional units are not tightly defined; therefore, many of theseretroviral chains could provide alternative polyadenylation sitesand therefore influence gene expression.
FIG 3 Alphabeta ERVs are excluded from chicken transcription (Tx) units.(A) All endogenous proviruses were classified on the basis of their genera (as inTable 1) and their distances from the nearest transcription unit. (B) The age ofeach provirus was approximated by calculating the sequence divergence be-tween the two LTRs that flank the provirus (10% divergence denotes a range of0 to 10%; 20% denotes 11 to 20%, etc.). The endogenous proviruses wereclassified on the basis of distance from the nearest transcription unit and plot-ted on the basis of LTR divergence. Older ERVs were more prevalent far awayfrom transcription units.
FIG 4 Distribution of chicken endogenous proviruses that could alter geneexpression. (A) The positions of all endogenous proviruses that were within atranscription unit were further divided into promoters of transcription (lessthan 10 kb upstream), introns, exons, and ends of transcription units (less than10 kb downstream). (B) The orientation of all endogenous proviruses within atranscription unit was calculated with respect to their position in a transcrip-tion unit.
Avian Endogenous Retroviruses
September/October 2012 Volume 3 Issue 5 e00344-12 ® mbio.asm.org 5
Dow
nloa
ded
from
http
s://j
ourn
als.
asm
.org
/jour
nal/m
bio
on 0
2 Ja
nuar
y 20
22 b
y 49
.232
.174
.201
.
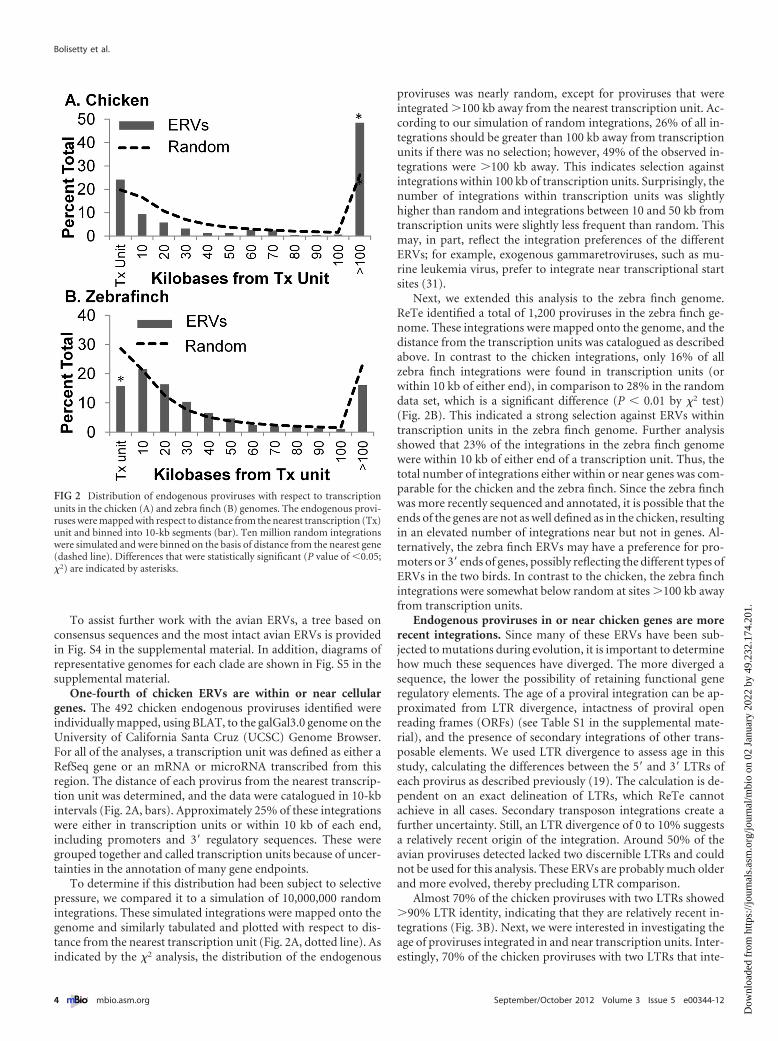
Many ERVs are clustered on chromosomes. During our anal-ysis of endogenous provirus integrations, we noticed that therewere some chicken chromosomal loci with a high concentrationof integrations. We decided to map the integrations onto the cor-responding chromosomes to identify regions enriched for inte-grations. We split each chromosome into million-base fragmentsand mapped the integrations back onto the chromosome. A ran-dom distribution of ERVs in the chicken genome would result inone integration per 2 � 106 bp. As illustrated in Fig. 5A, we un-covered five different clusters on chromosome 1 of the chickenand three clusters on chromosome 2. We found a centromericintegration cluster on both chromosomes 1 and 2 with 12 and 8different endogenous proviral integrations, respectively (Fig. 5A).The largest cluster outside the centromere had seven endogenousproviruses in a region of 2 � 106 bp. There was very little correla-tion observed between the members of a cluster and specific gen-era or the age of the proviruses (data not shown), suggesting thatthey did not arise by duplication. In general, clusters were found ingene-poor regions of the genome (data not shown). About 40% ofthe chicken ERVs were found in clusters.
Analysis of the zebra finch genome led to similar conclusions.However, there are many more clusters in the zebra finch genomethan in the chicken genome, in part because of the larger numberof ERVs identified in the zebra finch. We identified 7 clusters onchromosome 1 (data not shown) and 11 clusters on chromosome2 (Fig. 5B). One of the clusters on chromosome 2 had 40 integra-tions within 5 � 106 bp, which is significantly higher than random(1 integration in 106 bp). Although the centromeres of the zebrafinch have not been mapped, it is possible that one of the clustersrepresents the centromere of this chromosome, by analogy to thechicken.
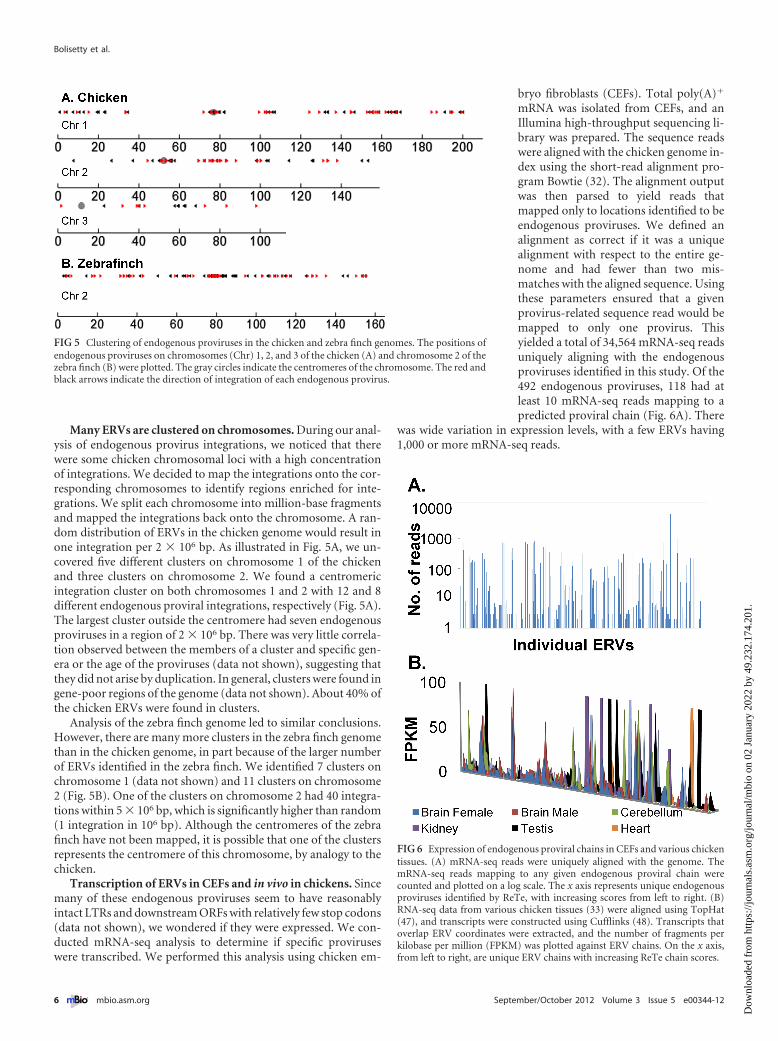
Transcription of ERVs in CEFs and in vivo in chickens. Sincemany of these endogenous proviruses seem to have reasonablyintact LTRs and downstream ORFs with relatively few stop codons(data not shown), we wondered if they were expressed. We con-ducted mRNA-seq analysis to determine if specific proviruseswere transcribed. We performed this analysis using chicken em-
bryo fibroblasts (CEFs). Total poly(A)�
mRNA was isolated from CEFs, and anIllumina high-throughput sequencing li-brary was prepared. The sequence readswere aligned with the chicken genome in-dex using the short-read alignment pro-gram Bowtie (32). The alignment outputwas then parsed to yield reads thatmapped only to locations identified to beendogenous proviruses. We defined analignment as correct if it was a uniquealignment with respect to the entire ge-nome and had fewer than two mis-matches with the aligned sequence. Usingthese parameters ensured that a givenprovirus-related sequence read would bemapped to only one provirus. Thisyielded a total of 34,564 mRNA-seq readsuniquely aligning with the endogenousproviruses identified in this study. Of the492 endogenous proviruses, 118 had atleast 10 mRNA-seq reads mapping to apredicted proviral chain (Fig. 6A). There
was wide variation in expression levels, with a few ERVs having1,000 or more mRNA-seq reads.
FIG 5 Clustering of endogenous proviruses in the chicken and zebra finch genomes. The positions ofendogenous proviruses on chromosomes (Chr) 1, 2, and 3 of the chicken (A) and chromosome 2 of thezebra finch (B) were plotted. The gray circles indicate the centromeres of the chromosome. The red andblack arrows indicate the direction of integration of each endogenous provirus.
FIG 6 Expression of endogenous proviral chains in CEFs and various chickentissues. (A) mRNA-seq reads were uniquely aligned with the genome. ThemRNA-seq reads mapping to any given endogenous proviral chain werecounted and plotted on a log scale. The x axis represents unique endogenousproviruses identified by ReTe, with increasing scores from left to right. (B)RNA-seq data from various chicken tissues (33) were aligned using TopHat(47), and transcripts were constructed using Cufflinks (48). Transcripts thatoverlap ERV coordinates were extracted, and the number of fragments perkilobase per million (FPKM) was plotted against ERV chains. On the x axis,from left to right, are unique ERV chains with increasing ReTe chain scores.
Bolisetty et al.
6 ® mbio.asm.org September/October 2012 Volume 3 Issue 5 e00344-12
Dow
nloa
ded
from
http
s://j
ourn
als.
asm
.org
/jour
nal/m
bio
on 0
2 Ja
nuar
y 20
22 b
y 49
.232
.174
.201
.
In order to verify that these proviruses were indeed being tran-scribed in the chicken and not just in cell culture, we analyzedpublicly available chicken mRNA-seq data (33) for the expressionof these proviruses in various chicken tissues (Fig. 6B). Approxi-mately 50 of these ERVs were expressed in many tissues, and someof them appeared to be expressed in a tissue-specific manner(Fig. 6B).
Many chicken ERVs are translated. We next investigatedwhether the endogenous proviruses were just transcribed or ifthey could also be translated to produce protein products. Usingribosome footprinting followed by high-throughput sequencing(34), we analyzed the presence of ribosomes on the transcriptsgenerated from proviruses as an alternative way of studying trans-lation. We analyzed ribosome footprints of proviruses in CEFsfrom two unrelated samples (data not shown). Sequence readsfrom both samples were aligned with Bowtie (32), using parame-ters described in Materials and Methods. Since endogenous pro-viral chains contain repetitive sequences, only unique alignmentswith the genome and proviruses were considered for the analysis.In fact, 118 of these endogenous proviruses were translated inboth of these data sets. Most of these were translated to similarlevels in both of the data sets, as indicated by a Spearman rankcorrelation of 0.96 (data not shown).
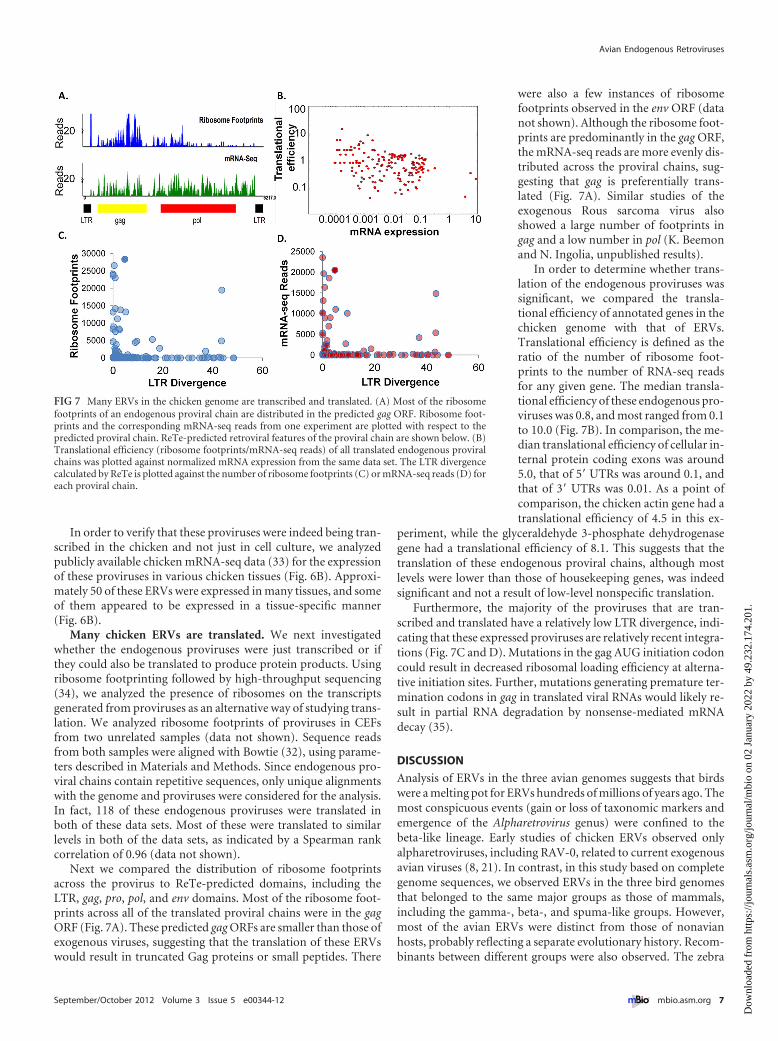
Next we compared the distribution of ribosome footprintsacross the provirus to ReTe-predicted domains, including theLTR, gag, pro, pol, and env domains. Most of the ribosome foot-prints across all of the translated proviral chains were in the gagORF (Fig. 7A). These predicted gag ORFs are smaller than those ofexogenous viruses, suggesting that the translation of these ERVswould result in truncated Gag proteins or small peptides. There
were also a few instances of ribosomefootprints observed in the env ORF (datanot shown). Although the ribosome foot-prints are predominantly in the gag ORF,the mRNA-seq reads are more evenly dis-tributed across the proviral chains, sug-gesting that gag is preferentially trans-lated (Fig. 7A). Similar studies of theexogenous Rous sarcoma virus alsoshowed a large number of footprints ingag and a low number in pol (K. Beemonand N. Ingolia, unpublished results).
In order to determine whether trans-lation of the endogenous proviruses wassignificant, we compared the transla-tional efficiency of annotated genes in thechicken genome with that of ERVs.Translational efficiency is defined as theratio of the number of ribosome foot-prints to the number of RNA-seq readsfor any given gene. The median transla-tional efficiency of these endogenous pro-viruses was 0.8, and most ranged from 0.1to 10.0 (Fig. 7B). In comparison, the me-dian translational efficiency of cellular in-ternal protein coding exons was around5.0, that of 5= UTRs was around 0.1, andthat of 3= UTRs was 0.01. As a point ofcomparison, the chicken actin gene had atranslational efficiency of 4.5 in this ex-
periment, while the glyceraldehyde 3-phosphate dehydrogenasegene had a translational efficiency of 8.1. This suggests that thetranslation of these endogenous proviral chains, although mostlevels were lower than those of housekeeping genes, was indeedsignificant and not a result of low-level nonspecific translation.
Furthermore, the majority of the proviruses that are tran-scribed and translated have a relatively low LTR divergence, indi-cating that these expressed proviruses are relatively recent integra-tions (Fig. 7C and D). Mutations in the gag AUG initiation codoncould result in decreased ribosomal loading efficiency at alterna-tive initiation sites. Further, mutations generating premature ter-mination codons in gag in translated viral RNAs would likely re-sult in partial RNA degradation by nonsense-mediated mRNAdecay (35).
DISCUSSION
Analysis of ERVs in the three avian genomes suggests that birdswere a melting pot for ERVs hundreds of millions of years ago. Themost conspicuous events (gain or loss of taxonomic markers andemergence of the Alpharetrovirus genus) were confined to thebeta-like lineage. Early studies of chicken ERVs observed onlyalpharetroviruses, including RAV-0, related to current exogenousavian viruses (8, 21). In contrast, in this study based on completegenome sequences, we observed ERVs in the three bird genomesthat belonged to the same major groups as those of mammals,including the gamma-, beta-, and spuma-like groups. However,most of the avian ERVs were distinct from those of nonavianhosts, probably reflecting a separate evolutionary history. Recom-binants between different groups were also observed. The zebra
FIG 7 Many ERVs in the chicken genome are transcribed and translated. (A) Most of the ribosomefootprints of an endogenous proviral chain are distributed in the predicted gag ORF. Ribosome foot-prints and the corresponding mRNA-seq reads from one experiment are plotted with respect to thepredicted proviral chain. ReTe-predicted retroviral features of the proviral chain are shown below. (B)Translational efficiency (ribosome footprints/mRNA-seq reads) of all translated endogenous proviralchains was plotted against normalized mRNA expression from the same data set. The LTR divergencecalculated by ReTe is plotted against the number of ribosome footprints (C) or mRNA-seq reads (D) foreach proviral chain.
Avian Endogenous Retroviruses
September/October 2012 Volume 3 Issue 5 e00344-12 ® mbio.asm.org 7
Dow
nloa
ded
from
http
s://j
ourn
als.
asm
.org
/jour
nal/m
bio
on 0
2 Ja
nuar
y 20
22 b
y 49
.232
.174
.201
.
finch betaretroviruses were the most like those of other verte-brates.
Importantly, we found that the avian ERVs could be groupedinto six clades and five subclades. ERVs in the betaretrovirusgroup did not have all of the taxonomic markers of existing mam-malian betaretroviruses but had one or more beta-like features,suggesting a trial-and-error process of acquisition of beta markersduring evolution. This independent segregation of betaretroviralfeatures was most obvious in clade avibeta1. We suggest that somefeatures of archaic betaretroviruses are reflected in the fluctuatinguse of frameshift strategies, the number of nucleocapsid zinc fin-gers, and the presence or absence of dUTPase (and the absence ofGpatch) in the protease reading frame. These features have notbeen recorded in extant nonavian betaretroviruses. A retroviruswhich emerges close to the betaretroviral root, like the pythonretrovirus, uses �1, �1 frameshifts and has two zinc fingers andno dUTPase.
Further, a gradual evolutionary transition was inferred, frombetaretroviruses to intermediate alphabetaretroviruses in all threebirds and finally to alpharetroviruses only in chickens and turkeys.This differs somewhat from previous analyses (36), where a suc-cession from alpha to alphabeta to beta was presented. However,the present data set is larger than the one used in that study, and itsphylogenetic inference result is more logical than the previousone. Most current exogenous avian viruses (avian leukosis viruses[ALVs]) are in the Alpharetrovirus genus. Endogenous alpharet-roviruses have been reported earlier only in galliform birds, in-cluding chickens (Gallus gallus) (21, 37, 38) and grouse (Bonasaumbellus) (39, 40). We report here that the turkey contains al-pharetroviral proviruses while the zebra finch does not (Table 1;see Table S1 in the supplemental material). However, the genusvector indicated a low but persistent alpharetroviral similarity inthe avibeta2 clade, which occurs in the zebra finch (see Fig. S2 inthe supplemental material). It is likely that some avian betaretro-viruses started to evolve toward alpharetroviruses more than 100million years ago.
The number of ERVs identified in the chicken and turkey ge-nomes was lower than that found in most other vertebrates (19).ReTe is based mostly on mammalian retroviruses; thus, a slightbias toward the detection of mammalian retroviruses can be ex-pected. However, the avian alpha-, beta-, and gamma-like se-quences described here got high ReTe scores. The turkey genomehad 1/20 of the ERV content of the human genome. Although theavian genomes are about one-third the size of the human genome,the difference is still dramatic. Thus, the two galliform birds bothhad a light “ERV burden.” In contrast, the zebra finch had a num-ber of ERVs similar to those of humans when adjusted for genomesize. It will be interesting to determine why these birds vary somuch in ERV composition. Some vertebrates seem to efficientlyremove repetitive elements by illegitimate recombination (41).Alternatively, they may efficiently restrict the replication of certainretroviruses by other, unknown, mechanisms.
Analysis of retroviral integrations also gives insight into theevolution of the host genome, since ERV integrations can alterhost gene expression. Therefore, most endogenous retroviral in-tegrations are thought to be subject to negative selection. How-ever, we found a nearly random number of ERVs in chicken tran-scription units, with 62% of these in introns. It is interesting that77% of these intronic integrations were in the sense reading frame,suggesting that they might alter gene expression through the in-
sertion of promoters or splicing or polyadenylation sites. In con-trast, an earlier study by Bushman and colleagues (42), whichanalyzed mainly free retroviral LTRs in the chicken genome,found negative selection within genes and especially in the senseorientation. We did see a significant enrichment of chicken ERVsgreater than 100 kb from any mapped transcription unit, wherethey probably do not influence gene expression.
Endogenous proviral clusters in the genome suggest “deadspots” that do not interfere with host gene expression, although itis possible that they are transcribed (43). Proviruses have accumu-lated in these regions over many millions of years, suggesting thatthere might be no negative selection against these integrations.Alternatively, these ERV-rich clusters might undergo positive se-lection, perhaps because they play a role in generating geneticdiversity by promoting recombination. Another possible functioncould be during cell division; these clusters might be loadingpoints for cohesin or other factors involved in proper chromo-some segregation (44).
Surprisingly, we found that many avian ERVs are transcribedand translated, both in CEFs in culture and in many chicken tis-sues in vivo. Further, some of these ERVs are expressed in a tissue-specific fashion. In the future, it will be interesting to study therole, if any, of these ERV RNAs and proteins.
We conclude that avian retroviral evolution differs from that ofother vertebrates. Retroviral classes I, II, and III may have beenpresent at the outset of reptile and dinosaur evolution 200 to 300million years ago. Avian retroviruses seem to have evolved ratherindependently from the rest of the retroviruses over the last 150million years, in rare instances complicated by horizontal inter-change with nonavian phyla. Taxonomic markers, which segre-gate together in mammalian retroviruses, do not segregate asclearly in bird retroviruses. It is possible that the selective pressureon retroviral features was more specific in mammals than in birds.
MATERIALS AND METHODSIdentification and classification of avian ERVs. Three avian genomes(red jungle fowl, the ancestor of the domestic chicken, galGal3.0 [10];zebra finch, taeGut1.0 [12]; and turkey, melGal1.0 [11]; downloadedfrom the UCSC Genome Browser) were examined for endogenous retro-viral sequences using ReTe version 1.01 (19) with default settings and aproviral chain score cutoff of 300. Class III ERVs are not completely cov-ered by ReTe, and this may lead to an underreporting of such sequences(19). To enable an overview of the 1,863 retroviral sequences integratedinto the three host genomes, a first reduction of complexity was carriedout by clustering into groups of high similarity. A custom algorithm wasused to cluster proviruses according to concatenated Gag, Pro, and Polsequences (as reconstructed by ReTe) at the level of a BLASTP score of2,100 or higher (Blomberg, unpublished). The resulting clusters were atleast 90% identical in this chimeric amino acid sequence. The highest-scoring member of a cluster was used as the source of sequence for phy-logenetic inference.
MEGA version 5.05 (45) was used for phylogenetic inference. Treeswere based on the polymerase amino acid sequence, and bootstrap anal-ysis was carried out with 500 replicates. The tree in Fig. 1 is a manualsimplification of the tree in Fig. S1 in the supplemental material, resultingfrom alignment of Pol sequences from relatively intact (score of �1,000)or especially prevalent proviruses (the most-intact member of a cluster of�10). Besides the preliminary genus classification inherent to ReTe,which builds on conserved motifs of reference retroviruses, a classificationpipeline using data from ReTe was constructed in Visual FoxPro. It wasbuilt on the additional features (i) frameshift strategy, (ii) number of zincfingers in Gag, (iii) presence of Gpatch (beta property), (iv) dUTPase in
Bolisetty et al.
8 ® mbio.asm.org September/October 2012 Volume 3 Issue 5 e00344-12
Dow
nloa
ded
from
http
s://j
ourn
als.
asm
.org
/jour
nal/m
bio
on 0
2 Ja
nuar
y 20
22 b
y 49
.232
.174
.201
.
Pro (beta), and (v) GPY/F domain in integrase plus the most similarreference genome detected by ReTe. A final classification of the whole1,863 proviruses was made by BLASTing in successive steps. First thewhole proviral DNA was searched with BLASTN using proviral DNAconsensus sequences and a cutoff score of 1,000. Next, the predicted Gag,Pro, and Pol proteins were concatenated and searched against concate-nated consensus sequences with BLASTP and a cutoff score of 800. Fi-nally, the envelopes were classified using BLASTP and a cutoff score of200. The consensus sequences for all of the clades and subclades may befound at http://www.bio.jhu.edu/Faculty/Beemon/.
Classifying integrations with respect to transcription units. TheRefSeq and all mRNA databases for the galGal3.0 genome were down-loaded from the UCSC Genome Browser. A transcription unit was definedas a RefSeq gene or an mRNA expressed from a given locus. We thendownloaded the coordinates of all miRNAs from miRBASE (46). Thesethree databases were used to create a database of all of the transcripts in thegenome, and all redundant entries were removed. The coordinates of allBLAT alignments were then compared with the transcript database toidentify the distance of the endogenous proviral chain from the nearesttranscription unit. A similar analysis was conducted using the taeGut(zebra finch) genome.
Simulation of random integrations. Ten million random integra-tions were simulated using a random-number generator. Each numbercorresponded to a chromosome and a coordinate in the chromosome.The simulations were mapped with respect to transcription units similarto endogenous proviral chains. The probability that the endogenous pro-viral chains were different from the simulation was calculated using the�2 test. A cluster was defined when more than five endogenous proviralintegrations mapped within 106 bp of one another. A random distributionof the 500 chicken proviral integrations would yield 1 provirus every 2 �106 bp.
Library preparation of RNA for mRNA-seq analysis and ribosomefootprinting analysis. Poly(A)� mRNA was purified from CEFs usingmagnetic oligo(dT) beads (NEB) after heating for 2 min at 80°C. Ribo-some footprints were prepared from CEFs as previously described (34).Libraries were prepared for sequencing on the Illumina Hi-Seq 2000.
Analysis of mRNA-seq and ribosome footprinting data. Data gener-ated from the sequencing libraries were aligned with the chicken genomeindex of Bowtie (32) (galGal3.0, UCSC index) using TopHat with defaultparameters (47). Custom python scripts were used to identify reads thatmapped to internal exons, 5= UTRs, 3= UTRs, and endogenous viruses.Only unique alignments were used to calculate translational efficiency andcoverage of endogenous proviruses.
SUPPLEMENTAL MATERIALSupplemental material for this article may be found at http://mbio.asm.org/lookup/suppl/doi:10.1128/mBio.00344-12/-/DCSupplemental.
Figure S1, TIF file, 2.4 MB.Figure S2, TIF file, 0.8 MB.Figure S3, TIF file, 1.9 MB.Figure S4, TIF file, 2.3 MB.Figure S5, TIF file, 2.9 MB.Table S1, DOCX file, 0.1 MB.Table S2, DOCX file, 0.1 MB.
ACKNOWLEDGMENTS
This work was supported by Public Health Service grants R01CA048746and RO1CA124596 from the National Cancer Institute to K.L.B.
We thank Nicholas Ingolia, Carnegie Institute of Embryology, for se-quencing ribosome footprints and associated RNA-seq on Hi-Seq 2000and for helpful discussions. We also thank Naomi Rosenberg and RobinWeiss for review of the manuscript.
REFERENCES1. Weiss RA. 2006. The discovery of endogenous retroviruses. Retrovirology
3:67.
2. Stoye JP. 2012. Studies of endogenous retroviruses reveal a continuingevolutionary saga. Nat. Rev. Microbiol. 10:395– 406.
3. Padian K, Chiappe LM. 1998. The origin and early evolution of birds.Biol. Rev. 73:42.
4. Xu X, You H, Du K, Han F. 2011. An archaeopteryx-like theropod fromChina and the origin of Avialae. Nature 475:465– 470.
5. Dornburg R. 1995. Reticuloendotheliosis viruses and derived vectors.Gene Ther. 2:301–310.
6. Tarlinton R, Meers J, Young P. 2008. Biology and evolution of theendogenous koala retrovirus. Cell. Mol. Life Sci. 65:3413–3421.
7. Blomberg J, et al. 2011. Phylogeny-directed search for murine leukemiavirus-like retroviruses in vertebrate genomes and in patients sufferingfrom myalgic encephalomyelitis/chronic fatigue syndrome and prostatecancer. Adv. Virol. 2011:341294.
8. Boeke JD, Stoye JP. 1997. Retrotransponsons, endogenous retrovirusesand the evolution of retroelements, p 343– 435. In Coffin JM, Hughes SH,Varmus HE (ed), Retroviruses. Cold Spring Harbor Laboratory Press,Cold Spring Harbor, NY.
9. Ting C-N, Rosenberg MP, Snow CM, Samuelson LC, Meisler MH.1992. Endogenous retroviral sequences are required for tissue-specific ex-pression of human salivary amylase gene. Genes Dev. 6:1457–1465.
10. International Chicken Genome Sequencing Consortium. 2004. Se-quence and comparative analysis of the chicken genome provide uniqueperspectives on vertebrate evolution. Nature 432:695–777.
11. Dalloul RA, et al. 2010. Multi-platform next-generation sequencing ofthe domestic turkey (Melearis gallopavo): genome assembly and analysis.PLoS Biol. 8:e1000475.
12. Warren WC, et al. 2010. The genome of a songbird. Nature 464:757–762.13. van Tuinen M, Hedges SB. 2001. Calibration of avian molecular clocks.
Mol. Biol. Evol. 18:206 –213.14. van Tuinen M, Dyke GJ. 2004. Calibration of galliform molecular clocks
using multiple fossils and genetic partitions. Mol. Phylogenet. Evol. 30:74 – 86.
15. Kriegs JO, et al. 2007. Waves of genomic hitchhikers shed light on theevolution of gamebirds (Aves: Galliformes). BMC Evol. Biol. 7:190.
16. Mayer J, Blomberg J, Seal RL. 2011. A revised nomenclature for tran-scribed human endogenous retroviral loci. Mob. DNA 2:7.
17. Blomberg J, Benachenhou F, Blikstad V, Sperber G, Mayer J. 2009.Classification and nomenclature of endogenous retroviral sequences(ERVs): problems and recommendations. Gene 448:115–123.
18. Borisenko L, Rynditch AV. 2004. Complete nucleotide sequences ofALV-related endogenous retroviruses available from the draft chicken ge-nome sequence. Folia Biol. (Praha) 50:136 –141.
19. Sperber GO, Airola T, Jern P, Blomberg J. 2007. Automated recognitionof retroviral sequences in genomic data—RetroTector. Nucleic Acids Res.35:4964 – 4976.
20. Blikstad V, Benachenhou F, Sperber GO, Blomberg J. 2008. Evolution ofhuman endogenous retroviral sequences: a conceptual account. Cell. Mol.Life Sci. 65:3348 –3365.
21. Astrin SM, et al. 1980. Ten genetic loci in the chicken that contain struc-tural genes for endogenous avian leukosis viruses. Cold Spring Harb.Symp. Quant. Biol. 44:1105–1109.
22. Borysenko L, Stepanets V, Rynditch AV. 2008. Molecular characteriza-tion of full-length MLV-related endogenous retrovirus ChiRV1 from thechicken, Gallus gallus. Virology 376:199 –204.
23. Acloque H, et al. 2001. Identification of a new gene family specificallyexpressed in chicken embryonic stem cells and early embryo. Mech. Dev.103:79 –91.
24. Reed KJ, Sinclair AH. 2002. FET-1: a novel W-linked, female specific geneup-regulated in the embryonic chicken ovary. Mech. Dev. 119:S87–S90.
25. Carré-Eusèbe D, Coudouel N, Magre S. 2009. OVEX1, a novel chickenendogenous retrovirus with sex-specific and left-right asymmetrical ex-pression in gonads. Retrovirology 6:59.
26. Mangeney M, Heidmann T. 1998. Tumor cells expressing a retroviralenvelope escape immune rejection in vivo. Proc. Natl. Acad. Sci. U. S. A.95:14920 –14925.
27. Gifford R, Kabat P, Martin J, Lynch C, Tristem M. 2005. Evolution anddistribution of class II-related endogenous retroviruses. J. Virol. 79:6478 – 6486.
28. Bai J, Payne LN, Skinner MA. 1995. HPRS-103 (exogenous avian leuko-sis virus, subgroup J) has an env gene related to those of endogenouselements EAV-0 and E51 and an E element found previously only in sar-coma viruses. J. Virol. 69:779 –784.
Avian Endogenous Retroviruses
September/October 2012 Volume 3 Issue 5 e00344-12 ® mbio.asm.org 9
Dow
nloa
ded
from
http
s://j
ourn
als.
asm
.org
/jour
nal/m
bio
on 0
2 Ja
nuar
y 20
22 b
y 49
.232
.174
.201
.

29. Gao Y, et al. 2012. Molecular epidemiology of avian leukosis virus sub-group J in layer flocks in China. J. Clin. Microbiol. 50:953–960.
30. Mitchell RS, et al. 2004. Retroviral DNA integration: ASLV, HIV, andMLV show distinct target site preferences. PLoS Biol. 2:e234.
31. Wicker T, et al. 2005. The repetitive landscape of the chicken genome.Genome Res. 15:126 –136.
32. Langmead B, Trapnell C, Pop M, Salzberg SL. 2009. Ultrafast andmemory-efficient alignment of short DNA sequences to the human ge-nome. Genome Biol. 10:R25.
33. Brawand D, et al. 2011. The evolution of gene expression levels in mam-malian organs. Nature 478:343–347.
34. Ingolia NT, Ghaemmaghami S, Newman JR, Weissman JS. 2009.Genome-wide analysis of in vivo translation with nucleotide resolutionusing ribosome profiling. Science 324:218 –223.
35. Barker GF, Beemon K. 1991. Nonsense codons within the Rous sarcomavirus gag gene decrease the stability of unspliced viral RNA. Mol. Cell. Biol.11:2760 –2768.
36. Jern P, Sperber GO, Blomberg J. 2005. Use of endogenous retroviralsequences (ERVs) and structural markers for retroviral phylogenetic in-ference and taxonomy. Retrovirology 2:50.
37. Fadly AM. 1997. Avian retroviruses. Vet. Clin. North Am. Food Anim.Pract. 13:71– 85.
38. Hayman MJ. 1983. Avian acute leukemia viruses. Curr. Top. Microbiol.Immunol. 103:109 –125.
39. Dimcheff DE, Krishnan M, Mindell DP. 2001. Evolution and character-
ization of tetraonine endogenous retrovirus: a new virus related to aviansarcoma and leukosis viruses. J. Virol. 75:2002–2009.
40. Dimcheff DE, Drovetski SV, Krishnan M, Mindell DP. 2000. Cospecia-tion and horizontal transmission of avian sarcoma and leukosis virus gaggenes in galliform birds. J. Virol. 74:3984 –3995.
41. Tollis M, Boissinot S. 2011. The transposable element profile of the anolisgenome: how a lizard can provide insights into the evolution of vertebrategenome size and structure. Mob. Genet. Elements 1:107–111.
42. Barr SD, Leipzig J, Shinn P, Ecker JR, Bushman FD. 2005. Integrationtargeting by avian sarcoma-leukosis virus and human immunodeficiencyvirus in the chicken genome. J. Virol. 79:12035–12044.
43. Kapranov P, Willingham AT, Gingeras TR. 2007. Genome-wide tran-scription and the implications for genomic organization. Nat. Rev. Genet.8:413– 423.
44. Gullerova M, Proudfoot NJ. 2008. Cohesin complex promotes transcrip-tional termination between convergent genes in S. pombe. Cell 132:983–995.
45. Kumar S, Nei M, Dudley J, Tamura K. 2008. MEGA: a biologist-centricsoftware for evolutionary analysis of DNA and protein sequences. Brief.Bioinform. 9:299 –306.
46. Griffith-Jones S, Saini HK, van Dongen S, Enright AJ. 2008. miRBase:tools for microRNA genomics. Nucleic Acids Res. 36:D154 –D158.
47. Trapnell C, Pachter L, Salzberg SL. 2009. TopHat: discovering splicejunctions with RNA-Seq. Bioinformatics 25:1105–1111.
48. Trapnell C, et al. 2010. Transcript assembly and quantification by RNA-Seq reveals unannotated transcripts and isoform switching during celldifferentiation. Nat. Biotechnol. 28:511–515.
Bolisetty et al.
10 ® mbio.asm.org September/October 2012 Volume 3 Issue 5 e00344-12
Dow
nloa
ded
from
http
s://j
ourn
als.
asm
.org
/jour
nal/m
bio
on 0
2 Ja
nuar
y 20
22 b
y 49
.232
.174
.201
.

![Identification and characterisation of endogenous Avian ...€¦ · Virus (ALV) subgroup J in chickens [1, 4, 11, 13, 15, 16]. ALV is an alpharetrovirus which infects galliform birds,](https://img.pdfslide.us/doc/110x75/60bcf857200feb35aa3fdbc1/identification-and-characterisation-of-endogenous-avian-virus-alv-subgroup.jpg)