Embed Size (px)
Citation preview
UNESCO SCIENCE REPORT
The government needs to support the emergence of technology-based start-ups to broaden the innovation culture in India.Sunil Mani
The majority of pharmaceutical patents are owned by Indian firms, whereas foreign firms established in India tend to own the majority of patents in computer software.Photo © A and N photography/Shutterstock.com
598
India
599
INTRODUCTIONJobless growth: an emerging concernFor the first time in its history, India’s economy grew at around 9% per annum between 2005 and 2007. Ever since, GDP has been progressing at a much slower pace of around 5%, primarily as a corollary of the global financial crisis in 2008, even though it did bounce back briefly between 2009 and 2011 (Table 22.1).
India has experienced mixed fortunes in recent years. On the positive side, one could cite the systematic reduction in poverty rates, improvements in the macro-economic fundamentals that nurture economic growth, a greater flow of both inward and outward foreign direct investment (FDI), the emergence of India since 2005 as the world leader for exports of computer and information services and the country’s evolution into a hub for what are known as ‘frugal innovations’, some of which have been exported to the West. On the down side, there is evidence of growing inequality in income distribution, a high inflation rate and current deficit, as well as sluggish job creation despite economic growth, a phenomenon that goes by the euphemism of ‘jobless growth’. As we shall see, public policy has strived to reduce the deleterious effects of these negative features without imperilling the positive ones.
Come manufacture in India!In May 2014, the Bharatiya Janata Party became the first party in 30 years to win a majority of parliamentary seats (52%) in the general elections, allowing it to govern without
the support of other parties. Prime Minister Narendra Modi will thus have considerable freedom in implementing his programme between now and the next general elections in 2019.
In his speech delivered on Independence Day on 15 August 2014, the prime minister argued for a new economic model based on export-oriented manufacturing. He encouraged both domestic and foreign companies to manufacture goods for export in India, proclaiming several times, ‘Come manufacture in India!’ Today, India’s economy is dominated by the services sector, which represents 57% of GDP, compared to 25% for industry, half of which comes from manufacturing1 (13% of GDP in 2013).
The new government’s shift towards an East Asian growth2 model with a focus on the development of manufacturing and heavy infrastructure is also driven by demographic trends: 10 million young Indians are joining the job market each year and many rural Indians are migrating to urban areas. The services sector may have fuelled growth in recent
1. The National Manufacturing Policy (2011) advocated raising the share of manufacturing from 15% to about 25% of GDP by 2022. The policy also proposed raising the share of high-tech products (aerospace, pharmaceuticals, chemicals, electronics and telecommunications) among manufactured products from 1% to at least 5% by 2022 and augmenting the current share of high-tech goods (7%) among manufactured exports by 2022.
2. The East Asian growth model implies a strong role for the state in raising the domestic investment rate as a whole and specifically in manufacturing industries.
22 . India
Sunil Mani
Table 22.1: Positive and disquieting features of India’s socio-economic performance, 2006–2013
2006 2008 2010 2012 2013
Rate of real GDP growth (%) 9.3 3.9 10.3 4.7 4.7
Savings rate (% of GDP) 33.5 36.8 33.7 31.3 30.1
Investment rate (% of GDP) 34.7 38.1 36.5 35.5 34.8
Population living below poverty line (%) 37.20-1 – – 21.9 –
Population without access to improved sanitation (%) – – – 64.9-1 –
Population without access to electricity (%) – – – 24.7-1 –
Inward net FDI inflow (US$ billions) 8.90 34.72 33.11 32.96 30.76+1
Outward net FDI outflow (US$ billions) 5.87 18.84 15.14 11.10 9.20+1
India’s world share of exports of computer software services (%)
15.4 17.1 17.5 18.1 –
Inflation, consumer prices (%) 6.15 8.35 11.99 9.31 10.91
Income inequality (Gini index) 33.4 35.7 – –
Jobless growth (growth ratio of employees in organized sector)
0.20 0.12 0.22 – –
+n/-n: data refer to n years before or after reference year
Source: Central Statistical Organization; Reserve Bank of India; UNDP (2014); World Water Assessment Programme (2014) World Water Development Report: Water and Energy
Chapter 22
UNESCO SCIENCE REPORT
600
years but it has not created mass employment: only about one-quarter of Indians work3 in this sector. One challenge will be for the government to create a more business-friendly fiscal and regulatory environment. India will also need to raise its fixed investment ratio well above the current 30%, if it is to emulate the success of the East Asian model (Sanyal, 2014).
In his speech, Modi also announced the disbanding of the nation’s Planning Commission. This represents one of the most significant policy shifts in India since the release of the UNESCO Science Report 2010. This decision has effectively sounded a death knell to the planned form of development pursued by India over the past six and a half decades, which has resulted in a long series of medium-term development plans with explicit targets. On 1 January 2015, the government announced that the Planning Commission would be replaced by the National Institution for Transforming India (NITI Ayog). The role of this new think tank on development issues will be to produce reports on strategic issues for discussion by the National Development Council, in which all the chief ministers participate. In a departure from past practice, NITI Ayog will accord India’s 29 states a much greater role in policy formulation and implementation than the erstwhile Planning Commission. The new think tank will also play an active role in implementing schemes sponsored by the central government.
Despite this development, the Twelfth Five-Year Plan (2012–2017) will still run its course. Up until now, the Planning Commission has co-ordinated India’s wide spectrum of institutions supporting technological change, essentially through these five-year plans. These institutions include the Scientific Advisory Council to the Prime Minister, the National Innovation Council and the Ministry of Science and Technology. The new think tank will take over this co-ordination role.
In 2014, the new government made two proposals with regard to science. The first was for India to adopt a comprehensive policy on patents. The second was for senior researchers from government laboratories to work as science teachers in schools, colleges and universities as a way of improving the quality of science education. A committee of experts was subsequently appointed to draw up the policy on patents. However, the draft report submitted by the committee in December 2014 does not call for an overhaul of the existing policy. Rather, it encourages the government to popularize a patent culture among potential inventors from both the formal and informal economic sectors. It also recommends that India adopt utility models in its patent regime, in order to incite small and medium-sized enterprises (SMEs) to be more innovative.
3. The low level of job creation may be explained by the fact that the services sector is dominated by retail and wholesale trade (23%), followed by real estate, public administration and defence (about 12% each) and construction services (about 11%). See Mukherjee (2013).
India’s foreign policy will not break with the pastThe Modi government’s foreign policy is unlikely to depart from that of previous governments which have considered, in the words of India’s first prime minister, Jawaharlal Nehru, that ‘ultimately, foreign policy is the outcome of economic policy.’ In 2012–2013, India’s three biggest export markets were the United Arab Emirates, USA and China. It is noteworthy, however, that Narendra Modi is the first Indian prime minister to have invited all the heads of government of the South Asian Association for Regional Cooperation (SAARC)4 to his swearing-in ceremony on 26 May 2014. All accepted the invitation. Moreover, at the November 2014 SAARC summit, Prime Minister Modi appealed to SAARC members to give Indian companies greater investment opportunities in their countries, in return for better access to India’s large consumer market (see p. 569).
When it comes to innovation, Western nations will no doubt remain India’s primary trading partners, despite India’s ties to the other BRICS countries (Brazil, Russia, China and South Africa), which resulted in the signing of an agreement in July 2014 to set up the New Development Bank (or BRICS Development Bank), with a primary focus on lending for infrastructure projects.5
Three factors explain India’s continued reliance on Western science and technology (S&T). First among them is the growing presence of Western multinationals in India’s industrial landscape. Secondly, a large number of Indian firms have acquired companies abroad; these tend to be in developed market economies. Thirdly, the flow of Indian students enrolling in science and engineering disciplines in Western universities has increased manifold in recent years and, as a result, academic exchanges between Indian and Western nations are very much on the rise.
Economic growth has driven dynamic output in R&DAll indicators of output from research and development (R&D) have progressed rapidly in the past five years, be they for patents granted nationally or abroad, India’s share of high-tech exports in total exports or the number of scientific publications (Figure 22.1). India has continued building its capability in such high-tech industries as space technology, pharmaceuticals and computer and information technology (IT) services.
Two recent achievements illustrate the distance India has travelled in recent years: its position as world leader since 2005 for exports of computer and information services and
4. See Box 21.1 for details of the South Asian University, a SAARC project.
5. Each of the five BRICS contributes an equal financial share to the bank, which is to be endowed with initial capital of US$ 100 billion. The bank is headquartered in Shanghai (China), with India holding the presidency and a regional antenna in South Africa.

The USA remains India’s main scientific collaborator Main foreign partners 2008–2014 (number of papers)
1st collaborator 2nd collaborator 3rd collaborator 4th collaborator 5th collaborator
India USA (21 684) Germany (8 540) UK (7 847) Korea, Rep. of (6 477) France (5 859)
Source: Thomson Reuters’ Web of Science, Science Citation Index Expanded, data treatment by Science–Metrix
2005 2006 2007 2008 2009 2010 2011 2012 2013 20142006
24 703
27 785
32 610
38 967
37 228
41 983
45 961
46 106
50 691
53 733
Agricultu
re
Astronomy
Biological sc
iences
Chemistry
Computer scie
nce
Engineering
Geoscience
s
Mathematic
s
Medical sc
iences
Other li
fe science
s
Physics
Psych
ology
Social sc
iences
11 207
3 037
48 979
56 679
4 996
42 955
16 296
6 764
36 263
246
38 429
241
697
Indian scientific output is fairly diversifiedCumulative totals by field 2008–2014
Figure 22.1: Scientific publication trends in India, 2005–2014
Strong growth in publications resumed in 2012 0.76Average citation rate for Indian
scientific publications, 2009–2012; the G20 average is 1.02
21.3%Share of Indian papers with
foreign co-authors, 2008–2014; the G20 average is 24.6%
6.4% Share of Indian papers among 10%
most cited papers, 2009–2012; the G20 average is 10.2%
601
Chapter 22

UNESCO SCIENCE REPORT
602
the urban–rural divide and setting up centres of excellence in agricultural sciences to reverse the worrying drop in yields of some staple food crops.
In recent years, industry has complained of severe shortages of skilled personnel, as we saw in the UNESCO Science Report 2010. University research has also been in decline. Today, universities perform just 4% of Indian R&D. The government has instigated a variety of schemes over the past decade to correct these imbalances. The latter part of this essay will be devoted to analysing how effective these schemes have been.
TRENDS IN INDUSTRIAL RESEARCHBusiness R&D is growing but not R&D intensity overallThe only key indicator which has stagnated in recent years is the measure of India’s R&D effort. Sustained economic growth pushed gross domestic expenditure on research and development (GERD) up from PPP$ 27 billion to PPP$ 48 billion between 2005 and 2011 but this growth of 8% per annum (in constant PPP$) was only sufficient to maintain the country’s GERD/GDP ratio at the same level in 2011 as six years earlier: 0.81% of GDP.
India’s Science and Technology Policy of 2003 has thus failed to realize its objective of carrying GERD to 2.0% of GDP by 2007. This has forced the government to set back its target date to 2018 in the latest Science, Technology and Innovation Policy (2013). China, on the other hand, is on track to meet its own target of raising GERD from 1.39% of GDP in 2006 to 2.50% by 2020. By 2013, China’s GERD/GDP ratio stood at 2.08%. The Science and Technology Policies of both 2003 and 20138 have emphasized the importance of private investment to develop India’s technological capability. The government has used tax incentives to encourage domestic enterprises to commit more resources to R&D. This policy has evolved over time and is now one of the most generous incentive regimes for R&D in the world: in 2012, one-quarter of industrial R&D performed in India was subsidized (Mani, 2014). The question is, have these subsidies boosted investment in R&D by the business enterprise sector?
Public and private enterprises are certainly playing a greater role than before; they performed nearly 36% of all R&D in 2011, compared to 29% in 2005. Approximately 80% of all foreign and domestic patents granted to Indian inventors
8. ‘Achieving [a GERD/GDP ratio of 2.0%] in the next five years is realizable if the private sector raises its R&D investment to at least match the public sector R&D investment from the current ratio of around 1:3. This seems attainable, as industrial R&D investment grew by 250% and sales by 200% between 2005 and 2010... While maintaining current rates of growth in public R&D investments, a conducive environment will be created for enhancing private sector investment in R&D’ (DST, 2013).
the success of its maiden voyage to Mars6 in September 2014, which carried frugal innovation to new heights: India had developed its Mangalyaan probe at a cost of just US$ 74 million, a fraction of the cost of the US$ 671 million Maven probe developed by the US National Aeronautics and Space Administration (NASA), which arrived in Mars’ orbit just three days ahead of Mangalyaan. Until this feat, only the European Space Agency, USA and former Soviet Union had got as far as Mars’ atmosphere; out of 41 previous attempts, 23 had failed, including missions by China and Japan.
India is also collaborating on some of the most sophisticated scientific projects in the world. India’s Atomic Energy Commission participated in the construction of the world’s largest and most powerful particle accelerator, the Large Hadron Collider (LHC), which came on stream in 2009 at the European Organization for Nuclear Research (CERN) in Switzerland; several Indian institutions are involved in a multiyear experiment7 which uses the LHC. India is now participating in the construction of another particle accelerator in Germany, the Facility for Antiproton and Ion Research (FAIR), which will host scientists from about 50 countries from 2018 onwards. India is also contributing to the construction of the International Thermonuclear Experimental Reactor in France by 2018.
Indian science has nonetheless had its ups and downs and the country has historically given more importance to producing science than technology. As a result, Indian companies have had less success in manufacturing products which require engineering skills than in science-based industries like pharmaceuticals.
In recent years, the business enterprise sector has become increasingly dynamic. We shall begin by analysing this trend, which is rapidly reshaping the Indian landscape. The three biggest industries – pharmaceuticals, automotive and computer software – are all business-oriented. Even frugal innovation tends to be oriented towards products and services. Among government agencies, it is the defence industry which dominates R&D but, up until now, there has been little transfer of technology to civil society. That is about to change.
In order to sustain India’s high-tech capacity, the government is investing in new areas such as aircraft design, nanotechnology and green energy sources. It is also using India’s capabilities in information and communication technologies (ICTs) to narrow
6. Launched from Sriharikota spaceport on India’s east coast, the Mangalyaan probe is studying the red planet’s atmosphere in the hope of detecting methane, a potential sign of life. It will keep sending the data back to Earth until the spacecraft’s fuel runs out.
7. In November 2014, the Indian Institute of Technology in Madras was accepted by CERN as a full member of its Compact Muon Selenoid (CMS) experiment, famous for its discovery of the Higgs Boson in 2013. The Tata Institute of Fundamental Research in Mumbai, Bhabha Atomic Research Centre and the Delhi and Panjab Universities have been full CMS members for years.

603
India
(excluding individuals) went to private enterprises in 2013. As a corollary of this trend, research councils are playing a smaller role than before in industrial R&D.
Innovation is dominated by just nine industries More than half of business R&D expenditure is distributed across just three industries: pharmaceuticals, automotive and IT (Figure 22.3) [DST, 2013]. This implies that the subsidies have not really helped to spread an innovation9 culture across a wider spectrum of manufacturing industries. The subsidies simply seem to have enabled R&D-intensive industries like pharmaceuticals to commit even more resources than before to R&D. The government would do well to commission a serious study into the effectiveness of these tax incentives. It should also envisage the idea of providing the business sector with grants to encourage it to develop specific technologies.
Six industries concentrate about 85% R&D. Pharmaceuticals continue to dominate, followed by the automotive industry and IT (read computer software). It is interesting to note that computer software has come to occupy an important place in the performance of R&D. Leading firms have adopted a conscious policy of using R&D to keep them moving up the technology ladder, in order to remain competitive and generate fresh patents.
9. The consultations evoked in the UNESCO Science Report 2010 (p. 366) did not give rise to a national innovation act, as the draft bill was never presented to parliament.
Within these six industries, R&D is concentrated in a handful of large firms. For instance, five firms account for over 80% of the R&D reported by the pharmaceutical industry: Dr Reddy’s, Lupin, Ranbaxy, Cadila and Matrix Laboratories. In the automotive industry, two firms dominate: Tata Motors and Mahindra. In IT, there are three dominant firms: Infosys, Tata Consultancy Services and Wipro.
The government needs to support the emergence of technology-based start-ups to broaden the innovation culture in India. Technological progress has brought down traditional barriers which prevented SMEs from accessing technology. What SMEs need is access to venture capital. In order to encourage the growth of venture capital, the union government in its budget for 2014–2015 proposes setting up a fund of Rs 100 billion (circa US$ 1.3 billion) to attract private capital that could provide equity, quasi-equity, soft loans and other risk capital for start-ups.
Innovation is concentrated in just six statesWe have seen that innovation is concentrated in just nine industries. Manufacturing and innovation are also concentrated in geographical terms. Just six Indian states out of 29 account for half of R&D, four-fifths of patents and three-quarters of FDI. Moreover, even within each state, only one or two cities are research hubs (Table 22.2), despite a vigorous regional development policy in the decades leading up to the adoption by India of an economic liberalization policy in 1991.
Source: UNESCO Institute of Statistics; DST (2013)
Note: Percentages may not add up to 100 on account of rounding.
Source: DST (2013)
25.04
28.329.2
30.9
37.5
30.63
35.5
32.7834.2
30.34
34.8
28.86
35.5
29.54
4.162.6
6.87
2.723.86
5.94 5.96
0
5
10
15
20
25
30
35
40
2005 2006 2007 2008 2009 2010 2011
Total business expenditure on R&D Private Public
Figure 22.2: R&D trends in Indian public and private enterprises, 2005–2011 (%)
Figure 22.3: India’s main industrial performers, 2010 (%)In terms of R&D expenditure
Pharmaceuticals: 27.72 Automotive: 13.98
Information technology: 9.53
Defence industries: 8.63
Agriculture and agricultural machinery: 8.61
Industrial machinery: 5.07
Chemicals: 5.00
Biotechnology: 3.80
Electrical and electronics: 3.66
Chapter 22

604
UNESCO SCIENCE REPORT
Pharma companies are home-grown, IT companies are foreign An interesting picture emerges when we analyse the output of firms in terms of the number and type of patents granted to Indians by the United States Patent and Trademark Office (USPTO). The data reveal a steep increase both in overall patenting by Indian inventors and in the share of high-tech patents; there has also been a discernible shift in technological specialization, with pharma receding in importance and IT-related patents filling the gap (Figure 22.4).
The important point here is whether these patents are owned by domestic or foreign enterprises. Almost all of the USPTO patents secured by Indian inventors do indeed belong to domestic pharmaceutical companies. As noted in the UNESCO Science Report 2010, domestic pharmaceutical companies increased their patent portfolio even after the international agreement on Trade-related Aspects of Intellectual Property Rights (TRIPS) was translated into Indian law in 2005. In fact, for every single indicator10 of innovative activity, Indian pharmaceutical firms have done exceedingly well (Mani and Nelson, 2013). However, the same cannot be said for computer software or IT-related patents; as can be seen from Figure 22.4, almost all these patents are secured by multinational companies which have established dedicated R&D centres in India to take advantage of the skilled, yet cheap labour on
10. Be it the indicator for exports, net trade balance, R&D expenditure, patents granted within and without India or the number of Abbreviated New Drug Applications approved by the US Food and Drug Administration (implying technological capability in generic drug capability)
the market in software engineering and applications. The growing importance of software-related patents among total patents indicates that foreign ownership of Indian patents has increased significantly. This is part of the trend towards a globalization of innovation, in which India and, indeed, China have become important players. We shall be discussing this important trend in more detail below.
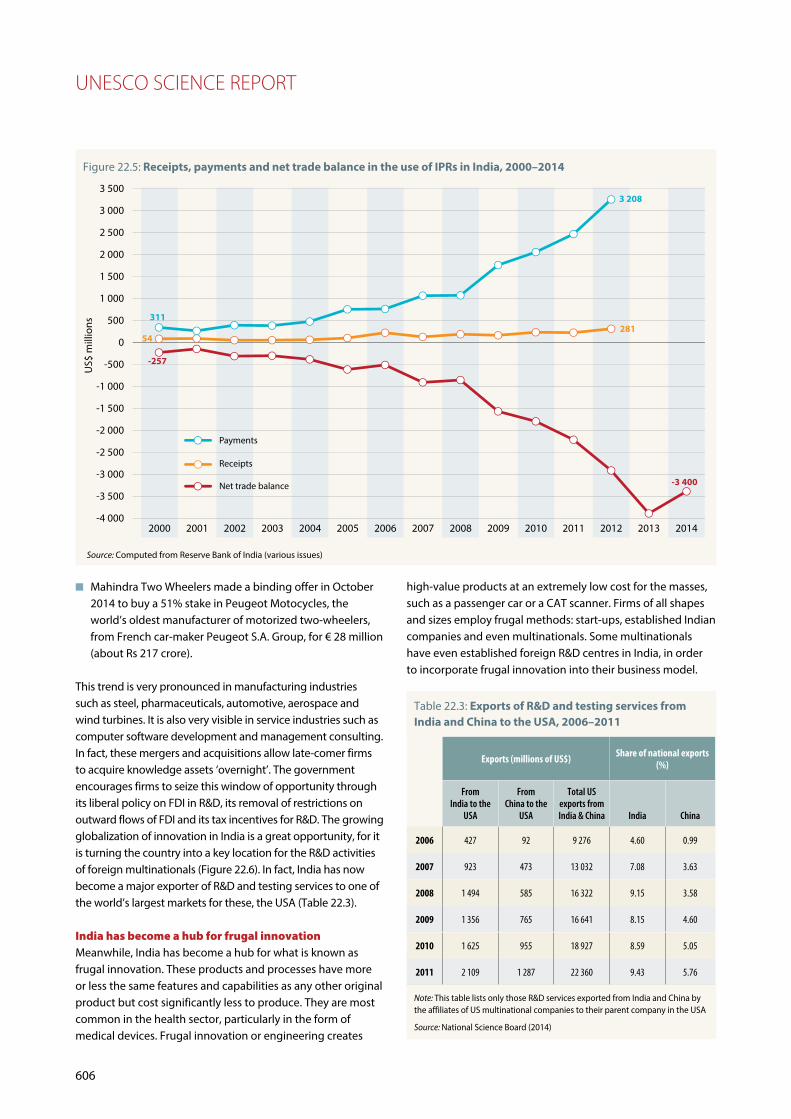
The surge in the creation of knowledge assets at home has not reduced India’s dependence on foreign knowledge assets. This is best indicated by observing India’s trade in technology, as exemplified by the charges that India receives and pays for technology transactions. The difference between the technology receipts and payments gives us the technology trade balance (Figure 22.5).
India is surfing the globalization wave to develop innovationThanks to a surge in FDI in both manufacturing and R&D over the past five years, foreign multinational companies have been playing a growing role in innovation and patenting in India. In 2013, foreign companies represented 81.7% of domestic patents obtained from the USPTO; in 1995, they had accounted for just 22.7% of the total (Mani, 2014).
The main policy challenge will be to effect positive spillovers from these foreign companies to the local economy, something that neither the Science, Technology and Innovation Policy (2013), nor current FDI policies have explicitly factored into the equation.
At the same time, Indian companies have acquired knowledge assets from abroad through a wave of cross-border mergers and acquisitions. In the first wave, there was Tata’s acquisition of the Corus Group plc (today Tata Steel Europe Ltd) in 2007, giving Tata access to car-grade steel technology; this was followed by the acquisition of German wind turbine manufacturer Senvion (formerly REpower Systems) by Suzlon Energy Ltd in December 2009. More recent examples are:
n Glenmark Pharmaceuticals’ opening of a new monoclonal antibody manufacturing facility in La Chaux-de-Fonds, Switzerland, in June 2014, which supplements Glenmark’s existing in-house discovery and development capabilities and supplies material for clinical development;
n Cipla’s announcement in 2014 of its fifth global acquisition deal within a year, by picking up a 51% stake for US$ 21 million in a pharmaceuticals manufacturing and distribution business in Yemen;
n The acquisition by Motherson Sumi Systems Ltd of Ohio-based Stoneridge Inc.’s wiring harness business for US$ 65.7 million in 2014;
State Major cities
R&D expenditure (%
of total)
Patents granted (%
of total)
Value-added m
anufacturing (%
of total)
FDI (% of total)
Maharashtra Mumbai, Pune 11 31 20 39
Gujarat Ahmedabad, Vadodara, Surat
12 5 13 2
Tamil Nadu Chennai, Coimbatore, Madurai
7 13 10 13
Andhra Pradesh* Hyderabad, Vijayawada, Visakhapatnam
7 9 8 5
Karnataka Bangalore, Mysore 9 11 6 5
Delhi Delhi – 11 1 14
Total for the above 46 80 58 78
Note: Andhra Pradesh was divided into two states, Telangana and Andhra Pradesh, on 2 June 2014. Located entirely within the borders of Telangana, Hyderabad is to serve as the joint capital for both states for up to 10 years.
Source: Central Statistical Organization; DST (2013); Department of Industrial Policy and Performance
Table 22.2: Distribution of innovative and manufacturing activity within India, 2010
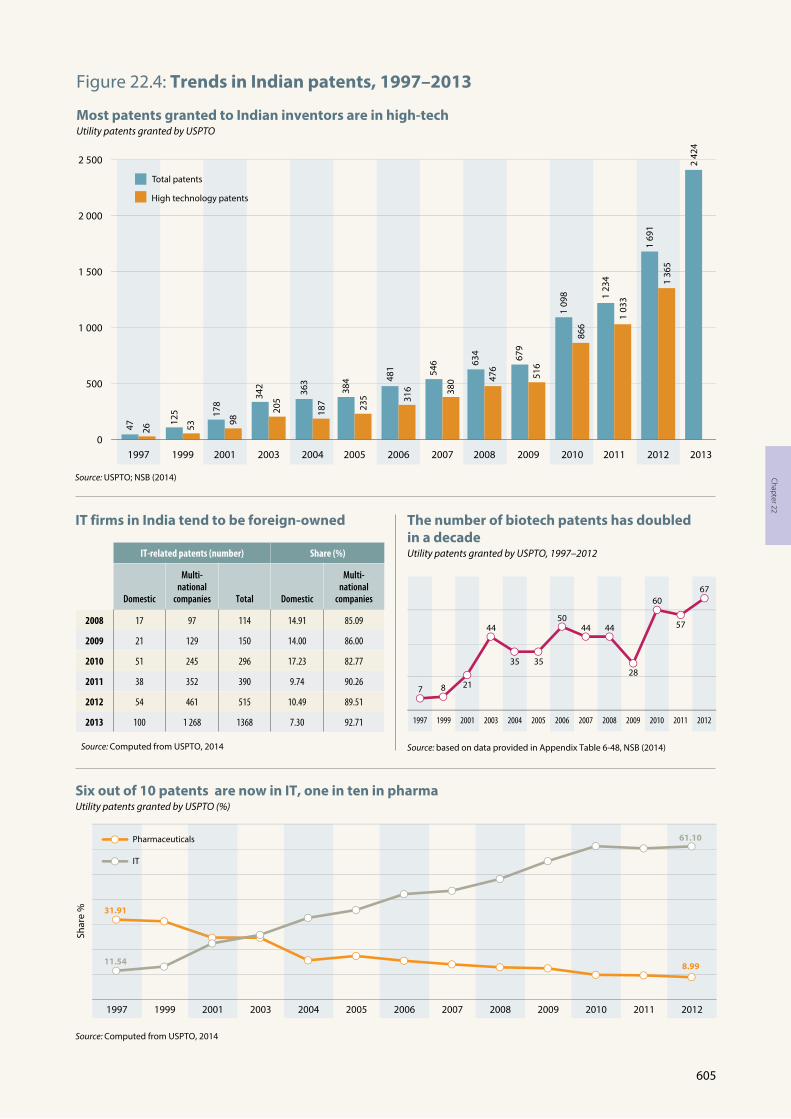
Figure 22.4: Trends in Indian patents, 1997–2013
Most patents granted to Indian inventors are in high-techUtility patents granted by USPTO
Six out of 10 patents are now in IT, one in ten in pharmaUtility patents granted by USPTO (%)
The number of biotech patents has doubled in a decadeUtility patents granted by USPTO, 1997–2012
IT firms in India tend to be foreign-owned
19970
500
1 000
1 500
2 000
2 500
1999 2001 2003 2004 2005 2006 2007 2008 2009 2010 2011 2012 2013
Total patents
47 26
125
53
178
98
342
205
363
187
384
235
481
316
546
380
634
476
679
516
1 09
8
866
1 23
4
1 03
3
2 42
4
1 69
1
1 36
5
High technology patents
Source: Computed from USPTO, 2014
IT-related patents (number) Share (%)
Domestic
Multi- national
companies Total Domestic
Multi- national
companies
2008 17 97 114 14.91 85.09
2009 21 129 150 14.00 86.00
2010 51 245 296 17.23 82.77
2011 38 352 390 9.74 90.26
2012 54 461 515 10.49 89.51
2013 100 1 268 1368 7.30 92.71
Source: Computed from USPTO, 2014
7
1997 1999 2001 2003 2004 2005 2006 2007 2008 2009 2010 2011 2012
8 21
44
35 35
5044 44
28
60
57
67
Source: based on data provided in Appendix Table 6-48, NSB (2014)
Source: USPTO; NSB (2014)
8.99
61.10
11.54
31.91
1997
Shar
e %
Pharmaceuticals
IT
1999 2001 2003 2004 2005 2006 2007 2008 2009 2010 2011 2012
605
Chapter 22
606
n Mahindra Two Wheelers made a binding offer in October 2014 to buy a 51% stake in Peugeot Motocycles, the world’s oldest manufacturer of motorized two-wheelers, from French car-maker Peugeot S.A. Group, for € 28 million (about Rs 217 crore).
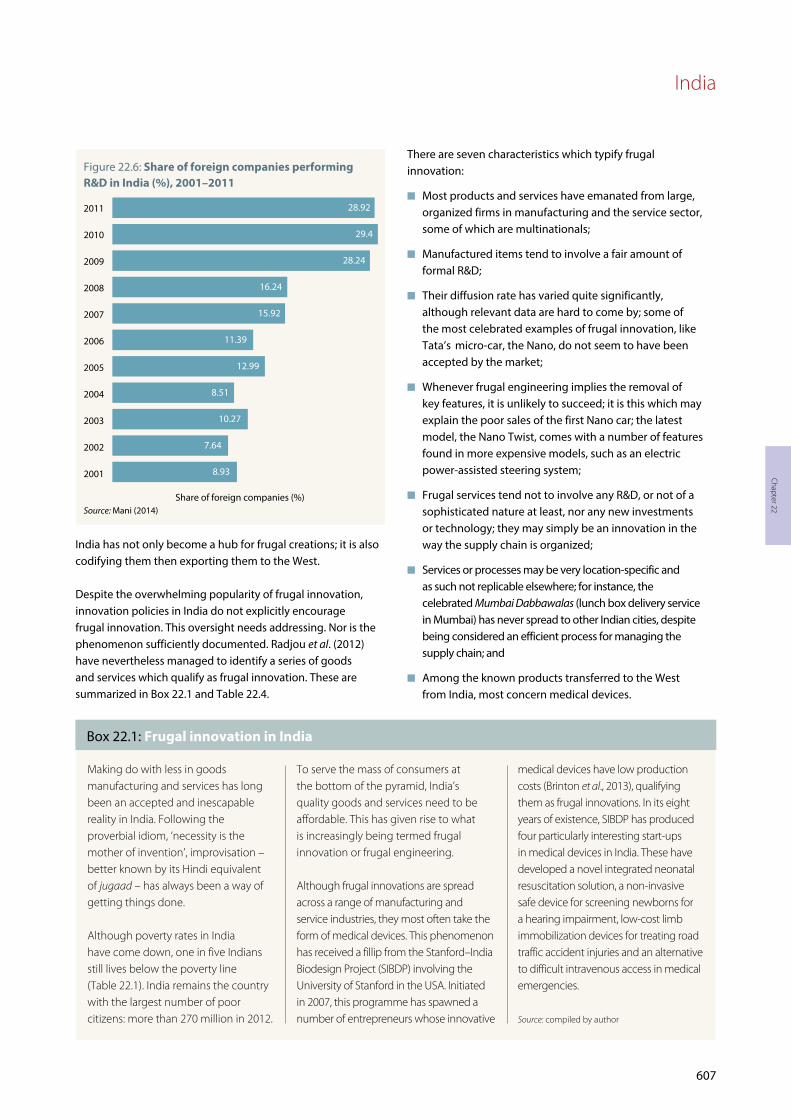
This trend is very pronounced in manufacturing industries such as steel, pharmaceuticals, automotive, aerospace and wind turbines. It is also very visible in service industries such as computer software development and management consulting. In fact, these mergers and acquisitions allow late-comer firms to acquire knowledge assets ‘overnight’. The government encourages firms to seize this window of opportunity through its liberal policy on FDI in R&D, its removal of restrictions on outward flows of FDI and its tax incentives for R&D. The growing globalization of innovation in India is a great opportunity, for it is turning the country into a key location for the R&D activities of foreign multinationals (Figure 22.6). In fact, India has now become a major exporter of R&D and testing services to one of the world’s largest markets for these, the USA (Table 22.3).
India has become a hub for frugal innovation Meanwhile, India has become a hub for what is known as frugal innovation. These products and processes have more or less the same features and capabilities as any other original product but cost significantly less to produce. They are most common in the health sector, particularly in the form of medical devices. Frugal innovation or engineering creates
Source: Computed from Reserve Bank of India (various issues)
-4 0002000 2001 2002 2003 2004 2005 2006 2007 2008 2009 2010 2011 2012 2013 2014
-3 500
-3 000
-2 500
-2 000
-1 500
-1 000
-500
0
500
1 000
1 500
2 000
2 500
3 000
3 5003 208
28154
-257
311
-3 400
US$
mill
ions
Payments
Receipts
Net trade balance
high-value products at an extremely low cost for the masses, such as a passenger car or a CAT scanner. Firms of all shapes and sizes employ frugal methods: start-ups, established Indian companies and even multinationals. Some multinationals have even established foreign R&D centres in India, in order to incorporate frugal innovation into their business model.
UNESCO SCIENCE REPORT
Table 22.3: Exports of R&D and testing services from India and China to the USA, 2006–2011
Exports (millions of US$) Share of national exports (%)
From India to the
USA
From China to the
USA
Total US exports from India & China India China
2006 427 92 9 276 4.60 0.99
2007 923 473 13 032 7.08 3.63
2008 1 494 585 16 322 9.15 3.58
2009 1 356 765 16 641 8.15 4.60
2010 1 625 955 18 927 8.59 5.05
2011 2 109 1 287 22 360 9.43 5.76
Note: This table lists only those R&D services exported from India and China by the affiliates of US multinational companies to their parent company in the USA
Source: National Science Board (2014)
Figure 22.5: Receipts, payments and net trade balance in the use of IPRs in India, 2000–2014
607
India
India has not only become a hub for frugal creations; it is also codifying them then exporting them to the West.
Despite the overwhelming popularity of frugal innovation, innovation policies in India do not explicitly encourage frugal innovation. This oversight needs addressing. Nor is the phenomenon sufficiently documented. Radjou et al. (2012) have nevertheless managed to identify a series of goods and services which qualify as frugal innovation. These are summarized in Box 22.1 and Table 22.4.
There are seven characteristics which typify frugal innovation:
n Most products and services have emanated from large, organized firms in manufacturing and the service sector, some of which are multinationals;
n Manufactured items tend to involve a fair amount of formal R&D;
n Their diffusion rate has varied quite significantly, although relevant data are hard to come by; some of the most celebrated examples of frugal innovation, like Tata’s micro-car, the Nano, do not seem to have been accepted by the market;
n Whenever frugal engineering implies the removal of key features, it is unlikely to succeed; it is this which may explain the poor sales of the first Nano car; the latest model, the Nano Twist, comes with a number of features found in more expensive models, such as an electric power-assisted steering system;
n Frugal services tend not to involve any R&D, or not of a sophisticated nature at least, nor any new investments or technology; they may simply be an innovation in the way the supply chain is organized;
n Services or processes may be very location-specific and as such not replicable elsewhere; for instance, the celebrated Mumbai Dabbawalas (lunch box delivery service in Mumbai) has never spread to other Indian cities, despite being considered an efficient process for managing the supply chain; and
n Among the known products transferred to the West from India, most concern medical devices.
Making do with less in goods manufacturing and services has long been an accepted and inescapable reality in India. Following the proverbial idiom, ‘necessity is the mother of invention’, improvisation – better known by its Hindi equivalent of jugaad – has always been a way of getting things done.
Although poverty rates in India have come down, one in five Indians still lives below the poverty line (Table 22.1). India remains the country with the largest number of poor citizens: more than 270 million in 2012.
To serve the mass of consumers at the bottom of the pyramid, India’s quality goods and services need to be affordable. This has given rise to what is increasingly being termed frugal innovation or frugal engineering.
Although frugal innovations are spread across a range of manufacturing and service industries, they most often take the form of medical devices. This phenomenon has received a fillip from the Stanford–India Biodesign Project (SIBDP) involving the University of Stanford in the USA. Initiated in 2007, this programme has spawned a number of entrepreneurs whose innovative
medical devices have low production costs (Brinton et al., 2013), qualifying them as frugal innovations. In its eight years of existence, SIBDP has produced four particularly interesting start-ups in medical devices in India. These have developed a novel integrated neonatal resuscitation solution, a non-invasive safe device for screening newborns for a hearing impairment, low-cost limb immobilization devices for treating road traffic accident injuries and an alternative to difficult intravenous access in medical emergencies. Source: compiled by author
Box 22.1: Frugal innovation in India
Source: Mani (2014)
Figure 22.6: Share of foreign companies performing R&D in India (%), 2001–2011
Share of foreign companies (%)
2001 8.93
2011 28.92
2010 29.4
2009 28.24
2008 16.24
2007 15.92
2006 11.39
2005 12.99
2004 8.51
2003 10.27
2002 7.64
Chapter 22

608
UNESCO SCIENCE REPORT
Table 22.4: Examples of frugal innovation in India
INNOVATION
COMPANY INVOLVED IN DEVELOPMENT DIFFUSION
GOODS
MICRO-PASSENGER CAR, THE TATA NANOThis product has a virtual monopoly in its niche market. The original Nano cost about US$ 2 000.
Tata Very low acceptance rate, as indicated by the declining sales. The car was marketed from 2009 onwards. Sales peaked at 74 521 in 2011–2012. The following year, they fell to 53 847 then to just 21 130 in 2013–2014.
SOLAR-POWERED GSM BASE STATIONThis system enables people in rural areas to use mobile phones. The World Global System for Mobile Communications (WorldGSM™) is the first commercially viable GSM system that is independent of the power grid. It runs exclusively on solar power and requires no backup from a diesel generator. It is also designed for simple delivery and deployment by local, untrained workers.
VNL Limited No data on its deployment
PORTABLE ELECTROCARDIOGRAM (ECG) MACHINE This machine (GE MAC 400) costs about US$ 1 500 and weighs about 1.3 kg, compared to US$ 10 000 and about 6.8 kg for a regular ECG machine.
General Electric Healthcare
There are no data on its diffusion. However, the product is very well accepted by the market and General Electric has exported this technology to its parent firm in the USA.
PORTABLE TOP LOADING REFRIGERATOR It has a capacity of 35 litres, runs on batteries and is priced at about US$ 70. It can be used in villages for storing fruit, vegetables and milk. It is known as Chotukool.
Godrej, an Indian company
In order to diffuse the technology, Godrej has joined forces with India Post. There are unconfirmed reports of 100 000 pieces having been sold in the first two years of production.
LOWEST POWER-CONSUMING AUTOMATIC TELLER MACHINE (ATMS)This machine is solar-powered and goes by the name of Gramateller.
Vortex, an Indian company, and the Indian Institute of Technology Madras
Leading banks such as the State Bank of India, HDFC and Axis Bank have adopted Vortex-designed and manufactured ATMs to service their rural customers.
ALTERNATIVE HOME-COOKING FUEL AND STOVEOorja combines a micro-gasification device or stove with a biomass-based pellet fuel.
First Energy, an Indian company
According to the company’s website, it has about 5 000 customers.
SERVICES
LARGE-SCALE, CHEAP EYE SURGERY Arvind Eye Care System
During 2012–2013, the hospital performed 371 893 surgical acts.
LOW-COST MATERNITY HOSPITALSThese hospitals provide quality maternity health care at 30–40% of the market price.
Life Spring Life Spring currently operates 12 hospitals in the city of Hyderabad, with plans to expand to other cities.
LOW-COST FINANCIAL SERVICESEko leverages existing retail shops, telecom connectivity and banking infrastructure to extend branchless banking services to the person in the street. Eko also partners with institutions to offer payment, cash collection and disbursal services. Customers can walk up to any Eko counter (retail outlet) to open a savings account, deposit and withdraw cash from the account, send money to any part of the country, receive money from any part of the world, buy mobile talk-time or pay for a host of services. A low-cost mobile phone acts as the transaction device for retailers and customers.
Eko Detailed number of Eko counters opened and functioning unavailable
Source: compiled by author
India
609
TRENDS IN GOVERNMENT RESEARCH
The government sector is the main employer of scientistsIf you take a group of 100 researchers in India, 46 will work for the government, 39 for industry, 11 for academia and 4 for the private non-profit sector. This makes the government the main employer. The government sector also spends the majority of the R&D budget (60%), compared to 35% for industry and just 4% for universities.
The government organizes its R&D through 12 scientific agencies and ministries. These have performed about half of GERD since 1991 but much of their output has little connection with business enterprises in either the public or private sectors. One-quarter of research in the government sector is devoted to basic research (23.9% in 2010).
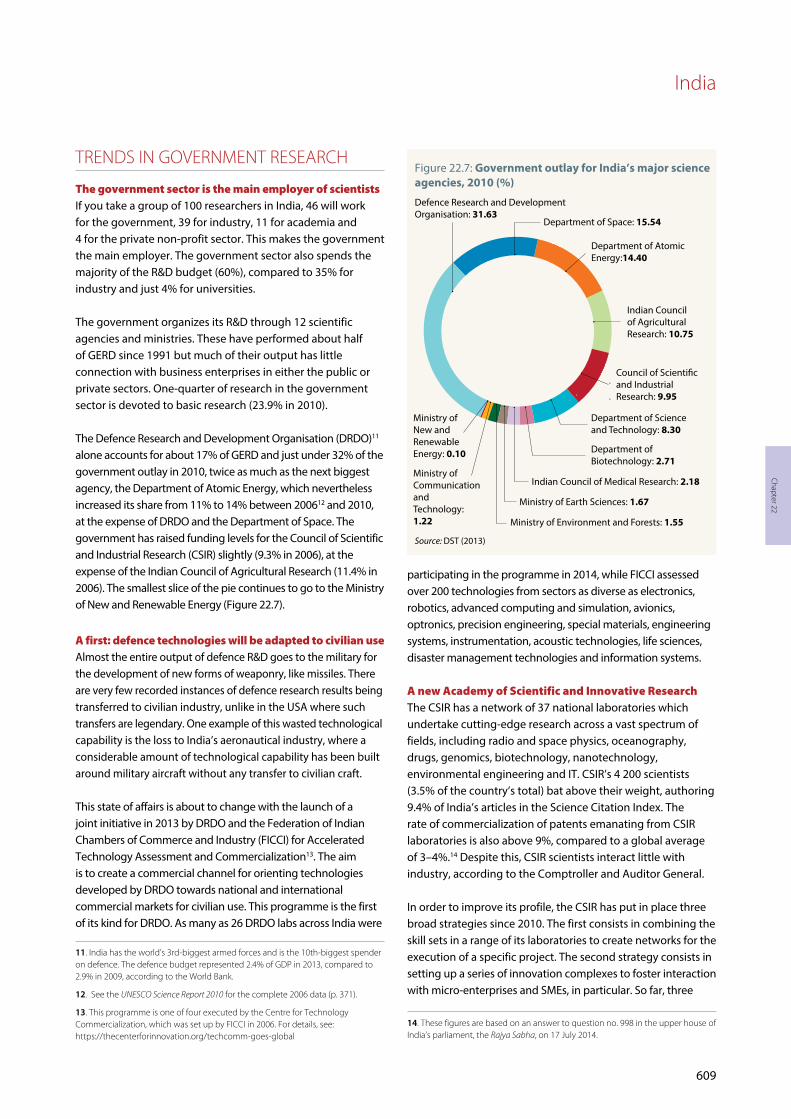
The Defence Research and Development Organisation (DRDO)11 alone accounts for about 17% of GERD and just under 32% of the government outlay in 2010, twice as much as the next biggest agency, the Department of Atomic Energy, which nevertheless increased its share from 11% to 14% between 200612 and 2010, at the expense of DRDO and the Department of Space. The government has raised funding levels for the Council of Scientific and Industrial Research (CSIR) slightly (9.3% in 2006), at the expense of the Indian Council of Agricultural Research (11.4% in 2006). The smallest slice of the pie continues to go to the Ministry of New and Renewable Energy (Figure 22.7).
A first: defence technologies will be adapted to civilian useAlmost the entire output of defence R&D goes to the military for the development of new forms of weaponry, like missiles. There are very few recorded instances of defence research results being transferred to civilian industry, unlike in the USA where such transfers are legendary. One example of this wasted technological capability is the loss to India’s aeronautical industry, where a considerable amount of technological capability has been built around military aircraft without any transfer to civilian craft.
This state of affairs is about to change with the launch of a joint initiative in 2013 by DRDO and the Federation of Indian Chambers of Commerce and Industry (FICCI) for Accelerated Technology Assessment and Commercialization13. The aim is to create a commercial channel for orienting technologies developed by DRDO towards national and international commercial markets for civilian use. This programme is the first of its kind for DRDO. As many as 26 DRDO labs across India were
11. India has the world’s 3rd-biggest armed forces and is the 10th-biggest spender on defence. The defence budget represented 2.4% of GDP in 2013, compared to 2.9% in 2009, according to the World Bank.
12. See the UNESCO Science Report 2010 for the complete 2006 data (p. 371).
13. This programme is one of four executed by the Centre for Technology Commercialization, which was set up by FICCI in 2006. For details, see: https://thecenterforinnovation.org/techcomm-goes-global
participating in the programme in 2014, while FICCI assessed over 200 technologies from sectors as diverse as electronics, robotics, advanced computing and simulation, avionics, optronics, precision engineering, special materials, engineering systems, instrumentation, acoustic technologies, life sciences, disaster management technologies and information systems.
A new Academy of Scientific and Innovative ResearchThe CSIR has a network of 37 national laboratories which undertake cutting-edge research across a vast spectrum of fields, including radio and space physics, oceanography, drugs, genomics, biotechnology, nanotechnology, environmental engineering and IT. CSIR’s 4 200 scientists (3.5% of the country’s total) bat above their weight, authoring 9.4% of India’s articles in the Science Citation Index. The rate of commercialization of patents emanating from CSIR laboratories is also above 9%, compared to a global average of 3–4%.14 Despite this, CSIR scientists interact little with industry, according to the Comptroller and Auditor General.
In order to improve its profile, the CSIR has put in place three broad strategies since 2010. The first consists in combining the skill sets in a range of its laboratories to create networks for the execution of a specific project. The second strategy consists in setting up a series of innovation complexes to foster interaction with micro-enterprises and SMEs, in particular. So far, three
14. These figures are based on an answer to question no. 998 in the upper house of India’s parliament, the Rajya Sabha, on 17 July 2014.
Source: DST (2013)
Figure 22.7: Government outlay for India’s major science agencies, 2010 (%)
Defence Research and Development Organisation: 31.63
Department of Space: 15.54
Department of Atomic Energy:14.40
Council of Scientific and Industrial Research: 9.95
Department of Science and Technology: 8.30
Department of Biotechnology: 2.71
Indian Council of Medical Research: 2.18
Ministry of Earth Sciences: 1.67
Ministry of Environment and Forests: 1.55
Indian Council of Agricultural Research: 10.75
Ministry of New and Renewable Energy: 0.10
Ministry of Communication and Technology: 1.22
Chapter 22

610
innovation complexes have been established in Chennai, Kolkatta and Mumbai. The third strategy consists in offering postgraduate and doctoral degrees in highly specialized fields where such training is not easily available in traditional universities; this led to the establishment of the Academy of Scientific and Innovative Research in 2010, which recently awarded its first master’s degrees and PhDs in science and engineering.
India’s scientific councils can call upon the services of the National Research and Development Corporation (NRDC). It functions as a link between scientific organizations and industries eager to transfer the fruits of endogenous R&D to industry. The NRDC has a number of intellectual property and technology facilitation centres and, on campuses around the country in major Indian cities, university innovation facilitation centres. The NRDC has transferred approximately 2 500 technologies and approximately 4 800 licensing agreements since its inception in 1953. The number of technologies licenced by NRDC increased from 172 during the Eleventh Five-year Plan period (2002–2007) to 283 by 2012. Despite these apparent instances of technology transfer, NRDC is not generally considered as having been successful in commercializing technologies generated by the CSIR system.
Funding not an issue in falling food crop yieldsSince the turn of the century, wheat yields have dropped and rice yields have stagnated (Figure 22.8). This worrying trend does not seem to be tied to any cutbacks in funding. On the contrary, agricultural funding has increased, whatever the point of comparison: in nominal and real terms, aggregate and per capita terms and against public funding of industrial research. Even the percentage share of agricultural research in agricultural GDP shows an increase over time. So funding per se does not appear to be an issue.15 An alternative explanation for this drop in yield may well be the observed decline in the numbers of agricultural scientists in India, including lower enrolment ratios in graduate degree programmes in agriculture. This state of affairs has prompted the government to propose two key measures in the union budget for 2014–2015 for the training of agricultural scientists and engineers:
n The establishment of two more centres of excellence, modelled on the lines of the Indian Agricultural Research Institute, one in the city of Assam and a second in Jharkhand, with an initial budget of Rs 100 crores (circa US$ 16 million) for 2014–2015; an additional amount of Rs 100 crores is being set aside for the establishment of an AgriTech Infrastructure Fund;
n The establishment of two universities of agriculture in Andhra Pradesh and Rajasthan and a further two universities of horticulture in Telangana and Haryana; an initial sum of Rs 200 crores has been allocated for this purpose.
15. This statement is corroborated by Pal and Byerlee (2006) and Jishnu (2014).
Growing private investment in agricultural R&DAnother interesting aspect is the rising share of private R&D in agriculture, primarily in seeds, agricultural machinery and pesticides. This trend does not have the same implications as an increase in public-sector investment in agricultural R&D would have, as the products generated by private R&D are likely to be protected by various mechanisms governing intellectual property rights, thereby increasing the cost of their diffusion to farmers.
The diffusion of genetically modified organisms (GMOs) among food crops has been curtailed for health and safety reasons by the Genetic Engineering Appraisal Committee of the Ministry of Environment and Forests. The only GM crop approved in India is Bt cotton, which was authorized in 2002. The area cultivated with Bt cotton had progressed to saturation level by 2013 (Figure 22.8). India has become the world’s top exporter of cotton and its second-biggest producer; cotton is a thirsty crop, however, and water a scarce commodity in India. Moreover, despite the increase in the average yield of cotton, there have been sharp fluctuations from one year to the next. The use of fertilizer and the spread of hybrid seeds may also have contributed to the rise in yield since 2002. More recently, the Indian Council of Agricultural Research has developed a Bt cotton variety cheaper than Monsanto’s with re-usable seeds.
The proposed extension of GMOs to food crops like brinjals (aubergine) has met with stiff resistance from NGOs and elicited words of caution from the parliamentary Committee on Agriculture in 2012. India’s own GMO research has been focusing on a range of food crops but with an emphasis on vegetables: potato, tomato, papaya, watermelon, castor, sorghum, sugar cane, groundnut, mustard, rice, etc. As of early 2015, no GM food crops had been released for cultivation pending clearance from the regulatory agencies.
A sustainable farming method challenges modern technologiesSustainable forms of agriculture have been reported from isolated parts of the country. The world’s most productive rice paddy farmer even comes from the state of Bihar in northeastern India. The farmer in question broke the world record not through modern scientific technologies but rather by adopting a sustainable method pioneered by NGOs known as the System of Rice Intensification. Despite this feat, diffusion of this method has been very limited (Box 22.2).
The biotech strategy is beginning to pay offBiotechnology is the eighth of India’s nine high-tech industries (Figure 22.3) and receives 2.7% of the government’s outlay for the 12 science agencies (Figure 22.7). Consistent policy support over the past two decades has allowed India to develop sophisticated R&D and a production capability to match. The Department of Biotechnology’s strategy has three
UNESCO SCIENCE REPORT

611
Note: The diffusion rate for Bt cotton resembles the familiar S-shaped pattern noted by many observers of the rate of diffusion of new technologies.
Source: VIB (2013)Source: Based on Table 8.3, Ministry of Finance (2014) Economic Survey 2013–2014
Figure 22.8: Changes in agricultural yields in India, 1980–2014Average annual growth in yield for key food crops in India, 1980–2014 (%) Diffusion rate of Bt cotton and growth in cotton yield, 2001–2013
IndiaG
row
th ra
te %
1980–1981 to 1989–1990
Rice
3.19
1.34 1.
82
3.1
1.83
1.29
1.24
1.05
0.75
2.43
1.15
2.31
4.1
-0.4
1
9.99
Wheat Sugarcane
Nineoilseeds
Cotton
1990–1991 to 1999–2000
2000–2001 to 2013–2014
Dif fusion rate of Bt cottonGrowth rate in yield 93
0.610
0
20
-20
40
60
80
100
-15.5
Rate
%
2001
2002
2003
2004
2005
2006
2007
2008
2009
2010
2011
2012
2013
Sumant Kumar, an illiterate young farmer from the village of Darveshpura in the State of Bihar, is now acknowledged as being the most productive paddy farmer in the world. He managed to grow 22 tonnes of rice from a single hectare, compared to a world average of 4 tonnes, by adopting the System of Rice Intensification (SRI). The previous record of 19 tonnes was held by a Chinese farmer.
SRI allows farmers to produce more from less. In other words, it is an example of frugal innovation. Five key characteristics differentiate it from conventional practices:
n the use of a single seedling instead of clumps;
n the transplanting of seedlings at a young age of less than 15 days;
n wider spacing in square planting;
n rotary weeding; and
n a greater use of organic manures.
The application of these five elements promises numerous advantages, including higher yield and a lesser requirement for both seeds and water.
SRI is thus ideally suited for countries like India where farmers are poor and water is extremely scarce.
SRI’s origins date back to the early 1980s when Henri de Laulanié, a French Jesuit priest and agronomist, developed the method after observing how villagers grew rice in the uplands of Madagascar.
According to a study by Palanisami et al. (2013) of 13 major rice-growing states in India, fields which have adopted SRI have a higher average productivity than those which have not.
Out of the four core SRI components typically recommended, 41% of SRI farmers have adopted one component, 39% two or three components and only 20% all the components. Full adopters
recorded the highest yield increase (3%) but all adopters had yields higher than conventional farmers. They also had higher gross margins and lower production costs than non-SRI fields.
Although India’s rice yield could significantly increase under SRI and modified SRI practices, a number of hurdles will first have to be overcome, according to the authors, namely a lack of skilled farmers available in time for planting operations, poor water control in the fields and unsuitable soils. Moreover, farmers also feel that the transaction (managerial) cost, although insignificant, still limits full adoption of SRI. Government intervention will thus be necessary to overcome these constraints.
Source: SRI International Network Resource Center (USA); Palanisami et al. (2013);www.agriculturesnetwork.org
Box 22.2: The world’s most productive paddy farmer is Indian
Chapter 22

UNESCO SCIENCE REPORT
612
thrusts: improving the quantity and quality of human resources in biotechnology; establishing a network of laboratories and research centres to work on relevant R&D projects; and creating enterprises and clusters to produce biotechnology products and services. Apart from the central government, several state governments have explicit policies for developing this sector. This has led to a surge in biotech-related publications and patents (Figure 22.4).
The biotechnology industry has five subsectors: biopharmaceutical (63% of total revenue in 2013–2014), bioservices (19%), agricultural biotech (13%), industrial biotech (3%) and bioinformatics (1%). The biotechnology industry grew by an average rate of 22% per annum between 2003 and 2014, although year-on-year growth rates show a declining trend (Figure 22.9).16 Approximately 50% of output is exported. The Department of Biotechnology is building a Biotech Science Cluster in Faridabad on the outskirts of the capital. The cluster includes the Translational Health Science Technology Institute and the Regional Centre for Biotechnology, the first of its kind in South Asia. The regional centre functions under the
16. These rates are computed using sales revenue in Indian rupees at current prices. However, if one were to convert these to US dollars and recompute the growth rates, the industry would have been near-stagnant since 2010. There are, however, no official surveys or data on the size of India’s biotechnology industry.
auspices of UNESCO, offering specialized training and research programmes in ‘new opportunity areas’ such as cell and tissue engineering, nanobiotechnology and bioinformatics. The emphasis is on interdisciplinarity, with future physicians taking courses in biomedical engineering, nanotechnology and bio-entrepreneurship.
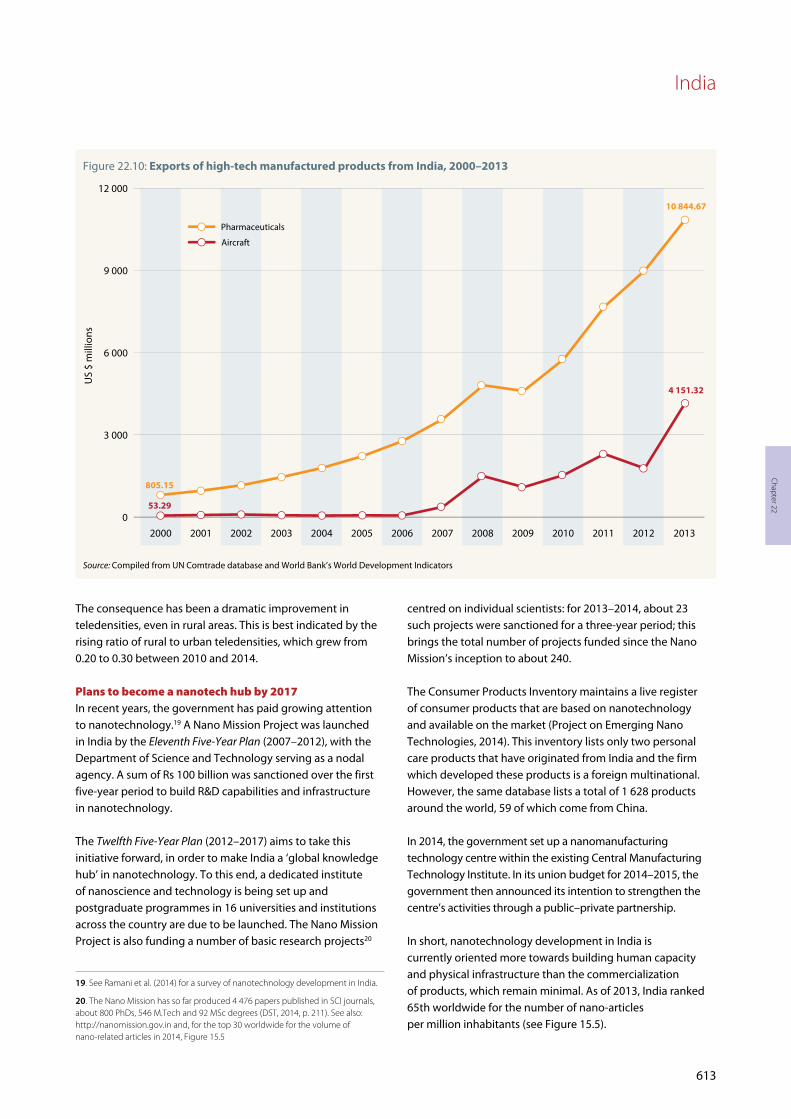
India is making a foray into aircraft manufacturingExports of high-tech manufactured products are increasing and now account for about 7% of manufactured exports (World Bank, 2014). Pharmaceuticals and aircraft parts account for almost two-thirds of the total (Figure 22.10). India’s technological capability in pharmaceuticals is fairly well known but her recent forays into the manufacturing of aircraft parts are a step into the unknown.
Recent elaborations of the Defence Purchase Policy17 and the policy on offsets seem to have encouraged local manufacturing. For instance, India is developing a regional transport aircraft through a mission-mode National Civil Aircraft Development project. Although largely initiated by the public sector, the project envisages participation by domestic private sector enterprises as well.
India is also continuing to improve its capability in the design, manufacture and launch of satellites18 and has ambitious plans for sending people to the Moon and exploring Mars.
India is deploying more high-tech servicesConsiderable improvements have been made in both the astronautic and even in the aeronautical segments of the IT industry. Leveraging capabilities in communication technologies and remote sensing, the country has made big strides in diffusing distance education and public health interventions. Over the years, the Indian Space Research Organisation’s telemedicine network has expanded to connect 45 remote and rural hospitals and 15 highly specialized hospitals. The remote/rural nodes include the offshore islands of Andaman and Nicobar and Lakshadweep, the mountainous and hilly regions of Jammu and Kashmir, including Kargil and Leh, Medical College hospitals in Orissa and some of the rural / district hospitals in the mainland states.
Big strides have been made in telecommunications services as well, especially in rural areas. India has shown by example that the best way of diffusing telecommunications in rural areas is to foster competition between telecom service providers, which react by lowering their tariffs.
17. India procures about 70% of its equipment needs abroad. The government adopted a defence procurement policy in 2013 which gives preference to indigenous production by Indian firms or within joint ventures.
18. For more on India’s space programme, see the box entitled A Space Odyssey in the UNESCO Science Report 2010, p. 367.
Source: Computed from the Association of Biotech Led Enterprises (ABLE), Biospectrum Survey changes in sales revenue at current prices
Figure 22.9: Growth of the Indian biotechnology industry, 2004–2014Based on sales revenue at current prices
40
35
30
25
20
15
10
5
0
2004
–200
5
Ann
ual p
erce
ntag
e ch
ange
in re
venu
e
2005
–200
6
2006
–200
7
2007
–200
8
2008
–200
9
2009
–201
0
2010
–201
1
2011
–201
2
2012
–201
3
2013
–201
4
34.15
7.25
India
613
The consequence has been a dramatic improvement in teledensities, even in rural areas. This is best indicated by the rising ratio of rural to urban teledensities, which grew from 0.20 to 0.30 between 2010 and 2014.
Plans to become a nanotech hub by 2017In recent years, the government has paid growing attention to nanotechnology.19 A Nano Mission Project was launched in India by the Eleventh Five-Year Plan (2007–2012), with the Department of Science and Technology serving as a nodal agency. A sum of Rs 100 billion was sanctioned over the first five-year period to build R&D capabilities and infrastructure in nanotechnology.
The Twelfth Five-Year Plan (2012–2017) aims to take this initiative forward, in order to make India a ‘global knowledge hub’ in nanotechnology. To this end, a dedicated institute of nanoscience and technology is being set up and postgraduate programmes in 16 universities and institutions across the country are due to be launched. The Nano Mission Project is also funding a number of basic research projects20
19. See Ramani et al. (2014) for a survey of nanotechnology development in India.
20. The Nano Mission has so far produced 4 476 papers published in SCI journals, about 800 PhDs, 546 M.Tech and 92 MSc degrees (DST, 2014, p. 211). See also: http://nanomission.gov.in and, for the top 30 worldwide for the volume of nano-related articles in 2014, Figure 15.5
centred on individual scientists: for 2013–2014, about 23 such projects were sanctioned for a three-year period; this brings the total number of projects funded since the Nano Mission’s inception to about 240.
The Consumer Products Inventory maintains a live register of consumer products that are based on nanotechnology and available on the market (Project on Emerging Nano Technologies, 2014). This inventory lists only two personal care products that have originated from India and the firm which developed these products is a foreign multinational. However, the same database lists a total of 1 628 products around the world, 59 of which come from China.
In 2014, the government set up a nanomanufacturing technology centre within the existing Central Manufacturing Technology Institute. In its union budget for 2014–2015, the government then announced its intention to strengthen the centre’s activities through a public–private partnership.
In short, nanotechnology development in India is currently oriented more towards building human capacity and physical infrastructure than the commercialization of products, which remain minimal. As of 2013, India ranked 65th worldwide for the number of nano-articles per million inhabitants (see Figure 15.5).
Source: Compiled from UN Comtrade database and World Bank’s World Development Indicators
Figure 22.10: Exports of high-tech manufactured products from India, 2000–2013
0
3 000
2000 2001 2002 2003 2004 2005 2006 2007 2008 2009 2010 2011 2012 2013
6 000
9 000
12 000
US
$ m
illio
ns
Pharmaceuticals
Aircraft
805.15
53.29
10 844.67
4 151.32
Chapter 22

UNESCO SCIENCE REPORT
614
Eight states out of 29 have explicit green energy policiesIndia’s innovation policy seems to be independent from other important economic development strategies like the National Action Plan on Climate Change (2008). The level of public investment in green energy sources is also modest, with the budget for the Ministry of New and Renewable Energy representing just 0.1% of the total government outlay in 2010 (Figure 22.7). The government is nevertheless encouraging power generation through various renewable energy programmes, such as wind, biomass, solar and small hydropower. It has also designed a mix of fiscal and financial incentives and other policy/regulatory measures to attract private investment. However, all this is confined to the central government level; only eight states21 out of 29 have explicit green energy policies.
Some Indian enterprises have acquired considerable technological capability in the design and manufacture of wind turbines, which is by far the most important source of grid-connected green technologies (76%). India, with
21. Andhra Pradesh, Chattisgarh,, Gujarat, Karnataka, Madhya Pradesh, Rajasthan, Tamil Nadu and Uttar Pradesh
an installed capacity of 18 500 MW, is the fifth-largest wind energy producer in the world, with considerable research and manufacturing capabilities. In 2013, three-quarters of India’s installations were based on wind technology, the remainder being in small hydropower and biomass (10% each) and solar energy (4%). Since 2010, the number of patents granted in green technologies has risen sharply (Figure 22.11).
A first green bond to enrich the domestic energy mixIn February 2014, the Indian Renewable Energy Development Agency (IREDA)22 issued its first ‘green bond,’ with terms of 10, 15 and 20 years and interest rates of just over 8%. The tax-free bond is open to both public and private investors. The Modi administration is targeting an investment of US$ 100 billion to help reach its goal of installing 100 gigawatts of solar energy across India by 2022. It has announced plans to train a 50 000-strong ‘solar army’ to staff new solar projects. In addition, a new National Wind Mission was announced in 2014 which is likely to be modelled on the National Solar Mission implemented by IREDA since 2010 (Heller et al., 2015).
22. Established in 1987, IREDA is a government enterprise administered by the Ministry of New and Renewable Energy. See: www.ireda.gov.in
Source: Based on appendix tables 6-58, 6.64 and 66 in NSB (2014)
Figure 22.11: Green energy technology patents granted to Indian inventors, 1997–2012
Total green technology patents
0
10
20
30
40
50
Alternative sources of energy
Wind
Solar
1997 1999 2001 2003 20052004 2006 2007 2008 2009 2010 2011 2012
0
46
28
13
5

India
615
TRENDS IN HUMAN RESOURCES
The private sector is hiring more researchersIf the number of R&D personnel23 in India increased annually by 2.43% between 2005 and 2010, this was entirely due to the 7.83 % increase each year in R&D personnel working for private companies. Over the same period, the number of government employees engaged in R&D actually declined, even though the government remains the largest employer of R&D personnel (Figure 22.12). This trend further substantiates the claim that India’s national innovation system is becoming increasingly business-oriented.
23. The term R&D personnel encompasses researchers, technicians and support staff.
This translates into a rise in the number of R&D personnel per 10 000 labour force from 8.42 in 2005 to 9.46 in 2010. This means that India still has a long way to go to reach the density achieved by developed countries and China.
Spectacular growth in the number of engineering studentsThe shortage of R&D personnel could hold India back on its climb up the technology ladder. Policy-makers are fully cognisant of this problem24 and have been putting in place a host of policies to boost university student rolls in science and
24. Two of the key elements of the Science, Technology and Innovation Policy of 2013 are: enhancing skills for applications of science among the young from all social strata; and making careers in science, research and innovation attractive for talented and bright minds.
Source: DST (2009; 2013)
Figure 22.12: Indian FTE researchers by sector of employment and gender, 2005 and 2010
Government Higher education Business enterprise and private non-profit Totals
2010
2005
269 198
441 126
Men
Women
Men
Women
Men
Women
Men
Women
226 218
42 980
374 824
66 302
22 100
22 100
19 227
2 873
149 828129 379
20 449
281 800
391 149
Men
Women
Men
Women
Men
Women
Men
Women
233 917
47 883
330 099
61 050
The breakdown of data by gender for researchers in higher education in 2005 is unavailable.
87 24974 082
13 167
0 50 100 150 200 250 300 350
Chapter 22

UNESCO SCIENCE REPORT
616
Note: Graduates include undergraduates, postgraduates, MPhil and PhD holders Source: Compiled from Department of Higher Education (2012) All India Survey of Higher Education 2011/2012, Tables 36 and 37
Figure 22.13: Indian science, engineering and technology graduates, 2011/2012
Science Engineering and technology Total
1 370 7662011
/201
2
Men
Women
Men
Women
Men
Women
767 845
602 921
378 414
792 615
578 151
0 50 100 150 200 250 300 350 400 450 500 550 600 650 700 750 800
389 431
414 201
188 720
engineering programmes. One of these schemes, INSPIRE, focuses in particular on developing a vocation for science among the young (Box 22.3).
Historically, India has tended to produce eight scientists for every engineer. This is partly a consequence of the uneven distribution of engineering colleges across different states, a situation which has prompted the government to double the number of Indian Institutes of Technology to 16 and to set up five Indian Institutes for Science Education and Research.25 Whereas there were 1.94 scientists for every engineer in 2006, this ratio had dropped to 1.20 by 2013.
In 2012, there were 1.37 million graduates in science, engineering and technology (Figure 22.13). Men made up about 58% of the total. Female students tend to be more concentrated in science streams, where they even outnumbered their male counterparts in 2012. There is already a sizeable share of engineering and technology students but it will be important for the country to raise the number of graduates in these fields, if it wishes to forge ahead with the desired expansion in manufacturing.
A need to give employers the skills they wantThe employability of scientists and engineers has been a nagging worry for policy-makers for years and, indeed, for prospective employers. The government has put in place a number of remedial measures to improve the quality of higher education (Box 22.3). These include a stricter control over universities, regular audits of the curriculum and facilities and faculty improvement programmes. The establishment of
25. In all, 172 universities were established between March 2010 and March 2013, bringing the total to 665 (DHE, 2012; 2014). None of the new institutions is a designated ‘innovation university,’ despite the government’s intention of setting up 14 such universities. See the UNESCO Science Report 2010, p. 369.
the Science and Engineering Research Board in 2010 has further fluidified the availability of research grants in the public science system.
The government is also experimenting ways of fostering university–industry ties. In 2012, for example, it partnered with the Confederation of Indian Industry to incite doctoral students to team up with industry for their doctoral thesis. Successful applicants are awarded twice the usual amount for doctoral fellowships for their thesis, as long as the project is initiated by their industrial partner.
The diaspora is being wooed for technology-based projectsAnother age-old issue concerns the migration of highly skilled workers. Although this phenomenon has been around since India gained independence in the 1940s, globalization has accentuated this trend over the past two decades or so. Mani (2012) has shown that, although high skilled migration may diminish the supply of scientists and engineers, it does generate a fair amount of remittances. In fact, India has become the largest receiver of remittances in the world. Skilled Indians living abroad have also helped India’s high-tech industries to grow, particularly its computer software services industry. A number of schemes have been put in place to encourage the diaspora to participate in technology-based projects. One of the most long-running of these is the Ramalingaswami Re-Entry Fellowship in biotechnology, set up in 2006. In 2013, 50 researchers from the diaspora were offered a place in Indian institutions as part of this scheme.

India
617
Indian universities are absent from the top places in international rankings. There is also a general feeling in India that the quality of the higher education system leaves much to be desired. Prospective employers have been complaining recently about the employability of the graduates churned out by local universities and colleges. In addition, just 4% of R&D in India is performed by the university sector. The government has put various schemes in place in the past decade to improve the quality of both university teaching and research. The following are some examples:
Rashtriya Uchchatar Shiksha Abhiyan (RUSA) was launched by the Ministry of Human Resource Development in October 2013. It aims to ensure that public universities and colleges conform to prescribed norms and standards and that they adopt accreditation as a mandatory quality assurance framework. Certain academic, administrative and governance reforms are a precondition for receiving funding under RUSA. All funding disbursed under RUSA is norm-based and outcome-dependent;
Further to the recommendations of the Eleventh Five-Year Plan (2007–2012), the University Grants Commission (UGC) introduced the semester system and a Choice-based Credit System at undergraduate level to give students a wider range of choices beyond their study discipline, offer them exposure to the world of work through internships and vocational training and enable them to transfer credits to another university.
In 2010, UGC issued regulations on Minimum Qualifications for the Appointment of Teachers and other Academic Staff in Universities and Colleges and Measures for the
Maintenance of Standards in Higher Education. Two years later, it issued regulations for the Mandatory Assessment and Accreditation of Higher Educational Institutions.
The UGC implements the Universities with Potential for Excellence scheme, which dates from the Ninth Five-Year Plan; by 2014, 15 universities were receiving funding under this scheme and the UGC was making a fresh call for proposals to extend this opportunity to 10 more hopefuls, including private universities.
The UGC runs the Faculty Research Promotion Programme to reinvigorate basic research in the university sector, including in medical and engineering sciences. This programme provides three types of support: a research grant for entry-level faculty and for mid-career faculty and a fellowship for senior faculty nearing retirement whose proven track record argues in favour of keeping them on staff to mentor younger faculty.
The Department of Science and Technology (DST) contributes to the cost of research, staffing costs, equipment purchase and so on, through its programme for the Promotion of University Research and Scientific Excellence (PURSE), which has provided 44 universities with research grants over the past decade on the basis of their publication record.
The DST administers the Fund for the Improvement of Science and Technology Infrastructure in Higher Educational Institutions (FIST), which dates from 2001 and supported 1 800 departments and institutions between 2010 and 2013.
Since 2009, the DST has improved research infrastructure at six of India’s universities for women, via the Consolidation of University Research for
Innovation and Excellence (CURIE) programme. The second phase of the programme got under way in 2012.
The DST introduced the Innovation in Science Pursuit for Inspired Research (INSPIRE) programme in 2009 to stimulate a vocation for science. INSPIRE runs science camps and presents awards to 10–15 year-olds and internships to 16–17 year-olds. By 2013, it had also awarded 28 000 scholarships for undergraduate studies in the sciences, 3 300 fellowships to complete a PhD and 378 faculty awards to researchers under the age of 32, 30% of which went to the diaspora returning home to India to take up research positions.
The DST programme for Intensification of Research in High Priority Areas (IRHPA) was launched during the Sixth Five-Year Plan. It has set up core groups, centres of excellence and national facilities in frontline and emerging fields of science and engineering, such as neurobiology, solid state chemistry, nanomaterials, materials science, surface science, plasma physics or macromolecular crystallography.
Institutions receiving funding from the Department of Biotechnology and the Department of Science and Technology are obliged to set up an institutional repository for articles written by their staff; in turn, the Ministry of Science and Technology has undertaken to set up a central harvester linking each institutional repository.
Source: Lok Sabha (parliament), answer by Minister of Human Resource Development to question number 159, 7 July 2014; DST (2014); government website
Box 22.3: Schemes to improve higher education in India
Chapter 22

UNESCO SCIENCE REPORT
618
n link technological capabilities in pharmaceutical and satellite technologies to the provision of services in health and education to the average Indian citizen: up until now, there has been little research on neglected tropical diseases and there has been a somewhat stultified use of satellite technologies to bring educational services to remote areas.
The biggest challenge of all for Indian policy-makers will be to tackle each of the aforementioned imperatives within a reasonable period of time.
REFERENCES Brinton, T. J. et al. (2013) Outcomes from a postgraduate
biomedical technology innovation training program: the first 12 years of Stanford Bio Design. Annals of Biomedical Engineering, 41(9): pp. 1 803–1 810.
Committee on Agriculture (2012) Cultivation of Genetically Modified Food Crops: Prospects and Effects. Lok Sabha Secretariat: New Delhi.
DHE (2014) Annual Report 2013–2014. Department of Higher Education, Ministry of Human Resources Development: New Delhi.
DHE (2012) Annual Report 2011–2012. Department of Higher Education, Ministry of Human Resources Development: New Delhi.
DST (2014) Annual Report 2013–2014. Department of Science and Technology: New Delhi.
CONCLUSIONIncentives have failed to create a broad innovation cultureFrom the foregoing, we can see that India’s national innovation system faces several challenges. In particular, there is a need to:
n spread responsibility for attaining a GERD/GDP ratio of 2% by 2018 between the government and business enterprise sectors: the government should use this opportunity to raise its own share of GERD to about 1% of GDP by investing more heavily in university research, in particular, which currently performs just 4% of R&D, in order to enable universities to fulfil their role better as generators of new knowledge and providers of quality education;
n improve the training and density of scientists and engineers engaged in R&D: in recent years, the government has multiplied the number of institutions of higher education and developed a vast array of programmes to improve the quality of academic research; this is already producing results but more needs to be done to adapt curricula to market needs and to create a research culture at universities; none of the new universities established since 2010 is a designated ‘innovation university,’ for instance, despite the declared intention of creating 14 such universities in the Eleventh Five-Year Plan (2007–2012);
n initiate a government assessment of the effectiveness of tax incentives for R&D: despite India having one of the most generous tax regimes for R&D in the world, this has not resulted in the spread of an innovation culture across firms and industries;
n orient a greater share of government research grants towards the business sector: currently, most grants target the public research system, which is divorced from manufacturing; there are no large research grants which target the business enterprise sector to develop specific technologies, with the notable exception of the pharmaceutical industry; the Technology Development Board, for instance, has been disbursing more subsidized loans than grants. In this regard, the Science and Engineering Research Board set up in 2010 to feed research grants into the wider science system is a step in the right direction, as is the scheme for the Intensification of Research in High Priority Areas;
n support the emergence of technology-based enterprises by giving this type of SME greater access to venture capital; although there has been a venture capital industry in India since the late 1980s, its role has remained restricted of late to providing mainly private equity. In this regard, it is promising that the union government’s budget for 2014–2015 proposes setting up a fund of Rs 100 billion (circa US$ 1.3 billion) to catalyse private equity, quasi equity, soft loans and other risk capital for start-ups;
KEY TARGETS FOR INDIA
n Raise GERD from 0.8% (2011) to 2.0% of GDP by 2018, half of which is to come from the private sector;
n Turn India into a global hub for nanotechnology by 2017;
n Raise the share of manufacturing from 15% (2011) to about 25% of GDP by 2022;
n Raise the share of high-tech products (aerospace, pharmaceuticals, chemicals, electronics and telecommunications) among manufactured products from 1% to at least 5% by 2022;
n Raise the share of high-tech goods among manufactured exports (currently 7%) by 2022;
n Install 100 gigawatts of solar energy across India by 2022.

India
619
DST (2013) Research and Development Statistics 2011–2012. National Science and Technology Information Management System. Department of Science and Technology: New Delhi.
DST (2009) Research and Development Statistics 2007–2008. National Science and Technology Information Management System. Department of Science and Technology: New Delhi.
Gruere, G. and Y. Sun (2012) Measuring the Contribution of Bt Cotton Adoption to India’s Cotton Yields Leap. International Food Policy Research Institute Discussion Paper 01170.
Heller, K. Emont, J. and L. Swamy (2015) India’s green bond: a bright example of innovative clean energy financing. US Natural Resources Defense Council. Switchboard, staff blog of Ansali Jaiswal, 8 January.
Jishnu, M. J. (2014) Agricultural research in India: an analysis of its performance. Unpublished MA project report. Centre for Development Studies: Trivandrum.
Mani, S. (2014) Innovation: the world’s most generous tax regime. In: B. Jalan and P. Balakrishnan (eds) Politics Trumps Economics: the Interface of Economics and Politics in Contemporary India. Rupa: New Delhi, pp. 155–169.
Mani, S. (2002) Government, Innovation and Technology Policy, an International Comparative Analysis. Edward Elgar: Cheltenham (UK) and Northampton, Mass. (USA).
Mani, S. (2012) High skilled migration and remittances: India’s experience since economic liberalization. In: K. Pushpangadan and V. N. Balasubramanyam (eds) Growth, Development and Diversity, India’s Record since liberalization. Oxford University Press: New Delhi,
pp. 181–209.
Mani, S. and R. R. Nelson (eds) (2013) TRIPS compliance, National Patent Regimes and Innovation, Evidence and Experience from Developing Countries. Edward Elgar: Cheltenham (UK) and Northampton, Mass. (USA).
Mukherjee, A. (2013) The Service Sector in India. Asian Development Bank Economic Working Paper Series no. 352.
NSB (2014) Science and Engineering Indicators 2014. National Science Board, National Science Foundation (NSB 14-01): Arlington Virginia, USA.
Pal, S. and D. Byerlee (2006) The funding and organization of agricultural research in India: evolution and emerging policy issues. In: P.G. Pardey, J.M. Alston and R.R. Piggott (eds) Agricultural R&D Policy in the Developing World. International Food Policy Research Institute: Washington, DC, USA, pp. 155–193.
Palanisami, K. et al. (2013) Doing different things or doing it differently? Rice intensification practices in 13 states of India. Economic and Political Weekly, 46(8): pp. 51–58.
Project on Emerging Nanotechnologies (2014) Consumer Products Inventory: www.nanotechproject.org/cpi
Radjou, N.; Jaideep, P. and S. Ahuja (2012) Jugaad Innovation: Think Frugal, Be Flexible, Generate Breakthrough Growth. Jossey–Bass: London.
Ramani, S. V.; Chowdhury, N.; Coronini, R. and S. E. Reid (2014) On India’s plunge into nanotechnology: what are good ways to catch-up? In: S. V. Ramani (ed) Nanotechnology and Development: What’s in it for Emerging Countries? Cambridge University Press: New Delhi.
Sanyal, S. (2014) A New Beginning for India’s Economy. Blog of 20 August. World Economic Forum.
Science Advisory Council to the Prime Minister (2013) Science in India, a decade of Achievements and Rising Aspirations. Department of Science and Technology: New Delhi.
UNDP (2014) Humanity Divided, Confronting Inequality in Developing Countries. United Nations Development Programme.
VIB (2013) Bt Cotton in India: a Success Story for the Environment and Local Welfare. Flemish Institute for Biotechnology (VIB): Belgium.
Sunil Mani (b. 1959: India) holds a PhD in Economics. He is Professor at the Planning Commission Chair in Development within the Centre for Development Studies in Trivandrum in the State of Kerala (India), where he is currently working on several projects related to innovation policy instruments and the development of new indicators. Over the years, Dr Mani has been an honorary Visiting Professor at several institutes and universities in Asia (India and Japan) and Europe (Italy, Finland, France, The Netherlands, Portugal, Slovenia and the UK).
Chapter 22