Embed Size (px)
Citation preview

UNESCO-IHE U N E S C O - I H E MSc Thesis-4/2008
INSTITUTE FOR WATER EDUCATION
Investigating the "Double Jeopardy" Issue in theWater Sector
The Limited (Applicability) of Partial "Metric"Benchmarking"
Doan Van Minh
MSc Thesis: 08.26April 2008
UNESCO-IHEInstitute for Water Education

UNESCO-IHE MSc Thesis-4/2008
UNESCO-IHEInstitute for Water Education
INVESTIGATING THE "DOUBLE JEOPARDY"ISSUE IN THE WATER SECTOR
THE LIMITED (APPLICABILITY) OF PARTIAL"METRIC" BENCHMARKING"
Master of Science ThesisBy
Doan Van Minh
SupervisorsProf. Dr. Meine Peter Van Dijk (UNESCO-IHE)
MentorMarco Schouten (UNESCO-IHE)
Examination committeeProf. Dr. Meine Peter Van Dijk (UNESCO-IHE), Chairman
Marco Schouten (UNESCO-IHE)Peter Ryan (IRC)
This research is done for the partial fulfilment of requirements for the Master of Science degree at theUNESCO-IHE Institute for Water Education, Delft, the Netherlands
DelftApril 2008
0
Lac ^ol £ od HI
UNESCO-IHE MSc Thesis-4/2008
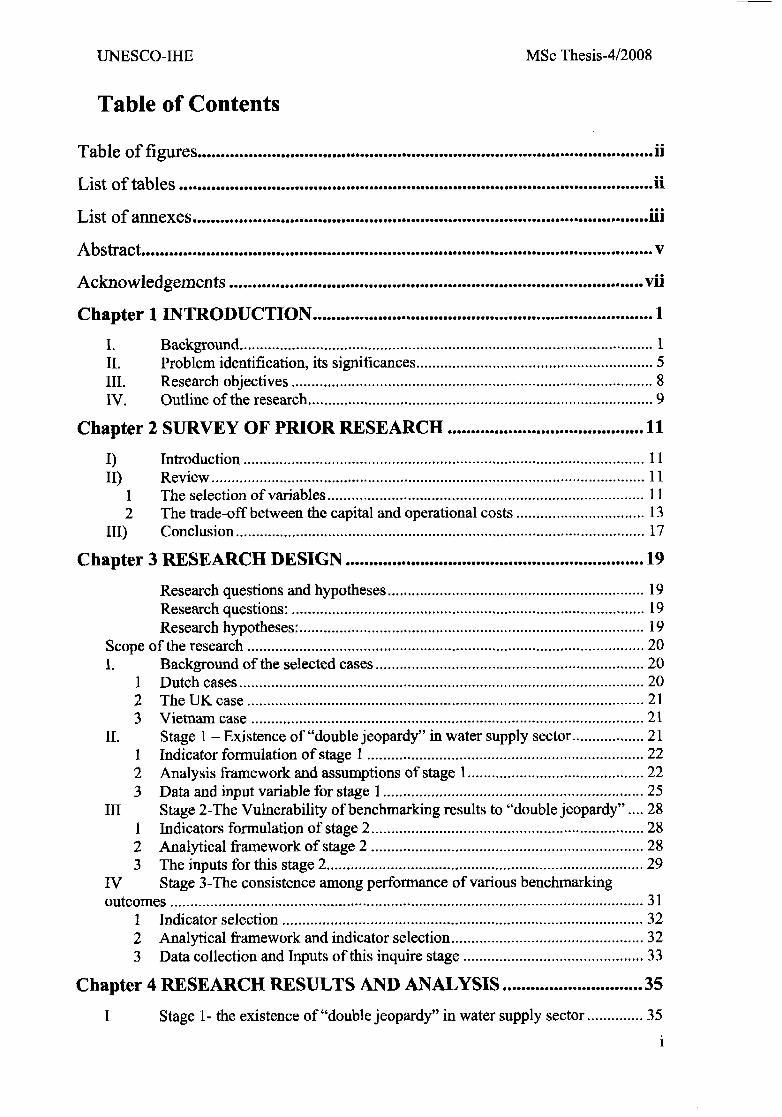
Table of Contents
Table of figures ii
List of tables ii
List of annexes iii
Abstract v
Acknowledgements vii
Chapter 1 INTRODUCTION 1
I. Background 1II. Problem identification, its significances 5III. Research objectives 8IV. Outline of the research 9
Chapter 2 SURVEY OF PRIOR RESEARCH 11
I) Introduction 11II) Review 11
1 The selection of variables 112 The trade-off between the capital and operational costs 13
III) Conclusion 17
Chapter 3 RESEARCH DESIGN 19
Research questions and hypotheses 19Research questions: 19Research hypotheses: 19
Scope of the research 20I. Background of the selected cases 20
1 Dutch cases 202 The UK case 213 Vietnam case 21
II. Stage 1 - Existence of "double j eopardy" in water supply sector 211 Indicator formulation of stage 1 222 Analysis framework and assumptions of stage 1 223 Data and input variable for stage 1 25
III Stage 2-The Vulnerability of benchmarking results to "double jeopardy".... 281 Indicators formulation of stage 2 282 Analytical framework of stage 2 283 The inputs for this stage 2 29
IV Stage 3-The consistence among performance of various benchmarkingoutcomes 31
1 Indicator selection 322 Analytical framework and indicator selection 323 Data collection and Inputs of this inquire stage 33
Chapter 4 RESEARCH RESULTS AND ANALYSIS 35
I Stage 1- the existence of "double jeopardy" in water supply sector 35
i
II Stage 2 - Vulnerability of benchmarking results to "double jeopardy" 371 Results of separated models 372 Assess the synthesis results of the three cases 43
III Stage 3-The consistence among various performance benchmarkingoutcomes 47
1 Total cost vs. operational cost benchmarking outcomes 472 UFW vs. total and operational cost benchmarking performance 493 Number of staffs per thousand connection vs. total and working ratio 504 Results of interview 51
Chapter 5 CONCLUSION AND RECOMMENDATION 53
Conclusions 53Recommendations 54Limitations of this study 54Reference 55
List of figures
Figure 1: Main areas of "metric" benchmarking 1
Figure 2: Results of various benchmarking approaches under the effects of "double
jeopardy" 8
Figure 3: Company average scores by different models 13
Figure 4: Capitalization in response to regulatory signals 14
Figure 5: Productivity change over time amongst the utilities 15
Figure 6: The Fitted line plot of index capital and index operational ratios in the three
cases 36
Figure 7: The Fitted line plot of capital and operational ratios in Dutch water supply.. 39
Figure 8: Fitted line plots between capital and operational ratio 41
Figure 9: Fitted line plots between capital and operational ratio 43
Figure 10: Regression of the three cases between capital and operational ratio 45
Figure 11; Performance scores of water companies unde
different approaches 48
Figure 12: The difference between TOTEX and OPEX performance 49Figure 13: UFW vs. Total and working ratio 50
Figure 14: Number of staffs per thousand connections vs. capital and working ratio... 51
List of tablesTable 1: Different approaches to "metric" benchmarking by various initiatives 3Table 2: Cost break down of a water companies 5Table 3: Specification of DEA models 12Table 4: Summary outputs of integrated regression model 35
ii
UNESCO-IHE MSc Thesis-4/2008
Table 5: Summary output of Dutch regression model (four year data) 38Table 6: Summary output of Dutch regression model (data in 1997 and 2000) 38Table 7: Summary output of Dutch regression model (data in 2003 and 2006) 39Table 8: Summary output of the UK regression model 40Table 9: Summary output of the Vietnam regression model 42Table 10: Comparison of R-square and correlation of different regression models 44
List of appendices
Annex 1 Key indicators of performance or "metric" benchmarking 57Annex 2: Types of "metric" Benchmarking 58Annex 3: Summary of financial indicators 59


UNESCO-IHE MSc Thesis-4/2008
Abstract
Currently, "metric" benchmarking has been widely applied in the water service sector. Itis argued being a managerial tool to boost the efficient performance of water servicesector in the absence of market mechanism in the sector.
At the same time, a consistent method in application of "metric" benchmarking in thesector is still on discussion. Some advocate the partial cost indicator method whileothers use the total cost indicator method. In addition, in relation with the indicatorselection, a term so called "double jeopardy" issue has received series of concerns byvarious authors on literature.
The uncompleted benchmarking approaches together with the "double jeopardy" issueraises a problem in efficient measurement of benchmarking practice. This problem isthe distortion of efficient benchmarking results by the "double jeopardy".
In this research, an analysis is made on the relation between capital costs andoperational indicators using three cases located in the Netherlands water supplycompanies in four years, and the UK over seven years and Vietnam in one year in orderto firstly examine the real existence of "double jeopardy" in the selected water sector,secondly get insight into the vulnerability of different benchmarking results to the"double jeopardy" issue, lastly test the consistence of different benchmarking results ina selected case.
Relationship between the capital and operational costs of the three selected cases isanalyzed by application of regression model. The consistence between benchmarkingresults is carried on by the application of comparative analyses.
The results from the regression model suggest that "double jeopardy" really exist in theselected cases and the results of partial benchmarking scheme are more vulnerable tothe "double jeopardy" issue. The comparative analysis shows that there is inconsistentbetween the partial and total cost benchmarking results. These research results complywith the current knowledge about the issues.
Within the findings of the research at hand, it enables the benchmarking initiatives toselect appropriate financial indicators to measure the efficiency of water utilities.


UNESCO-IHE MSc Thesis-4/2008
Acknowledgements
I would like to extend my sincere gratitude to organizations and individuals who helpedme to complete my M.Sc. study.
I would like to express my sincere gratitude to my supervisor Prof. Dr Meine Peter VanDijk for his overall supervision of this work with the clear guidance, and constantsupport.
My mentor Marco Schouten, to whom I sincerely acknowledge my hearted gratitude,encouraged me to think independently and in a scientifically disciplined manner, andweekly side by side in a half of year supported me to make this work possible.
I am also graceful to Dr. Klaas Schwarts, who organized the working in progressworkshop whereby the study received various useful comments. My special thanks aregiven to all of my colleagues in Water Service Department who contributed valuablesuggestions for the thesis.
I would like to thank the librarian staffs for their supports in achieving peer reviewedarticles and couching in the referral method.
I want to give my truly thanks and appreciations to Foreign Affairs of the NetherlandsGovernment through the Netherlands Fellowship Programme (NFP) and Unesco-IHEfinancially supported for making my study possible.
I would like to thank my employer-the Development Strategy Institute, ministry ofPlanning and Investment of Vietnam for nominating me to study and complete myM.Sc. at Unesco-IHE, the Netherlands.
Finally, I deeply excavated my acknowledgment to all my family members who senttheir sympathies and mental encouragement during my resident in Holland to completethis work, especially to my youth sister who cared for the routine activities of my familyduring my absence.
vn

UNESCO-IHE MSc Thesis-4/2008
Chapter 1 Introduction
The purpose of this chapter is to introduce generally the research topic. First, it showsthat benchmarking has been used widely in the public sector especially in water sector.Second, it presents different benchmarking methods used to measure efficiencies inpublic utilities. Lastly, the chapter raises a problem resulting from differentbenchmarking indicator selection by two benchmarking approaches.
I. BackgroundIn 1979, competitiveness of the Xerox's copiers was in extreme low position incomparison with those of its Japanese competitors. The costs for producing Xerox'scopying machines were equal to the price of those Japanese companies. This triggeredout a new management tool which was applied to boost the competitiveness of Xerox.Such a tool is called "benchmarking". The benchmarking tool has two main types. One
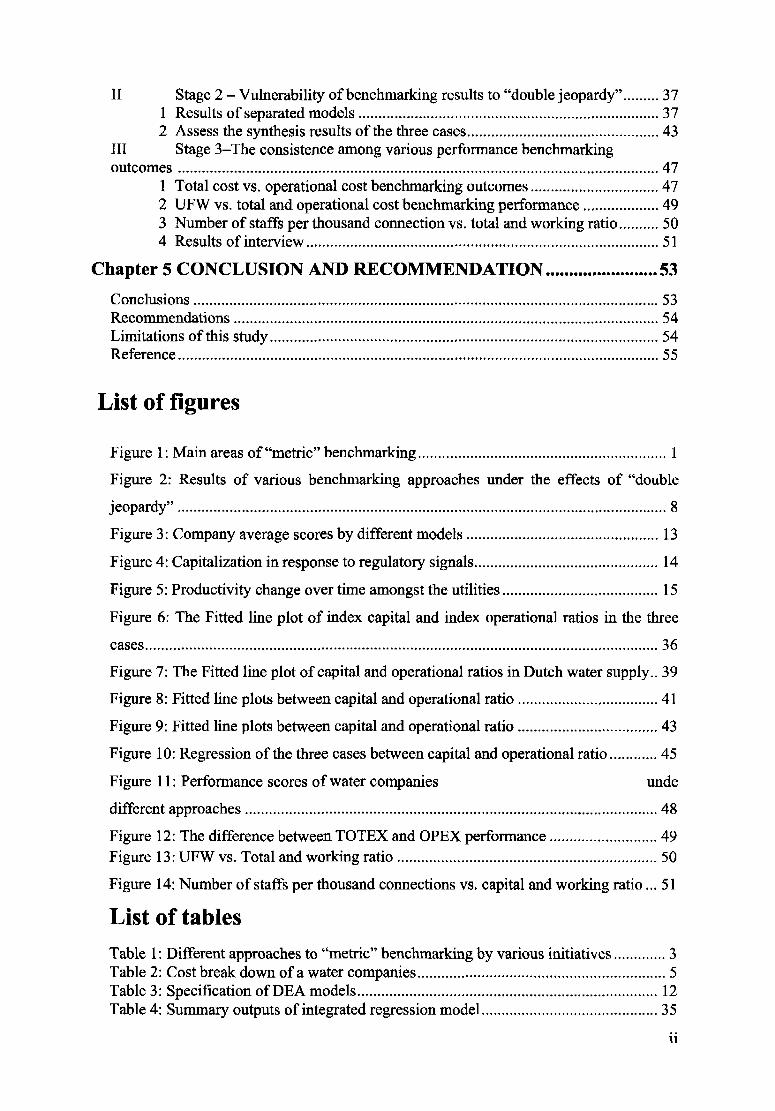
Water qualityQuality of drinkingwater expressed in
a single figure
Service
Clients polled onperception of
service
Reflections onperformance
Environment
Environmentalimpact expressed in
a single figure,efforts catalogued
Finance &
Efficiency
Tariff & costscollated in a closed
Figure 1: Main areas of "metric " benchmarkingSource: Larsson et al. (2002)
is Process Benchmarking, whose comparisons are based on the process of benchmarkedorganizations. The other is the "metric benchmarking" whose comparisons are based onperformance indicators.
Specifically, "Metric benchmarking" is the quantitative measurement of performance ofa utility against other utilities or the industry over time, using key performanceindicators (KPIs) which are not versatile to apply in any benchmarking schemes buteach initiative will tailor its own KPIs set. One example of KPIs by The InternationalBenchmarking Network for Water and Sanitation Utilities (IBNET) is presented inannex 1.
In "metric" benchmarking there are four areas needed to be measured as shown inFigure 1. Here the water quality complies with drinking water standards set byauthorities. The quality of service is the extent to which expectations of customers aremet. It is represented by indicators like reliability, responsiveness and consideration etc.
The environmental area is to estimate the impacts of water production and distributionon environment. This estimation is done by the application of environmental Life Cycle
1
Analysis according to Eco-Indicator method which was tailored by Kiwa to use in watersector. Lastly, the finance and efficiency area take into the revenue and all costspresented on balance sheets of water utilities.
In "metric" benchmarking as mentioned by Diewart and Nakamura (1999) the core of abenchmarking exercise is the selections of a set of indicators which measure givenaspects of a water company. Hence, careful selection of indicators allows thebenchmarking scheme to reflect closely the real performance of a water company.
Returning to the Xerox's story, after the application of benchmarking two years, in 1981the performance of Xerox achieved big improvement. Its labour costs reduced 30percentage and the defected machines also decreased by 90 percentages. Since then theapplication of benchmarking has been widely expanded over other giant corporationslike Motorola, General Motor, and AT&T. According to Ed Boyce, a vice president ofVienna, Virginia-based Kaiser Associates, 60 to 70 per cent of the largest UScompanies are undertaking some kind of benchmarking programs (Fong 1998).
The successful story of benchmarking application in private sector also conquers thepublic sector. Shleifer (1985) suggested a method of application of benchmarking in thepublic sector. The author's idea is to compare the costs of a public utility with anefficient utility in the industry. From the onset, around the world, benchmarking hasbeen receiving many promotions by various regulatory bodies and other initiatives suchas regulators use benchmarking to set revenue requirements in public sectors (Irastorza2003). They consider benchmarking an incentive to promote efficiency in the absenceof market mechanism in the public domain (Giannakis et al. 2004). Donors usebenchmarking to give loans to the utilities. Thus, objectives of benchmarking are toimprove performance and to implement new methods and processes that help toincrease the efficiency and competitiveness of an organization. It finds a "best practice"or frontier organizations, whereby both private and public sector can learn from thesefrontiers to improve their performance.
Though benchmarking is a useful management tool, its application in public sectors hasnot been straightforward yet. This is because of the fact that the application ofbenchmarking in public sector is very young (Kouzmin et al. 1999)
Moreover consistent theory of benchmarking in public sectors has not been welldeveloped. Thus, the methodology of benchmarking needs to be developed and verifiedfor practical application (Giannakis et al. 2004)
Like the other public sectors, benchmarking are also popular in water service sector,The International Benchmarking Review (2001) identified some 160 benchmarkingschemes covering at least 700 water/wastewater utilities in 110 countries. The mainmotivation to initiate metric benchmarking is that utilities may learn from another. Theidea is that not all problems and solutions of monopolistic providers are locallydependent, but standard solutions may be available elsewhere (UKWIR 2001). However,benchmarking exercises are not solely executed to enhance companies to leam fromanother. Benchmarking is also executed to increase overall insight in the performance ofthe sector, to set price levels, or to assess the eligibility of companies to access loansand grants. In many cases, one benchmarking scheme serves many of these purposes(see table 1).

UNESCO-IHE MSc Thesis-4/2008
One of the main challenges for water service benchmarking engineers is to tailor a set ofperformance indicators to the purpose of the benchmarking scheme (Kouzmin 1999)and (Diewart 1999). Even more, apart from the purpose, the set of performanceindicators also needs to be adjusted to other contextual factors, like the benchmarkingpartners and the accessibility of data (Drew 1997). Consequently the performanceindicators of the various benchmarking schemes vary considerably.
Table 1 shows that in all cases the purpose is for utilities to learn from another.However, some schemes have more ambitious goals. They also want to use thebenchmarking for setting prices (like in the UK), or to judge the eligibility to accessloans (like in Vietnam). The Vietnam case is interesting since the World Bank hasagreed to make two kinds of credit accessible to individual water utilities based on theirbenchmarking ranking. A higher ranking in the benchmark would enable utilities toaccess to higher level of debt (Sharifian 2002). Another observation from the Table isthat in case the goal is primarily to learn from another, the OPEX benchmarkingapproach seems to suffice. Only in the cases when additional purposes are served alsoTOTEX benchmarking is applied. Interestingly this does not apply for the Vietnamesebenchmarking which uses an OPEX benchmarking approach.
Table I: Different approaches to "metric" benchmarking by various initiatives
Region
Euro
America
Asia
Arica
Australia
International
Benchmarking scheme
The UK Office of Water (OFWAT)The Association of Dutch Water Companies(VEWIN)Norwegian association of water and wastewaterworks (NORVAR)'Finnish benchmarking model1
Danish Water and Waste Water Association1
American Water Work Association (AWWA)2
The PERU water regulator (SUNASS)J
Indian model4
Vietnam Water and Sewerage Association (VWSA)South East Asian Water Utilities Network(SEAWUN)The Water Utility Partnership (WUP) for capacitybuilding in AfricaAustralian model*The World BankThe international benchmarking network for waterand sanitation utilities (1BNET)
BenchnPur
Learning
+
+
+
+++++
+
+
++
+
Insight
+
+
+++++
+
narkingpose
Price
+
Loans
++
Benchmarkingapproach
CA
PEX
X
X
X
X
X
OPE
X
X
X
X
X
XXXX
X
X
XX
X
TO
TE
X
X
X
XX
X
1 Presented in Comparison and evaluation of the Northern European Benchmarking systems2 http://www.awwa.org3 Corton, M. L. (2003), Benchmarking in Latin Water Sector; the case of Peru, Utility Policy, 11, 133-142.4 2007 Benchmarking and Data Book of Water Utilities in India5 Australian National Performance Report 2005-06
In metric benchmarking, a broad division can be made in two alternative approaches forselecting performance indicators (Fong et al 1998). One way is to include only thepartial performance indicators, which are not set up based on the total cost. One popularapproach to partial benchmarking is to include operational costs. The main argument forselecting only operational indicators is that utilities are able to manipulate them in theshort term. The main indicator to assess the operational financial performance is in theOPEX (Operational Expenditures) benchmarking approach the working ratio6. Capitalexpenditures (CAPEX) are excluded from the benchmarking due to their more fixedcharacter. Besides, partial benchmarking also means to include merely the CAPEXindicators. In fact, CAPEX benchmarking is not executed independently but it is a partof a total benchmarking scheme like in the UK water benchmarking. The alternativeapproach is to include the full costs performance indicators. This approach is referred toas TOTEX (total expenditures) benchmarking and is based on the argument that theTOTEX indicators provide a more accurate reflection of the entirety of the costs ofservice provision. The main performance indicators in the TOTEX relate the total coststo the total output of the utility (like water delivered number of connections). The table1 above presents the approaches used of selected benchmarking schemes in the watersupply and sanitation sector. This argument is strengthened by the sector's capitalintensity7 (Table 2), making the weight of the CAPEX in the full costs for water high.
Since this study is to focus on the efficiency area of "metric" benchmarking, the costsmentioned above should be broken down in more detail. These costs include threeelements; cost of capital, depreciation and operational costs.
There are different methods to classify costs; in this study the method mentioned byLarsson et al. (2002) is used. The full cost of water utilities is separated in the followinggroups:
Operational costs (OPEX): these costs are related to daily operation of waterutilities, they are totally transferred into the value of water produced. Examples of thesecosts are labour, materials, communication etc.
Capital costs (CAPEX): these costs are connected with the capital used by waterutilities. Any water utilities need capital to operate. When employed capital brings withitself costs. This cost is divided in sub-categories, which are:
- Depreciation: this cost is associated with the fixed assets of water utilities. It is apart of fixed asset value that is transferred gradually into the value of waterproduced. It should be make clear here that in accounting term, depreciation isconsidered operational cost. However, due to its strong link to investment andconstant over time, then for the purpose of this study, depreciation is put in thecapital cost group.
- Cost of loan capital: a part of the total capital investment is borrowed and thisneeds interest payment for the lenders.
- Cost of equity capital: investors also invest by their own money, and when doingthis, they require a rate of return on the investment amount.
6 Working ratio is calculated by dividing the operational costs by the operational revenues.CAPEX in the water industry accounts for 65 to 80% of the full costs of supplying the service
(Kessides, 2003; Noll, 2000).
UNESCO-IHE MSc Thesis-4/2008
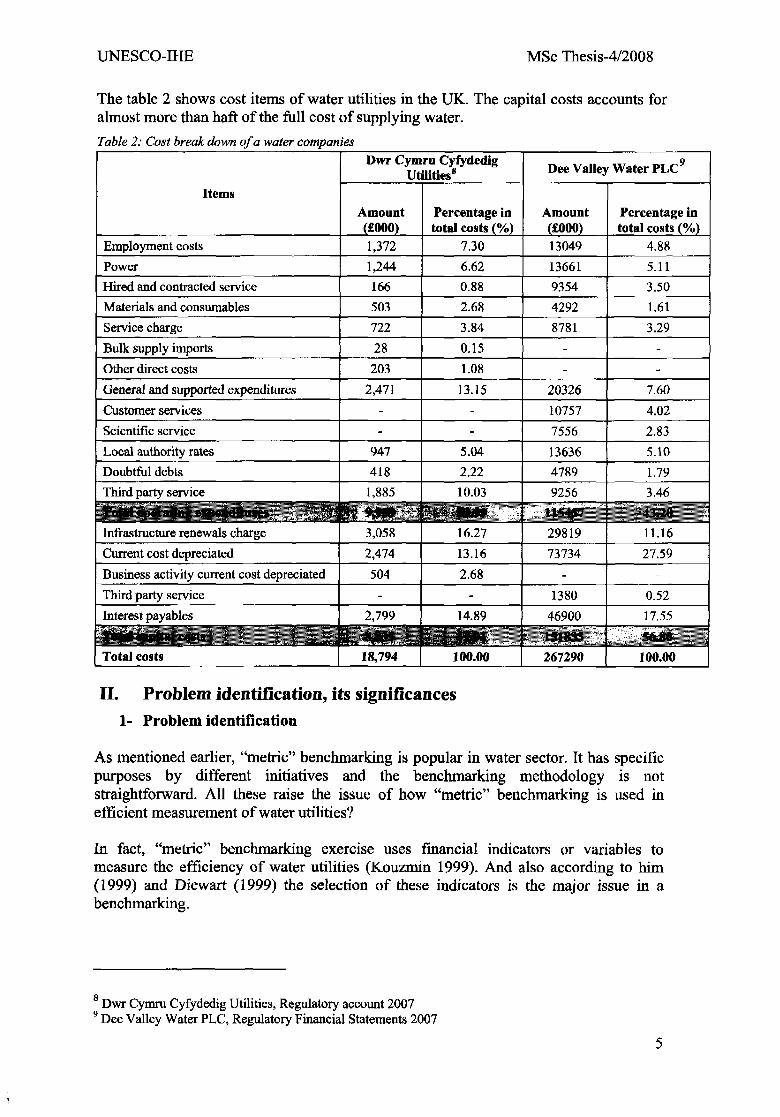
The table 2 shows cost items of water utilities in the UK. The capital costs accounts foralmost more than haft of the full cost of supplying water.
Table 2: Cost break down of a water companies
Items
Employment costs
Power
Hired and contracted service
Materials and consumables
Service charge
Bulk supply imports
Other direct costs
General and supported expenditures
Customer services
Scientific service
Local authority rates
Dwr Cymru CyfydedigUtilities8
Amount(£000)1,372
1,244
166
503
722
28
203
2,471
-
-
947
Doubtful debts j 418
Third party service
1 Infrastructure renewals charge
Current cost depreciated
Business activity current cost depreciated
Third party service
Interest payables
fftNMlfe*|iitalc0Vtfl . . •. j , i l , 3
Total costs
1,885
3,058
2,474
504
-
2,799
18,794
Percentage intotal costs (%)
7.30
6.62
0.88
2.68
3.84
0.15
1.08
13.15
-
-
5.04
2.22
10.03
16.27
13.16
2.68
-
14.89
100.00
Dee Valley Water PLC9
Amount(£000)13049
13661
9354
4292
8781
-
-
20326
10757
7556
13636
4789
9256
29819
73734
-
1380
46900
151833
267290
Percentage intotal costs (%)
4.88
5.11
3.50
1.61
3.29
-
-
7.60
4.02
2.83
5.10
1.79
3.46
11.16
27.59
-
0.52
17.55
100.00
II. Problem identification, its significances1- Problem identification
As mentioned earlier, "metric" benchmarking is popular in water sector. It has specificpurposes by different initiatives and the benchmarking methodology is notstraightforward. All these raise the issue of how "metric" benchmarking is used inefficient measurement of water utilities?
In fact, "metric" benchmarking exercise uses financial indicators or variables tomeasure the efficiency of water utilities (Kouzmin 1999). And also according to him(1999) and Diewart (1999) the selection of these indicators is the major issue in abenchmarking.
Dwr Cymru Cyfydedig Utilities, Regulatory account 2007' Dee Valley Water PLC, Regulatory Financial Statements 2007

There are two approaches to choose the financial indicators, which are partial or totalcost approaches. In the first situation, benchmarking initiatives can choose eitheroperational cost or capital cost variables. Like in the UK, partial approach has beenexisting (Giannakis et al. 2004) and Graham (2005) while Dutch and Norwegianregulators have preferred to use the total cost benchmarking Ajodhia (2004). Underspecific regulatory purposes, the issue of choosing different indicators is that which one(partial or total cost indicators) are the best to measure the real efficiency of waterutilities and what are the regulated utilities' behaviours under defined set of indicators .
The behaviours of benchmarked utilities first are concerned by Ajodhia et al. (2005)when the authors mentioned about the "double jeopardy" issue. "Double jeopardy" is aterminology used to describe the allocating and accounting trade-off between the capitaland operational costs. The allocating trade-off relates to the investment decision. Theutilities may use different capital and labour ratio to produce the same amount of output.In this trade-off there may be inefficient if the utilities want to meet regulatory standardsby using suboptimal capital and labour ratio. The accounting trade-off is the way thatthe utilities dealing with its costs. Utilities may re-name the operational cost by capitalcosts to meet the regulatory standards in benchmarking. These authors conclude that toeliminate the trade-off, full cost benchmarking should be used and it can achieve moreconsistent outcomes than building-blocks benchmarking".
Moreover, the issue of "double jeopardy" is also examined by Jamasb et al. (2004) inother term which is called "Gaming". In incentive benchmarking regulation, Gaming isthe type of behaviours that aims to increase profits without achieving real efficiencygains. These authors also defined two types of Gaming. One does not have a materialeffect on the efficient operation of the utilities and is intended to present theperformance of the firm in a more favourable light like the case of shifting operationalcosts into capital costs. The other is to distort the efficient level of the utilities byincreasing of the utilities' cost base (suboptimal capital and labour ratio) or delayingefficient improvement.
The important note about the "double jeopardy" and Gaming terminology is that the twoterminologies in some extend are overlapped each other. Specifically, the accountingtrade-off and a part of allocating trade-off, which increases the cost base in the "doublejeopardy" is the "Gaming" activities. Because in both the two situations, there is anendeavour to make benefit without improvement in the efficiency. On the other hand,activities not mentioned by the "double jeopardy" such as firms try to influence thechoice of methods, variables, and the definition of variable during the consultationperiod etc (Jamasb et al. 2003) are parts of "Gaming". In contrast, the optimal allocatingtrade-off in the "double jeopardy" is not a "Gaming" activity. Thus, the twoterminologies are partial overlapped.
The implication behind both "double jeopardy" and Gaming in some extend is the trade-off between the capital costs and operational costs of water utilities.
The philosophy to explain for the trade-off between operational and capital cost refersto the Cobb-Douglas function.
Q = AKal>~a 0-1Where A is a positive constant, a is positive fraction, K and L are the amount ofoperational and capital cost consumption respectively, and lastly Q denotes to the
UNESCO-IHE MSc Thesis-4/2008
quantity produced. This function has a characteristic that its isoquants has negativeslopes. Imply that there is a trade-off between the two variables.To proof this, taking the natural log of both sides of the equation 2-1
Ini4 + a l n l + ( l - a ) l n l - l n < ? = 0 0-2Which implicitly define L as a function of K. Application of implicit derivation rules tothe 2-2 equation, and then we have
dK dF/dL (1-a/L) fiKdl dF/dK (a/K) aL
<0 2 -3
If this function is considered a production function of water utilities, and K and L arecapital costs and operating costs respectively, then due to the downward slope of theiso-quantity curve there is always a sacrifice operating costs for capital costs. The driverfor this trade-off is to hide specific costs in order to provide unreal efficient level.Because of this activity, partial cost benchmarking may be inconsistent in its results.
The trade-off mentioned in Cobb-Douglass function reflects the law of reducingmarginal benefit of capital and operational costs. This trade-off is exponential functionand the natural behaviour of a utility under a normal environment.
High and varied CAPEX are also characteristics of water service industry. This could beseen in the Table 2 where the CAPEX accounts for 47% (the first company) and 57%(the second company) of the full cost for supplying water. In addition, (Kessides 2003)and (Noll et al 2000) also mentioned that capital costs of potable water industryaccounts for 65 to 80% of cost for supplying the service This large proportion of fixedcosts in water industry makes it possible to transfer its operational cost to its fixed costswithout a big notice by regulators. This transfer has severe effects on the operationalcosts while small increases in the fixed part. Thus, when a benchmarking usesoperational cost variables, the benchmarking organization with incentives to reduceoperational costs may hide them in the fixed cost parts. Moreover, the fixed or capitalcosts accounts for a large part of full cost of water provision. If it does not use inbenchmarking scheme, then that benchmarking practice has omitted the majority andtaken into account only the minority of the costs for supplying water. Within thisrespect, the real efficient performance is not reflected wholly in the benchmarkingresults.
One of the risks emerging in using OPEX benchmarking is that providers may betempted either to purposely manipulate the data, or to boost their operationalperformance at the cost of higher CAPEX. To boost their operational performance theymay categorize OPEX costs under a CAPEX cost category. To have a higher capitalcost allowance, providers may have inefficient investment decision or delay the efficientimprovement. This possibility for manipulation may implicate that there is a trade-offbetween the CAPEX and the OPEX performance of water providers. This trade-offbetween OPEX and CAPEX is also referred to as the "double jeopardy" issue (Ajodhiaet al., 2005) and Gaming (Jamasb et al., 2004).
In conclusion, the selection of either the OPEX or the TOTEX approach in metricbenchmarking under the existence of "double jeopardy" issue is likely to result in thedifference in the efficient measurements of each benchmarking approach.
2- Significance of the study
This research is importance since it expands the test of "double jeopardy" issue to twomore cases which are the Dutch supply sector and Vietnam water service sector. In thissense, it contributes to the body of "double jeopardy" knowledge two empirical results.That before is mainly discussed in the UK water service sector and the other publicsectors.
Additionally, this study contributes to the benchmarking methodology in water servicesector in a way that it points out benchmarking initiatives with their specific objectivesshould carefully address either partial or total cost indicators in relation with theobjectives otherwise it may lead to the their unachievable objectives.
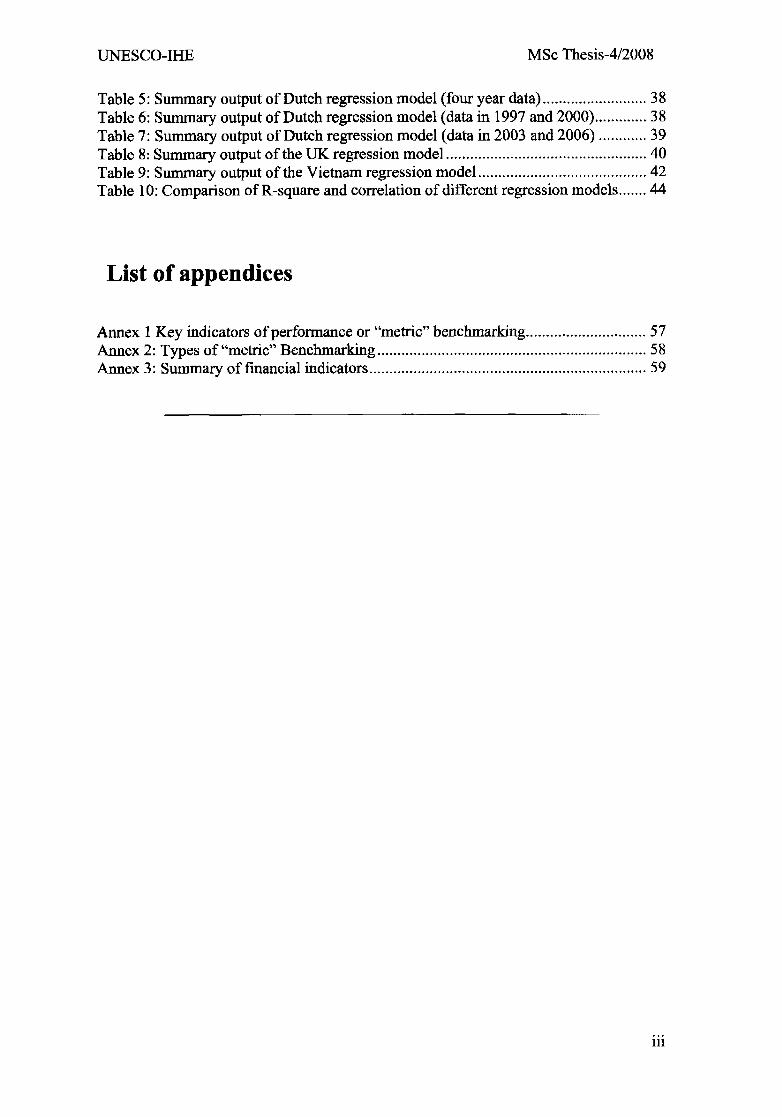
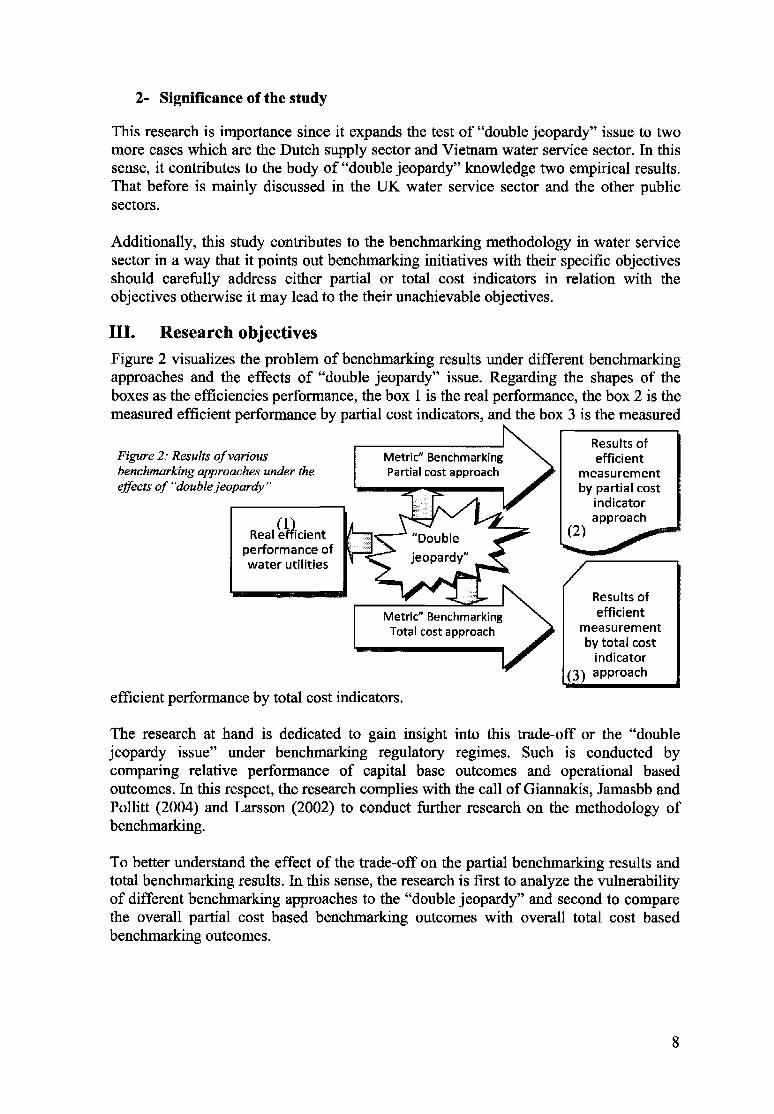
III. Research objectivesFigure 2 visualizes the problem of benchmarking results under different benchmarkingapproaches and the effects of "double jeopardy" issue. Regarding the shapes of theboxes as the efficiencies performance, the box 1 is the real performance, the box 2 is themeasured efficient performance by partial cost indicators, and the box 3 is the measured
Figure 2: Results of variousbenchmarking approaches under theeffects of "doublejeopardy"
Metric" BenchmarkingPartial cost approach
Real efficientperformance ofwater utilities
Results ofefficient
measurementby partial cost
indicatorapproach
(2)
Metric" BenchmarkingTotal cost approach
Results ofefficient
measurementby total cost
indicator(y\ approach
efficient performance by total cost indicators.
The research at hand is dedicated to gain insight into this trade-off or the "doublejeopardy issue" under benchmarking regulatory regimes. Such is conducted bycomparing relative performance of capital base outcomes and operational basedoutcomes. In this respect, the research complies with the call of Giannakis, Jamasbb andPollitt (2004) and Larsson (2002) to conduct further research on the methodology ofbenchmarking.
To better understand the effect of the trade-off on the partial benchmarking results andtotal benchmarking results. In this sense, the research is first to analyze the vulnerabilityof different benchmarking approaches to the "double jeopardy" and second to comparethe overall partial cost based benchmarking outcomes with overall total cost basedbenchmarking outcomes.
UNESCO-IHE MSc Thesis-4/2008
IV. Outline of the research
This thesis is structured into five chapters. The introduction chapter is to present therelevance of this research with the reality of water service sector and raise the problemcurrently exists.
The second chapter comes with the aim of getting insight into the current knowledgeabout the research problem by reviewing specific peer reviewed articles. Specifically, itfocuses on the roles of the indicator selection in benchmarking practice and the "doublejeopardy" currently occurring in the public sector.
The chapter three is to develop the analytical framework for this study. First the chapterpresents the research questions and hypotheses. Second, basing on the three researchquestions and hypotheses, it is structured into three stages. Each stage focuses on oneresearch question and hypotheses and has its own research method, data and. The firsttwo stages apply regression model and use the data from the three cases. The last stageuse comparative method and use the data from Vietnam one case.
Chapter 4 is to present the results of each stage as mentioned in the chapter 3. Theresults of the first two stages are developed in the same order. Fist, the regression modelresults and testing the significant of regression parameters are shown, and then theanalysis and conclusion come in. In the results of the last stage, the comparison chartsare presented together with their analyses.
Lastly, chapter 5 is about the recommendations and limitations of the study.

UNESCO-IHE MSc Thesis-4/2008
Chapter 2 Survey of prior research
The purpose of this chapter is to analyze critically the use of variables and their effectson "metric " benchmarking outcomes through summary, classification, and comparisonof prior peer reviewed articles. Moreover, it also refers to the issue of trade off betweenthe capital costs and operational costs of public utilities.
I) Introduction
As mentioned in chapter 1, "metric" benchmarking which uses cost indicators has beenemployed for various objectives by different initiatives in public sector. Abenchmarking exercise is able to take either total cost indicators or partial costindicators depending upon specific initiatives and objectives of that benchmarkingexercise. However, the fact is that the selection of indicators or variables is crucial for abenchmarking exercise. Applying different set of indicators or variables may produceinconsistent benchmarking outcomes and the trade-off between them. This issue hasreceived concerns by various authors. This literature survey is conducted to define anoverview of this issue. First, it would review the implication of total or partial costbenchmarking for efficiency purpose. Second, it focuses on effects of indicatorsselection on benchmarking outcomes. Lastly, it shows the trade off in the capital andoperational cost of public utilities. The reviewed articles are both qualitative andquantitative base.
II) Review1 The selection of variables
To develop the arguments for the integration of price and quality in a benchmarkingexercise in electrical sector, Giannakis et al. (2004) presented the dependence of modelresults on (1) the number of variable use, (2) the technology structure specification and(3) the choice of input output sets. The model mentioned here is DEA10 model which isused to calculate the efficient level of regulated firms.
For the purpose of this part, it only focuses on the number of variable usage in a modeland choice of variables.
Firstly, it should be clear when mentioning about variables of a model. As described bythe author, the variables are used to measure firm's performance by monetary, physicalunits and quality of service. The monetary variables are the total and operational costs.The physical variables are (1) total number of connection (CUST), (2) units of productsdelivered (ENGY) and (3) the total of network length. Lastly, the service qualityvariables are security of supply (NINT), reliability of supply (TINT).
The author selected four models as shown in the column (2, 3, 4, and 5) of the table 3.Each model uses different variables presented in column (1). For example the model 1
10 DEA is a non-parametric method that uses piecewise linear programming to calculate (rather thanestimate) the efficient or best-practice frontier in a given set of decision-making units (Fare et al 1985)
11

is operational cost model. It uses four variables, the operational costs as input, theCUST, ENGY and NETL as output.
The data used in these models are taken from 14 distribution network operators in theUK electricity sector over 1991/1992 to 1998/1999.
Table 3: Specification ofDEA models"
VARIABLE(1)
OPEXTOTEXNINT (security of supply)TINT (reliability of supply)CUST (total number ofcustomers)ENGY (units of energydelivered)NETL (total network length)
MODEL
MODEL 1(OPEX
MODEL)(2)
Input
Output
Output
Output
MODEL 2(CAPEXMODEL)
(3)
Input
Output
Output
Output
MODEL 3(QUALITYMODEL)
(4)
InputInput
Output
Output
Output
MODEL 4(TOTEX-QUALITYMODEL)
(5)
InputInputInput
Output
Output
Output
Applying the data to the various models, although the author presents some results, hereonly the results related to the research at hand are mentioned.
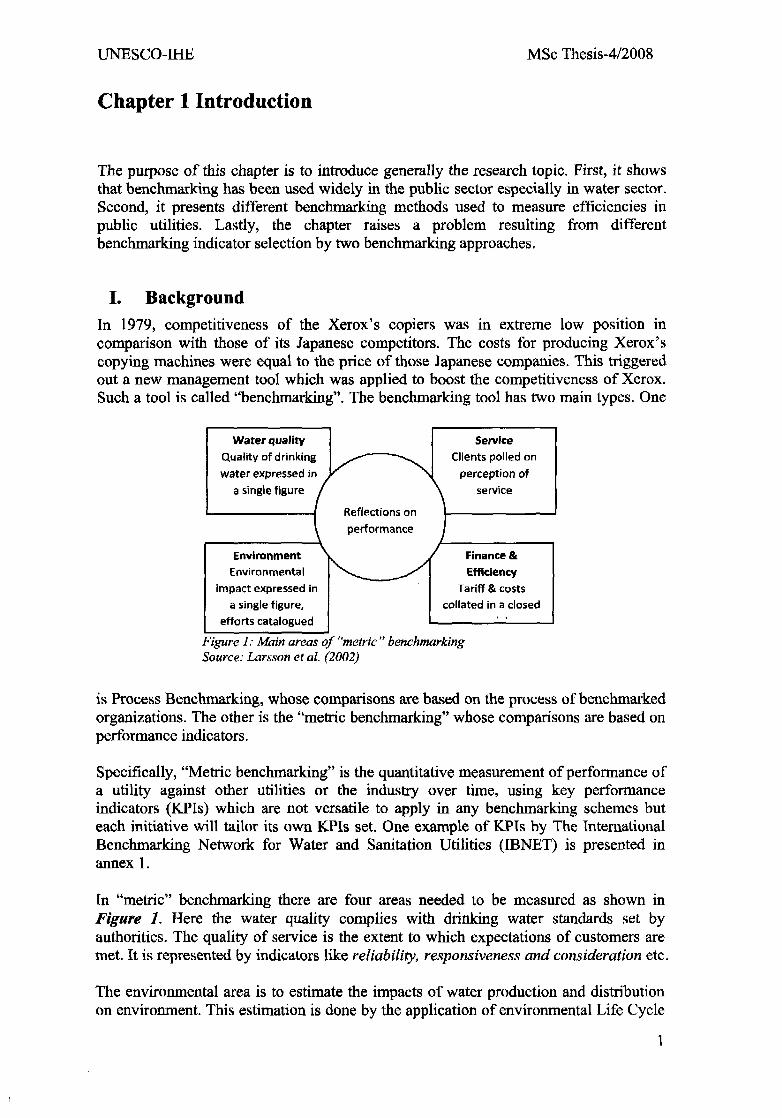
Firstly, the average efficient scores of companies by different DEA models are shown inFigure 3 below. This figure is drawn after the data having been sort by the OPEXcolumn. If considering OPEX line is a base line, then the implication of this chart is thatefficiency scores can depend on the choice of variables. For example, consider the lineof TOTEX and OPEX. If the result scores are consistent, one line should be above orbelow completely the other line. As in the figure in the left-hand side the OPEX line isabove the TOTEX line, further on the TOTEX line is above the CAPEX line. This isalso more confirmable since the score correlation of CAPEX and OPEX is 0.67 andshows a low functional relationship between the two benchmarking models.
Thus, the selection of indicators is crucial for the results of benchmarking exercises.
The author also concludes that the more variables are in a model, the higher theperformance is. However, the variation is the same direction or the curve representingthe less variable model lies below the one representing the more variable model. Thelesson is that if the two curves are not parallel, there may be a contradiction betweenvariables.
n Source: Giannakis et al. (2004)
12
UNESCO-IHE MSc Thesis-4/2008
Average company efficiency scores
g
1 I
Quality
Tolox-quality
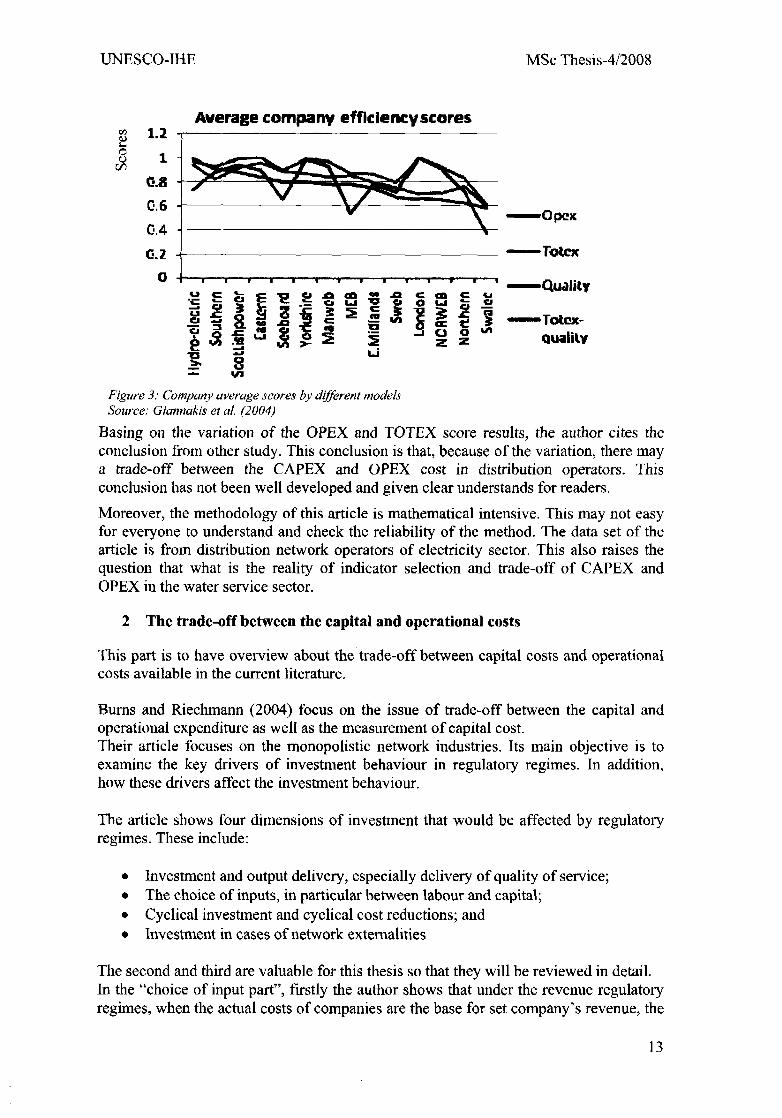
Figure 3: Company average scores by different modelsSource: Giannakis et al. (2004)
Basing on the variation of the OPEX and TOTEX score results, the author cites theconclusion from other study. This conclusion is that, because of the variation, there maya trade-off between the CAPEX and OPEX cost in distribution operators. Thisconclusion has not been well developed and given clear understands for readers.
Moreover, the methodology of this article is mathematical intensive. This may not easyfor everyone to understand and check the reliability of the method. The data set of thearticle is from distribution network operators of electricity sector. This also raises thequestion that what is the reality of indicator selection and trade-off of CAPEX andOPEX in the water service sector.
2 The trade-off between the capital and operational costs
This part is to have overview about the trade-off between capital costs and operationalcosts available in the current literature.
Burns and Riechmann (2004) focus on the issue of trade-off between the capital andoperational expenditure as well as the measurement of capital cost.Their article focuses on the monopolistic network industries. Its main objective is toexamine the key drivers of investment behaviour in regulatory regimes. In addition,how these drivers affect the investment behaviour.
The article shows four dimensions of investment that would be affected by regulatoryregimes. These include:
• Investment and output delivery, especially delivery of quality of service;• The choice of inputs, in particular between labour and capital;• Cyclical investment and cyclical cost reductions; and• Investment in cases of network externalities
The second and third are valuable for this thesis so that they will be reviewed in detail.In the "choice of input part", firstly the author shows that under the revenue regulatoryregimes, when the actual costs of companies are the base for set company's revenue, the
13
companies have strong incentive to cut operational cost rather than capital cost sincecompanies desire more short term profit than long term one. On the other hand, ifconsider the total cost of water service a pie, then the operational costs account for smallpart since this sector is said to be capital intensive, then when operational benchmarkingis undertaken, it will not show the efficient of the whole efficient picture. This ideasupport for the implementation of total cost benchmarking.
The author took the case of UK electricity distribution sector and mentioned thatcompanies have incentives to move costs that are set up in a benchmarking into otherspecific costs of the companies. This process is to meet the cost saving regulation. Forexample if benchmarking establishes a level of operational cost that companies are notallowed to overcome, the companies will move the operational costs into the other costblocks.
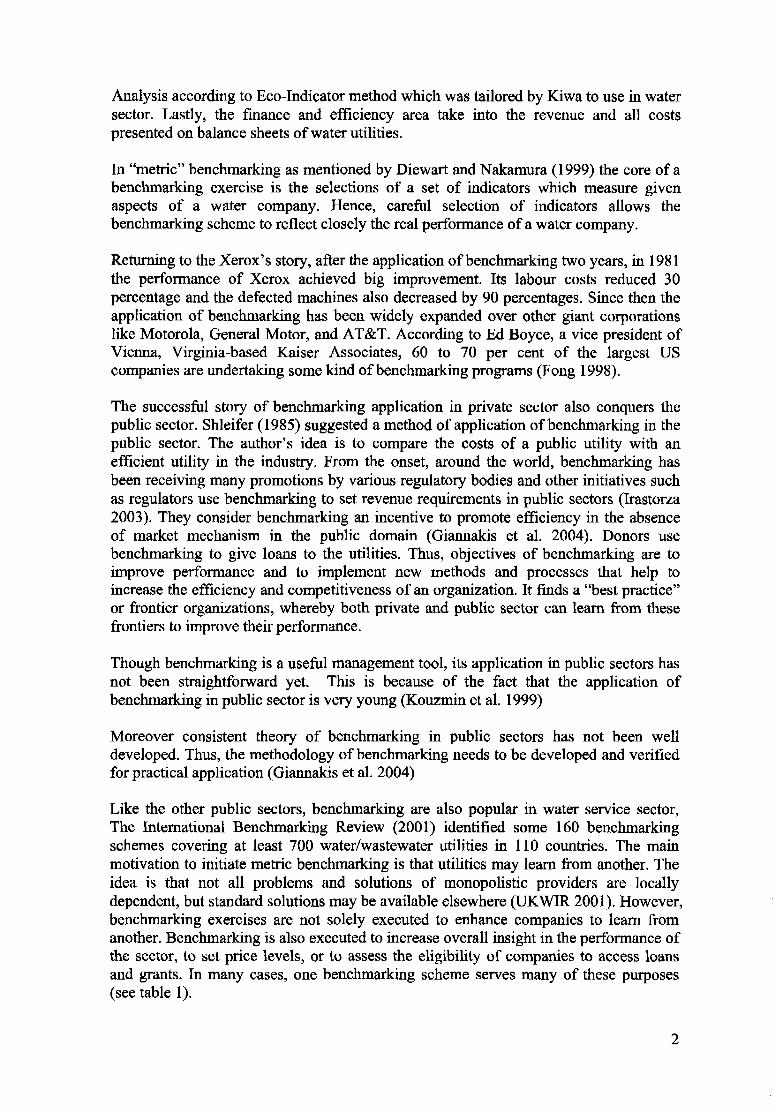
The author explains this empirical result by a hypothesis situation where there are twofirms producing the same quantity of outputs q.
L/q
1 '
33
8 ic,
aCO
U.L*/q
K/qOperational costs per unit of product
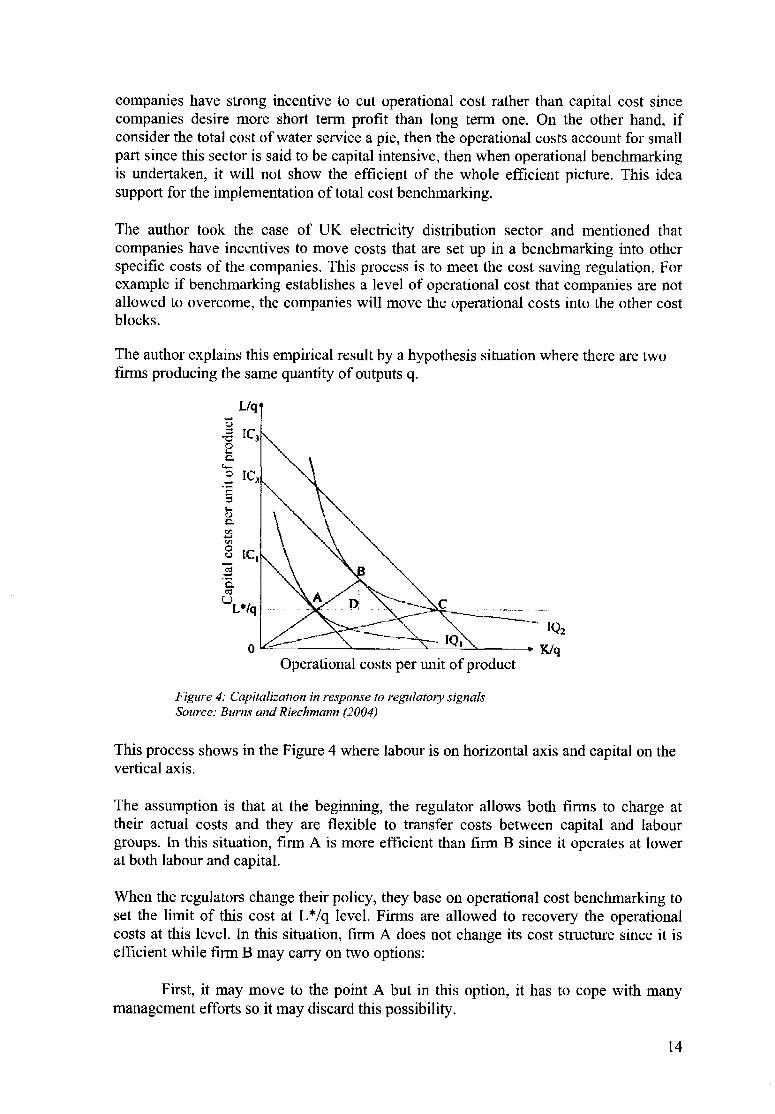
Figure 4: Capitalization in response to regulatory signalsSource: Burns and Riechmann (2004)
This process shows in the Figure 4 where labour is on horizontal axis and capital on thevertical axis.
The assumption is that at the beginning, the regulator allows both firms to charge attheir actual costs and they are flexible to transfer costs between capital and labourgroups. In this situation, firm A is more efficient than firm B since it operates at lowerat both labour and capital.
When the regulators change their policy, they base on operational cost benchmarking toset the limit of this cost at L*/q level. Firms are allowed to recovery the operationalcosts at this level. In this situation, firm A does not change its cost structure since it isefficient while firm B may carry on two options:
First, it may move to the point A but in this option, it has to cope with manymanagement efforts so it may discard this possibility.
14
UNESCO-IHE MSc Thesis-4/2008
Second, it may move to point C. In this process, it has to trade-off labour forcapital costs. While following this option firm B has two possibilities to act with thesurplus labour cost. It can either re-label labour cost as capital cost or reduce the actualcapital cost by reducing the investment. The latter case is harmful for quality issue.
The above contention of the author presents a clear explanation for the behaviour offirms under regulation based on cost benchmarking. However, the weak point of theauthor is that there is no an empirical test for this idea. The chart, as shown in
Figure 4, is a visualization of the Cobb-Douglas function in the previous chapter.
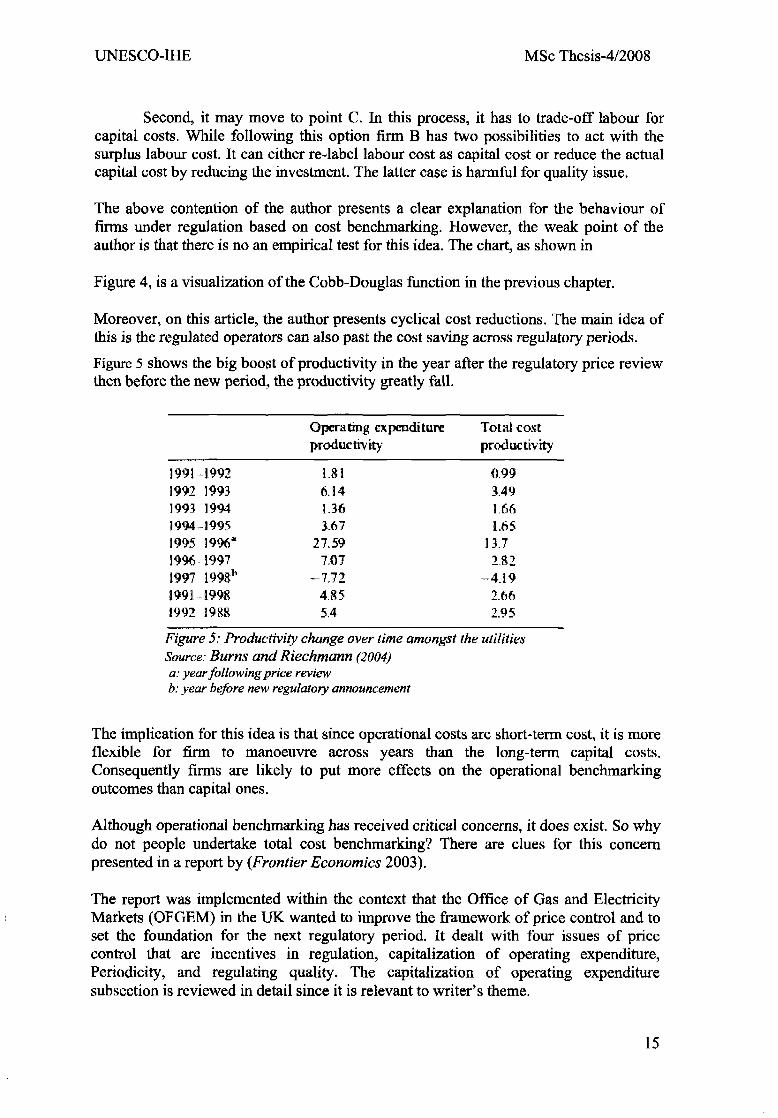
Moreover, on this article, the author presents cyclical cost reductions. The main idea ofthis is the regulated operators can also past the cost saving across regulatory periods.
Figure 5 shows the big boost of productivity in the year after the regulatory price reviewthen before the new period, the productivity greatly fall.
1.991 19921992 19931993 19941994 19951995 1996*1996J9971997199Sb
199119981992 1988
Operating expenditureproductivity
1.816.141.363.67
27.597.07
-7.724.855.4
Total costproductivity
0.993.491.661.65
13.72.82
-4.192.662.95
Figure 5: Productivity change over time amongst the utilitiesSource: Burns and Riechmann (2004)a: year following price reviewb: year before new regulatory announcement
The implication for this idea is that since operational costs are short-term cost, it is moreflexible for firm to manoeuvre across years than the long-term capital costs.Consequently firms are likely to put more effects on the operational benchmarkingoutcomes than capital ones.
Although operational benchmarking has received critical concerns, it does exist. So whydo not people undertake total cost benchmarking? There are clues for this concernpresented in a report by {Frontier Economics 2003).
The report was implemented within the context that the Office of Gas and ElectricityMarkets (OFGEM) in the UK wanted to improve the framework of price control and toset the foundation for the next regulatory period. It dealt with four issues of pricecontrol that are incentives in regulation, capitalization of operating expenditure,Periodicity, and regulating quality. The capitalization of operating expendituresubsection is reviewed in detail since it is relevant to writer's theme.
15
In this subsection, first the author presents the approach of Water Services RegulationAuthority (OFWAT) to benchmarking. This benchmarking is partial cost method.Meaning OFWAT benchmarks the capital and operational costs of utilities separately.OFWAT recognized problem at the review of 1999 that some companies seemed toperform well in operating benchmark while less well in capital benchmark. To addressthis problem OFWAT made an informal adjustment to force reduction in capitalexpenditure through a banding system. The author also portrays the two strategies thatcompanies may act to response to the benchmarking as mentioned in the previous article.The implication of this problem is that firstly due to the contra-variant between theoperating cost benchmarking and capital cost benchmarking results, there is likely atrade-off between the two variables in some utilities.
To eliminate the problem arisen during separated block benchmarking, the authorproposes the total cost benchmarking and raises the issue relating to define the capitalcosts. Thus, up to now, the question at the beginning of this report has been answered orseparated block/ operating benchmarking is preferable since it is likely to overcome theissues of capital cost estimation.
To support for total cost benchmarking, the report describes two capital cost-estimatingmodels.
In another article, when criticizing the benchmarking as a subjective efficientmeasurement, Shuttleworth (2005) stated a problem that "a partial approach can give amisleading impression of the scope for cost reduction" and explained this problem ismore severe when regulators apply benchmarking to sub-set of total cost like capital andoperational costs. For each subset, companies may save in this sub-set by spendingmore on other sub-set. For example, companies may reduce operational costs by investin new capital assets. Although the author does not state clearly about the trade-offbetween the operational and capital costs, by reasoning, this issue is obvious. In thisarticle, when implying about the trade-off, the author referred to only two specificcompanies in the UK to support for the statement. This could not represent the wholesector.
Although the idea that there is a trade-off between capital and operational costs is morepopular in literature, other authors considered there is not a trade-off between the twocost blocks. This stance could be found in the OFWAT's report (Byatt 1995). In thisreport, OFWAT accepted that it had not found reasonable evident for the trade-offbetween the two cost groups. The variety of cost structure in different utilities isbecause of other reasons other than the intention of management boards.
Lastly, the issue of trade-off was also mentioned by Jamasb et al (2003). These authorsuse the terminology called "Gaming" to describe a situation where firms can get benefitwithout real efficient improvement. The authors give various kinds of "Gaming". In thecost aspect, one way to "gaming" is firms shift costs among different cost groups. Theresults survey by these authors of 8 regulators shown that when the operational costbenchmarking is employed, there is tendency of shifting operational cost into theregulated activities. On the other hand, when total cost benchmarking employed, thesame tendency apply for both capital costs and operational costs.
16
UNESCO-IHE MSc Thesis-4/2008
The implication here is that due to the asymmetric information between regulators andregulated firms, firms can manipulate costs without notice of regulators. This "Gaming"results in unreal efficient performance of regulated utilities.
Ill) Conclusion
Several conclusions come out after the review of some articles. First, variable selectionis crucial for a benchmarking. It may produce inconsistent results when different set ofindicators is used. However, this conclusion comes out from a research that itsmethodology is mathematically advanced and the sample size is small. Second,although various authors mention the trade-off between the capital costs and operationalcosts, the idea is mainly come from theoretical analysis. The empirical testing raises itsweak voice in this issue except some evidences from the UK case where OFWATmentions the transfer among cost groups. Third, companies are more likely tomanoeuvre in partial benchmarking than in total benchmarking that why totalbenchmarking is promotable. When total benchmarking is in use, it raises some issuesrelated to capital cost calculation.
Most reviewed articles when mentioned about the trade-off between the capital andoperational cost have referred to the regulatory reality in the UK. This raise otherconcerns that whether the trade-off between the capital and operational cost is typical ofa country or every country.
Contribution to the understanding of the trade-off between various set of costs,benchmarking results under the selection of different cost indicators, this research takesthe case of Benchmarking in Dutch, the UK and Vietnam to verify the two issues.
17

UNESCO-IHE MSc Thesis-4/2008
Chapter 3 Research design
The study of this research expands across three stages which mainly apply thequantitative approach. Besides, the last stage presents some interviewing results to wellexplain the large variability of capital costs in Vietnam case.
Research questions and hypotheses
As mentioned in chapter 1, the existence of "double jeopardy" are concerning byvarious authors and there are two popular approaches to benchmarking. Both of theseare contributing to a problem that is the distortion of benchmarking results. With theproblem and the aims of the research, this study focuses on the following questions andhypotheses:
Research questions:
Does the "double jeopardy" issue exist in water service sector?
When executing the two benchmarking approaches under the effects of "doublejeopardy", each approach creates its own efficient outcomes. In this aspect, the secondresearch question is that is there a difference in the occurrence of the "double jeopardy"issue between alternative benchmarking approaches (partial versus total costapproaches)?
The third research question is to investigate the alignment between the results oftotal cost benchmarking approach and those of operational cost benchmarking approach.It includes sub-questions;
• Is there a consistence between the total cost benchmarking results and operationalcost benchmarking results?
• Additionally, benchmarking also measures other operational performance of waterutilities such as the unaccounted for water and the number of staffs per thousandconnections. In this meaning, the third research question also examines if capitaland operational ratios coincide with other operational performance of water utilities?
• Why do capital costs vary in water companies?
Research hypotheses:
These above research questions are converted into the following research hypotheses:
"Double jeopardy" issue exists in the water service sector.
Within the boundary of the second research question, the second hypothesis is thatoperational benchmarking outcomes are more influenced by the "double jeopardy" thanthose of total cost benchmarking outcomes.
19

In the comparison between the capital and operational ratio with other operationalperformance of water utilities, the third hypotheses are that total cost benchmarkingresults are more consistent with the other operational performances of water utilities andthat the capital ratio performance is more aligned with other operational aspects ofwater utilities.
Scope of the research
This study places itself within the context of benchmarking in water service sector.There are two popular benchmarking methodologies in the sector. However, thisresearch focuses on only the "metric" benchmarking method.
This research focuses on case study. It selects data from three cases to get insight intothe research questions and conclude the research hypotheses. The findings from thethree cases are typical for the selected cases. However, if any cases which are similar tothe selected cases, the results may be applied with care.
I. Background of the selected cases
This study inquires three cases. The criteria to select a case are firstly the purposes ofthe benchmarking, secondly the indicators used in the benchmarking and lastly thetimeframe of the benchmarking. The first and the second criteria are of important sincethere is a argument that where the partial benchmarking is undertake by the economicregulators or under the economic motivation, the "double jeopardy" is the most likely tooccur. In addition, the data available to collect by using internet are also important.
The purposes of Dutch are to get insight and to leam from each other. And it uses thetotal, operational and capital cost indicators. The UK case has the characteristic that thebenchmarking scheme is used to set price and takes the partial cost indicators. Data ofthese two cases are both available on the internet. The benchmarking in Vietnam is togive loans to the utilities. This will promote the utilities to be the best regardless of theway to achieve this target. The timeframe of the three benchmarking is alsodistinguished. Benchmarking in the UK has long history from its privatization in 1989,the Vietnam case is undertaken the first time and the Dutch case is in the middle. Itstarted in 1997 to 2006.
1 Dutch cases
In the Netherlands water service sector, benchmarking has been undertaken by theinitiative of Vewin- the Association of Dutch Water Companies. Up to now, there havebeen four benchmarking exercises implemented in the country. Each benchmarking wastaken every three years, starting from 1997. The main purposes of doing thisbenchmarking are to get insight into the activities of the companies and to learn fromeach other. The indicators used to assess the efficiency in the benchmarking are thecapital, operational and full cost of water utilities.
20

UNESCO-IHE MSc Thesis-4/2008
2 The UK case
In England and Wales, Ofwat (Office of the Water Services), an economic regulator,has been assessing relative efficiency for the water industry since privatization in 1989.The sectors of Scotland and Northern Ireland are separately organized and still publiclyowned (Dassler et al. 2006). The aim of this organization is to set price limits in a waythat will create incentives for water companies to improve capital efficiency and deliverreal price benefits to customers (Allan 2006). Though there have been variousbenchmarking methods undertaken to cross checking, the main cost indicators tomeasure efficiency of water utilities are the Capital costs and operational costs. Theorganization implements a five year periodical review to set the revenue for theregulated utilities.
3 Vietnam case
There was a benchmarking exercise undertaken in Vietnam in 2002 by Vietnam Waterand Sewerage Association funded by the World Bank. This benchmarking has taken theform of "metric" benchmarking and taken the data from the year 2000 of 67 watercompanies in the country. It has employed partial cost variables to measure the efficientaspect of water utilities.
In the meantime, the Vietnam Urban Water Supply Development Project was proposed.This project had two main objectives. The first one was to expand the water servicefinancially and environmentally sustainable to un-served households both in large citiesand in small district towns. The second one was to improve the technical, financial andcommercial performance of water utilities. The project would provide two kinds ofcredit to water utilities basing on their benchmarking ranges. The higher performanceresult would enable utilities to access to higher level of debt. (Sharifian 2002). Thus,performance, derived from partial benchmarking results, is a crucial criterion to giveloans to water companies.
In addition, water service in Vietnam is capital intensity and capital proportion in totalcost of Vietnam water supply industry varies notably due to the historical investment.According to a report by Vietnam Water and Sewerage Association (VWSA)(Ton et al,2003) repayment to build water infrastructure accounts from 60% to 80% of total annualcost of a water company. Moreover, low performance companies need as three timescapital requirement as high performance companies to own the same amount of asset.This creates more concerns that the operational variables, which capture only short-termcost aspect of companies, are unable to represent fully the efficient performance ofwater companies. Consequence, if loans are granted for companies by their operationalcost benchmarking results, there is risk that loans are likely to be given to unrealefficient companies.
II. Stage 1 - Existence of "double jeopardy" in water supply sector
This part is designed to do the research on the question that whether the "doublejeopardy" really exists. It starts with the establishment of the indicators to assess theperformance of efficient aspects of water utilities. Then it presents the augment to usethe Cobb-Douglas function to depict the "double jeopardy" issue. Next, to apply thelinear regression model to examine the trade-off, the Cobb-Douglas function needs to be
21
transformed into the linear form. Lastly is to build arguments and assumptions to applythe slope of the regression line in relationship analysis.
The input in this part is the data collected in the reality at the benchmarking in the threeselected case studies.
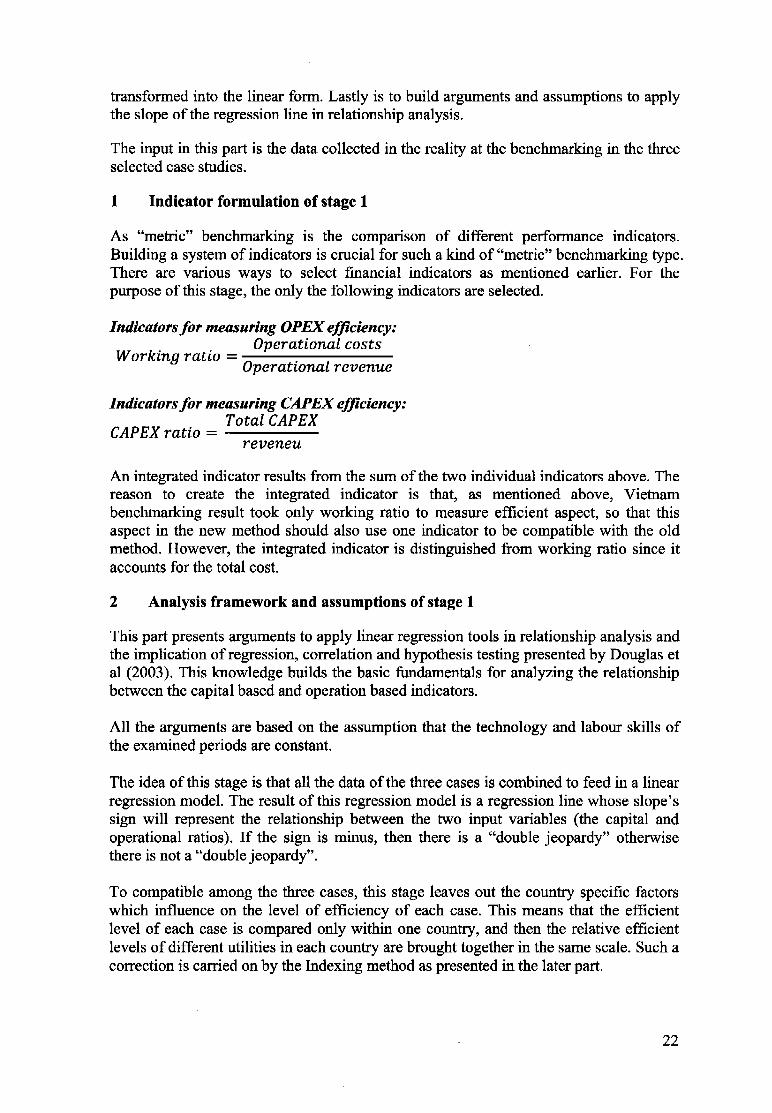
1 Indicator formulation of stage 1
As "metric" benchmarking is the comparison of different performance indicators.Building a system of indicators is crucial for such a kind of "metric" benchmarking type.There are various ways to select financial indicators as mentioned earlier. For thepurpose of this stage, the only the following indicators are selected.
Indicators for measuring OPEX efficiency:Operational costs
Workinq ratio = — ;Operational revenue
Indicators for measuring CAPEX efficiency:Total CAPEX
CAPEX ratio =reveneu
An integrated indicator results from the sum of the two individual indicators above. Thereason to create the integrated indicator is that, as mentioned above, Vietnambenchmarking result took only working ratio to measure efficient aspect, so that thisaspect in the new method should also use one indicator to be compatible with the oldmethod. However, the integrated indicator is distinguished from working ratio since itaccounts for the total cost.
2 Analysis framework and assumptions of stage 1
This part presents arguments to apply linear regression tools in relationship analysis andthe implication of regression, correlation and hypothesis testing presented by Douglas etal (2003). This knowledge builds the basic fundamentals for analyzing the relationshipbetween the capital based and operation based indicators.
All the arguments are based on the assumption that the technology and labour skills ofthe examined periods are constant.
The idea of this stage is that all the data of the three cases is combined to feed in a linearregression model. The result of this regression model is a regression line whose slope'ssign will represent the relationship between the two input variables (the capital andoperational ratios). If the sign is minus, then there is a "double jeopardy" otherwisethere is not a "double jeopardy".
To compatible among the three cases, this stage leaves out the country specific factorswhich influence on the level of efficiency of each case. This means that the efficientlevel of each case is compared only within one country, and then the relative efficientlevels of different utilities in each country are brought together in the same scale. Such acorrection is carried on by the Indexing method as presented in the later part.
22

UNESCO-IHE MSc Thesis-4/2008
Followings are the detail of the application of the linear regression in relationshipanalysis and the data correction method.
2.1 Application of linear regression in relationship analysis of stage 1
Cobb-Doulas function as mentioned in the first chapter is merely to depict the behaviourof firms under the effects of only law of reducing marginal benefit of capital andoperational costs in ideal conditions. This function is a signal to suggest about thenegative relationship between the capital and operational costs of utilities.
Under the real condition with the effect of regulations, the "double jeopardy" issueoccurs. The functional form of "double jeopardy" is not obvious. Hence, the assumptionis that the "double jeopardy" has a linear form.
Under this assumption, the linear regression of capital costs and operational costs isexecuted. When the results of the regression come out, they will be test the suitability ofthe model to explain the data. If the model is adequate in term of statistics, its slope willbe used to make conclusion about the trade-off relationship or "doubled jeopardy" issue.The T-statistic parallel with P-value are used to test the adequate of the regressionmodel. This testing method will also supplemented by the R-square and Pearson-rcoefficient. The detail of application of this testing method is elaborated in thecontinuous parts.
The above argument builds the fundamentals for the application of linear regression toinvestigate the "double jeopardy" issue. The method here is that first the regressionmodel will be established based on capital and operational ratio. The slope of the foundregression line is the indicator to evaluate the trade-off relationship.
2.2 Implication of the regression line slope and testing its parameters of stage 1
As arguments and assumptions on the previous step, capital costs and operational costsof water utilities relate to each other by the linear equation. So do the capital andoperational ratios. The form of a linear function is: Y = p r X + p2 Here Y denotescapital ratio, which is dependent variable and X is equal to operational ratio, which isthe explanation or regressor variables. The other the constant parameters p\-p2- are theslope and the intercept of the regression line, respectively.
In this equation the slope of the regression line has a meaningful value for interpretingthe relationship between the capital and operational ratio. This slope shows three typesof linear relationship between the two variables. These types of relationship aredepended on the slope's sign. If the slope is negative, it shows a contra variantrelationship between capital and operational costs. If its value is zero, then there is nolinear relationship between the two variables. Lastly, if the slope is positive value,meaning capital and operational costs have covariant relationship.
P±is called the trade-off coefficient. This figure shows that if the operational ratioincreases 1 unit, there is Pi unit of capital ratio scarified.
To investigate whether there is a trade-off between the capital and operational costs ofwater utilities, then the zero slope value is meaningless in showing this relationship.Thus, statistical hypothesis testing about the zero value of the slope will be executed. If
23
there are statistical evidences to reject the zero value of the slope, then there is arelationship between the two variables.
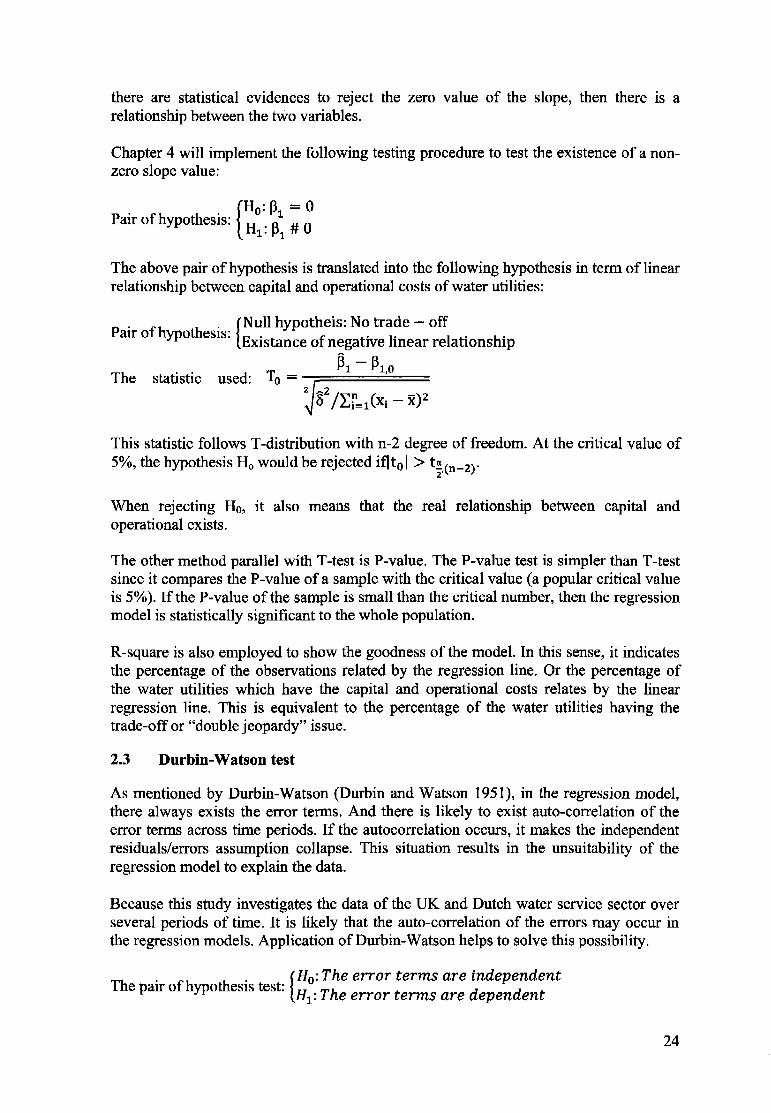
Chapter 4 will implement the following testing procedure to test the existence of a non-zero slope value:
fH0: p, = 0Pair of hypothesis: < „ „ „ „
{ni- Pi » u
The above pair of hypothesis is translated into the following hypothesis in term of linearrelationship between capital and operational costs of water utilities:
„ . „, , . f Null hypotheis: No trade - offPair of hypothesis: ]„ c i- 1 *-• u -
J * (.Existance of negative linear relationship
The statistic used: To =
This statistic follows T-distribution with n-2 degree of freedom. At the critical value of5%, the hypothesis HQ would be rejected if|to | > U,_2y
When rejecting Ho, it also means that the real relationship between capital andoperational exists.
The other method parallel with T-test is P-value. The P-value test is simpler than T-testsince it compares the P-value of a sample with the critical value (a popular critical valueis 5%). If the P-value of the sample is small than the critical number, then the regressionmodel is statistically significant to the whole population.
R-square is also employed to show the goodness of the model. In this sense, it indicatesthe percentage of the observations related by the regression line. Or the percentage ofthe water utilities which have the capital and operational costs relates by the linearregression line. This is equivalent to the percentage of the water utilities having thetrade-off or "double jeopardy" issue.
2.3 Durbin-Watson test
As mentioned by Durbin-Watson (Durbin and Watson 1951), in the regression model,there always exists the error terms. And there is likely to exist auto-correlation of theerror terms across time periods. If the autocorrelation occurs, it makes the independentresiduals/errors assumption collapse. This situation results in the unsuitability of theregression model to explain the data.
Because this study investigates the data of the UK and Dutch water service sector overseveral periods of time. It is likely that the auto-correlation of the errors may occur inthe regression models. Application of Durbin-Watson helps to solve this possibility.
„ . , (Ho: The error terms are independentThe pair of hypothesis test: " T , . , , .
^ Jt^ IH^. The error terms are dependent
24

UNESCOIHE MSc Thesis-4/2008
The "d"-statistic is used to test the hypothesis:
d _
The "d" value from the above equation then is compared with the lower dL and upper dubound value. If the "d" higher than the upper value, then the value is not significant andthe Ho is unable to reject or we must accept that the errors of the regression model areindependent while if observed "d" is smaller than dL, then it is significant to reject Ho orthe error terms of the regression models are dependent.
3 Data and input variable for stage 1
Inputs for the regression model of the stages
The inputs of this stage are the data collected through each selected case as stated earlier.These data are used to calculate the operational and capital ratio for each case. Then thecapital ratio and operational ratios are corrected by indexing method. After correction,these data are fed into the regression model.
Data correction
As mentioned earlier, the data from the three cases with two from developed countriesand one from developing countries. This results in many country specific factorsmaking the absolute efficient levels the three cases different such as productivity,opinions of the government about the water business and the geographicalcharacteristics. To remove the factors, first the efficient level of each case is calculatedwithin the countries, and then the relative efficiencies for each country are fed into theregression model.
The method to remove the factors is making the index of capital and operational ratiosin each case by the following formulas:
Ratio — Min(ratio)Corrected ratio = ——-. r^—„. , . . * 100%
Maxiratio) - Min(ratw)
In the above equation:
Corrected ratios are used to feed into the regression model
Ratio is the capital ratios or operational ratios for each observation in each case
Min (ratio): is the minimum value of capital or operational ratios in a case
Max (ratio): is the maximum value of capital and operational ratios in a caseIn this part, first the data requirement is presented, next is the sources of the data, andlastly is method of data collection.Data requirementThe data needed for the first stage of the current study are drawn based on the alreadyformulated indicators.
The first sort of data is the benchmarking results of Vietnam water benchmarking in2002. This data include working ratio and results of performance based on operational
25
costs. This report was published in 2002 with the employment of the data of the year2000.
The second sort of data is to measure the total cost performance of water companies.This includes:
The elements of CAPEX which contain depreciation, interest payment,
The operational costs of supplying water, the total amount of water supply
The total revenue of water supply
Data sources
Vietnam data are collected through two sources. The first one was presented in theVietnam benchmarking reports, which were acquired in the World Bank office in bothelectronic and paper files.
The Ministry of Construction supplied data related to total cost and capital cost. Thisdata were available at the ministry since there was a survey implemented under theofficial document No. 146 issued on 11 August 2003 about reality of water serviceproduction and supply. Whereby, all 67 water supply companies in the country wereobliged to supply their data on various aspects of their business, which also includeddepreciation, benefit, and total cost of water supply, total revenue and total assets ofwater companies.
The data of the UK water service sector are achieved through the regulatory accountsunder the requirement of Ofwat. Every company in the England and Wales under theregulation of Ofwat has to report its regulatory accounts to this economic regulator. Atthe same time, such a kind of report is also available in the each utility's website. Thesereports on the websites are downloaded and filtered to pick out the required data.
Data of Dutch water service sector were acquired in the same manner as that of the UK.The difference is these kinds of data are shown in the benchmarking undertaken byVewin from 1997 to 2006.
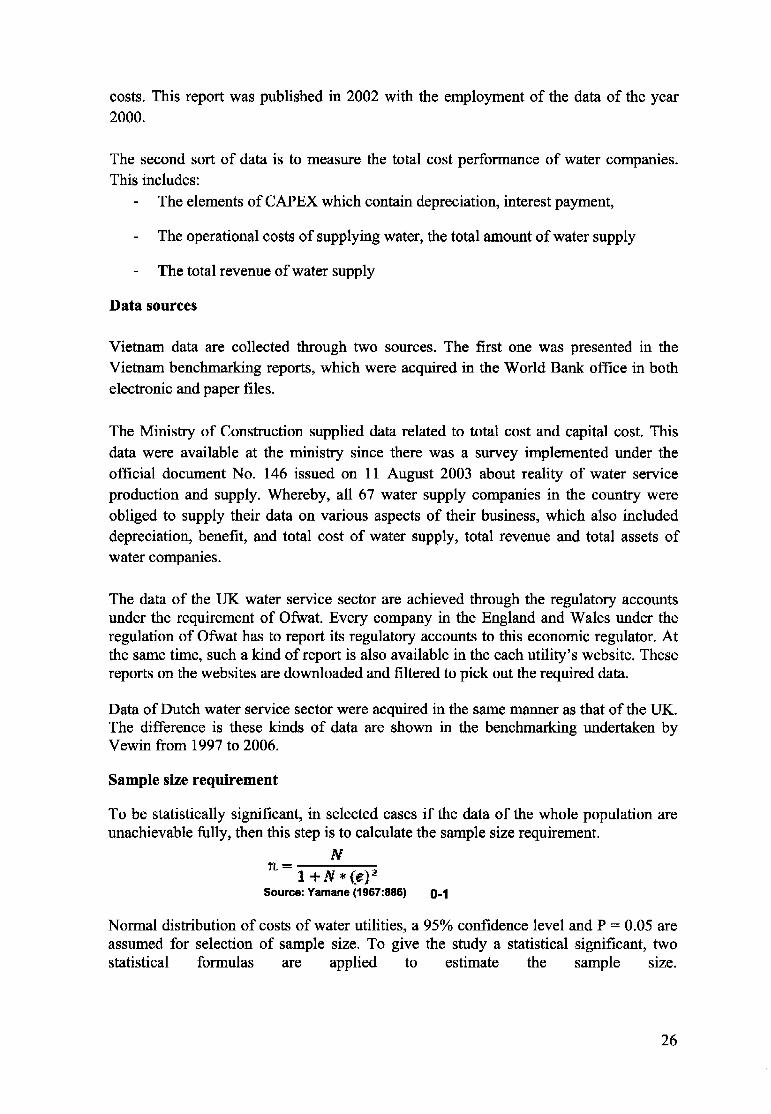
Sample size requirement
To be statistically significant, in selected cases if the data of the whole population areunachievable fully, then this step is to calculate the sample size requirement.
N
Source: Yamane (1967:886) 0-1
Normal distribution of costs of water utilities, a 95% confidence level and P = 0.05 areassumed for selection of sample size. To give the study a statistical significant, twostatistical formulas are applied to estimate the sample size.
26
UNESCO-IHE MSc Thesis-4/2008
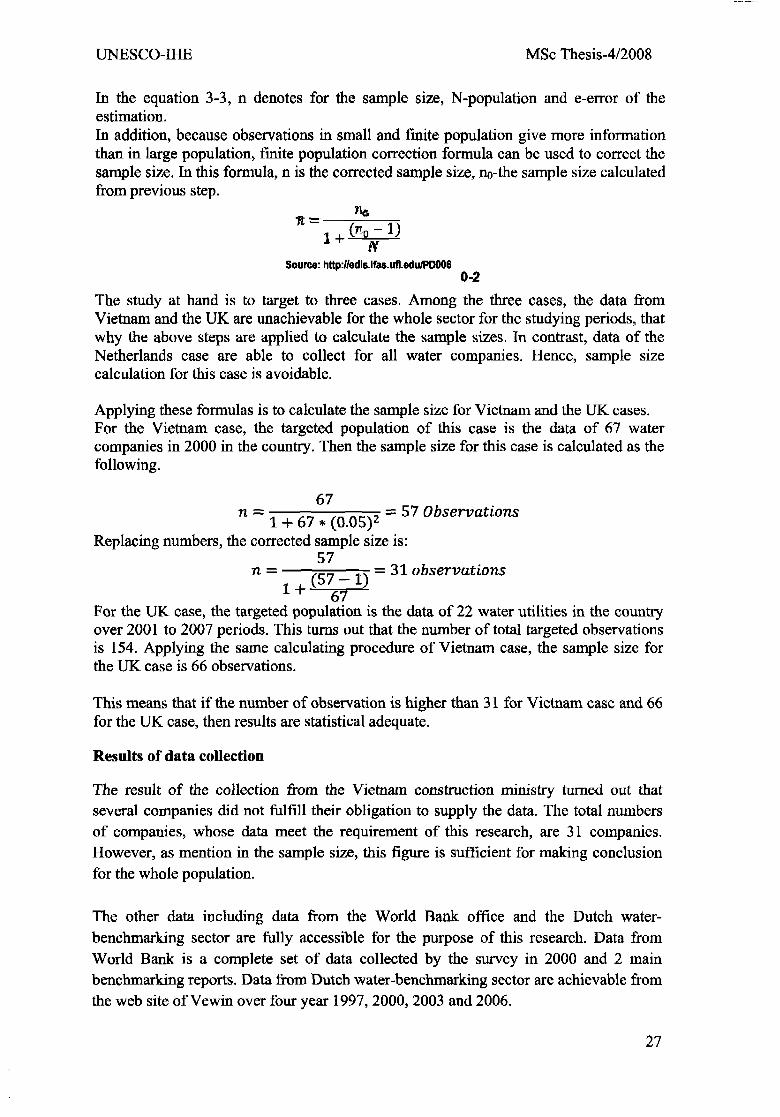
In the equation 3-3, n denotes for the sample size, N-population and e-error of theestimation.In addition, because observations in small and finite population give more informationthan in large population, finite population correction formula can be used to correct thesample size. In this formula, n is the corrected sample size, no-the sample size calculatedfrom previous step.
• r e -
Source: http://edis.ifas.ufl.edu/PD0060-2
The study at hand is to target to three cases. Among the three cases, the data fromVietnam and the UK are unachievable for the whole sector for the studying periods, thatwhy the above steps are applied to calculate the sample sizes. In contrast, data of theNetherlands case are able to collect for all water companies. Hence, sample sizecalculation for this case is avoidable.
Applying these formulas is to calculate the sample size for Vietnam and the UK cases.For the Vietnam case, the targeted population of this case is the data of 67 watercompanies in 2000 in the country. Then the sample size for this case is calculated as thefollowing.
71 = i + 6767(oo5y = 5 7 observations
Replacing numbers, the corrected sample size is:57
n = (en -n = ^ observationsL+ 67
For the UK case, the targeted population is the data of 22 water utilities in the countryover 2001 to 2007 periods. This turns out that the number of total targeted observationsis 154. Applying the same calculating procedure of Vietnam case, the sample size forthe UK case is 66 observations.
This means that if the number of observation is higher than 31 for Vietnam case and 66for the UK case, then results are statistical adequate.
Results of data collection
The result of the collection from the Vietnam construction ministry turned out thatseveral companies did not fulfill their obligation to supply the data. The total numbersof companies, whose data meet the requirement of this research, are 31 companies.However, as mention in the sample size, this figure is sufficient for making conclusionfor the whole population.
The other data including data from the World Bank office and the Dutch water-benchmarking sector are fully accessible for the purpose of this research. Data fromWorld Bank is a complete set of data collected by the survey in 2000 and 2 mainbenchmarking reports. Data from Dutch water-benchmarking sector are achievable fromthe web site of Vewin over four year 1997,2000,2003 and 2006.
27

The results of data collection from the UK water sector happened as not expected. Therewere 104 observations achievable in comparison with 154 observations as expected inthe all utilities over 2001 to 2007 periods.
Ill Stage 2-The Vulnerability of benchmarking results to "double jeopardy"
This research stage aims at examining the vulnerability of different benchmarkingresults by the "double jeopardy" issue. As mention earlier, there are two benchmarkingapproaches, which use partial or total cost indicators. This stage is to examine in suchtwo benchmarking approaches under the existence of "double jeopardy" whichapproaches' results are more likely to be distorted.
1. Indicators formulation of stage 2
Similar to the stage 1, this stage uses two indicators which are the capital ratios andoperational ratios.
Indicators for measuring OPEXefficiency:Operational costs
Workinq ratio = — ; ;Operational revenue
Indicators for measuring CAPEX efficiency:Total CAPEX
CAPEX ratio -reveneu
2. Analytical framework of stage 2
The arguments to apply linear regression and to test its significant are the same as thearguments developed in stage 1. For avoiding repetition, this part does not re-presentthese arguments.
Differently, this stage applies two analytical approaches based on the three establishedregression lines of the three selected cases. The first one is to use the R-square of theregression model to investigate the situation of the "double jeopardy" in the threespecific cases basing on the history data. The second approach is to use the slopes ofthese lines to analyze the future occurrence of "double jeopardy" in the three selectedcases if their current methods of benchmarking are continued to carrier on in the future.
Firstly, to use the R-square in the analysis of the current situation, this analysis appliesthe argument in statistics that the R-square is to show the variability of the observationswhich are likely to be depicted by the regression line. In this sense, the R-square of eachlinear regression model shows the percentage of the water utilities which are related toeach other by the regression lines. The higher the value of the R-square, the moreoccurrence of the "double jeopardy" in that selected cases.
Secondly, for analyzing the future effects of "double jeopardy" on the benchmarkingschemes of the three cases, the slope of each linear regression line is used as theindicator. The argument for the application of the slope in future analysis is that theslope is typical for each country and is defined by the current development of
28

UNESCO-IHE MSc Thesis-4/2008
technology and the price of labour. At the same time, these two factors are not dynamicin short-term. Hence, the value of the slope is suitable for the future analysis.
The three selected cases have the characteristics that; Dutch water benchmarkingselected total costs, operational costs and total cost as variables. The UK has employedpartial indicators which are capital costs and operational costs separately. Lastly theVietnam benchmarking also took partial benchmarking indicators with only theoperational costs. Each benchmarking method in a specific case is related to the value ofthe R-square and the regression slope of that method to show the effects of "doublejeopardy" on different benchmarking approaches.
Similar to stage 1, the error term of UK and Dutch are tested for auto-correlation sincethese sets of data are taken over time series by Durbin-Watson test. The test does notapply for Vietnam case due to the single year data collected.
The regression model without auto-correlation in its error term will be consideredsuitability for analysis.
After the model passes the Durbin-Watson test, the T-test is employed to test themagnitude of the slope against zero. When these models pass the Durbin and Watsontest and the slopes pass the T-test (p-value) at the critical value of 5%, then the slope isapplicable to analyze in this stage.
Two considerations are carried on in the stage. First is the analysis of the slope of eachcase in relationship with the "double jeopardy" issue to get insight into the effects of"double jeopardy" on benchmarking results. Such a research is implemented byanalyzing each component of "double jeopardy" separately under the existence of slopeof each case.
Secondly, efficiency of each case is compare to reveal the less efficient one. Thenpossibilities resulting in the less efficiency are presented up. If these possibilitiesinclude the components of "double jeopardy", and if the case use partial benchmarkingapproach, then there is high possibility of less efficiency resulting from "doublejeopardy". Or the benchmarking approach used by the less efficient case is morevulnerable to the "double jeopardy".
To measure efficiency of each case in comparison with each other, all the three casesare plotted on the same chart. The distance from the origin to the regression line showsthe level of efficiency of the case. The assumption is that all utilities are followingminimizing cost strategy. Hence, all try to keep the capital ratios and operational ratiosas low as possible. This is equivalent with the situation where the regression line ofeach case tries to be as close as the origin of the coordinate.
3. The inputs for this stage 2
Data requirement
The data needed for the stage 2 of the current study are drawn based on the alreadyformulated indicators.
29
The first sort of data is the benchmarking results of Vietnam water benchmarking in2002. This data include working ratio and results of performance based on operationalcosts. This report was published in 2002 with the employment of the data of the year2000.
The second sort of data is to measure the total cost performance of water companies.This includes:
The elements of CAPEX which contain depreciation, interest payment
- The operational costs of supplying water
The total revenue of water supply
Data sources
Data from Vietnam case were acquired firstly at the World Bank office in the countrythrough Vietnam benchmarking reports in 2000.
Secondly, the Ministry of Construction supplied data related to total cost and capitalcost. This data were available at the ministry since there was a survey implementedunder the official document No. 146 issued on 11 August 2003 about reality of waterservice production and supply. Whereby, all 67 water supply companies in the countrywere obliged to supply their data on various aspects of their business, which alsoincluded depreciation, benefit, and total cost of water supply, total revenue.
The data of the UK water service sector are achieved through the regulatory accountsunder the requirement of Ofwat. Every company in the England and Wales under theregulation of Ofwat has to report its regulatory accounts to this economic regulator. Atthe same time, such a kind of report is also available in the each utility's website. Thesereports on the websites are downloaded and filtered to pick out the required data.
Data of Dutch water service sector were acquired in the same manner as that of the UK.The difference is these kinds of data are shown in the benchmarking undertaken byVewin from 1997 to 2006.
Results of data collection
The result of the data collection from the Vietnam construction ministry turned out thatseveral companies did not fulfill their obligation to supply the data. The total numbersof companies, whose data meet the requirement of this research, are 31 companies.
The other data including data from the World Bank office and the Dutch water-benchmarking sector are fully accessible for the purpose of this research. Data fromWorld Bank is a complete set of data collected by the survey in 2000 and 2 mainbenchmarking reports.
The reports of Dutch water benchmarking were collected in four year 1997, 2000, 2003and 2006 through the website of Vewin, on which the required data were available.
30

UNESCO-IHE MSc Thesis-4/2008
The results of data collection from the UK water sector happened as not expected. Therewere 104 observations achievable in comparison with 154 observations as expected inthe all utilities over 2001 to 2007 periods. However, the number of these observations issufficient in comparison with the sample size requirement calculated in the previouspart.
IV Stage 3-The consistence among performance of various benchmarkingoutcomes
This stage focuses on the third research question, which is specified in sub question asin the following:
Is there a consistence between total cost benchmarking results and operationalcost benchmarking results?
Is there a consistence between the results of benchmarking based on the twoapproaches and other operational performance of water utilities like performanceof uncounted for water and the number of staff per thousand connections?
- Which factors of "double jeopardy" issue make the diversification of capitalcosts in water utilities?
Among the three selected cases, the case of Vietnam is suitable for this stage of studysince the benchmarking in this country was partial benchmarking which used onlyoperational costs (working ratio indicator) to estimate the efficiency of water companies.The use of only working ratio is like to have the most distortion in benchmarking.
The data set from Vietnam case is used differently in this stage. They are used tocalculate the total benchmarking results. These total benchmarking results then arecompared with the partial benchmarking results available in Vietnam benchmarking in2002.
Secondly, the research also compares the capital and operational ratio against otheroperational performance of water companies in Vietnam such as unaccounted for waterand number of staffs per thousand connections. The idea is that if the results ofcomparison do not coincide with each other, there are two implications needed to beindicated. First partial indicator does not reflect the whole efficiency. Secondly, underthe operational benchmarking in Vietnam, the capital and operational costs are treateddifferently, and then it results in the situation where capital and operational ratio do notboth coincide with the other operational performance like unaccounted for water and thenumber of staffs per thousand connections. If the analysis results turn out that theoperational ratios are less aligned with the other operating performance, while those ofcapital ratios are more coincided with the other operating performance, it is likely thatthe "double jeopardy" occurs in a way that the operational costs are favoured since theyare used in benchmarking standard. One assumption here is that companies are unableto hide their overall performance. Or the other operating performance reflects the realsituation of the companies.
31

Lastly, it is to investigate the factors influencing the capital diversity of watercompanies in Vietnam. Such a work is implemented by analyzing an interview results.
1. Indicator selection
Besides taking the efficient indicators in the stage 1 of the study, for the purpose of thisstage, two additional indicators are selected. These indicators are those, which arepopular in benchmarking exercise.
supplied volume — billed volumeUncounted for water = —;—;
supplied volume
Number of staffsStaffs per thousand connections = — ; :— * 1000
Number of connectionThen the Unaccounted for water indicators is corrected by the size of companiesthrough dividing itself by the number of connections of that company.
The two same indicators as the stage 1 also are used in this stage:
Indicators for measuring OPEXefficiency:Operational costs
Working ratio = — •Operational revenue
Indicators for measuring CAPEX efficiency:Total CAPEX
CAPEX ratio =reveneu
2. Analytical framework and indicator selection
Two methods are mainly carried out in this stage of the study. The first one is to applythe comparative and judgment method. The comparison and judgment are undertakenbetween the partial cost (working ratio) benchmarking outcomes against the total costbenchmarking outcomes as well as between unaccounted for water and the number ofstaffs per thousand connections against the working ratio and total ratio. Thevisualization or chart analysis will help in this method of study.
Supplementary for chart analysis, the differences between total cost benchmarking andoperational benchmarking outcomes in each observation also are considered to givethese differences in numerical values. The idea is that each observations or company inVietnam has its own total cost benchmarking outcomes and operational costbenchmarking outcomes. If the two approaches are consistent, then all the results in onebenchmarking approach should higher or lower than the other approach. For example, ifall the operational benchmarking outcomes are lower than the total benchmarkingoutcomes, then these two benchmarking are consistent. This analysis examines theresults of total cost benchmarking minus the operational benchmarking outcomes. If thevalues of this minus operation have the same sign, then the two benchmarking areconsistent.
32
UNESCO-IHE MSc Thesis-4/2008
The operational benchmarking outcomes were acquired from Vietnam water service thebenchmarking exercise in 2002. The total cost benchmarking outcomes are calculatedbased on the collected data and three indicators. The first two indicators are the same asthose in Vietnam benchmarking in 2002. The third one is different from the one used inVietnam benchmarking in 2002 as it is the total cost indicator (the Vietnamese indicatoris operational costs or working ratio).
The method to calculate the performance of total cost benchmarking outcome is similarto the method which used to calculate the operational cost benchmarking outcomes inVietnam in 2002. This method took three indicators (unaccounted for water, number ofstaffs per thousand connections and working ratio) to calculate the overall performanceof water companies. The new total cost benchmarking will replace the working ratio bythe total ratio. The other two indicators are kept the same.
The second method is to qualitative orientation. It analyzes the results of an interview toget insight into the diversification of capital costs in Vietnam. There is a concern thatthis diversification is due to the "double jeopardy". If the findings turn out that there arenot other factors affecting on the diversification then one must accept that thediversification is due to the "double jeopardy". This method more likely is the exclusiveapproach.
For the qualitative method, interview was implemented with the questionnaires focusingon drivers that make capital costs of water companies various and the reason that makescapital costs excluded in calculating the overall performance.
The questionnaires are formulated to find out the main factors that effect on thediversification of capital ratios in Vietnam water sector. Then the next question is tofocus on why the main factors influence the capital ratios of water companies.
3. Data collection and Inputs of this inquire stage
The data of the two indicators (Unaccounted for water and the number of staffs perthousand connections) were taken from a benchmarking exercise in Vietnam, which waspublished in 2002 and the data of this benchmarking were from the year 2000.
The 2002 Vietnam benchmarking reports published 61 observations of unaccounted forwater per connection and the number of staffs per thousand connections. These datawere collected to use in this stage of study.
The working ratios and capital ratios of this case are taken from the previous step.The interview was carried out with Informants from six different organizations. Theseorganizations are three from water companies (Bac Giang, Phu Tho and Tuyen Quang),one from the Ministry of Construction, one from Vietnam Water and EnvironmentCompany (VIWASA), and the last from Vietnam Water Supply and SewerageAssociation (VWSSA), participated in the interview
33

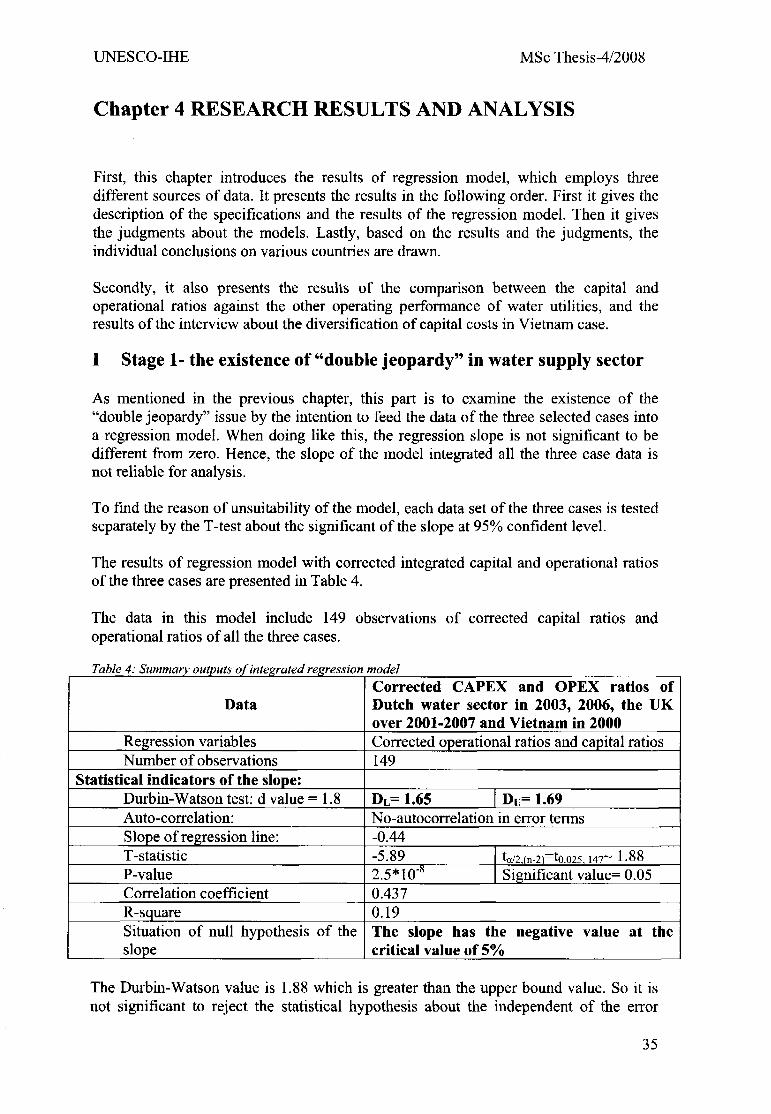
UNESCO-IHE MSc Thesis-4/2008
Chapter 4 RESEARCH RESULTS AND ANALYSIS
First, this chapter introduces the results of regression model, which employs threedifferent sources of data. It presents the results in the following order. First it gives thedescription of the specifications and the results of the regression model. Then it givesthe judgments about the models. Lastly, based on the results and the judgments, theindividual conclusions on various countries are drawn.
Secondly, it also presents the results of the comparison between the capital andoperational ratios against the other operating performance of water utilities, and theresults of the interview about the diversification of capital costs in Vietnam case.
1 Stage 1- the existence of "double jeopardy" in water supply sector
As mentioned in the previous chapter, this part is to examine the existence of the"double jeopardy" issue by the intention to feed the data of the three selected cases intoa regression model. When doing like this, the regression slope is not significant to bedifferent from zero. Hence, the slope of the model integrated all the three case data isnot reliable for analysis.
To find the reason of unsuitability of the model, each data set of the three cases is testedseparately by the T-test about the significant of the slope at 95% confident level.
The results of regression model with corrected integrated capital and operational ratiosof the three cases are presented in Table 4.
The data in this model include 149 observations of corrected capital ratios andoperational ratios of all the three cases.
Table 4: Summary outputs of integrated regression model
Data
Regression variablesNumber of observations
Statistical indicators of the slope:Durbin-Watson test: d value =1.8Auto-correlation:Slope of regression line:T-statisticP-valueCorrelation coefficientR-squareSituation of null hypothesis of theslope
Corrected CAPEX and OPEX ratios ofDutch water sector in 2003, 2006, the UKover 2001-2007 and Vietnam in 2000Corrected operational ratios and capital ratios149
DL= 1.65 Du= 1.69No-autocorrelation in error terms-0.44-5.892.5*10"*
ta/2,(n-2)-to.O25, 147~ 1-88
Significant value= 0.050.4370.19The slope has the negative value at thecritical value of 5%
The Durbin-Watson value is 1.88 which is greater than the upper bound value. So it isnot significant to reject the statistical hypothesis about the independent of the error
35
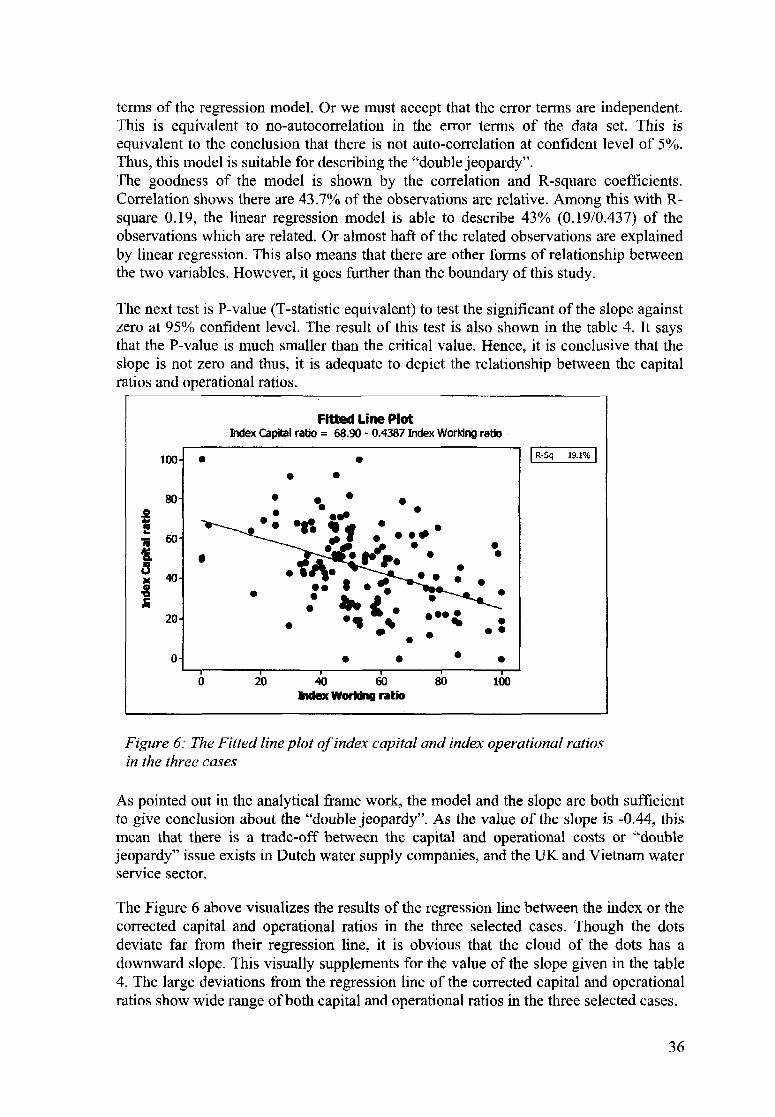
terms of the regression model. Or we must accept that the error terms are independent.This is equivalent to no-autocorrelation in the error terms of the data set. This isequivalent to the conclusion that there is not auto-correlation at confident level of 5%.Thus, this model is suitable for describing the "double jeopardy".The goodness of the model is shown by the correlation and R-square coefficients.Correlation shows there are 43.7% of the observations are relative. Among this with R-square 0.19, the linear regression model is able to describe 43% (0.19/0.437) of theobservations which are related. Or almost haft of the related observations are explainedby linear regression. This also means that there are other forms of relationship betweenthe two variables. However, it goes further than the boundary of this study.
The next test is P-value (T-statistic equivalent) to test the significant of the slope againstzero at 95% confident level. The result of this test is also shown in the table 4. It saysthat the P-value is much smaller than the critical value. Hence, it is conclusive that theslope is not zero and thus, it is adequate to depict the relationship between the capitalratios and operational ratios.
Fitted Line PlotIndex Capital ratio = 68.90 - 0.4387 Index Working ratio
100
80-
60
4OH
20
o-l
'•** ; t ; . . # •
\ R-$q 19.1% [
20 40 60Index Working ratio
80 100
Figure 6: The Fitted line plot of index capital and index operational ratiosin the three cases
As pointed out in the analytical frame work, the model and the slope are both sufficientto give conclusion about the "double jeopardy". As the value of the slope is -0.44, thismean that there is a trade-off between the capital and operational costs or "doublejeopardy" issue exists in Dutch water supply companies, and the UK and Vietnam waterservice sector.
The Figure 6 above visualizes the results of the regression line between the index or thecorrected capital and operational ratios in the three selected cases. Though the dotsdeviate far from their regression line, it is obvious that the cloud of the dots has adownward slope. This visually supplements for the value of the slope given in the table4. The large deviations from the regression line of the corrected capital and operationalratios show wide range of both capital and operational ratios in the three selected cases.
36
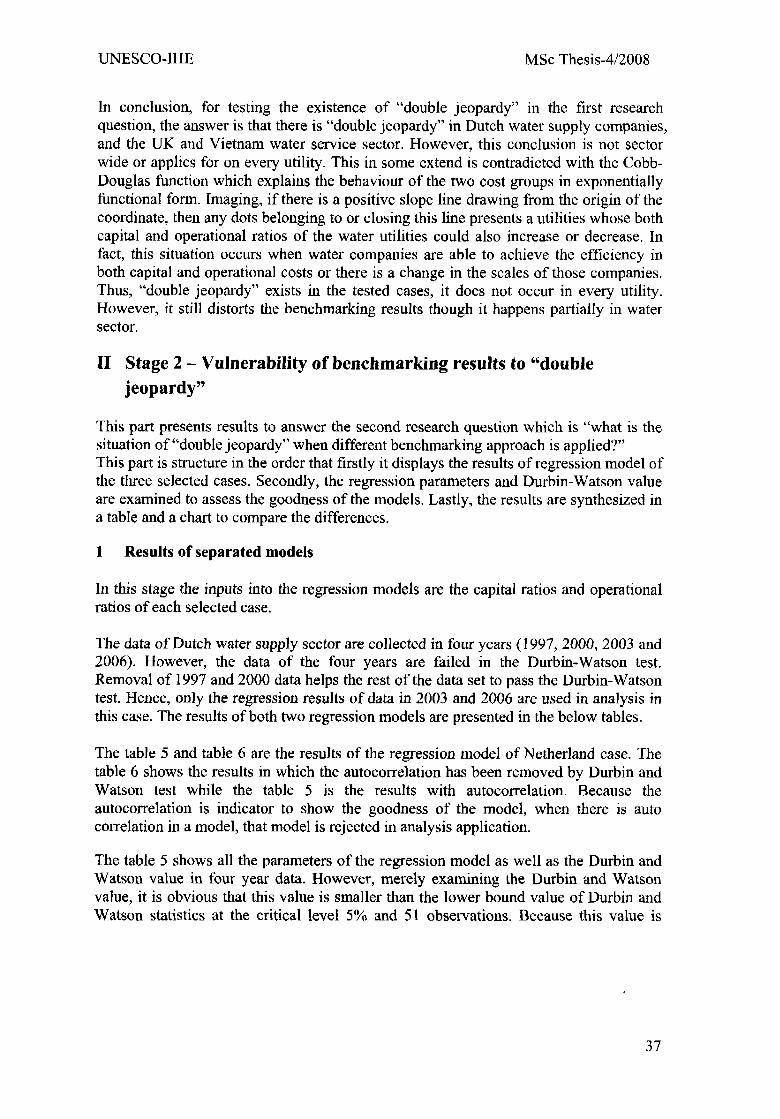
UNESCO-1HE MSc Thesis-4/2008
In conclusion, for testing the existence of "double jeopardy" in the first researchquestion, the answer is that there is "double jeopardy" in Dutch water supply companies,and the UK and Vietnam water service sector. However, this conclusion is not sectorwide or applies for on every utility. This in some extend is contradicted with the Cobb-Douglas function which explains the behaviour of the two cost groups in exponentiallyfunctional form. Imaging, if there is a positive slope line drawing from the origin of thecoordinate, then any dots belonging to or closing this line presents a utilities whose bothcapital and operational ratios of the water utilities could also increase or decrease. Infact, this situation occurs when water companies are able to achieve the efficiency inboth capital and operational costs or there is a change in the scales of those companies.Thus, "double jeopardy" exists in the tested cases, it does not occur in every utility.However, it still distorts the benchmarking results though it happens partially in watersector.
II Stage 2 - Vulnerability of benchmarking results to "doublejeopardy"
This part presents results to answer the second research question which is "what is thesituation of "double jeopardy" when different benchmarking approach is applied?"This part is structure in the order that firstly it displays the results of regression model ofthe three selected cases. Secondly, the regression parameters and Durbin-Watson valueare examined to assess the goodness of the models. Lastly, the results are synthesized ina table and a chart to compare the differences.
1 Results of separated models
In this stage the inputs into the regression models are the capital ratios and operationalratios of each selected case.
The data of Dutch water supply sector are collected in four years (1997, 2000, 2003 and2006). However, the data of the four years are failed in the Durbin-Watson test.Removal of 1997 and 2000 data helps the rest of the data set to pass the Durbin-Watsontest. Hence, only the regression results of data in 2003 and 2006 are used in analysis inthis case. The results of both two regression models are presented in the below tables.
The table 5 and table 6 are the results of the regression model of Netherland case. Thetable 6 shows the results in which the autocorrelation has been removed by Durbin andWatson test while the table 5 is the results with autocorrelation. Because theautocorrelation is indicator to show the goodness of the model, when there is autocorrelation in a model, that model is rejected in analysis application.
The table 5 shows all the parameters of the regression model as well as the Durbin andWatson value in four year data. However, merely examining the Durbin and Watsonvalue, it is obvious that this value is smaller than the lower bound value of Durbin andWatson statistics at the critical level 5% and 51 observations. Because this value is
37
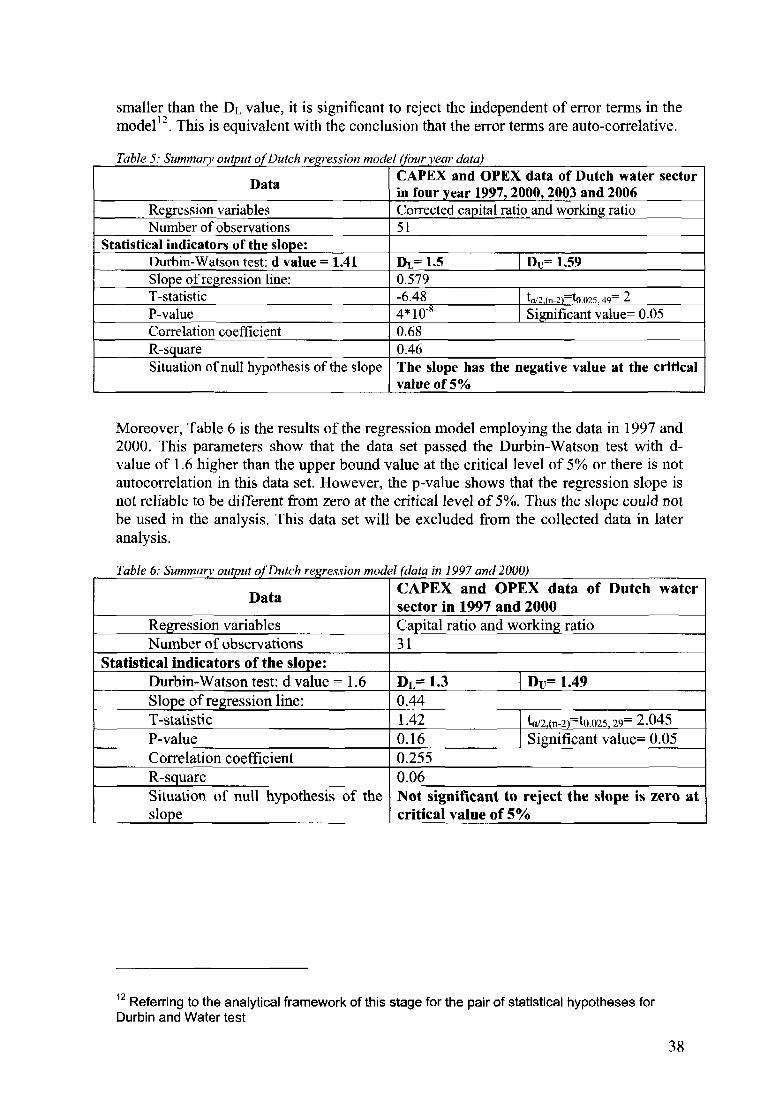
smaller than the DL value, it is significant to reject the independent of error terms in the112model . This is equivalent with the conclusion that the error terms are auto-correlative.
Table 5: Summary output of Dutch regression model (four year data)
Data
Regression variablesNumber of observations
Statistical indicators of the slope:Durbin-Watson test: d value = 1.41Slope of regression line:T-statisticP-valueCorrelation coefficientR-squareSituation of null hypothesis of the slope
CAPEX and OPEX data of Dutch water sectorin four year 1997, 2000, 2003 and 2006Corrected capital ratio and working ratio51
DL= 1.5 Du= 1.590.579-6.484*10""
to/2.(n-2r~to,025, 49~~ ^
Significant value= 0.050.680.46The slope has the negative value at the criticalvalue of 5%
Moreover, Table 6 is the results of the regression model employing the data in 1997 and2000. This parameters show that the data set passed the Durbin-Watson test with d-value of 1.6 higher than the upper bound value at the critical level of 5% or there is notautocorrelation in this data set. However, the p-value shows that the regression slope isnot reliable to be different from zero at the critical level of 5%. Thus the slope could notbe used in the analysis. This data set will be excluded from the collected data in lateranalysis.
Table 6: Summary output of Dutch regression model (data in 1997 and2000)
Data
Regression variablesNumber of observations
Statistical indicators of the slope:Durbin-Watson test: d value = 1.6Slope of regression line:T-statisticP-valueCorrelation coefficientR-squareSituation of null hypothesis of theslope
CAPEX and OPEX data of Dutch watersector in 1997 and 2000Capital ratio and working ratio31
DL= 1.3 Du= 1.490.441.420.16
to/2,(n-2)~to,025, 29~ 2.045Significant value= 0.05
0.2550.06Not significant to reject the slope is zero atcritical value of 5%
12 Referring to the analytical framework of this stage for the pair of statistical hypotheses forDurbin and Water test
38

UNESCO-IHE MSc Thesis-4/2008
Fitted Line PlotCapex= 0.8184 - 0.8750 Opex
•=• 0.6-
0.5-
0.4-
0.3-
0.2-
0.35 0.40 0.45 0.50 0.55 0.60Opex ratio (operating costs/revenue)
0.65
Figure 7: The Fitted line plot of capital and operational ratios in Dutch water supply
In Table 7, after removal of data in 1997 and 2000 the Durbin-Watson value is 2.74.This value is higher than the upper bound of the test. So it is not significant to reject thehypothesis that the error terms are independent or there is not auto-correlation in thismodel.
Table 7: Summary output of Dutch regression model (data in 2003 and 2006)
Data
Regression variablesNumber of observations
Statistical indicators of the slope:Durbin-Watson test: d value = 2.74Slope of regression line:T-statisticP-valueCorrelation coefficientR-squareSituation of null hypothesis of theslope
CAPEX and OPEX data of Dutch watersector in 2003 and 2006Capital ratio and working ratio20
DL= 1.08 D t= 1.28-0.87-4.40.000348
ta/2/n-2)-to.025, IS" 2.1
Significant value= 0.050.720.51The slope has the negative value at thecritical value 5%
T-statistics and P-value are to examine statistically the real existence of the slope value.The T-statistics and P-value are (-4.4) and 0.000348 respectively. These values aresignificant to reject the hypothesis (mentioned in previous part) that the value of theslope is zero at 95% confident level. Hence, the slope is reasonable to use in showingthe "double jeopardy" issue.
Next is the correlative coefficient with the value of 0.72. This value indicates 72% ofcapital and operational ratios of Dutch water sector are related. This is also equivalent to72% of the capital and operational costs of Dutch water sector related.
39
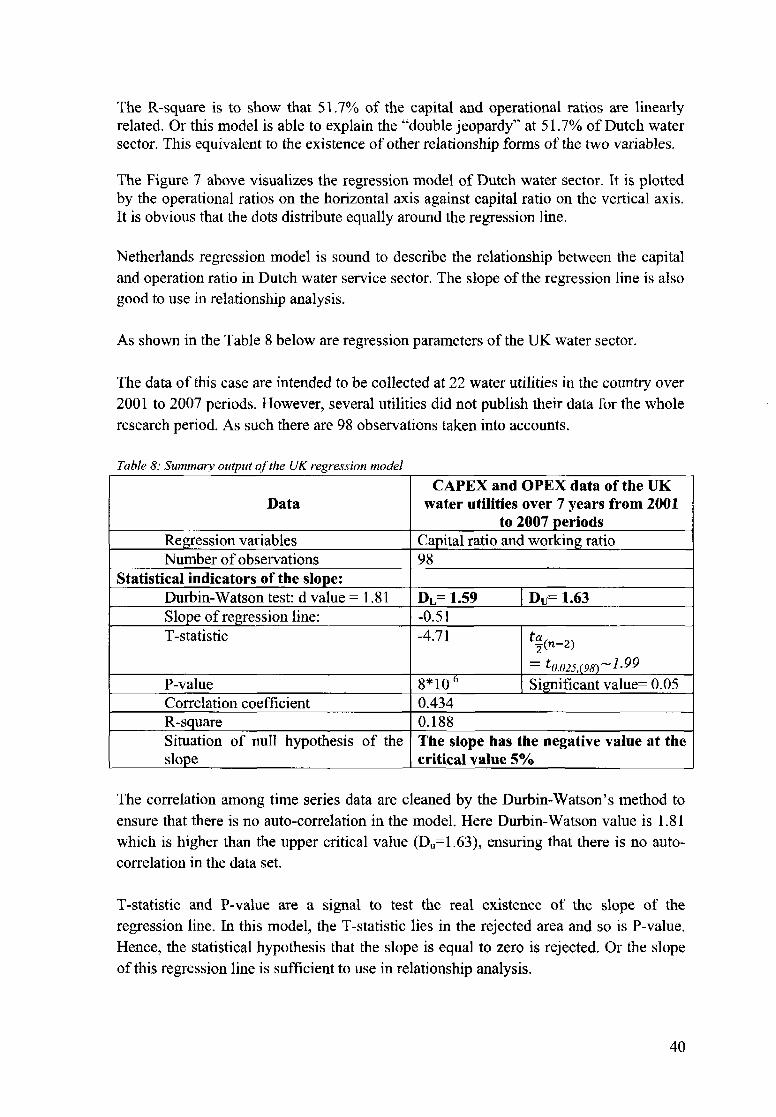
The R-square is to show that 51.7% of the capital and operational ratios are linearlyrelated. Or this model is able to explain the "double jeopardy" at 51.7% of Dutch watersector. This equivalent to the existence of other relationship forms of the two variables.
The Figure 7 above visualizes the regression model of Dutch water sector. It is plottedby the operational ratios on the horizontal axis against capital ratio on the vertical axis.It is obvious that the dots distribute equally around the regression line.
Netherlands regression model is sound to describe the relationship between the capitaland operation ratio in Dutch water service sector. The slope of the regression line is alsogood to use in relationship analysis.
As shown in the Table 8 below are regression parameters of the UK water sector.
The data of this case are intended to be collected at 22 water utilities in the country over2001 to 2007 periods. However, several utilities did not publish their data for the wholeresearch period. As such there are 98 observations taken into accounts.
Table 8: Summary output of the UK regression model
Data
Regression variablesNumber of observations
Statistical indicators of the slope:Durbin-Watson test: d value - 1.81Slope of regression line:T-statistic
P-valueCorrelation coefficientR-squareSituation of null hypothesis of theslope
CAPEX and OPEX data of the UKwater utilities over 7 years from 2001
to 2007 periodsCapital ratio and working ratio98
DL= 1.59 Du= 1.63-0.51-4.71
8*10"6= to.O25,(98)~l-99
Significant value= 0.050.4340.188The slope has the negative value at thecritical value 5%
The correlation among time series data are cleaned by the Durbin-Watson's method toensure that there is no auto-correlation in the model. Here Durbin-Watson value is 1.81which is higher than the upper critical value (Du=1.63), ensuring that there is no auto-correlation in the data set.
T-statistic and P-value are a signal to test the real existence of the slope of theregression line. In this model, the T-statistic lies in the rejected area and so is P-value.Hence, the statistical hypothesis that the slope is equal to zero is rejected. Or the slopeof this regression line is sufficient to use in relationship analysis.
40
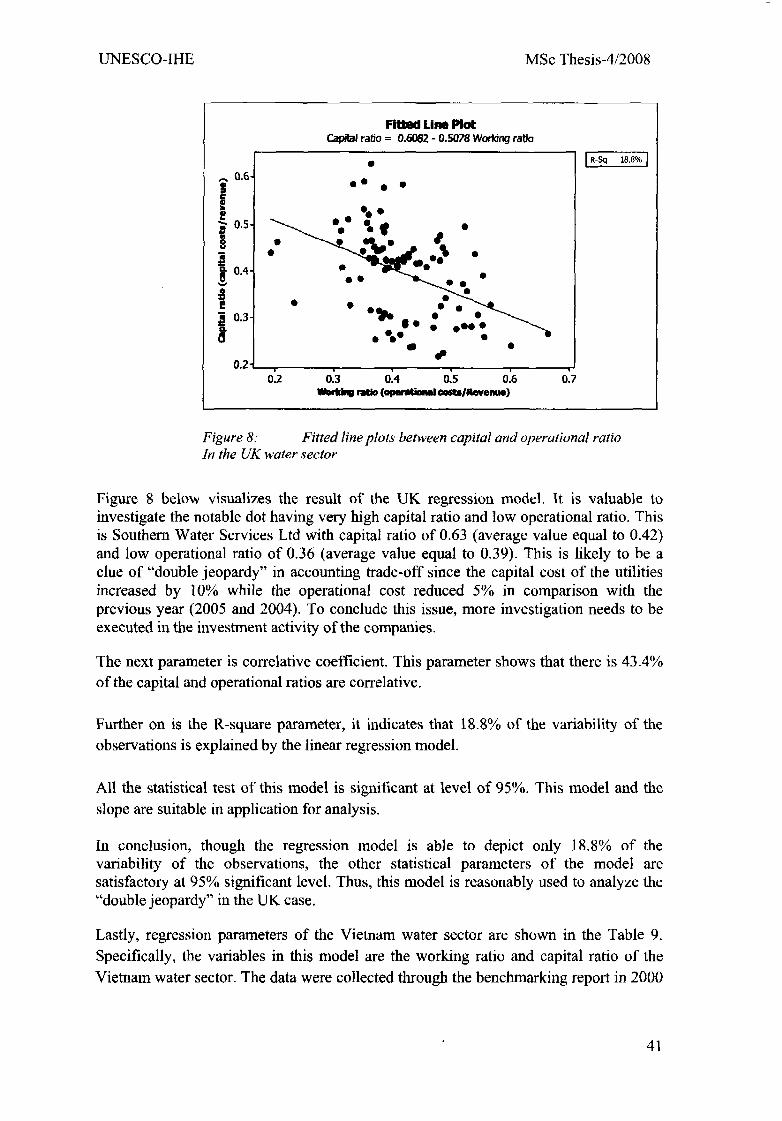
UNESCO-IHE MSc Thesis-4/2008
„ 0.6-
a °-5"2m 0.4-
15 0.3-
Cap
0.2-
*
0.2
Fined Una MotCapital ratio = 0.6082 - 0.5078 Working ratio
0
• * • •
* • •
0.3 0.4 0.5 0.6Wtartdnp ratio (opMatioMl CMta/ltawemM}
1
| R-Sq 18.8% |
0.7
Figure 8: Fitted line plots between capital and operational ratioIn the UK water sector
Figure 8 below visualizes the result of the UK regression model. It is valuable toinvestigate the notable dot having very high capital ratio and low operational ratio. Thisis Southern Water Services Ltd with capital ratio of 0.63 (average value equal to 0.42)and low operational ratio of 0.36 (average value equal to 0.39). This is likely to be aclue of "double jeopardy" in accounting trade-off since the capital cost of the utilitiesincreased by 10% while the operational cost reduced 5% in comparison with theprevious year (2005 and 2004). To conclude this issue, more investigation needs to beexecuted in the investment activity of the companies.
The next parameter is correlative coefficient. This parameter shows that there is 43.4%of the capital and operational ratios are correlative.
Further on is the R-square parameter, it indicates that 18.8% of the variability of theobservations is explained by the linear regression model.
All the statistical test of this model is significant at level of 95%. This model and theslope are suitable in application for analysis.
In conclusion, though the regression model is able to depict only 18.8% of thevariability of the observations, the other statistical parameters of the model aresatisfactory at 95% significant level. Thus, this model is reasonably used to analyze the"double jeopardy" in the UK case.
Lastly, regression parameters of the Vietnam water sector are shown in the Table 9.Specifically, the variables in this model are the working ratio and capital ratio of theVietnam water sector. The data were collected through the benchmarking report in 2000
41

and the Ministry of Construction. After merging the two set of data, there are 31observations available for feeding in the regression model.Table 9: Summary output of the Vietnam regression model
Data
Regression variablesNumber of observations
Statistical indicators of the slope:Slope of regression line:T-statistic
P-valueCorrelation coefficientR-squareSituation of null hypothesis of theslope
CAPEX and OPEX data of Vietnamwater sector in 2000Capital ratio and working ratio31
-0.32-1.48
0.148
*%n-2) = ^.025,(29)- ~ 1 9 9
Significant value= 0.050.2650.07Not significant to reject the slope iszero at 95% level of confident
Because the data in Vietnam case were collected in a single year, there is not likely tohave an auto-correlation in these set of data. Thus, the Durbin-Watson test is avoidablein this case.
Unfortunately, T-statistic and P-value are not significant at the confident level of 95% toreject the zero slope value. These values are -1.4 and 0.158 respectively.
The correlative and R-square coefficients (26.5% and 7% respectively) also show thatthe goodness of the model is not able to explain the "double jeopardy" issue in Vietnam.
In conclusion, the model poorly describes the "double jeopardy" in Vietnam case. Infact, it is actually inconclusive about the "double jeopardy" in this case.
Though the results of the Vietnam case are not statistical significant for judging the"double jeopardy" in Vietnam, the results and the collected data are still use forcomparative purposes in the later parts.
42
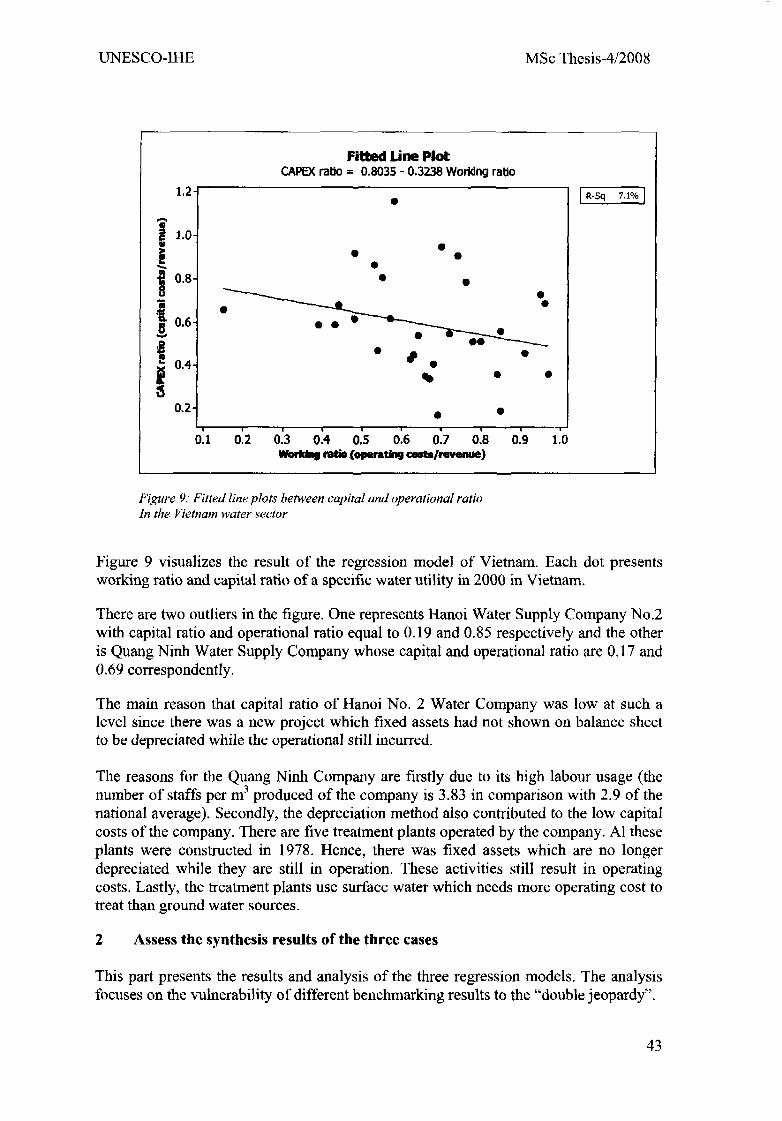
UNESCO-IHE MSc Thesis-4/2008
Fitted Line PlotCAPEX ratio * 0.8035 - 0.3238 Working ratio
1.2
1.0
0.8-
1 0.6-
0.4-
0.2-
| R-Sq 7.1% j
0.1 0.2 0.3 0.4 0.5 0.6 0.7 0.8Working ratio (operating costs/revenue)
0.9 1.0
Figure 9: Fitted line plots between capital and operational ratioIn the Vietnam water sector
Figure 9 visualizes the result of the regression model of Vietnam. Each dot presentsworking ratio and capital ratio of a specific water utility in 2000 in Vietnam.
There are two outliers in the figure. One represents Hanoi Water Supply Company No.2with capital ratio and operational ratio equal to 0.19 and 0.85 respectively and the otheris Quang Ninh Water Supply Company whose capital and operational ratio are 0.17 and0.69 correspondency.
The main reason that capital ratio of Hanoi No. 2 Water Company was low at such alevel since there was a new project which fixed assets had not shown on balance sheetto be depreciated while the operational still incurred.
The reasons for the Quang Ninh Company are firstly due to its high labour usage (thenumber of staffs per m3 produced of the company is 3.83 in comparison with 2.9 of thenational average). Secondly, the depreciation method also contributed to the low capitalcosts of the company. There are five treatment plants operated by the company. Al theseplants were constructed in 1978. Hence, there was fixed assets which are no longerdepreciated while they are still in operation. These activities still result in operatingcosts. Lastly, the treatment plants use surface water which needs more operating cost totreat than ground water sources.
2 Assess the synthesis results of the three cases
This part presents the results and analysis of the three regression models. The analysisfocuses on the vulnerability of different benchmarking results to the "double jeopardy".
43
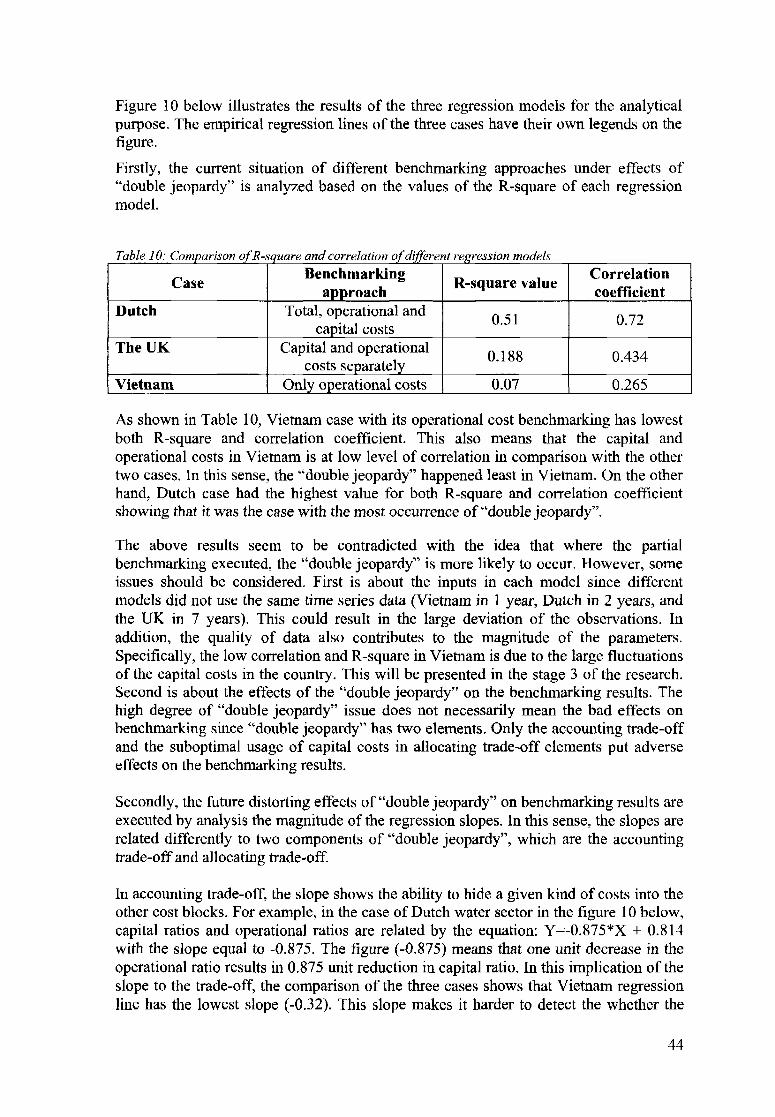
Figure 10 below illustrates the results of the three regression models for the analyticalpurpose. The empirical regression lines of the three cases have their own legends on thefigure.
Firstly, the current situation of different benchmarking approaches under effects of"double jeopardy" is analyzed based on the values of the R-square of each regressionmodel.
Table 10: Comparison ofR-square and correlation of different regression models
Case
Dutch
The UK
Vietnam
Benchmarkingapproach
Total, operational andcapital costs
Capital and operationalcosts separately
Only operational costs
R-square value
0.51
0.188
0.07
Correlationcoefficient
0.72
0.434
0.265
As shown in Table 10, Vietnam case with its operational cost benchmarking has lowestboth R-square and correlation coefficient. This also means that the capital andoperational costs in Vietnam is at low level of correlation in comparison with the othertwo cases. In this sense, the "double jeopardy" happened least in Vietnam. On the otherhand, Dutch case had the highest value for both R-square and correlation coefficientshowing that it was the case with the most occurrence of "double jeopardy".
The above results seem to be contradicted with the idea that where the partialbenchmarking executed, the "double jeopardy" is more likely to occur. However, someissues should be considered. First is about the inputs in each model since differentmodels did not use the same time series data (Vietnam in 1 year, Dutch in 2 years, andthe UK in 7 years). This could result in the large deviation of the observations. Inaddition, the quality of data also contributes to the magnitude of the parameters.Specifically, the low correlation and R-square in Vietnam is due to the large fluctuationsof the capital costs in the country. This will be presented in the stage 3 of the research.Second is about the effects of the "double jeopardy" on the benchmarking results. Thehigh degree of "double jeopardy" issue does not necessarily mean the bad effects onbenchmarking since "double jeopardy" has two elements. Only the accounting trade-offand the suboptimal usage of capital costs in allocating trade-off elements put adverseeffects on the benchmarking results.
Secondly, the future distorting effects of "double jeopardy" on benchmarking results areexecuted by analysis the magnitude of the regression slopes. In this sense, the slopes arerelated differently to two components of "double jeopardy", which are the accountingtrade-off and allocating trade-off.
In accounting trade-off, the slope shows the ability to hide a given kind of costs into theother cost blocks. For example, in the case of Dutch water sector in the figure 10 below,capital ratios and operational ratios are related by the equation: Y=-0.875*X + 0.814with the slope equal to -0.875. The figure (-0.875) means that one unit decrease in theoperational ratio results in 0.875 unit reduction in capital ratio. In this implication of theslope to the trade-off, the comparison of the three cases shows that Vietnam regressionline has the lowest slope (-0.32). This slope makes it harder to detect the whether the
44

UNESCO-IHE MSc Thesis-4/2008
companies shift operating costs into capital costs since one unit reduction in operationalratio leads to only 0.32 units in capital ratio. Applying the same interpretation showsthat in Dutch case, it is easier to detect the accounting trade-off since this case has thelargest slope, and the UK case stands in the middle with slope of-0.5.
Ioo
31o
I§
1.40
1.20
1.00
0.80
0.60
0.40'
0.20
0.00
L=-03238X +0.8035
= -0.5078X+ O6082--O -••-.. ,y = ^).87Sx + 0.8184
•The UK
• Dutch
• Vietnam
0.00 0.20 0.40 0.60 0.80 1.00 1.20
Capital ratio (capital costs/revenue)Figure 10: Regression of the three cases between capital and operational ratio
In relation with benchmarking approaches, in case of partial benchmarking, the lowervalue of slope shows higher possibility of accounting trade-off and this results in thehigher distortion in partial benchmarking results.
The slope is also related to the allocating trade-off of "double jeopardy" issue. Theallocating trade-off means that how much capital costs a company invests in relationwith the amount operational costs consumed. Within this respect, the slope shows howexpensive the trade-off is. Like in the Dutch equation (Y=-0.875*X + 0.814) shows thatif the operational reduces 1 unit, the capital cost needs to increases 0.87 units. This isthe most expensive one in comparison with the other two cases -0.5 and 0.32 forVietnam and the UK correspondently. Because of the expensiveness, the water utilitiesin Dutch case are less incentive to make the trade-off.
Thus, slope analysis shows that the Vietnam water service sector with operational costbenchmarking results is more vulnerable to the "double jeopardy" issue since the lowslope value indicates the less expensive and difficult to detect the trade-off.
Noting that, the above analysis does not mention the cause and effect relationshipbetween the benchmarking approaches and magnitude of the slopes. It only intends toshow the sensitivity of "double jeopardy" to different benchmarking approach under aspecific slope.
The magnitude of the slope is a different issue. It is the nature of the sector dependingon the technology development and price of labour in the specific sector. Technology
45
development shows the amount of labour to exchange with capital investment. Themore advanced technology is, the steep slope is. For example, Vietnam case is lowtechnology development, and then the slope is lower than the other two cases. Similarly,the slope is also high in the case where the labour price is high.
Secondly, efficiency level of each case is also a signal for the suboptimal allocatingtrade-off. The efficiency is expressed by the distance from the regression linerepresented for the case to the origin of the coordinate. The closer the line to the originis, the more effective the case is since this owns a capital and operational ratio as low aspossible.
Referring to the figure 10 above, the distance from the Vietnam' regression line to theorigin is the largest. Hence, the efficiency of this case is the lowest among the threecases.
Consider the Dutch and the UK cases separately, these two cases are intercepted eachother at the point with capital ratio and operational ratio equal to 0.32 and 0.57correspondency (the arrow in the figure 10). In term of capital ratio, when Dutch watersector employs a capital ratio above 0.32, it is more efficient than the UK case. Thequestion here is that "why is the efficient level of the UK lower than that of the Dutchcase at the high capital ratio"? There are two explanations for the situation of the UK incomparison with Dutch case. Firstly, the price of labour (operational costs) is cheaper inrelation with capital in the UK case. Hence, the UK utilities prefer to use labour insteadof capital. Secondly, there is possibility that overinvestment occurs more frequently inthe UK than in Dutch water sector that make the capital less efficient.
Moreover, in reality the Dutch water sector is more effective than the UK sector. Byinvestigating the data set of operational ratio shows that 97.96% observations from theUK employed operational ratios lower than 0.57 while the UK is more efficient than theDutch case only if the operational ratio is above 0.57.
Thus, in term of efficiency, the Dutch case is most efficient, second is the UK and last isVietnam case.
Returning to the point of benchmarking approaches in relation with efficiency, Vietnamis the lowest efficient case and its benchmarking approach is only operational indicator.However, in this case it is unable to claim the low efficiency by Vietnam's partialbenchmarking approach since both capital and operational of the case are less efficientthan that of the other two cases. The lower efficient level is due to the other factors fromdeveloping countries distinguishing from developed countries.
On the other hand, the Dutch and the UK case are more compatible in term oftechnology development and the mature of the water supply sector. Hence, comparisonbetween the two cases is able to reveal the effects of "double jeopardy" on theefficiency.
The lower capital efficiency of the UK in comparison with Dutch case has twopossibilities to explain as above. One of them is the over-investment. And over-investment could results from the accounting trade-off and physically over-invested.These two issues are "double jeopardy" elements. In combination with benchmarking
46
UNESCO-IHE MSc Thesis-4/2008
approaches, Dutch's benchmarking scheme uses total, operational and capital costswhile the UK benchmarks capital cost and operational costs separately. Thus, there ishigh possibility that the lower efficiency in the UK is due to the partial benchmarkingindicator selection. Partial indicators lead the water utilities to treat operational andcapital costs differently. Or partial benchmarking approaches are more sensitive to"double jeopardy". This sensitivity may lead to distortion in benchmarking results.
In conclusion for this part:
As the analysis of the R-square and correlation coefficient, the pass data show that the"double jeopardy" occurred more in the total cost benchmarking approaches. However,this observation is facing limitations of the data.
Analysis for the future application of different benchmarking approaches shows thatpartial benchmarking approaches are more sensitive to "double jeopardy" than totalbenchmarking approach. Especially, in the situation where the trade-off coefficientbetween the capital costs and operational costs is low (developing countries), partialbenchmarking together with the Agent-Principle problem (hiding costs) make it easierfor "double jeopardy" to distort the benchmarking results. Lower efficiency in testedcase shows high possibility that it is influenced by partial benchmarking approachesunder the influence of "double jeopardy".
The remark of this section is about the assumption of cost minimizing of water utilitieson which the above analyses are executed. The assumption is built on the ideal casewhere the price of capital and labour is treated equally. In this situation every companywill try to be as close as possible to the origin of the coordinate.
Ill Stage 3 The consistence among various performance benchmarkingoutcomes
This part presents the results of a comparison of total cost against operational costbenchmarking outcomes as well as the capital ratios and operational ratio against theother operating performance of water companies in Vietnam. This examination helps tostrengthen the "double jeopardy" issue in the case where operational benchmarkingindicator is selected.
1 Total cost vs. operational cost benchmarking outcomes
Figure 11 shows the overall performance scores of operational cost based model andtotal cost based model of 28 water companies in Vietnam in 2000. The horizontal axispresents the water companies, while the vertical axis is the overall performance scores.Comparing the TOTEX with OPEX performance in the chart shows that there are pointswhere the TOTEX performance is higher than that of CAPEX performance and viceversa. Also the two trend lines representing the TOTEX and OPEX performanceintercepts each other. This means the results from the operational benchmarking do notcoincide with those from the total model.
Referring to chapter 3, where Giannakis et al. (2004) presents two statements. The firststatement is that the benchmarking outcomes are sensitive to the selection of indicators.
47
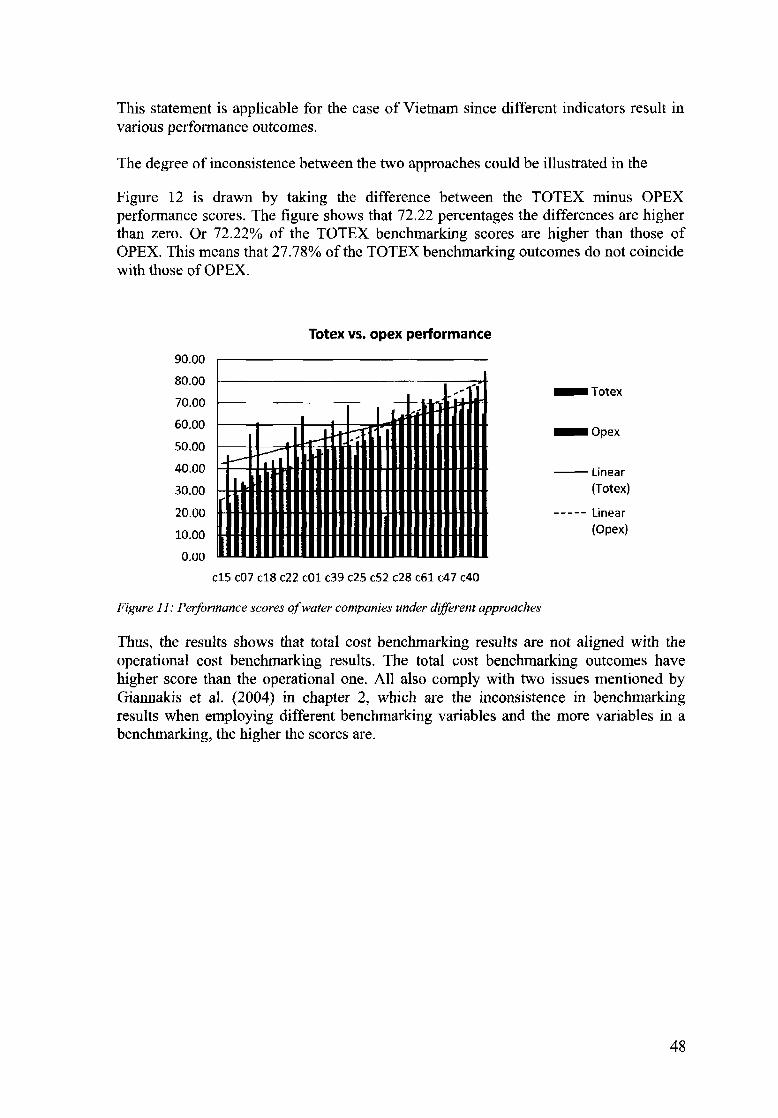
This statement is applicable for the case of Vietnam since different indicators result invarious performance outcomes.
The degree of inconsistence between the two approaches could be illustrated in the
Figure 12 is drawn by taking the difference between the TOTEX minus OPEXperformance scores. The figure shows that 72.22 percentages the differences are higherthan zero. Or 72.22% of the TOTEX benchmarking scores are higher than those ofOPEX. This means that 27.78% of the TOTEX benchmarking outcomes do not coincidewith those of OP EX.
Totex vs. opex performance
I Totex
I Opex
Linear(Totex)
Linear(Opex)
cl5 C07 c l8 c22 cOl c39 c25 c52 c28 C61 c47 c40
Figure 11: Performance scores of water companies under different approaches
Thus, the results shows that total cost benchmarking results are not aligned with theoperational cost benchmarking results. The total cost benchmarking outcomes havehigher score than the operational one. All also comply with two issues mentioned byGiannakis et al. (2004) in chapter 2, which are the inconsistence in benchmarkingresults when employing different benchmarking variables and the more variables in abenchmarking, the higher the scores are.
48

UNESCO-IHE MSc Thesis-4/2008
Totex minus opex results
SXLc61 3
C52
c39cOlc22Cl8cO7
-100% -50% 0% 50%
Figure 12: The difference between TOTEX and OPEX performance
100%
2 UFW vs. total and operational cost benchmarking performance
Figure 13 shows the unaccounted for water vs. the capital and operational costperformance of 28 Vietnamese water supply companies in 2000. To eliminate theeffects of the scale of the companies on the UAF, this indicator has been corrected bythe number of connections of observed companies.
The three lines in the chart are the trend of the three investigated variables; unaccountedfor water, working ratio and total ratio. These lines show that the trends of UFW andtotal ratio are more coincided than those of UFW and operational ratio. This means thata company with high capital ratio also has high UAF indicators. This seems contradictwith reality since in reality companies invest more capital with the intention that theywill have more advanced technology or better asset systems. However, if the companiesinvest more in asset but they lack a good maintenance system and labour force to detectthe leakage or burst, then the pipe systems are not cared sufficiently. Especially in theVietnam, the asset systems have been invested long ago. As a result, the UFW is likelyto occur at high level.
49

o
100.00
0.00
u00u
• 1M l
O
• •• •
in ^ O ri inu o u o u
Working ratioUAFLinear (CAPEX
i/i no en CM r~»o o o o o
ratio)
I CAPEX ratioLinear (Working ratio)
• Linear (UAF)
Figure 13: UFW vs. Capital and working ratios
On the other hand, the UFW and operational trend are contradicted with each other. Thecompanies with high UFW have low operational ratio. This situation reflects the realityin water companies in Vietnam. When the companies save the operational costs, theymust spend in UFW or this ratio is high. Why do they do this? This is likely to be theoperational benchmarking approach in Vietnam. This discrimination between capitalcosts and operational costs trigger out a problem for operational benchmarking results.On the benchmarking results, the companies look high efficient performance inoperational costs while their investment is not used properly, the high performance inoperational ratio is paid by the high UFW. If they are given loans, are the loans given toa real high efficient performance companies in term of total cost?
3 Number of staffs per thousand connection vs. total and working ratio
Figure 14 shows the number of staffs per thousand connections vs. the total andoperational cost performance of 28 Vietnamese water supply companies in 2000.
The three lines in the chart are the trends of the three investigated variables; number ofstaffs per thousand connections, working ratio and total ratio.
50
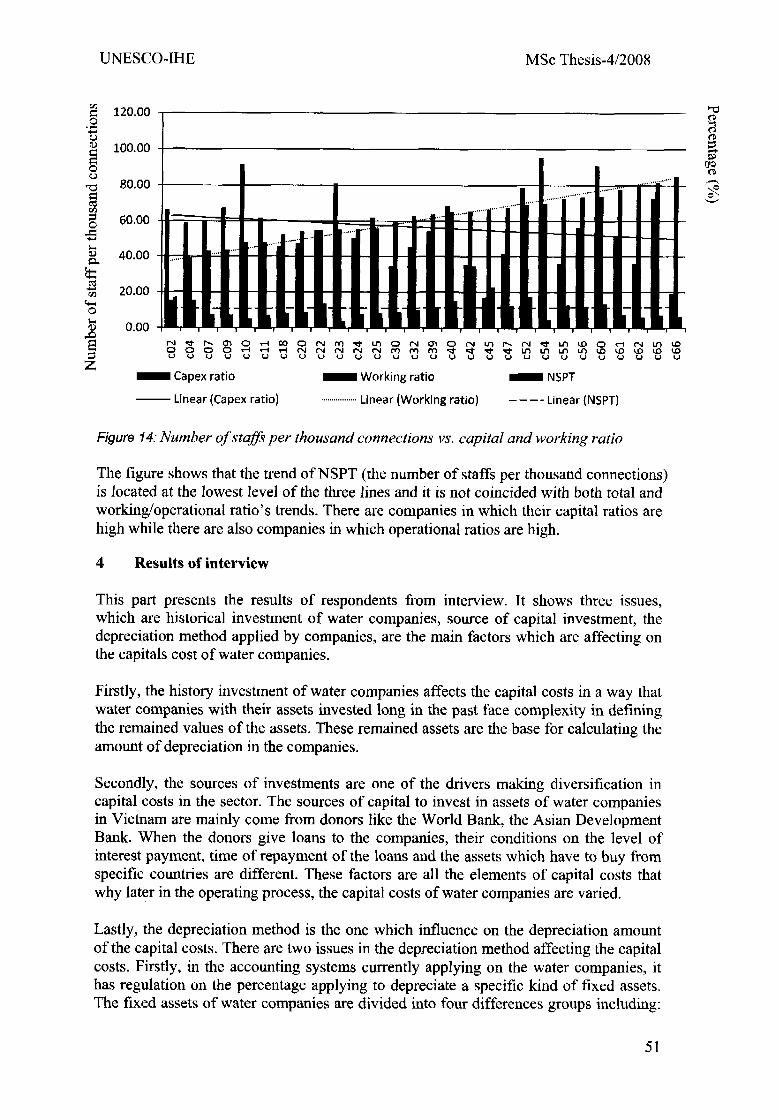
UNESCO-IHE MSc Thesis-4/2008
3 120.00o1oo
Ig
I3
100.00
80.00
60.00
40.00
20.00
0.00 rmumiimnimiiiiim! ^ S t K Q ' j 0 0 0 ' N i < 1 o ^ L n o < M ( 7 i o r \ i u n i ^ < M ^ L / i i D o * - » ( N L f " ) L D
I Capex ratio
• Linear (Capex ratio)
I Working ratio
Linear (Working ratio) Linear (NSPT)
Figure 14: Number of staffs per thousand connections vs. capital and working ratio
The figure shows that the trend of NSPT (the number of staffs per thousand connections)is located at the lowest level of the three lines and it is not coincided with both total andworking/operational ratio's trends. There are companies in which their capital ratios arehigh while there are also companies in which operational ratios are high.
4 Results of interview
This part presents the results of respondents from interview. It shows three issues,which are historical investment of water companies, source of capital investment, thedepreciation method applied by companies, are the main factors which are affecting onthe capitals cost of water companies.
Firstly, the history investment of water companies affects the capital costs in a way thatwater companies with their assets invested long in the past face complexity in definingthe remained values of the assets. These remained assets are the base for calculating theamount of depreciation in the companies.
Secondly, the sources of investments are one of the drivers making diversification incapital costs in the sector. The sources of capital to invest in assets of water companiesin Vietnam are mainly come from donors like the World Bank, the Asian DevelopmentBank. When the donors give loans to the companies, their conditions on the level ofinterest payment, time of repayment of the loans and the assets which have to buy fromspecific countries are different. These factors are all the elements of capital costs thatwhy later in the operating process, the capital costs of water companies are varied.
Lastly, the depreciation method is the one which influence on the depreciation amountof the capital costs. There are two issues in the depreciation method affecting the capitalcosts. Firstly, in the accounting systems currently applying on the water companies, ithas regulation on the percentage applying to depreciate a specific kind of fixed assets.The fixed assets of water companies are divided into four differences groups including:
8-eran
51

the water collecting system, the treatment plan system, the distribution system and theother fixed assets. However, companies faces the controversy in category their assetsinto the four above groups to apply the depreciating percentage. As a result of this, thecapital costs are varied. Secondly, the depreciation of assets in a water companies alsogets influence from the donors. In some loaning contracts, the donors also define thelevel and time of depreciation of the assets funded by their loans.
52
UNESCO-IHE MSc Thesis-4/2008
Chapter 5 Conclusion and recommendation
Conclusions
Basing on the results in chapter 4, this part presents the conclusion about the researchquestions. It also shows the weaknesses of this research as well as some issue which arenot able to research within the boundary of this study. Lastly, basing on the conclusion,it gives the recommendations.
The first research question: Is there a "double jeopardy" in water service sector? Theanswer is that there is "double jeopardy" in water service sector by testing the data ofDutch and the UK.
The second research question: Under the existence of "double jeopardy", whichbenchmarking outcomes (total or partial approaches) are more likely to be distorted?The conclusion for this research question is categorized into the sub-group as follow:
In Vietnam case, where only operational indicator is employed to measure theefficiency and the low slope of trade-off between the capital and operational ratio, theefficient benchmarking outcomes are more likely to be distorted than the two othercases with higher slope of trade-off. This is because of the fact that low trade-off slopemake it easier for companies shifting costs from one to another block (the Agent-Principle problem is easier to occur). This also equivalent to that the operationalbenchmarking indicator selection is more vulnerable to the "double jeopardy".
Relatively, the efficiency of the water utilities in Dutch is higher than that of the waterutilities in the UK. The lower efficiency is likely to be result from the partialbenchmarking approach currently existing in the country. Or efficiency in partialbenchmarking is likely to be distorted. This make the results of partial benchmarkingare also more vulnerable to the "double jeopardy".
The answer for the second research question is that partial benchmarking eitheroperational indicator is used or both the operational and capital indicator are employed,is always more vulnerable to the "double jeopardy" issue. Especially in the case ofdeveloping countries, in which the slope of trade-off is normally low, the benchmarkingresults are more severely vulnerable to the "double jeopardy".
The third research question: The third research question is structured into three sub-questions. The first one deals with the consistency between the operational and totalcost benchmarking outcomes. The conclusion for this question is that the total costbenchmarking outcomes are not coincided with the operational cost benchmarkingoutcomes. The second one deals with the comparison of other operational performanceof water utilities against the working and capital ratio. In this aspect, the UFW are morecoincided with the capital ratio than with operational ratio while it is inconclusive aboutthe comparison of number of staffs per thousand connections against the operational andcapital ratio. The last one is about three main drivers that make the capital costs inVietnam case diversification, which are the historical investment of water companies,source of capital investment, the depreciation method applied by companies.
53
Recommendations
From the conclusion of the first and the second question of this study the firstrecommendation for the selection of benchmarking indicator is that the total costbenchmarking indicator selection is likely to face less distortion for benchmarkingoutcomes. Thus, benchmarking scheme should apply the total cost indicator instead ofpartial cost indicators. This will avoid the accounting trade-off and increasing in costbase. Both help to use benchmarking properly in meaning that it boosts the efficiency ofthe public sector due to lack of market mechanisms.
Application of total benchmarking scheme faces the challenges of measuring the capitalcosts which is difficult as pointed out in the literature review chapter and thediversification of capital costs like in Vietnam case. These challenges are able to makethe total cost benchmarking unachievable in developing countries. In this situation, ifthe partial benchmarking is used, the financial activities of water companies should bemade transparency and standardization to minimize the distortion of partialbenchmarking outcomes by the "double jeopardy" issue.
Limitations of this study
The first limitation of this study happens at the case of Vietnam. The results ofregression model are not statistical significant at the confident level of 95%. Thisproblem is likely to occur due to two factors. The first is the sample size of the collecteddata has not sufficient. Second is the accuracy of the collected data. To avoid thisproblem, the future study should increase the sample size and pay more attention to theaccuracy of data by checking directly with the data providers to confirm some doubtfulfigures.
The current research with its analytical framework is unable to delineate the effects ofdifferent "double jeopardy" components on benchmarking results. This research merelyregards all components of the issue as factors making the distortion in the benchmarkingoutcomes. However, the optimal allocating trade-off of "double jeopardy" does notdistort the benchmarking outcomes. Hence, the new analytical framework should bedeveloped to estimate the effects of different trade-off on the benchmarking results.
Lastly, within the boundary of this research, it is unable to estimate the most likelysuitable form of the relationship between the capital and operational costs of waterutilities. Hence, the assumption about the linear relationship between the capital andoperational costs based on which the linear regression model is applied has beenformulated. As in the regression model of the three separate cases, the R-square valuesare much low than the correlation coefficients. This implies that the capital andoperational costs also relate to each other in another form rather than only the linearform. The future research could also expand the test of "double jeopardy" issue byapply the other regression models such as the exponential forms.
54
UNESCO-IHE MSc Thesis-4/2008
Reference
Allan, G. (2006). "Assessing capital efficiency in the water and sewerage industry inEngland and Wales: Ofwat's approach." Utilities Policy 14: 224-233.
Ajodhia, V., Kristiansen, T., and Petrov, K. (2004) INTEGRATED COST ANDQUALITY BENCHMARKING IN ELECTRICITY DISTRIBUTION.
Brealey, R. A., et al. (2001), FUNDAMENTALS OF CORPORATE FINANCE, ThirdEdition ed., 639 pp., The McGraw-Hill, San Francisco.
Burns, P., and Riechmann, C. (2004) Regulatory instruments and investment behaviour.Utilities Policy, 12(4), 211-219.
Byatt, I. C. R. (1995), The costs of water delivered and sewage collected, OFWAT,Birmingham.
Corton, M. L. (2003), Benchmarking in Latin Water Sector; the case of Peru, UtilityPolicy, 11, 133-142.
Dassler, T., Parker, D., and Saal, D. S. (2006) Methods and trends of performancebenchmarking in UK utility regulation. Utilities Policy, 14, 166-174.
Diewart, W. E., and Nakamura, A. O. (1999) Benchmarking and the Measurement ofBest Practice Efficiency: An Electricity Generation Application. The Canadian Journalof Economics /Revue canadienne dEconomique, 32(2), 570-588.
Douglas C. Montgomery, G. C. R. (2003), Applied Statistics and Probability forEngineers, 3 ed., John Wiley & Sons, Inc, United States of America.
Drew, S. A. W. (1997), From Knowledge to Action: Impact of Benchmarking on theOrganizational Performance, Long Range Planning, 30, 427-441.
Fare, R., Grosskopf, S., Lovell, C.A.K., 1985. The Measurement of Efficiency ofProduction. Kluwer-Nijhoff Publishing, Boston.
Durbin, J., and G. S. Watson (1951) Testing for Serial Correlation in Least SquaresRegression. II. Biometrika, 38(1/2), 159-177.
Fong, S. W., Cheng, E. W. L., and Ho, D. C. K. (1998) Benchmarking: a generalreading for management practitioners. Management Decision 36(6), 407-^418.
Fox, P. (2000), Capital works unit costs in the water industry, 24 pp, OFWAT,Birmingham.
Frontier Economics (2003), Balancing incentives, Frontier Economics, London.
Giannakis, D., Jamasbb, T., and Pollittc, M. (2004) Benchmarking and incentiveregulation of quality of service: an application to the UK electricity distributionnetworks. Energy Policy, 33(17), 2256-2271.
55

Hendrikx, J. A. M., and T. J. J. Schmitz (2007), Reflections on performance 2006,Vewin, Rijswijk.
Irastorza, V. (2003), Benchmarking for Distribution Utilities: A Problematic Approachto Defining Efficiency, The Electricity Journal.
Jamasb, T., Nillesen, P., and Pollitt, M. (2003) Gaming the Regulator: A Survey. TheElectricity Journal, 16(10), 68- 80.
Kessides, 1. (2003), Reforming Infrastructure: Privatization, Regulation andCompetition, World Bank, Washington D.C.
Kouzmin, A., Loffler, E., Klages, H., and Kakabadse, N. K. (1999) Benchmarking andperformance measurement in public sectors: Towards learning for agency effectiveness.The International Journal of Public Sector Management, 12(2), 121-144.
Larsson, M., Parena, R., Smeets, E., and Troquet (2002) Process Benchmarking in theWater Industry, IWA Pulishing, London.
Noll, R., Shirley, M. M., and Cowan, S. (2000) Regulatory reform: Economic analysisand British experience. SIEPR Discussion Paper No. 99-32, Stanford Institute forEconomic Policy Research, Stanford.
Sharifian, J. (2002), Benchmarking the Urban Water Sector Vietnam, The World Bank,Hanoi.
Shleifer, A., (1985) A theory of yardstick competition. Rand Journal of Economics, 16(3), 319-327.
Shuttleworth, G. (2005), Benchmarking of electricity networks: Practical problems withits use for regulation, Utilities Policy, 13, 310-317.
Ton, N., et al. (2003), Main report; Capital cost section, Vietnam Water and SererageAssociassion, Ha Noi.
Voulgaris, F., et al. (2000), On the Evaluation of Greek Industrial SMEs' Performancevia Multicriteria Analysis of Financial Ratios, Small Business Economics, 15, 127-136.
Warford, J. L. F. J. J. (1969), Cost Functions for the Water Industry, The Journal ofIndustrial Economics, 18, 53-63.
56

UNESCO-IHE MSc Thesis-4/2008
Appendices 1 Key indicators of performance or "metric" benchmarking
Indicator Definition UnitWater Coverage
Water Production
Total WaterConsumptionTotal WaterConsumptionResidentialConsumptionNon RevenueWater
Metering level
% sold that ismeteredPipe Breaks
Unit OperationalCost of WaterStaff/000 connectionsLabor Costs vs.Operational CostsContracted-outservice costs aspercentage ofoperational costsContinuity ofServiceCustomers withdiscontinuoussupplyAverage Revenue
Operating CostCoverageDebt Service RatioTotal revenues perservice pop/GNI
Population with access to water services (either with direct service connectionor within reach of a public water point) as a percentage of the total populationunder utility's nominal responsibilityTotal annual water supplied to the distribution system (including purchasedwater, if any) expressed byPopulation served per day andConnection per month.Total annual water sold expressed by population served by
Population served per dayConnection per monthShows the average water consumption per person per day by customercategoryDifference between water supplied and water sold (i.e. volume of water"lost") expressed as a percentage of net water suppliedVolume of water "lost" per water connection per dayTotal number of connections with operating meter/ total number ofconnections, expressed in percentageVolume of water sold that is metered/ Total volume of water sold, expressedin percentageTotal number of pipe breaks per year expressed per km of the waterdistribution networkTotal annual operational expenses/Total annual volume sold.
Total number of staff expressed as per thousand connections
Total annual labor costs (including benefits) expressed as a percentage oftotal annual operational costsTotal cost of services contracted-out to the private sector expressed as apercentage of total annual operational costs
Average hours of service per day for water supply
The percentage of customers with a water supply that is discontinuous duringnormal operation
Total annual W&WW operating revenues expressed by annual
Total annual operational revenues/Total annual operating costs
Cash income / Debt service * 100Total annual operating revenues per population served/National GNI percapita; expressed in percentage
%
liters/person/ day
M3/conn/month
Liters/person/ day
M3/conn/month
liters/person/day%
m3/conn/day%
%
breaks/km/yr
US$/m3 sold
#^000 conn
%
Hrs/day
% of # required
US$/m3 watersoldRatio
%% GNI per capita
Source: The International Benchmarking Network for Water and Sanitation toolkits
This system of indicators is to measure the overall performance of water utilities. Sincethis study focus on the efficient issues, it will room in to have a close look at thefinancial rations and cost classifications.
57
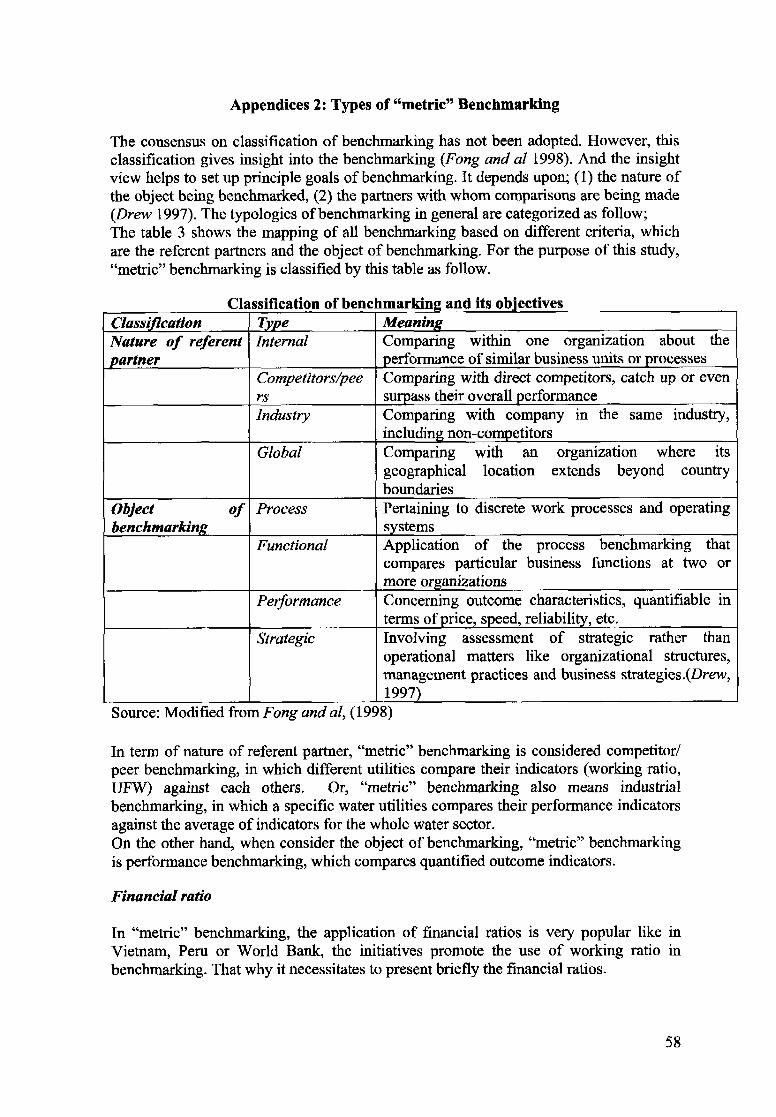
Appendices 2: Types of "metric" Benchmarking
The consensus on classification of benchmarking has not been adopted. However, thisclassification gives insight into the benchmarking (Fong and al 1998). And the insightview helps to set up principle goals of benchmarking. It depends upon; (1) the nature ofthe object being benchmarked, (2) the partners with whom comparisons are being made(Drew 1997). The typologies of benchmarking in general are categorized as follow;The table 3 shows the mapping of all benchmarking based on different criteria, whichare the referent partners and the object of benchmarking. For the purpose of this study,"metric" benchmarking is classified by this table as follow.
Classification of benchmarking and its objectivesClassificationNature of referentpartner
Object ofbenchmarking
TypeInternal
Competitors/peersIndustry
Global
Process
Functional
Performance
Strategic
MeaningComparing within one organization about theperformance of similar business units or processesComparing with direct competitors, catch up or evensurpass their overall performanceComparing with company in the same industry,including non-competitorsComparing with an organization where itsgeographical location extends beyond countryboundariesPertaining to discrete work processes and operatingsystemsApplication of the process benchmarking thatcompares particular business functions at two ormore organizationsConcerning outcome characteristics, quantifiable interms of price, speed, reliability, etc.Involving assessment of strategic rather thanoperational matters like organizational structures,management practices and business strategies.(Drew,1997)
Source: Modified fromFowg andal, (1998)
In term of nature of referent partner, "metric" benchmarking is considered competitor/peer benchmarking, in which different utilities compare their indicators (working ratio,UFW) against each others. Or, "metric" benchmarking also means industrialbenchmarking, in which a specific water utilities compares their performance indicatorsagainst the average of indicators for the whole water sector.On the other hand, when consider the object of benchmarking, "metric" benchmarkingis performance benchmarking, which compares quantified outcome indicators.
Financial ratio
In "metric" benchmarking, the application of financial ratios is very popular like inVietnam, Peru or World Bank, the initiatives promote the use of working ratio inbenchmarking. That why it necessitates to present briefly the financial ratios.
58
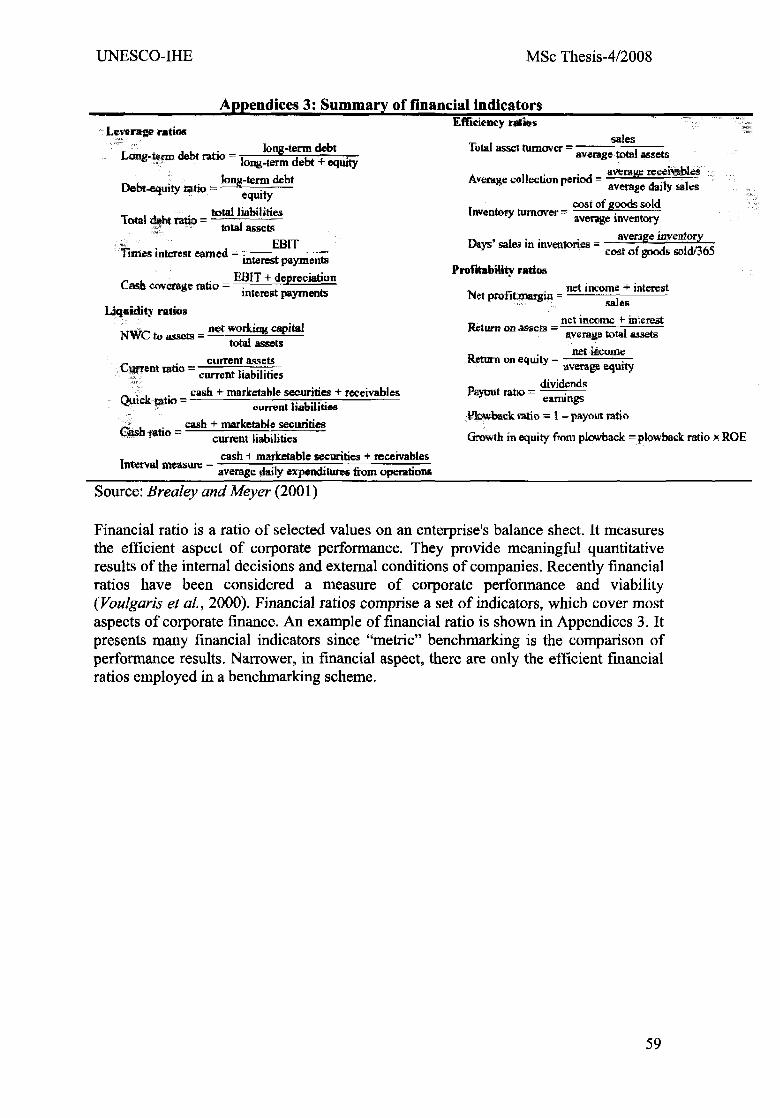
UNESCO-IHE MSc Thesis-4/2008
Appendices 3: Summary of financial indicators
Leverage ratioslong-term debt;f + cqllUy
Efficiency ratios
Total asset turnover =safes
Debt-equity *»fc
Total debt ratio =
long-term debt"""" equitytotal liabilities
total assets
Average collection period =
average total assetsaverage receivablesaverage daily sales
Inventory turnover =cost of goods soldaverage inventory
Times interest earned = ~EBIT
Cash coverage ratio =
interest paymentsEBIT + depreciation
interest payments
_ , , , . . average inventoryDays sales in inventories— : 7"———-f—;J cost of goods sold/365
Liquidity ratios
UVifC to assets =
Current ratio =
net working capitaltotal assets
current assets
Profitability ratio*
Net profit margin =
Return on assets =
Return on equity =
net income + interestsales
net income + interestaverage total assets
net
Quick ratio =
current liabilities
cash + marketable securities + receivables
ratio = •
current liabilities
cash + marketable securities
Interval measure =
current liabilities
cash + marketable securities + receivables
average equitydividendsearnings
i = l - payout ratio
Growth in equity from plowback = plowback ratio X ROE
average daily expenditures from operations
Source: Brealey and Meyer (2001)
Financial ratio is a ratio of selected values on an enterprise's balance sheet. It measuresthe efficient aspect of corporate performance. They provide meaningful quantitativeresults of the internal decisions and external conditions of companies. Recently financialratios have been considered a measure of corporate performance and viability(VouJgaris et al, 2000). Financial ratios comprise a set of indicators, which cover mostaspects of corporate finance. An example of financial ratio is shown in Appendices 3. Itpresents many financial indicators since "metric" benchmarking is the comparison ofperformance results. Narrower, in financial aspect, there are only the efficient financialratios employed in a benchmarking scheme.
59