Embed Size (px)
Citation preview

UNEP/IPES 28-29 January 2008
International Payments for Ecosystem Services (IPES) Publication Review Meeting
UNEP, Geneva, 28-29 January 2008
Workshop on ecosystem accounting
An introduction to ecosystem accounting
Jean-Louis WeberEuropean Environment [email protected]

UNEP/IPES 28-29 January 2008
SEEA2003: expansion of the System of National Accounts (UN SNA1993) in order to include more environmental aspects
Natural resources EcosystemsEconomic
assets (SNA)Non-economic
assets
Openingstocks
Openingstocks
OpeningState
SNAtransactions
and otherflows
Changes instocks
Changesin stocks
Economicactivities,
naturalprocesses,
etc.
Changesin state
Closingstocks
Closingstocks
Closingstate
Described in SNA
RM HASSAN - UN The System of Environmental and Economic Accounting (UN 2003) - RANESA Workshop June 12-16, 2005 Maputo

UNEP/IPES 28-29 January 2008
Ecosystem approach to SEEA
• SEEA2003 revision by 2010• EEA-UNSD international workshop on land & ecosystem
accounting, Nov. 2006• EEA proposal to UNCEEA and London Group for
developing the ecosystem dimension into the SEEA Clarification paper (LG, Rome, Dec. 2007) Drafting of a specific handbook (first draft LG Brussels, Sept.
2008)
Additional SEEA module + definition of new aggregates “beyond GDP”

UNEP/IPES 28-29 January 2008
The questions behind: Ecological truth & market prices in the SNA (1)
• Risks of unsustainable use of the living natural capital are ignored: – The negative impacts of over-harvesting, force-feeding with
fertilisers or Nitrogen depositions, intoxication with pesticides or pollution, introduction of species, fragmentation by roads, or soil sealing by urban development have no direct monetary counterpart.
– This is the case for private capital and even more for public goods (The tragedy of the Commons).
• The natural capital is not even amortised in the national accounts and in accounting books of companies :– No allowance is made for maintaining ecosystems’ critical
functions and services. – The full cost of domestic products is not covered in many cases
by their price. We don't pay for the full price of our consumption.

UNEP/IPES 28-29 January 2008
Ecological truth & market prices in the SNA (2)
• The price of imported products does not reflect the full costs of ecosystems degradation in originating countries. – Delocalisation of industrial production is de facto recorded as a
“green” performance in importing countries when in many cases it increases the degradation of the global ecosystem (e.g. CO
2
emissions higher because of old technologies, loss of biodiversity because ecosystems are less protected).
• The actual value for people of free ecosystem services is not accounted (the market tells: price is zero). – Increase of wellbeing resulting from economic growth is not
balanced with losses of free services (commercialisation of previously free services, depletion, ecosystem degradation...).

UNEP/IPES 28-29 January 2008
Current situation with SEEA2003
• SEEA2003 fully integrated with SNA but – relations to nature are scattered between chapters and unevenly
developed. • Ecosystems assets are indeed part of SEEA 2003 structure: forest,
water, land and ecosystem accounts, soil (p.m.), fisheries but – few links exist between these assets, considered more as a
collection of inventories than interacting systems.
– “ecosystem service” is not a well identified concept
• Flows between the economic system and the ecosystems are asymmetric, balancing the economic system (backed up by SNA) with a mere interface (“environment” column, “ecosystem inputs”)– No place for feedbacks
• Unclear measurement of the value of nature
Develop the ecosystem approach into the SEEA

UNEP/IPES 28-29 January 2008
Developing the ecosystem approach into the SEEAImproving integration
• Recognize first the interaction of 2 co-evolving systems
• Clarify the concept of natural capital by separating non-renewable resources (where the rent and its reinvestment is the interest) from renewable resource (for which the conservation of critical level of stocks in good functioning state is main issue).
• Full integration vs. dual integration
• Renew approach of valuation with clear distinction of values, costs and their role in decision processes

UNEP/IPES 28-29 January 2008
Logic underlying the Millennium Ecosystem Assessment…
Biophysical structure or
process(e.g. woodland habitat or net
primary productivity )
Service(e.g. flood
protection, or harvestable products)
Service(e.g. flood
protection, or harvestable products)
Function(e.g. slow
passage of water, or biomass)
Function(e.g. slow
passage of water, or biomass) Benefit
(e.g. willingness to pay for woodland protection or for
more woodland, or harvestable products)
Benefit(e.g. willingness to pay for woodland protection or for
more woodland, or harvestable products)
Σ Pressures
Limit pressures via policy action?
Maintenance, restoration
Minimum levels of service
(service limits)
Courtesy Roy Haines-Young
UNEP/IPES 28-29 January 2008
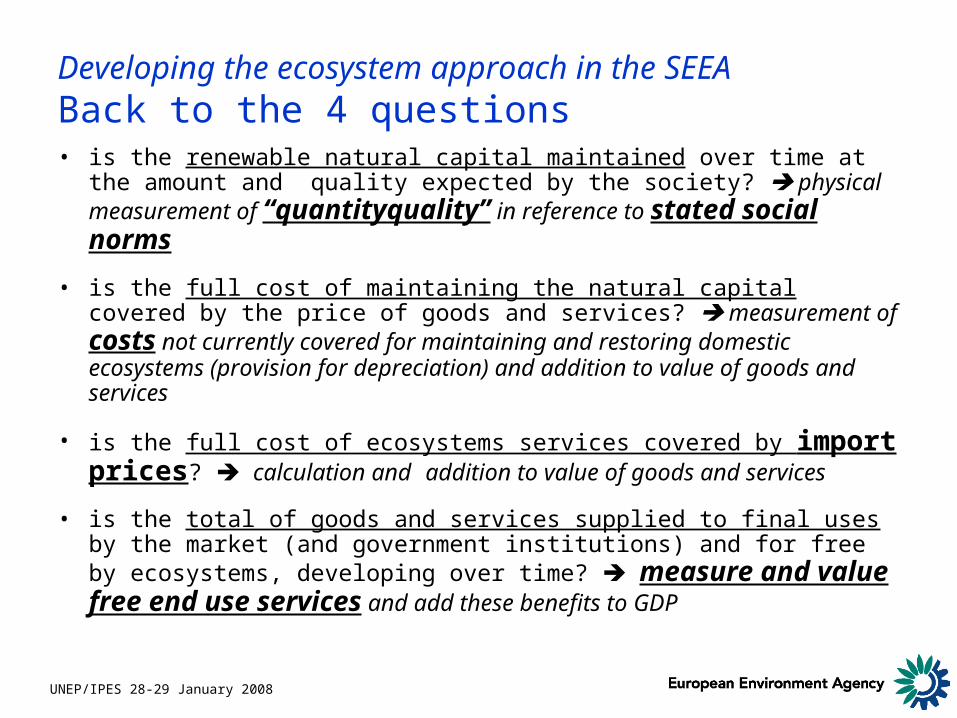
Developing the ecosystem approach in the SEEABack to the 4 questions• is the renewable natural capital maintained over time at the amount
and quality expected by the society? physical measurement of “quantityquality” in reference to stated social norms
• is the full cost of maintaining the natural capital covered by the price of goods and services? measurement of costs not currently covered for maintaining and restoring domestic ecosystems (provision for depreciation) and addition to value of goods and services
• is the full cost of ecosystems services covered by import prices? calculation and addition to value of goods and services
• is the total of goods and services supplied to final uses by the market (and government institutions) and for free by ecosystems, developing over time? measure and value free end use services and add these benefits to GDP

UNEP/IPES 28-29 January 2008
Accounting for full ecosystem benefits & costs
€(A) Final Use of Non-Market Ecosystem
Services
€(C) Full ecosystem cost of imports
€(B) Additional costs
necessary to maintain & restore ecosystems up
to policy objectives
Ignored BenefitsIgnored Costs
€GDP
Ecosystem Services
Ecosystem Assets (Stocks, flows, resilience)

UNEP/IPES 28-29 January 2008
Beyond the GDP with ecosystem accounting (1)
Stepwise approach to inclusive wealth calculation:• Includes socio-economic features but with an ecosystem focus
(human and social capital just partly addressed)
• Costs and benefits recorded separately
Natural capital accounts in physical units:• Stocks, flows, resilience, services
• Ecosystem state benchmarked against stated policy targets
Net Landscape Ecological Potential, HANPP, E. Footprint

UNEP/IPES 28-29 January 2008
From Land cover to ecosystem at macro scale:Net Landscape Ecological Potential 2000, 1 km² grid
Source: EEA/ETCLUSI from GBLI, NATURILIS and MEFF
Methodology: EEA/ETCLUSI
Legend
Net LEP 2000
Value
High : 159
Low : 0
NLEP =(Vegetation+Nature Value)----------------------------------
Fragmentation

UNEP/IPES 28-29 January 2008
Net Landscape Ecological Potential 2000, aggregated by regions
Source: EEA/ETCLUSI from GBLI/CLC, NATURILIS and MEFF
Methodology: EEA/ETCLUSI
Legend
Net LEP_NUTS2-3
NLEP2000
18 - 32
33 - 46
47 - 59
60 - 73
74 - 87
88 - 101
102 - 115
116 - 129
130 - 143
144 - 157

UNEP/IPES 28-29 January 2008
Change 1990-2000 in Net Landscape Ecological Potential (NLEP), 1 km² grid
Legend
Change Net LEP 1990 to 2000
Value
High : 118.464
Low : -84.664
Source: EEA/ETCLUSI from GBLI, NATURILIS and MEFF
Methodology: EEA/ETCLUSI

UNEP/IPES 28-29 January 2008
Beyond the GDP with ecosystem accounting (2)
Computation of additional ecosystems maintenance & restoration costs for meeting policy targets• Domestic ecosystems: allowance for depreciation, to be covered
in the next period; virtual domestic debt
• + Ecosystems in countries from which Ecosystem Services originate: hidden costs in imports; virtual foreign debt
Full Cost of Goods & Services
Valuation and integration of non-market end use ecosystem services with GDP
Inclusive Domestic Product

UNEP/IPES 28-29 January 2008
GDP + Final Use of Ecosystem Services = IDP
Final ServicesFinal ServicesIDPIDP
Inclusive Domestic Product
Accounting for environmental benefits & costs
Benefits: the Demand sideBenefits: the Demand side
Cost
s: t
he S
up
ply
sid
eC
ost
s: t
he S
up
ply
sid
e
+
(Intermediate consumption)
+
Additional maintenance cost of the resource
+
Costs of restoration from ecosystem degradation
+
Full ecosystem cost of imports
FCGSFCGS
Full Cost of Goods & Services
Ecosystem Services
Stocks & flows (quantities)
Resilience/Health (qualities)
Ecosystem Services
Stocks & flows (quantities)
Resilience/Health (qualities)
Ecosystem AssetsEcosystem Assets
€ €
CostsCosts€

UNEP/IPES 28-29 January 2008
Ecosystem Assets[stocks and resilience]
Subsoil Assets[stocks]
Environmental Expenditures, Taxes
Additional Ecosystem
Maintenance Costs
Material & Energy Flows
NAMEA
Ecosystem
Services
Natural capital / assets
SNA flows & assets
Additional Ecosystem
Costsin Imports
(less in Exports)
Ecosyste
m
Services
Ecosystem Assets
[stocks and resilience]
Rest of the World
SEEA Integrating Ecosystems Physical flows
Monetary flows/valuation
Assets valuation
Subsoil Assets[stocks]

UNEP/IPES 28-29 January 2008
CORE LAND COVER ACCOUNT
ECOSYSTEM ACCOUNTS
Spatially integrated ecosystem accounts
Soil
Flora & Fauna
Water system
Atmosphere/ Climate
Land use economic & social
functions
Intensity of use & full maintenance
costs
Ecosystem services
Ecosystemassets
Stocks
Material & energy flows
Resilience
Production & Consumption
Economic Assets
Population
Infrastructures & Technologies
Inclusive use of market & non
market ecosystem services

UNEP/IPES 28-29 January 2008
Natural capital• Natural capital stocks, resilience & wealth, distance to objective (physical units, by sectors)• Natural capital consumption/maintenance costs (€)• Ecosystem assets inclusive wealth (€)
Supply & use of ecosystem goods and services(Use of resource by sectors, supply to consumption & residuals, accumulation, I-O analysis, NAMEA)
Ecosystem Services• Marketed Ecosystem Services (€)• Non-market end use ES (physical units, €)
Framework of Ecosystem Accounts
Natural Capital Accounts/ living & cycling natural capital
Accounts of flows of ecosystem goods and services
Ecosystem Stocks & State Accounts
Eco
syst
em t
ypes
Economic sectorsSpatial integration
Economic integration
Counts of stocks diversity / integrity
(by ecosystem types, focus on state, health, resilience,
stress)
Core accounts of assets & flows
(by ecosystem types, raw quantities)
Material/energy flows(biomass, water, nutrients, residuals)
€
€€
€

UNEP/IPES 28-29 January 2008
Stocks & flows• Spatial systems:
– Land cover (units, zones, landscape types)
– Rivers, river reaches, catchments– Coastal systems– Soil
• Biomass (NPP/NEP), Carbon• Nutrients (N,P…)• Water• Species • Other…
Basic ecosystem stock
flows accounts
Basic ecosystem stock
flows accounts

UNEP/IPES 28-29 January 2008
Data infrastructure of land cover accounts
Smallest mapping unit for stock 25ha
Change mapped at 5ha
Smallest mapping unit for stock 25ha
Change mapped at 5ha

UNEP/IPES 28-29 January 2008
LEAC/Land cover accounts’ basic framing

UNEP/IPES 28-29 January 2008
LEAC: from changes to flows of land cover
LCF3
LCF1
LCF2
LCF5
LCF4
LCF7
LCF6
LCF8
Change Matrix(44x43=1932
possible changes)summarized into
flows
LCF9
199
0
2000

UNEP/IPES 28-29 January 2008
Ecosystem health: counts of health/resilience
Ecosystem Distress Syndrome model: 5 types of symptoms– Vigor: e.g. disruptions of nutrients cycling, population
dynamics (loss or excess)
– Organisation, degradation of substrates: e.g. fragmentation, water stress, change in food chain
– Resilience: e.g. change in species composition (invasive…), intoxication
– Dependence of systems from artificial input: e.g energy, water, subsidies
– Capacity of supporting healthy communities: wildlife, human
Source: David J. Rapport

UNEP/IPES 28-29 January 2008
Land Use Functions & Ecosystem Services
LUF analysis and mapping address cross-cutting issues e.g.: Urban/Rural,
Agro/Environment detect & measure ES services = ecosystem
functions which benefit to people, somewhere

UNEP/IPES 28-29 January 2008
Supply of commodities
Stocks & flows, Integrity, BiodiversityFunctional Landscape
RegulatingClimate, floods, soil formation,
carbon sequestration, air quality, water quality, pest and diseases
control, pollination, invasion resistance, habitat provisioning
SupportingPrimary production
Water cycleBiogeochemical cycles
ProvisioningFood, water, fibre, wood, fuel,
medicines
CulturalAesthetics, tourism, spiritual, education, research, traditional
knowledge
Non nature-based sources of goods
and services
Insurance value Market & nonmarket values
Main
ten
an
ce / re
stora
tion o
f natu
ral ca
pita
l
Mostly negative
feedbacks
Adapted from Scholes, 2007, Lomas, 2007
Use of commodities& non-produced services
Ecosystem and servicesEcosystems, functions and services

UNEP/IPES 28-29 January 2008
Internal habitat
functionsLand use
functionsEcosystem
Services Market input
Final use of non
market ES
Provisioning x x x
Cultural x x x x
Regulating x x x x x
Support x
Ecosystem functioning
x
Capital stocks and functions
ServicesNomenclature of ES Market values
Physical measurement and shadow
prices
Ecosystems services

UNEP/IPES 28-29 January 2008
Exemple: ES nomenclature used for wetland accounts – 1st draft
Service-type Category Service
Strong, short term
Medium/ long
term Weak Yes Partly No 1 Provisioning 1.1 Food 1.1.1 Hunting prays x x
1.1.2 Gathering/ picking up goods x x1.1.3 Fishing x x1.1.4 Seafood x x1.1.5 Livestock x x1.1.6 Agriculture x x1.1.7 Aquiculture x x…
1.2 Materials 1.2.1 Fresh water x x1.2.2 Salt works x x1.2.3 Construction materials ("Arids") x x1.2.4 Fiber crops x x1.2.5 Tree plantations x x…
1.3 Forest trees-related 1.3.1 Timber x x1.3.2 Fuel / wood x x1.3.3 Cork x x1.3.4 Pines x x…
1.4 Plant-related 1.4.1 Genetic resources x x1.4.2 Medicinal & cosmetic plants x x…
1.5 Physical support 1.5.1 Communication x x1.5.2 Housing x x…
2 Cultural 2.1 Amenity 2.1.1 Recreation / relax x x2.1.2 Ecotourism x x2.1.3 Landscape beauty x x…
2.2 Identity 2.2.1 Sense of place x x2.2.2 Cultural heritage x x2.2.3 Religious / spiritual x x…
2.3 Didactic 2.3.1 Education / interpretation x x2.3.2 Scientific research x x2.3.3 Traditional Ecological Knowledge x x…
3 Regulating 3.1 Cycling 3.1.1 Soil retention & Erosion control x x3.1.2 Hydrological regulation x x3.1.3 Saline equilibrium x x3.1.4 Pollination for useful plants x x3.1.5 Climate regulation x x…
3.2 Sink 3.2.1 Soil purification x x3.2.2 Waste treatment x x3.2.3 Water purification x x…
3.3 Prevention 3.3.1 Flood buffering x x3.3.2 Pest prevention x x3.3.3 Invasive species prevention x x3.3.4 Air quality x x…
3.4 Refugium 3.4.1 Habitat maintenance x x…
3.5 Breeding 3.5.1 Food web maintenance x x3.5.2 Nursery x x…
Source: Berta Martin, Pedro Lomas et alii, Autonomous University of Madrid, 2007
Biodiversity dependence
Accounted for in the marketWetlands social-ecological systems

UNEP/IPES 28-29 January 2008
Challenges for implementation
• Classification and measurement • Geographical scales
The issue is to play with heterogeneous datasets:• Exhaustive but rather contents-poor geographic datasets,
frequently updated by satellite images• Exhaustive, contents-rich but rather poorly geographically
detailed socio-economic statistics• Scattered in situ monitoring of the physical world• Detailed analysis and modelling of the socio-ecosystems and
valuation of ecosystem services available as case studies
• Time scales• Time series• Nowcasting• Infra-annual accounts when relevant• Ecological “surprises”

UNEP/IPES 28-29 January 2008
ES: several valuation issues
• Services entangled in marketed goods and services:– Under pricing because of externalisation of environmental costs– Under pricing because of low internalisation of environmental benefits– Under pricing because of rent appropriation by buyers (in particular in
imports)
• Free end use ES:– Physical measurement from social statistics– Prices for individual use– Prices for collective use (in particular regulating ES)– Limit to what is not in price/value of commodities (full property right
criteria)
• Additional maintenance & restoration costs of ecosystems– Integrated measurement of quantity & quality of ecosystems– Costs in imports (e.g. when products are re-exported)

UNEP/IPES 28-29 January 2008
Not only issues, achievements
The first phase of GAISP comprises the publication of the following eightMonographs:1 The Value of Timber, Carbon, Fuelwood, and Non-Timber Forest Produce in India’s Forests2 Estimating the Value of Agricultural Cropland and Pasture Land in India3 The Value of India’s Sub-Soil Assets4 Eco-tourism and Biodiversity Values in India5 Estimating the Value of Educational Capital Formation in India6 Investments in Health and Pollution Control and their Value to India7 Accounting for the Ecological Services of Indian Forests: Soil Conservation, Water Augmentation, and Flood Prevention8 Estimating the Value of Freshwater Resources in India
In this monograph, three ecological services of forest ecosystems, namely, prevention of soil erosion, augmentation of groundwater, and reduction of flood damage have been considered.

UNEP/IPES 28-29 January 2008
Perspectives for ecosystem accounting
• Correlated regional projects like Eureca!2012 the ecosystem assessment for Europe (now regional project of the forthcoming MA2 (2015) launched by UNEP)
• “Beyond GDP” developments• Assessment of benefits provided by biodiversity
demanded by the G8+5 in Potsdam, March 2007 as an input to the Convention on Biological Diversity (CBD) – cases studies on wetlands (EEA) and forest (IUCN)
• Ecosystem and carbon accounting, continuation of the “Stern report”
• Possible interest of EA for business (e.g. UNEP Financial Initiative), IPES – can it help?

UNEP/IPES 28-29 January 2008
Work sharing for a fast track implementation/ International level
• UN agencies, WB, IMF, OECD (…?) • MA2 context (e.g. WCMC/UNEP: manual on ES
currently drafted) • GEO/GEOSS (GMES…) (support regional global
monitoring)• International conventions (CBD, IPCC, IGBP, HDP,
Ramsar, Desertification… ) • Regional regulations, agreements, conventions• Key NGOs in the domain (IUCN, WWF, ISEE) • UNEP-IPES, UNEP-FI• London group/subgroup + Eurostat + EEA &
scientific expert panel: issue paper, outline by end 2008

UNEP/IPES 28-29 January 2008
Thanks!

UNEP/IPES 28-29 January 2008