Embed Size (px)
Citation preview

Unemployment
Large Variations in Labor per Person (www.ggdc.net)
Hours per Worker 2001
0 500 1,000 1,500 2,000 2,500 3,000
EU
USA
Japan
Hong Kong
Singapore
South Korea
Taiwan
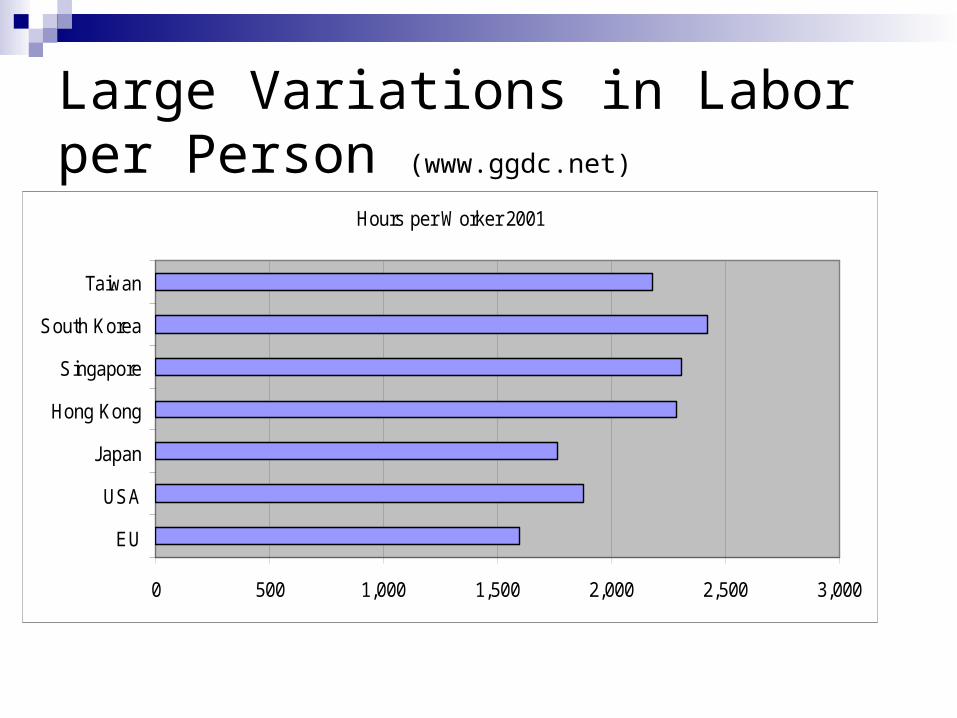
Variation in Labor Force Participaton
Employment as a share of Population
38.00%
40.00%
42.00%
44.00%
46.00%
48.00%
50.00%
52.00%
Europe U.S.A Japan Hong Kong Singapore South Korea Taiwan

Labor Demand given by marginal product of labor
WP
WP
LD
L
= (L) = MPL(L)WP

Labor Supply
Wages affect willingness to work. Substitution effect: Each hour of leisure time costs
more in terms of goods when wages go up. This has the effect of increasing willingness to work.
Income/Wealth effect: Higher wages increase the size of your paycheck. Working hard may be less attractive when your wallet is full.
In theory, the effect of wages on labor supply could run either way. Most empirical findings find that labor supply is a weakly positive function of real wages.
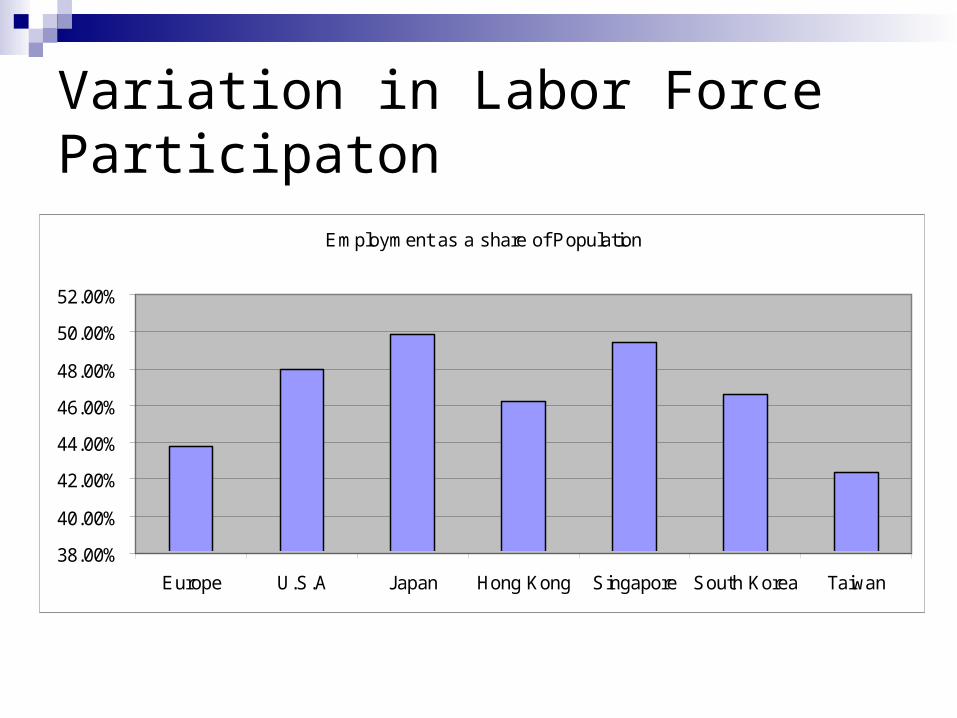
Increasing Hours per Population in East Asia (http://www.ggdc.net)
Hours per Population
0
200
400
600
800
1000
1200
1400
1960
1962
1964
1966
1968
1970
1972
1974
1976
1978
1980
1982
1984
1986
1988
1990
1992
1994
1996
1998
2000
2002
Ho
urs
Hong Kong Singapore S. Korea Taiwan
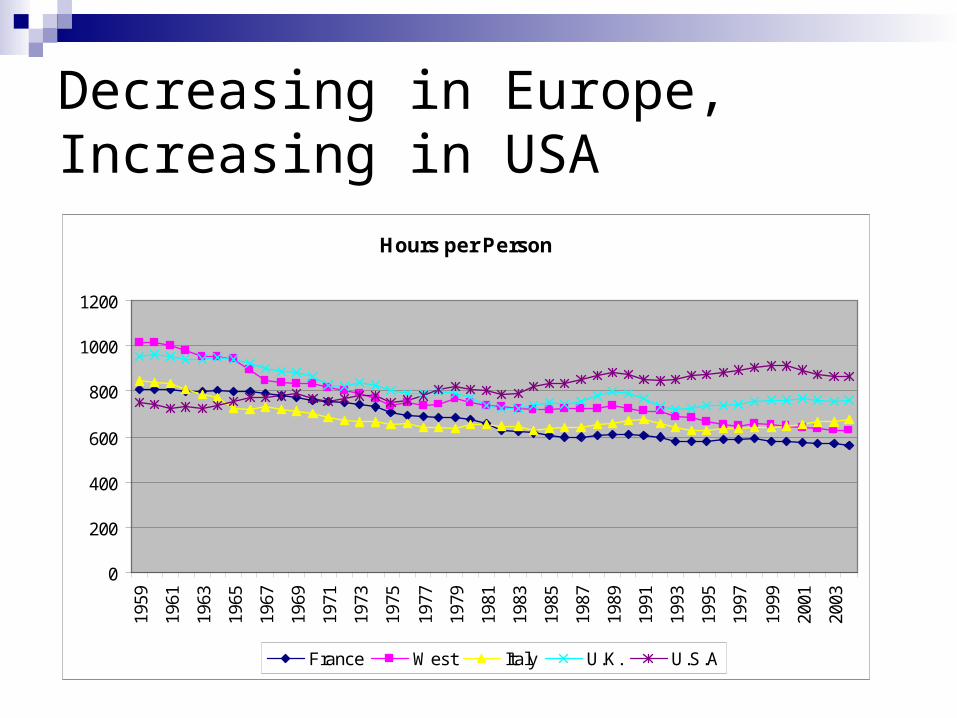
Decreasing in Europe, Increasing in USA
Hours per Person
0
200
400
600
800
1000
1200
1959
1961
1963
1965
1967
1969
1971
1973
1975
1977
1979
1981
1983
1985
1987
1989
1991
1993
1995
1997
1999
2001
2003
France West Italy U.K. U.S.A

Labor Demand given by marginal product of labor
LD
WP
L
w*
L*
LS
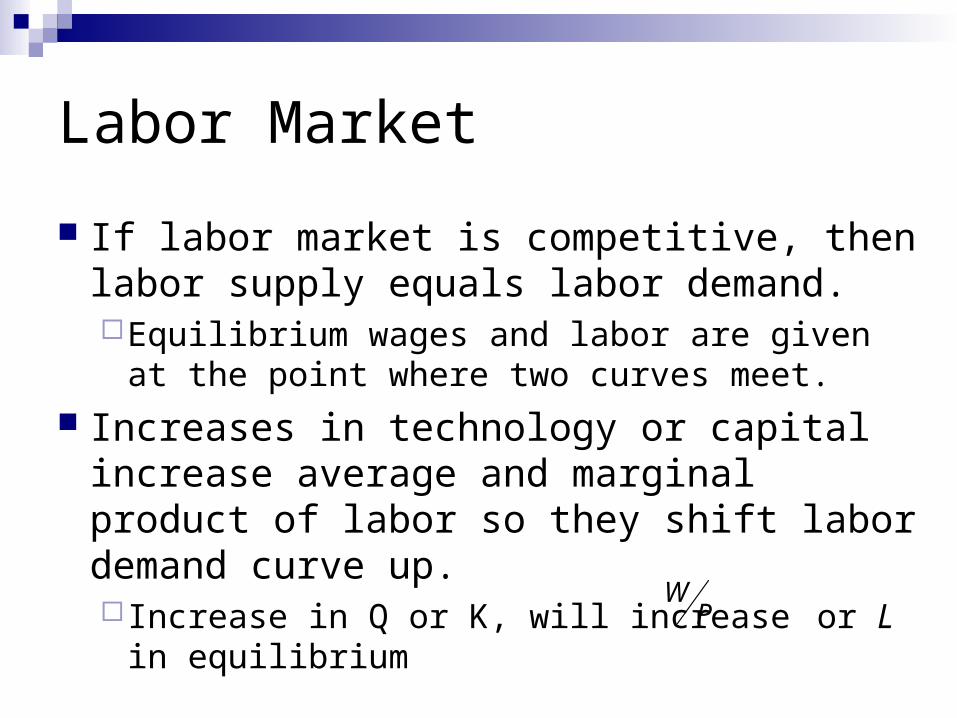
Labor Market
If labor market is competitive, then labor supply equals labor demand.Equilibrium wages and labor are given at the
point where two curves meet. Increases in technology or capital increase
average and marginal product of labor so they shift labor demand curve up. Increase in Q or K, will increase or L in
equilibrium
WP
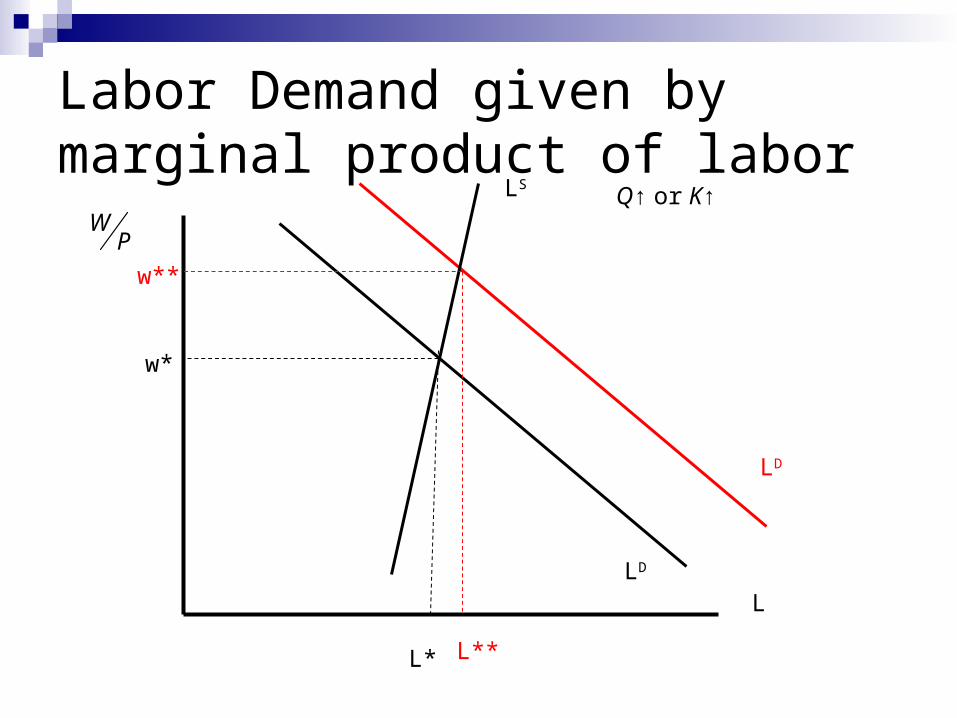
Labor Demand given by marginal product of labor
LD
WP
L
w*
L*
LSQ↑ or K↑
L**
w**
LD
Unemployment
Labor markets are characterized by sellers (workers) who would be willing to work at given wages but are not able to find work.
Unemployment rate is the ratio of unemployed to the labor force.
Unemployment varies across countries.

Differences in Unemployment Rates (http://www.oecd.org)
Standardized Unemployment Rates
0 1 2 3 4 5 6 7 8 9 10
USA
France
Germany
Italy
Japan
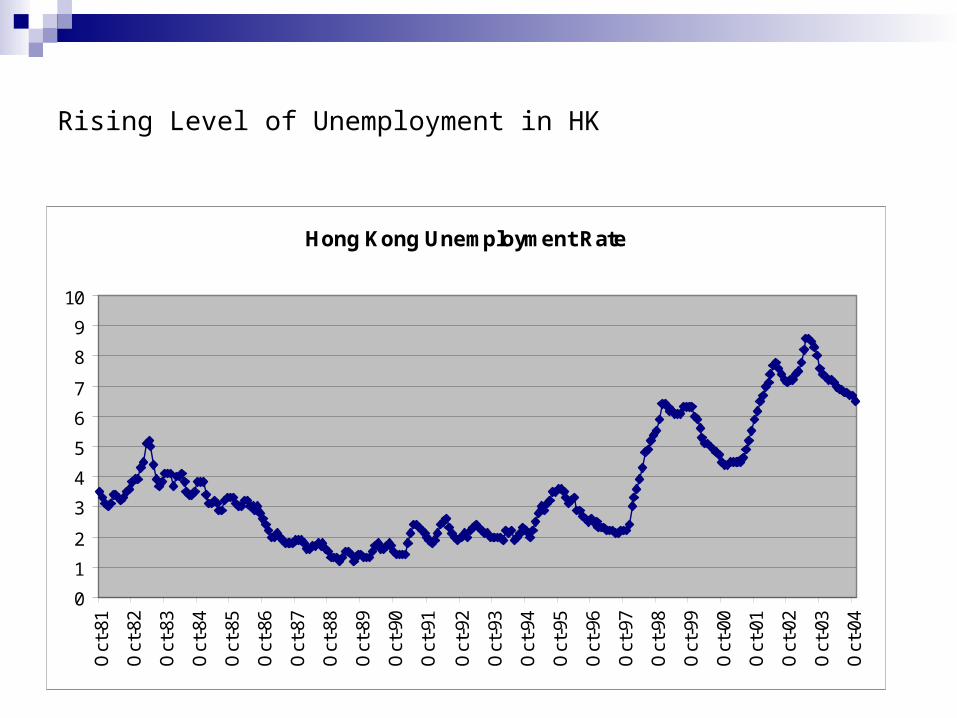
Rising Level of Unemployment in HK
Hong Kong Unemployment Rate
0
1
2
3
4
5
6
7
8
9
10
Oct
-81
Oct
-82
Oct
-83
Oct
-84
Oct
-85
Oct
-86
Oct
-87
Oct
-88
Oct
-89
Oct
-90
Oct
-91
Oct
-92
Oct
-93
Oct
-94
Oct
-95
Oct
-96
Oct
-97
Oct
-98
Oct
-99
Oct
-00
Oct
-01
Oct
-02
Oct
-03
Oct
-04
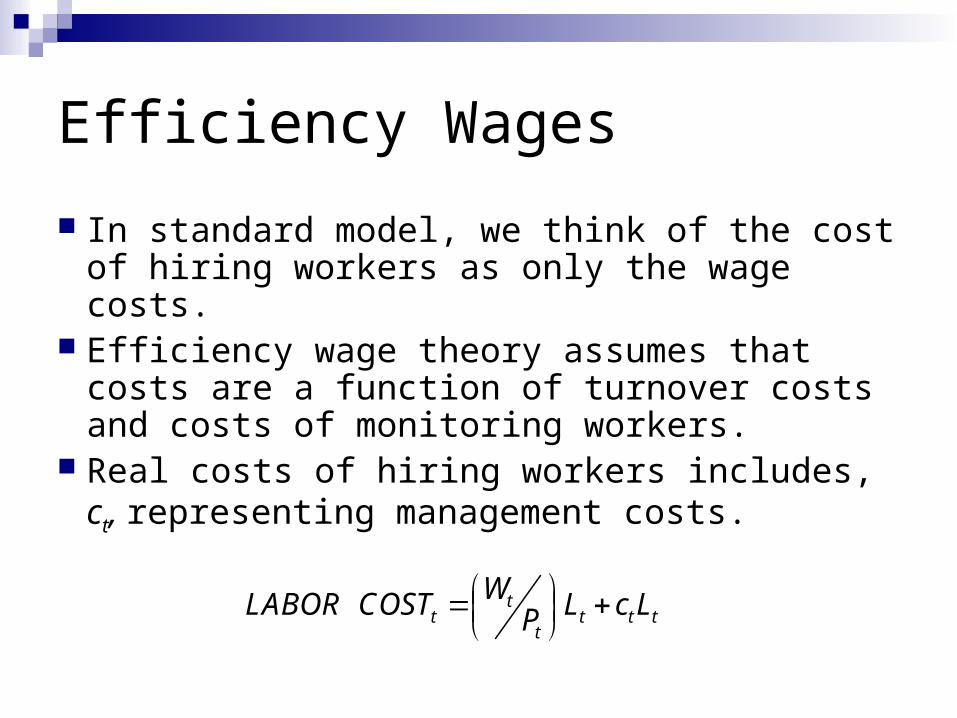
Efficiency Wages
In standard model, we think of the cost of hiring workers as only the wage costs.
Efficiency wage theory assumes that costs are a function of turnover costs and costs of monitoring workers.
Real costs of hiring workers includes, ct, representing management costs.
t
t t t tt
WLABOR COST L c LP
Efficiency Wages
At the wage offered by firms, there is greater labor supply than demand.
Labor market competition does not bid down the wages to clear the market because firms know that if wages fall, their management costs will rise
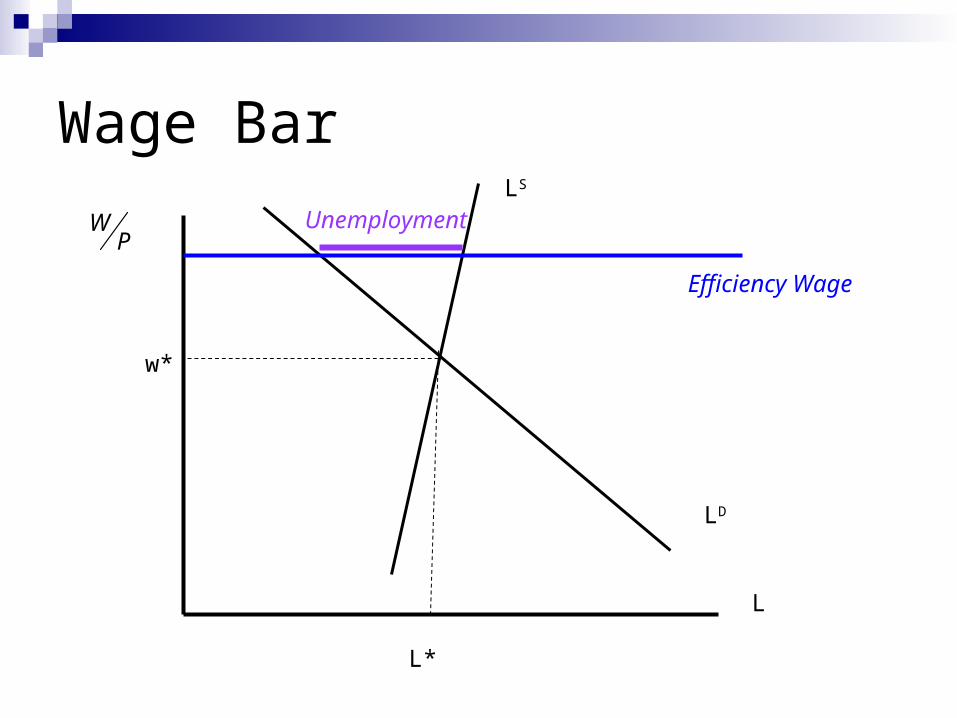
Wage Bar
LD
WP
L
w*
L*
LS
Efficiency Wage
Unemployment
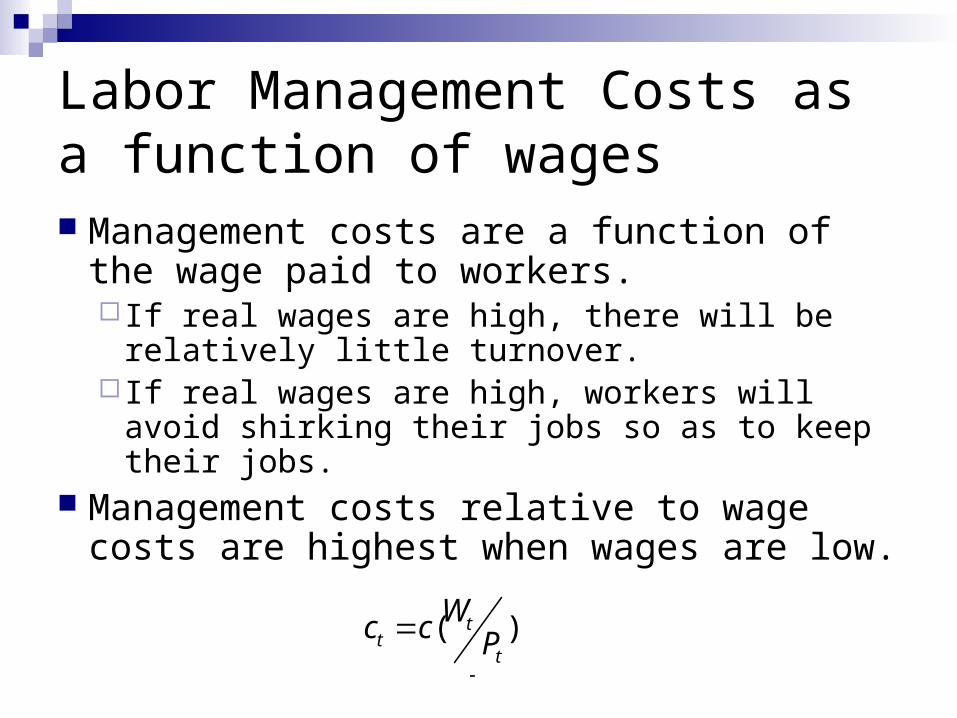
Labor Management Costs as a function of wages Management costs are a function of the
wage paid to workers. If real wages are high, there will be relatively
little turnover. If real wages are high, workers will avoid
shirking their jobs so as to keep their jobs. Management costs relative to wage costs
are highest when wages are low.
( )tt
t
Wc c P
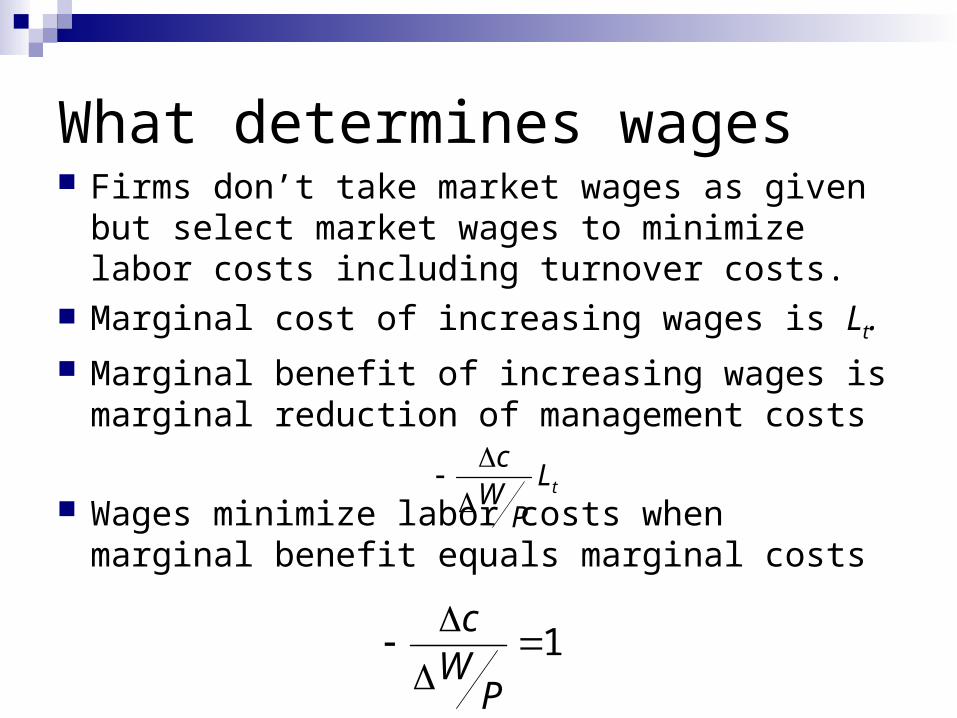
What determines wages Firms don’t take market wages as given but
select market wages to minimize labor costs including turnover costs.
Marginal cost of increasing wages is Lt. Marginal benefit of increasing wages is marginal
reduction of management costs
Wages minimize labor costs when marginal benefit equals marginal costs
t
cL
WP
1cWP
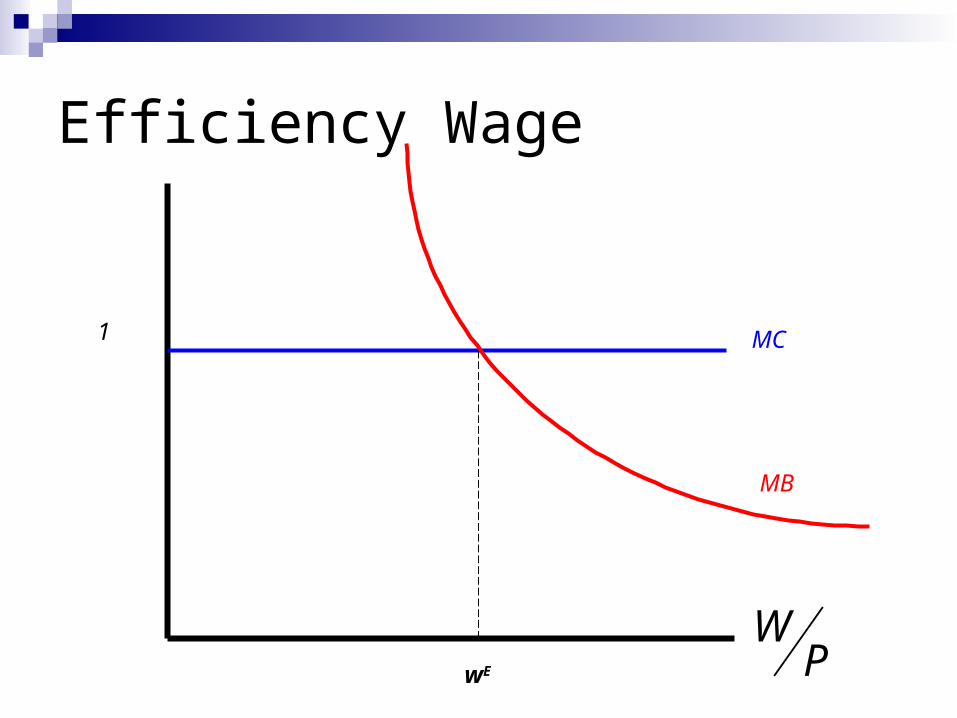
Efficiency Wage
MC1
MB
WPwE
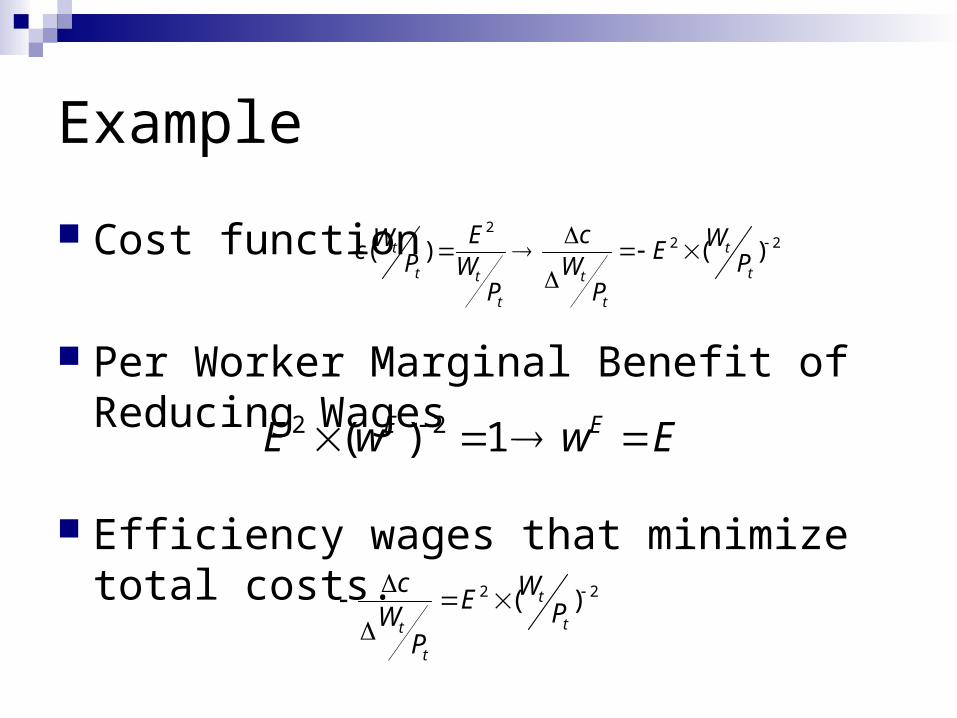
Example
Cost function
Per Worker Marginal Benefit of Reducing Wages
Efficiency wages that minimize total costs.
22 2( ) ( )t t
t tt t
t t
E cW Wc EP PW WP P
2 2( )t
tt
t
c WE PWP
2 2( ) 1E EE w w E
Efficiency Wage
Wages offered by firms are set to minimize the per unit labor costs.
Principal determinant of the wage level are those things, E, which determine how sensitive management costs are to real wages.
Wages are not determined by intersection of labor demand.
What determines the demand for labor?
Once firms decide how much to pay their workforce to minimize labor costs, they decide their demand for workers based on the marginal product of labor.
Marginal cost of hiring workers includes both wages and management costs. Taking wages as given, marginal cost of hiring one more worker is
Marginal benefit of hiring one more worker, MPL. Firm maximizes profits by hiring workers until
( )W WcP P
( )W WMPL cP P

At a given wage w, a firm chooses a labor demand which sets MPL = w +c(w)
WP
MPL
LD
wA
LA
c
c
c(wA) c(wA)
c(wB)wB
LB
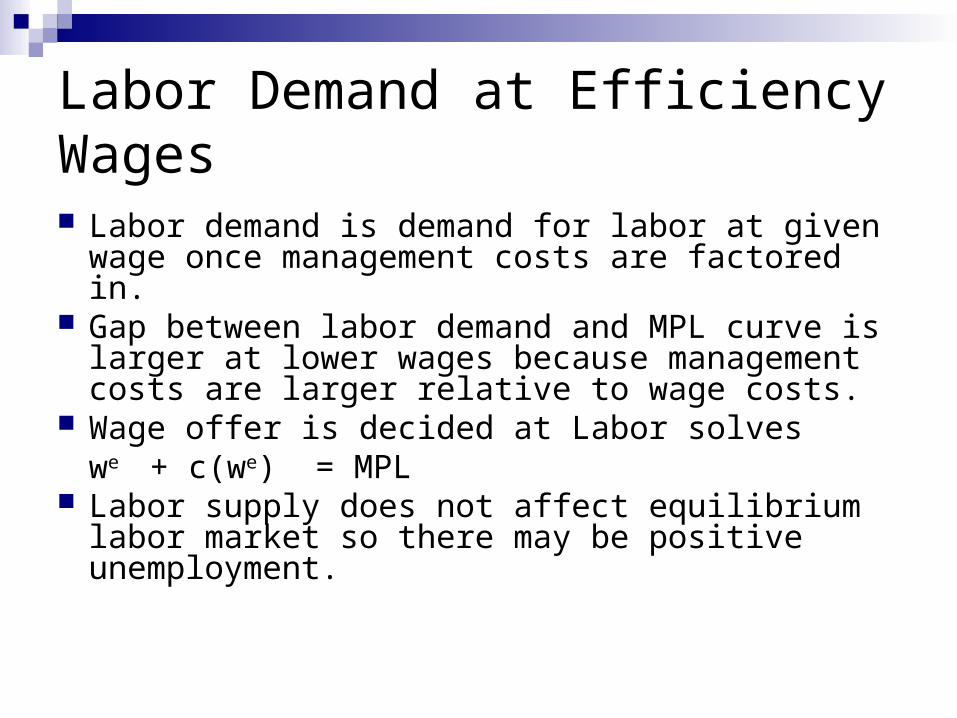
Labor Demand at Efficiency Wages
Labor demand is demand for labor at given wage once management costs are factored in.
Gap between labor demand and MPL curve is larger at lower wages because management costs are larger relative to wage costs.
Wage offer is decided at Labor solves we + c(we) = MPL
Labor supply does not affect equilibrium labor market so there may be positive unemployment.
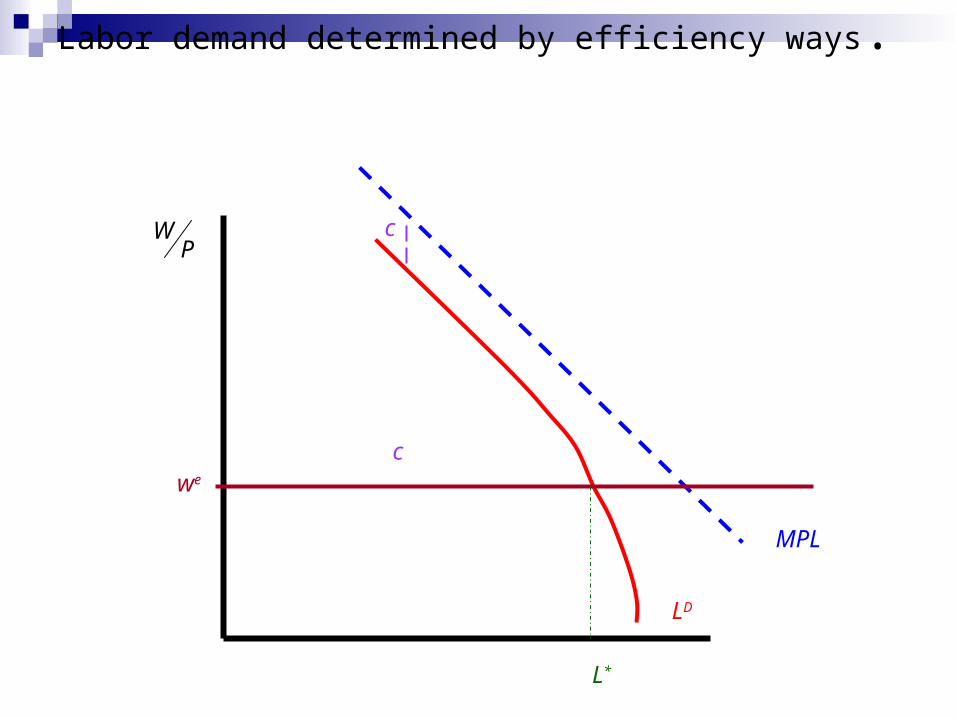
Labor demand determined by efficiency ways.
WP
MPL
LD
we
L*
c
c
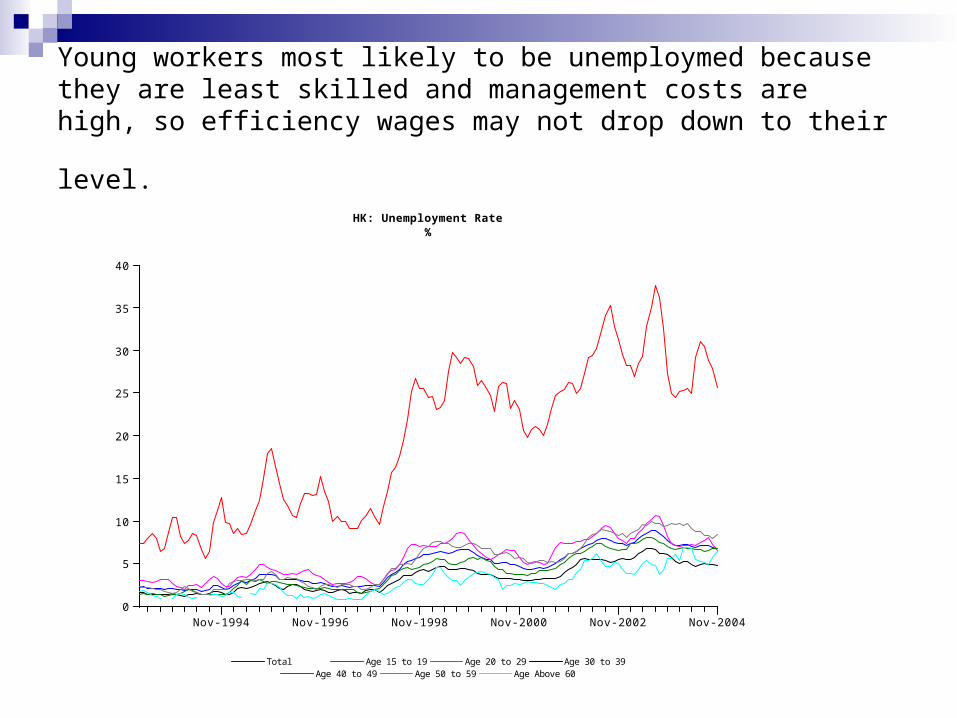
Young workers most likely to be unemploymed because they are least skilled and management costs are high, so efficiency wages may not
drop down to their level.
Nov-1994 Nov-1996 Nov-1998 Nov-2000 Nov-2002 Nov-2004
40
35
30
25
20
15
10
5
0
HK: Unemployment Rate%
Total Age 15 to 19 Age 20 to 29 Age 30 to 39Age 40 to 49 Age 50 to 59 Age Above 60
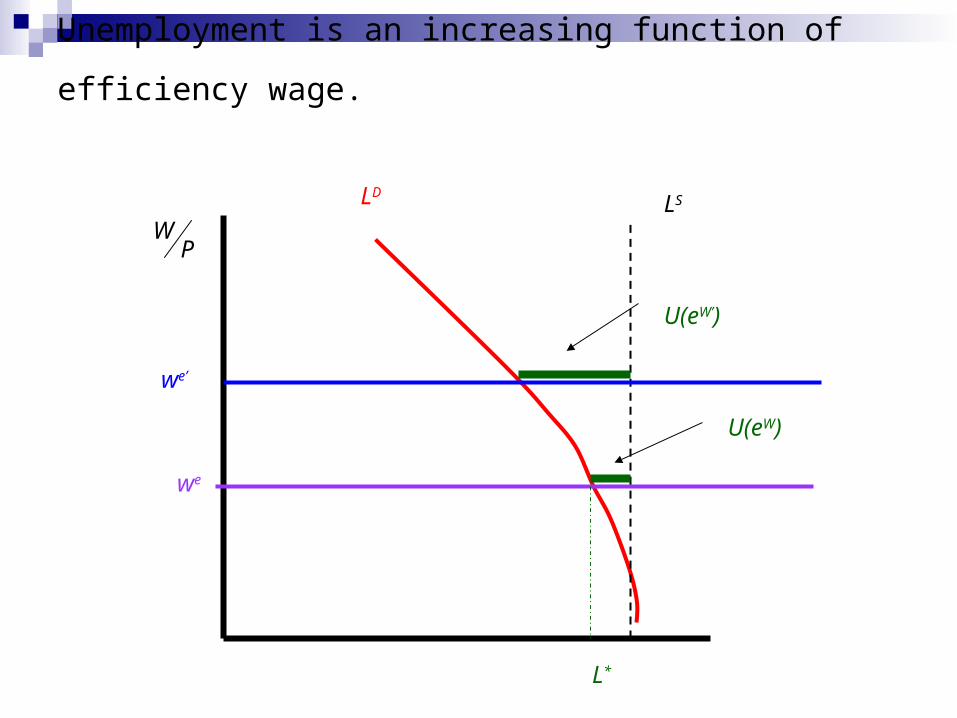
Unemployment is an increasing function of efficiency wage.
WP
LD
we
L*
LS
U(eW)
we’
U(eW’)

Equilibrium Unemployment RateeW
ur
LD

What determines the sensitivity of management costs to wages. Workers are most likely to increase their work
effort when they are afraid of losing their job. This effect will be highest when Unemployment is high.
Efficiency wages are a negative function of the unemployment rate.
Labor market regulations and unions allow firms to fire workers easily.
Social benefits are low relative to workers.
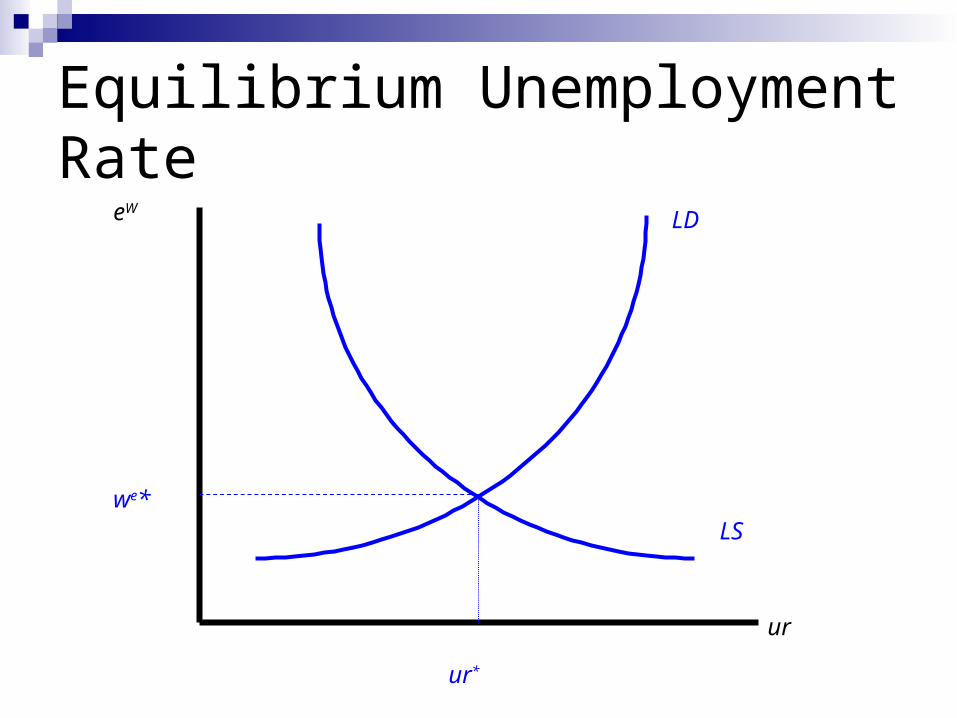
Equilibrium Unemployment RateeW
ur
LD
LSwe*
ur*
Why does unemployment vary across countries. In Europe, labor market regulations make it
difficult for firms to fire workers. This increases management costs and allows workers to demand high wages to avoid shirking.
In Hong Kong, some argue that deflation has pushed up real value of social welfare payments which increases efficiency wage levels.
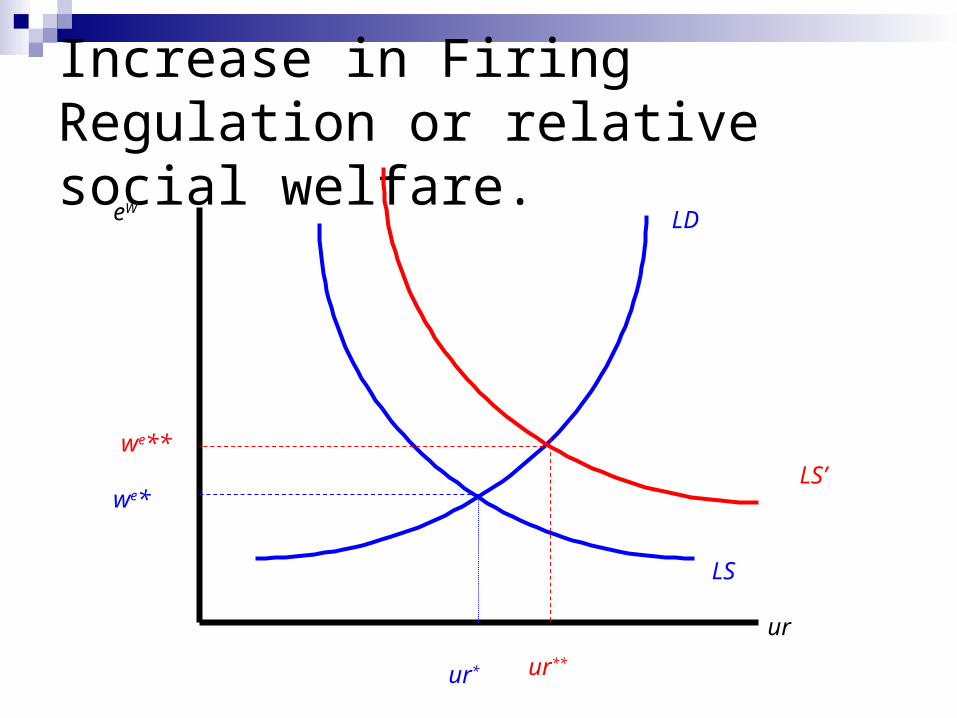
Increase in Firing Regulation or relative social welfare.
eW
ur
LD
LS
we*
ur*
LS’
ur**
we**
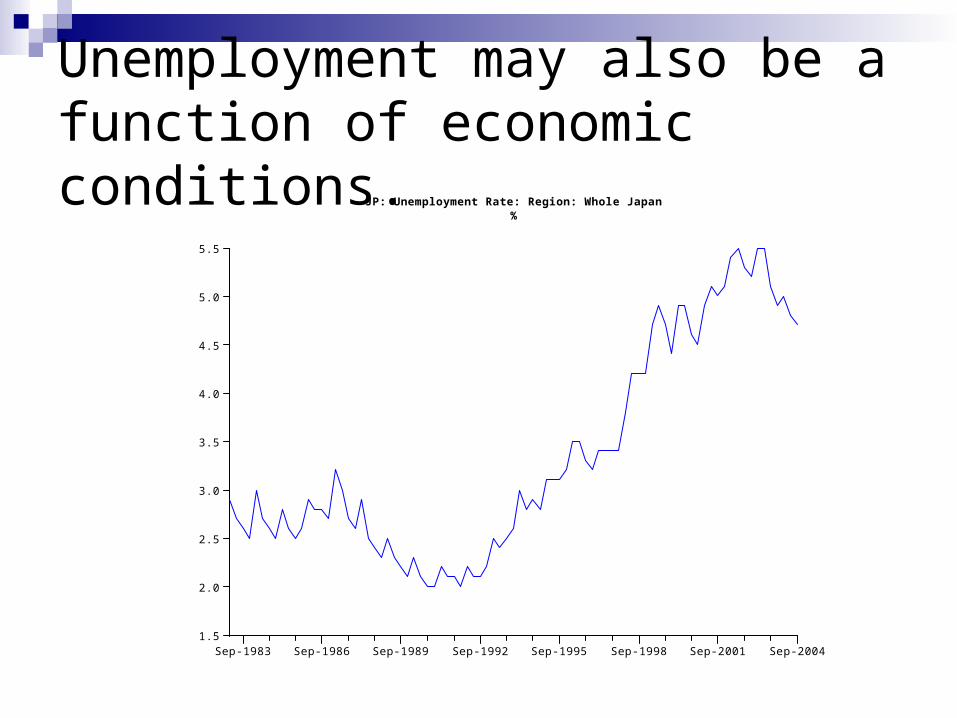
Unemployment may also be a function of economic conditions.
Sep-1983 Sep-1986 Sep-1989 Sep-1992 Sep-1995 Sep-1998 Sep-2001 Sep-2004
5.5
5.0
4.5
4.0
3.5
3.0
2.5
2.0
1.5
JP: Unemployment Rate: Region: Whole Japan%

Unemployment is a negative function of labor demand curve.
WP
LD
we
L*
LS
U(eW)
U(eW’)

Positive Productivity ShockeW
ur
LD
LSwe*
ur*
LD’
ur**
we**