Embed Size (px)
Citation preview

WP/12/99
Unemployment and Labor Market Issues in Algeria
Davide Furceri

© 2012 International Monetary Fund WP/12/99
IMF Working Paper
Middle East and Central Asia Department
Unemployment and Labor Market Developments in Algeria
Prepared by Davide Furceri 1
Authorized for distribution by Joël Toujas-Bernaté
April 2012
Abstract
The aim of this paper is to analyze unemployment and labor market developments in Algeria and assess the factors that may hamper employment creation. The results of the paper suggest that the relative low output-employment elasticities and rigid labor market are the main factors behind the still high level of unemployment, particularly among the youth. Simulation analyses, based on the results on the relation between labor market institutions and unemployment, show that improvement in labor market conditions in Algeria would be key in reducing unemployment both in the short- and medium-term.
JEL Classification Numbers: E29, J60, E32, D7.
Keywords: Labor market; flexibility, unemployment.
Author’s E-Mail Address:[email protected]
1 The authors would like to thank Joël Toujas-Bernaté and Adnan Mazarei for useful comments, and Kadia Kebet and Desirée Amon for excellent editorial assistance.
This Working Paper should not be reported as representing the views of the IMF. The views expressed in this Working Paper are those of the author(s) and do not necessarily represent those of the IMF or IMF policy. Working Papers describe research in progress by the author(s) and are published to elicit comments and to further debate.

2
Contents Page
I. Introduction ............................................................................................................................3
II. Stylized Facts ........................................................................................................................3
III. Employment-GDP Elasticities .............................................................................................5
IV. Labor Market Flexibility and Unemployment .....................................................................7
V. Medium-term Scenario .......................................................................................................12
VI. Conclusions and Policy Implications.................................................................................14 Reference .................................................................................................................................17 Tables 1. Unemployment Statistics, 2010 ..........................................................................................18 2. Labor Force Statistics, 2010 ...............................................................................................19 3. Employment Statistics, 2010 ..............................................................................................19 4. Employment-GDP Elasticities ............................................................................................19 5. Unemployment and Labor Market Flexibility-Static Regression (OLS) ............................20 6. Unemployment and Labor Market Flexibility-Dynamic Regression (GMM) ....................21 7. Medium-term Scenario, 2011–16 .......................................................................................22 Figures 1. Demographic Indicators ......................................................................................................23 2. Evolution of Unemployment Over Time ............................................................................23 3. Employment and GDP over Time .......................................................................................24 4. Arc Elasticities by Age Groups...........................................................................................24 5. Arc Elasticities by Sectors ..................................................................................................25 6. Recursive Estimates of Elasticities .....................................................................................25 7. Labor Market Flexibility in Algeria, 2008 ..........................................................................25 8. Evolution of Labor Market Flexibility over Time ..............................................................26 9. Elasticity Unemployment-Output .......................................................................................26 10. Labor Market Flexibility and Medium-term Unemployment ............................................27
3
I. INTRODUCTION
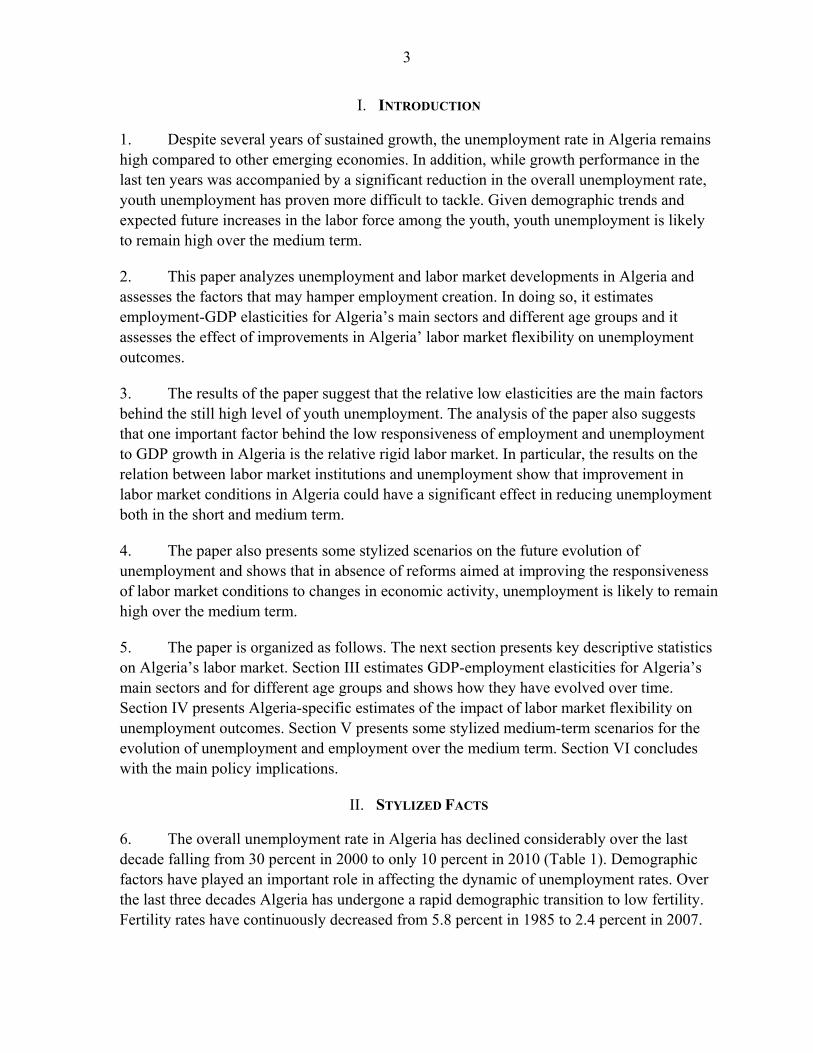
1. Despite several years of sustained growth, the unemployment rate in Algeria remains high compared to other emerging economies. In addition, while growth performance in the last ten years was accompanied by a significant reduction in the overall unemployment rate, youth unemployment has proven more difficult to tackle. Given demographic trends and expected future increases in the labor force among the youth, youth unemployment is likely to remain high over the medium term.
2. This paper analyzes unemployment and labor market developments in Algeria and assesses the factors that may hamper employment creation. In doing so, it estimates employment-GDP elasticities for Algeria’s main sectors and different age groups and it assesses the effect of improvements in Algeria’ labor market flexibility on unemployment outcomes.
3. The results of the paper suggest that the relative low elasticities are the main factors behind the still high level of youth unemployment. The analysis of the paper also suggests that one important factor behind the low responsiveness of employment and unemployment to GDP growth in Algeria is the relative rigid labor market. In particular, the results on the relation between labor market institutions and unemployment show that improvement in labor market conditions in Algeria could have a significant effect in reducing unemployment both in the short and medium term.
4. The paper also presents some stylized scenarios on the future evolution of unemployment and shows that in absence of reforms aimed at improving the responsiveness of labor market conditions to changes in economic activity, unemployment is likely to remain high over the medium term.
5. The paper is organized as follows. The next section presents key descriptive statistics on Algeria’s labor market. Section III estimates GDP-employment elasticities for Algeria’s main sectors and for different age groups and shows how they have evolved over time. Section IV presents Algeria-specific estimates of the impact of labor market flexibility on unemployment outcomes. Section V presents some stylized medium-term scenarios for the evolution of unemployment and employment over the medium term. Section VI concludes with the main policy implications.
II. STYLIZED FACTS
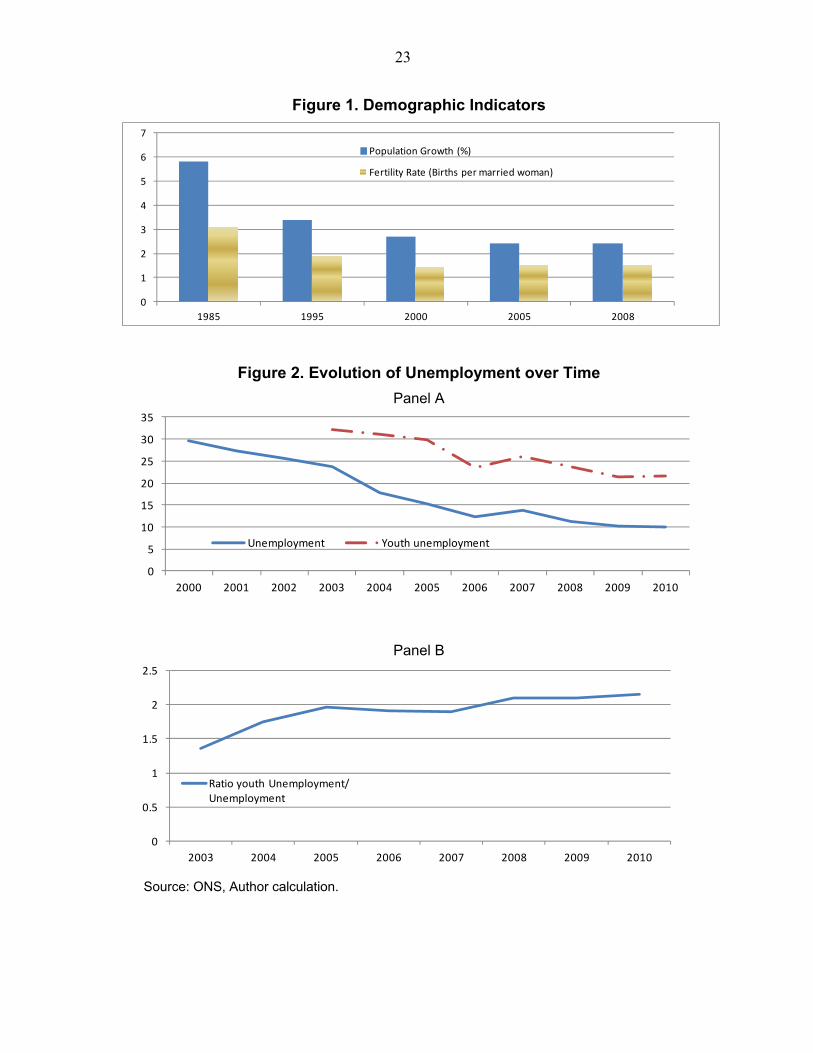
6. The overall unemployment rate in Algeria has declined considerably over the last decade falling from 30 percent in 2000 to only 10 percent in 2010 (Table 1). Demographic factors have played an important role in affecting the dynamic of unemployment rates. Over the last three decades Algeria has undergone a rapid demographic transition to low fertility. Fertility rates have continuously decreased from 5.8 percent in 1985 to 2.4 percent in 2007.
4
As a result, population growth has declined from 3.1 percent to 1.5 percent over the same period (Figure 1).
7. Participation rates have also steadily declined during the last decade generating fewer entrants into the labor market and contributing to substantially lower unemployment rates.2
The additional demand for job, as expressed by labor force growth, has declined from an average of 4.2 percent over the period 1991–2000 to 2 percent over 2001–10. In contrast, employment growth has increased over the same period from an average of 2.9 percent in 1991–2000 to 4.7 percent in 2001–10, leading to lower unemployment.
8. However, despite the large gains in the overall rate of unemployment observed during the last decade, unemployment has not decreased with the same speed for several segments of the population, particularly for the youth. As a result, the ratio of youth unemployment to overall unemployment has steadily increased over the recent period (Figure 2).
9. In addition to youth unemployment (which is currently at 21.5 percent (Table 1)), high unemployment rates are recorded mainly for women and people with higher level of education (respectively, 19 and 20 percent - Table 1). While the high level of female unemployment may be largely driven by social factors, labor market imperfections play an important role in high unemployment rates among young graduates. First, as described more in detail in the rest of the paper, Algeria’s labor market is relatively rigid, and therefore tends to favor insider versus outsider workers. Second, the high level of unemployment among young graduates is also the result of mismatches between labor market demand and supply: on the one hand, the economy has not been able to create sufficiently high skilled jobs; on the other hand, there seems to be an unbalanced distribution of Algerian students in favor of fields (such as humanities, social sciences, law and education) that generate an undersupply of the skills most needed by the private sector (Table 1).
10. These labor market imperfections also play an important role in explaining the very long length of unemployment spells in the Algeria’s labor market—almost 50 percent of unemployed have been seeking a job for more than two years (Table 1). In fact, relative rigid labor markets and labor-market mismatches tend to reduce job turnover and increase the incidence of long-term unemployment. In addition, the low turnover associated with a rigid labor market may also reduce the effectiveness of active labor market policies aiming at integrating outsider workers in the labor market.
2 See Table 2 for a breakdown of labor force participation among the different age/gender groups.

5
III. EMPLOYMENT-GDP ELASTICITIES
11. A valuable indicator for understanding the evolution of labor market outcomes is the elasticity of employment with respect to output. This indicator provides information on the employment intensity of growth and gives indication on how employment and GDP growth are correlated. Figure 3 displays the evolution of the growth rate of the non hydrocarbon sector3 and of employment. Looking at the figure, despite the fact that the two series have not considerably co-moved over time, the employment intensity of growth has been in general relative high over the entire period.4 This has been reflected in a relatively high arc elasticity (defined as the ratio of employment growth to non hydrocarbon GDP growth) which over the period has been on average equal to 0.64.
12. However, the computation of the arc elasticity for overall employment may mask significant differences across different age groups. In fact, while the employment intensity of growth has been on average relatively high, the arc elasticity for young has been considerably low. Differentiating between the age group 15–24 and the group aged 24+, Figure 4 shows that the arc elasticity for young people over the recent 5 years has been half of the average arc elasticity for total employment and about one third of the arc elasticity of the age group 24+. Among the different sectors of economic activity, while services sectors absorb the largest part of new entrants (Table 3), the sector being characterized by the highest employment intensity of growth is industry (Figure 5).
13. However, as shown in Figures 3–5, the estimates of arc elasticities have to be interpreted with some caution since they tend to be very volatile and extremely sensitive to abrupt changes in employment and GDP. In order to address this issue, a measure of elasticity is estimated using a dynamic time-series specification of employment and non hydrocarbon GDP:
(1) where E is the level of employment, Y the non hydrocarbon GDP, ρ indicates the persistence of employment and β is the short-term (i.e. contemporaneous) elasticity. While the elasticities obtained using equation (1) still have to be interpreted in terms of correlation between output and employment rather than causality, they are considerably less volatile than the arc elasticity.
3 The reason of focusing only on the nonhydrocarbon sector is that the hydrocarbon sector employs less than 5 percent of total employment even though it represents about 35 percent of total GDP. In addition, employment in the hydrocarbon sector is usually not very much correlated with changes in production.
4 The correlation between employment growth and nonhydrocarbon GDP growth is about 0.1.

6
14. In addition, the use of equation (1) allows to identify the responsiveness of employment to output over different time horizons. In particular, for each period k, the k-ahead cumulative response of employment to output can be computed as: ∑ .
15. Equation (1) is estimated using OLS over the period 1993-2010. The problem of the relative low number of degrees of freedom is mitigated by the fact that equation (1) is a co-integration relationship5 and therefore the OLS estimates are “super-consistent,” in the sense that they converge more quickly than OLS estimates based on I(0) variables (Stock, 1987). The results from OLS estimates yield:
2.882 0.442 0.497 2.15 1.73 2.19
where t-statics are in parenthesis, and the associated R2 is 0.97. Using the estimated parameters reported above, the k-ahead cumulative response of employment to output is computed over different time horizons (Table 4). Given that the persistence of employment is less than one, which also ensures the stability of the empirical specification, the cumulative response of employment increases over time and is bounded. In particular, while the short-term elasticity is about 0.5, the long-term elasticity (for k ∞) is about 0.9. 16. While the elasticities computed using equation (1) help to smooth the correlation between output and employment, it could still be the case that they can evolve over time. To assess the evolution of the estimated employment-output elasticity over time, equation (1) was recursively estimated over the following periods: 1993-2000, 1993-2001, and 1993–2010. The results obtained for the short-run elasticity are displayed in Figure 6 and suggest that the employment intensity of growth has significantly declined over the most recent period.6 This reduction in the employment intensity of growth may suggest that in order to continue to reduce unemployment over the medium term, particularly among the segments of the population with highest rates, continuously larger gains in growth and/or changes in the factors underpinning employment elasticities will be needed.
17. Previous theoretical and empirical evidence has identified a possible set of determinants of the employment-output elasticities, including (i) economic openness and export orientation, (ii) product market regulation and competitiveness, (iii) the size of public sector, and (iv) the rigidity of the labor market. While there are few empirical studies that assess the roles of these variables simultaneously, there is tentative evidence suggesting that lower economic openness, large public sectors and more rigid labor and product markets are
5 The presence of co-integration has been tested using unit root tests on the residuals based on the Augmented Dickey-Fuller and Phillips-Perron tests.
6 The decline in the employment intensity of growth is reflected in the increase of labor productivity growth.

7
associated with lower elasticities and therefore higher levels of unemployment.7 The next section will analyze in detail the role of labor market flexibility in Algeria.
IV. LABOR MARKET FLEXIBILITY AND UNEMPLOYMENT
18. Economic theory and previous empirical studies have identified a number of policy and institutional determinants of unemployment, including unemployment benefits, tax wedges, the structure of collective bargaining, employment protection legislation, minimum wages and hiring costs. Overall, previous empirical evidence has in general concluded that more rigid labor market institutions may obstruct job creation and tend to be associated with higher levels of unemployment.8
19. While most of the empirical research has focused on single indicators of labor market institutions, recent studies (e.g., Feldman 2009, and Bernal-Verdugo et al. 2012a, 2012b) have also focused on composite indicators of labor market flexibility. The reason to consider a composite indicator is the inherently complex nature of labor market regulation and the evidence that improvement in labor market efficiency are likely to require reforms in more than one area of the labor market (Bassanini and Duval, 2009).
20. The empirical evidence provided in recent studies analyzing the effect of composite indicators of labor market flexibility has in general confirmed that more rigid labor markets are associated with higher level of unemployment. However, while these studies have provided average estimates for large sets of countries, it is likely that the effect of labor market flexibility on unemployment outcomes depends on countries’ structural and macroeconomic specific characteristics. The aim of this section is to analyze the effect of labor market flexibility on unemployment, including for Algeria.
Indicator of labor market flexibility 21. The dataset used in the empirical analysis consists of a panel of annual data for 183 countries spanning from 1980 to 2008. Data for labor market flexibility are taken from the Fraser Institute’s Economic Freedom of the World (EFW) database. The database provides a composite measure of labor maker flexibility based on six policy areas: 7 For exemple, Bruno et al. (2001) find that measures of globalization and external balance are correlated with employment intensity. Mourre (2004) and Dopke (2001) find that that employment protection and labor market rigidity have a negative impact on employment intensity. Bassanini and Duval (2006, 2009) find that product market regulations are correlated with the persistence and the responsiveness of unemployment to GDP shocks. Feldman (2006) finds that the size of government affects the level of unemployment.
8 For example, Nickel (1998), Elmeskov et al. (1998) and Nunziata (2002) find robust evidence that the level and the duration of unemployment benefits have positive effects on unemployment. Belot and Van Ours (2004) and Nickell (1997) find that high labor taxes tend to increase unemployment rates. Botero et al. (2004) find that more rigid employment laws are associated with high unemployment, especially for the young. See Bassanini and Duval (2006) for a detailed review.

8
(i) Minimum wage, (ii) Hiring and Firing regulation, (iii) Centralized collective wage bargaining, (iv) Mandated cost of hiring, (v) Mandated cost of work dismissal, and (vi) Conscription.9 The composite indicator is standardized on a 0-10 range, with higher value of the indicator representing a more flexible labor market.
22. Figure 7 shows the indicator of labor market flexibility for Algeria and compares it with those of other emerging countries. This indicator points to Algeria’s labor market being overall rigid in absolute terms (scoring 5 out of 10), and less flexible than in other MENA and emerging countries. Moreover, looking at the evolution of the indicator over time, it seems that labor market rigidity has increased over the most recent period for which data for the indicator are available (Figure 8).
Empirical methodology and results 23. In this section, we discuss the empirical methodology used to analyze the relationship between labor market flexibility and unemployment outcomes in Algeria, and we present the results of the econometric estimations under alternative model specifications.
24. We divide our empirical analysis in two parts. First, we estimate a static model specification to test for the hypothesis that the quality of labor market regulations has a first order effect on unemployment outcomes in Algeria. Second, we estimate a dynamic model specification to test whether labor market flexibility in Algeria affects the change in unemployment over time. Using a sample of 140 countries spanning the period 1980–2008, our findings indicate that, after controlling for other macroeconomic and demographic variables, increases in the quality of labor market regulations and institutions have a statistically significant negative impact both on the level and on the change of unemployment outcomes.
9 In detail: (i) Hiring regulations and minimum wage are based on the World Bank’s Difficulty of Hiring Index (this measure gives lower ratings to countries with a higher difficulty of hiring); (ii) Hiring and Firing regulations based on the World Economic Forum’s Global Competitiveness Report (this measure gives a lower rating to countries in which the free hiring and firing of workers is impeded by regulation); (iii) Centralized collective bargaining assigns ratings based on the centralization of the wage bargaining process, which are higher for countries with a more decentralized bargaining process; (iv) Mandated cost of hiring is based on the World Bank’s Doing Business data on the cost of all social security and payroll taxes and the cost of other mandated benefits including those for retirement, sickness, health care, maternity leave, family allowance, and paid vacations and holidays associated with hiring an employee; (v) the index of Mandated cost of worker dismissal rates countries based on the cost of the requirements for advance notice, severance payments, and penalties due when dismissing a redundant worker; (vi) the index of Conscription rates countries based on the use and duration of military conscription, with the highest rating given to countries without military conscription.

9
Static relationship between unemployment and labor market institutions
25. In order to assess the relationship between labor market flexibility and the level of unemployment in Algeria we employ a standard static reduced-form specification in which unemployment is regressed against our measure of labor market flexibility, the interaction term between labor market flexibility and a dummy variable for Algeria, and a set of macroeconomic and demographic variables as controls:
′ (2) where is the unemployment rate for country i at time t, is the composite indicator of labor market flexibility; a dummy variable that takes value equal to 1 for Algeria and zero otherwise; represents country dummies that capture unobserved country-specific determinants of unemployment, , is a vector of control variables,10 including a measure of output gap to control for business cycle fluctuations (proxied by the difference of the GDP growth rate from a 5-year moving average), the size of government (proxied by the log of the ratio of government consumption to GDP), the degree of trade openness (measured as the log of the ratio of total exports and imports to GDP), the rate of urbanization, population density, a crisis dummy which takes value equal to 1 for the occurrence of a financial (banking, debt and currency) crisis and zero otherwise, and a common time trend.
26. In equation (2), the impact of labor market flexibility on unemployment in Algeria is given by . The reason to use a panel approach with country-specific slopes instead of relying on a time-series regression is due to the fact that data for labor market flexibility for Algeria are available only for the period 2000-2008, and therefore the number of observations is not sufficient to perform a meaningful time-series exercise.
27. The main results regarding the relationship between unemployment and labor market institutions are shown in Table 5, which displays the estimates for the static specifications of the econometric model. First and foremost, in all specifications, improvements in the quality of labor market regulations that allow for a higher degree of flexibility have a statistically significant negative effect on unemployment. Interestingly, the effect is larger in Algeria than for the average of the countries in the sample. In particular, the results suggest that in Algeria an increase in the composite labor market index of one standard deviation would decrease the unemployment rate by about 1 percentage point. The significance and the magnitude of the effect are extremely robust across all specifications. In addition, the results are also robust when the sample is restricted to non-OECD countries.11
10 The sources of the data for the other variables used in the empirical analysis are the IMF’s World Economic Outlook (WEO), the World Bank’s World Development Indicators (WDI), and the Penn World Table version 7.0 by Heston et al. (2011).
11 The results are available from the author upon request.
10
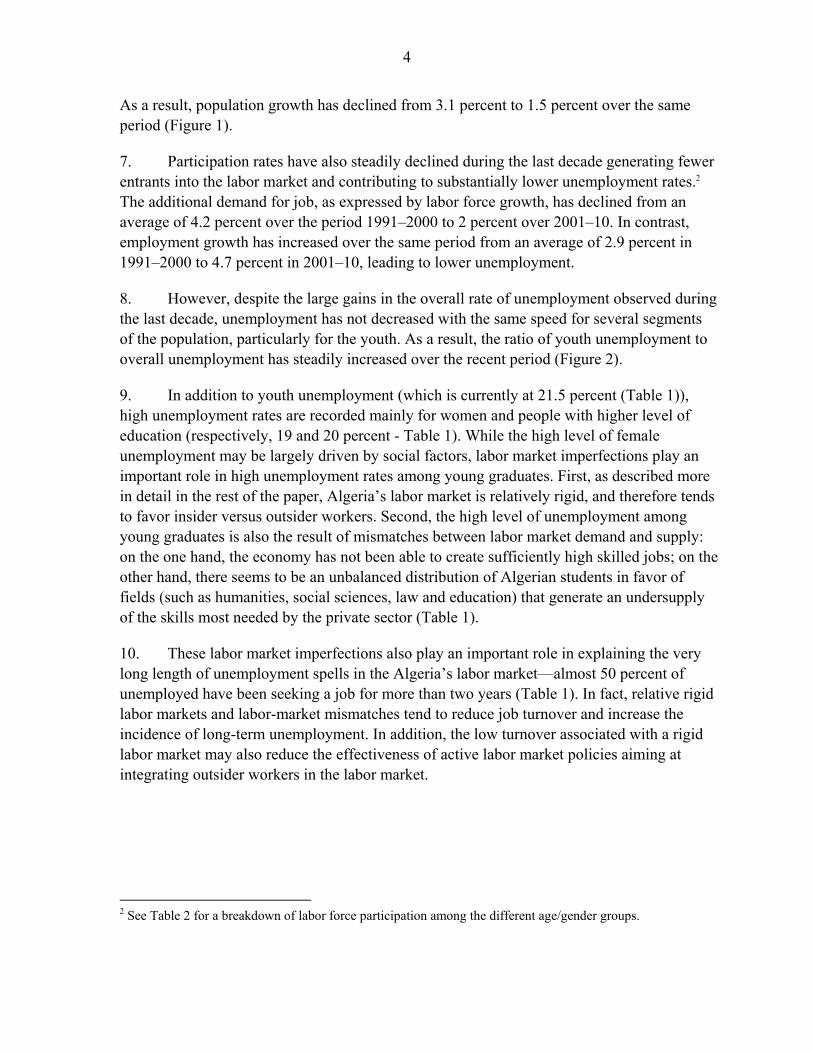
28. Among the control variables, apart from our measure of output gap, we find that government size has a positive and statistically significant effect on changes in unemployment (column II). This result is consistent with previous empirical evidence suggesting that countries characterized by a larger government size and a larger share of public employment tend to have higher unemployment rates (e.g., Feldman, 2006).12
Dynamic relationship between unemployment and labor market institutions
29. In order to assess the relationship between labor market flexibility and changes in unemployment we use a dynamic reduced-form specification in which changes in unemployment are regressed against our measure of labor market flexibility, the interaction term between labor market flexibility and the dummy variable for Algeria, and the set of macroeconomic and demographic variables described in the previous section:
∆ ′ (3)
30. To address endogeneity due to the presence of the lagged level of unemployment among the regressors and to reverse causality from changes in unemployment to labor market flexibility, equation 3 has been estimated using the two-step GMM-system estimator.13
31. Table 6 displays the estimates for different specifications. Looking at the table, it is evident that improvements in the quality of labor market regulations that allow for a higher degree of flexibility have a statistically significant effect, inducing a decline in unemployment. As for the static specification, the results suggest that the effect is larger in Algeria than for the average of the countries in the sample, with an increase in the composite labor market index of one standard deviation decreasing unemployment rate by about 0.9–1.2 percentage point. In particular, the results for our baseline specification (first column), which includes the lagged level of unemployment and our measure of output gap as a control, suggest that a one standard deviation increase in the labor market index is associated with a decrease in the annual change in unemployment of about 1.1 percentage points. In addition, the fact that the term of the lag of unemployment is statistically significant and higher
12 There are several reasons for which government size can affect unemployment and the elasticity between employment and GDP. First, a large government sector tends to crowd out private investment and reduce growth over the medium-term (Afonso and Furceri, 2009). Second, as the private sector is relatively small, its ability to absorb new labor force entrants is reduced. Third, a large government sector often involves higher taxes which can have depressive effects on aggregate demand and on the labor market (Daveri and Tabellini, 2000). Overall, previous empirical evidence has confirmed the hypothesis that a higher government size is associated with higher unemployment rates (e.g., Feldman, 2006).
13 The two-step GMM-system estimates (with Windmeijer standard errors) are computed using the xtabond2 Stata command developed by Roodman (2009a). All explanatory variables are considered as endogenous (instrumented using up to 2 lags). The significance of the results is robust to different choices of instruments and predetermined variables.

11
than 114 implies that improvement in labor market flexibility in Algeria will be able to reduce unemployment rate also over the medium term.
32. Among the control variables, apart from the lag of unemployment, we find that financial crises have a positive and statistically significant effect on changes in unemployment (column VI). This result is consistent with previous empirical evidence suggesting that financial crises lead to a significant and persistent increase in unemployment (e.g., Bernal-Verdugo et al. 2012a).
33. Consistency of the two-step GMM estimates has been checked by using the Hansen and the Arellano-Bond tests. The Hansen J-test of over-identifying restrictions, which tests the overall validity of the instruments by analyzing the sample analog of the moment conditions used in the estimation process, cannot reject the null hypothesis that the full set of orthogonality conditions are valid (across the different specifications the p-value ranges from 0.25 to 0.56). The Arellano–Bond test for autocorrelation cannot reject the null hypothesis of no second-order serial correlation in the first-differenced error terms (across the different specifications the p-value ranges from 0.47 to 0.54).
34. In order to assess whether the results are robust across different country groups characterized by different levels of economic development, equation (2) has been estimated excluding from the estimation sample the OECD countries. As pointed out by Roodman (2009b), a problem with applying GMM-system estimator is that it may generate too many instruments which may reduce the efficiency of the two-step estimator and weaken the Hansen test of the instrument’s joint validity. This could be an important issue when the number of countries is relatively small compared to the number of instruments, as it is the case when OECD countries are excluded from the estimation sample. To address this issue, and following Roodman’s suggestion, we have applied the GMM-system estimator based on a collapsed number of instruments. The results obtained with this approach suggest that the effect of the quality of labor market institutions is statistically significant, and the effect is still larger for Algeria than for the average of the countries in the sample.15
Unemployment-output elasticity and labor market flexibility
35. A channel through which labor market institutions affect the level of unemployment is the response and the persistence of labor market conditions to observed and unobserved shocks (e.g., Blanchard and Wolfers, 2000; Bassanini and Duval, 2009). Overall, previous evidence has in general pointed out that the resilience of unemployment to shocks is larger in countries with more flexible labor market.
14 This implies that the autocorrelation coefficient of the level of unemployment is between 0 and 1.
15 The results are available from the author upon request.

12
36. In order to test this finding and assess the response of unemployment to GDP for Algeria, a two step approach has been carried out. First, unemployment and youth unemployment elasticities have been computed as described in equation (1). The results suggest that the overall rate of unemployment reacts more strongly than the rate of youth unemployment to changes in GDP. Second, the estimated elasticities for all countries in the sample are regressed against the composite indicator of labor market flexibility.
37. Figure 9 plots the relation between unemployment-output (Panel A) and youth unemployment-output (Panel B) elasticities and labor market flexibility, and confirms previous findings suggesting that gains in growth are likely to be translated into larger reductions in total and youth unemployment the more flexible is the labor market. In addition, given that in Algeria youth unemployment has been less responsive to changes in economic activity, improvements in labor market flexibility will tend to have a higher effect on youth unemployment.
V. MEDIUM-TERM SCENARIO
38. This section presents stylized scenarios on the evolution of unemployment over the medium term based on two different alternative methodologies. In the first part of the analysis, the medium-term scenarios for unemployment are constructed using ILO (2011) estimates of the economically active population based on demographic projections and alternative measures of employment-GDP elasticities. In the second part of the analysis, the evolution of unemployment over the medium term is projected using the estimated elasticities between the unemployment rate and GDP.
39. From a technical point of view, the main advantage of using the first methodology is to take into consideration demographic trends that affect the medium-term evolution of the economically active population. However, since projections for changes in labor force participations are mostly based on demographic trends, a limitation of this approach is that it assumes that changes in economic activity would not have an impact in the decision of entering and exiting the labor force. In contrast, while the second methodology does not suffer from this problem, since the response of unemployment to economic activity is directly estimated, it does not take into account demographic trends which can affect participation rates over the medium term.
40. Despite these differences, the results obtained with both analyses suggest that in absence of reforms aimed at improving the responsiveness of labor market conditions to changes in economic activity, unemployment is likely to remain high over the medium term.
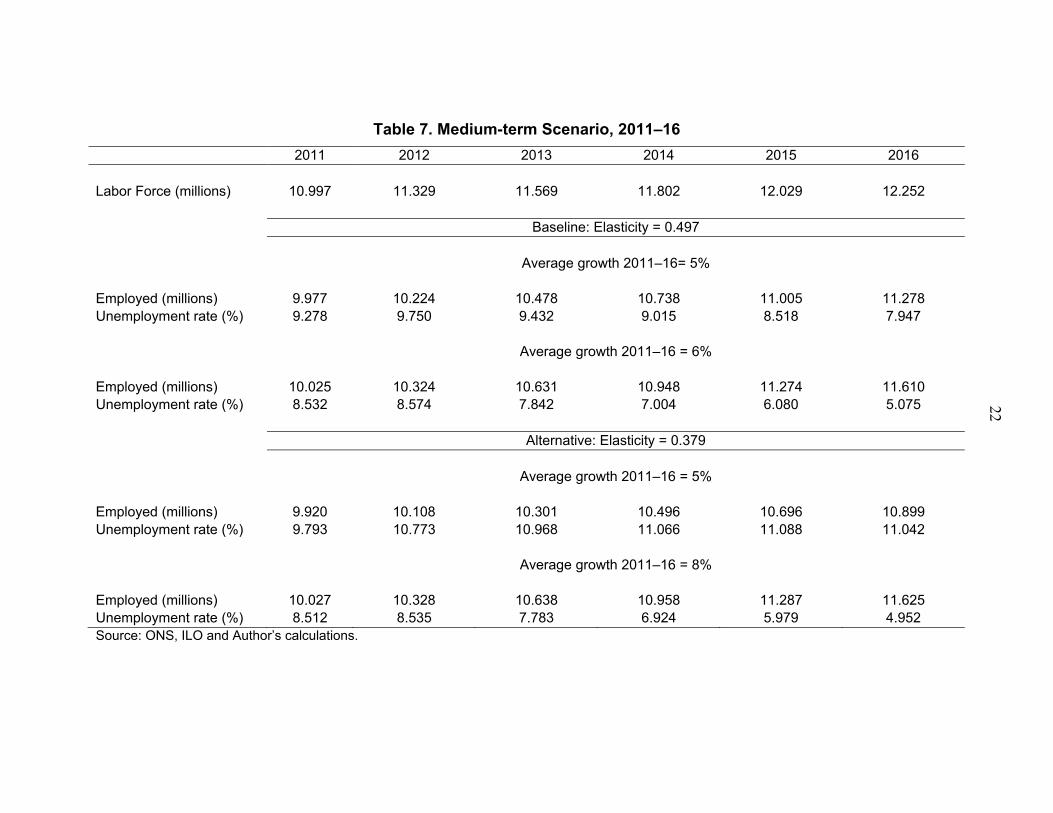
ILO projections and employment-GDP elasticities 41. Table 7 presents alternative scenarios of the evolution of unemployment over the medium term under different growth and employment-GDP elasticities, and using the ILO estimates of net labor force entrance over the period 2011–16.

13
42. The baseline scenario shows that assuming employment-GDP elasticity equal to the one estimated in the first column of Table 4, an average growth rate for non hydrocarbon GDP of 5 percent would lead to a reduction in unemployment of about 1.3 percentage points over the medium-term: from about 9.3 percent projected for 2011 to about 8 percent in 2016. The baseline scenario also shows that a more favorable growth performance of the non hydrocarbon sector (of about 6 percent) would significantly reduce unemployment, bringing the unemployment rate to about 5 percent by 2016.
43. However, these results may be optimistic given the continuous reduction in the responsiveness of employment to changes in economic activity that has occurred during the recent past. In fact, extending the trend of the estimated elasticity shown in Figure 4 up to 2016, and in absence of labor market reforms aimed at improving the responsiveness of unemployment to economic activity, the average employment-GDP elasticity over the period 2011–16 could be of about 0.4. The evolution of unemployment under this assumption would be much less favorable. In particular, under the assumption of on an average growth rate of nonhydrocarbon GDP of about 5 percent, the unemployment rate would increase over the medium-term up to 11 percent. In addition, in order to reduce the unemployment rate to 5 percent by 2016, the nonhydrocarbon sector would need to grow at an annual rate of about 8 percent.
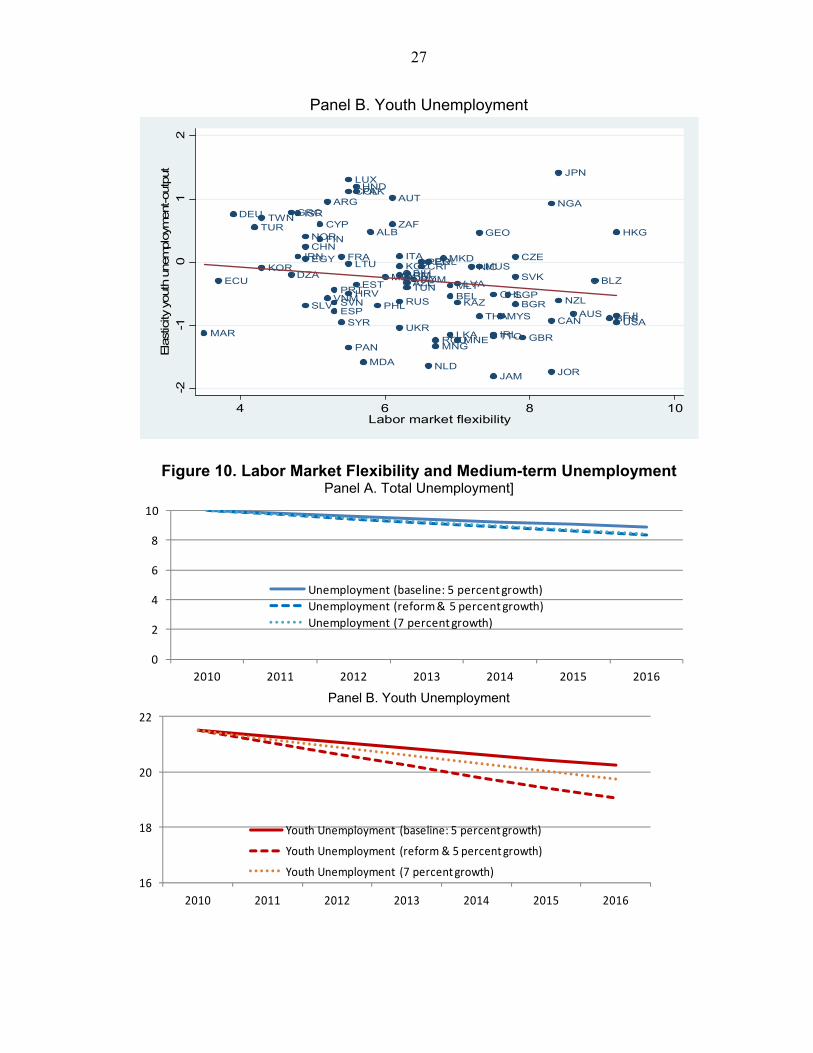
Unemployment-GDP elasticities 44. An alternative way to project the evolution of unemployment over the medium term is to estimate unemployment-GDP elasticities (instead of employment-GDP elasticities). Figure 10 presents alternative scenarios of the evolution of unemployment and youth unemployment over the medium term under different unemployment and youth unemployment-GDP elasticities.
45. Under the baseline scenario, the elasticities are assumed to be those presented in Figure 5. Under this assumption, and an average growth rate of non hydrocarbon GDP of about 5 percent, the overall unemployment rate will decrease only slightly over the medium term while the youth unemployment will remain mostly stable. In addition, an improvement of potential growth from 5 to 7 percent would not be sufficient to significantly reduce youth unemployment.
46. Under the alternative scenario, the elasticities are estimated assuming that labor market flexibility in Algeria would improve to the average level of other oil producers and emerging countries. Under this assumption, both unemployment and youth unemployment would decrease over the medium term. In addition, given that in Algeria youth unemployment has been less responsive to changes in economic activity, the reduction, in absolute terms, in youth unemployment over the medium term would be larger. In particular, while the total unemployment rate could fall from 10 percent in 2010 to 8.4 percent in 2016,

14
the rate of youth unemployment could decrease from 21.5 percent in 2010 to 19 percent in 2016.
VI. CONCLUSIONS AND POLICY IMPLICATIONS
47. Despite several years of sustained growth, the unemployment rate in Algeria remains high compared to other emerging economies. In addition, while growth performance in the last ten years was accompanied by a significant reduction in the overall unemployment rate, youth unemployment has proven more difficult to tackle as evidenced by the fact that the ratio of youth unemployment to overall unemployment has steadily increased over the recent period.
48. The results of the paper suggest that the relative low elasticity for youth employment is one of the main factors behind the still high level of youth unemployment and that labor market imperfections play an important role in explaining the low employment intensity of growth.
49. The descriptive evidence presented in the paper shows that Algeria’s labor market is rigid both in absolute and relative terms (compared to other emerging counties), and therefore tends to favor insider versus outsider workers. The results of the empirical analysis suggest that reforms aimed at improving labor market flexibility may have important effects in reducing unemployment both in the short and in the medium term. In this context, reforms aimed at reducing search and hiring costs are particularly important to integrate young outsider workers into the labor market.
50. However, while labor market flexibility has an important role, the high level of unemployment among young graduates is also the result of mismatches between labor market demand and supply: on the one hand, the private sector has not been able to create sufficient demand for skilled workers; on the other hand, the distribution of Algerian students is highly unbalanced towards disciplines (such as humanities, social sciences, law and education) that generate an undersupply of the skills most needed by the private sector. In this context, properly designed active labor market policies can reduce unemployment by improving the efficiency of the job matching process and by enhancing the skills of the unemployed.
51. Reforms aimed at removing these labor market imperfections will also have an important effect in reducing the very long length of unemployment spells in the Algeria’s labor market, as relative rigid labor markets and labor-market mismatches tend to reduce job turnover and increase the incidence of long-term unemployment. In fact, as evidenced by the results of the medium-term scenario analysis, in the absence of reforms aimed at improving the responsiveness of labor market conditions to changes in economic activity, unemployment is likely to remain high over the medium-term.
52. Finally, reforms aimed at improving the business climate and foster product market competition are key to increase labor demand over the medium-term. In particular, lower

15
barriers to entry curb market power and incumbents’ rents and tend to reduce wage claims and close the gap between productivity and real wages. Moreover, stronger competition may reduce bargaining positions of employer and increase employment costs for higher wage. Reduced rent sharing would also decrease the time spent for searching for employment opportunities in high wage sectors.
16
REFERENCES Afonso, A., and D. Furceri, 2010, “Government Size, Composition, Volatility, and Economic
Growth,” European Journal of Political Economy, 26(4), pp. 517–32. Blanchard, Olivier, and Justin Wolfers, 2000, “The Role of Shocks and Institutions in the
Rise of European Unemployment: The Aggregate Evidence,” The Economic Journal, 110(462), pp. 1–33.
Bassanini, A., and R. Duval, 2006, “Employment Patterns in OECD Countries: Reassessing
the Role of Policies and Institutions,” OECD Economics Department Working Papers, No. 486, OECD Publishing.
____________________, 2009, “Unemployment, Institutions, and Reform
Complementarities: Reassessing the Aggregate Evidence for OECD Countries,” Oxford Review of Economic Policy, Vol. 25, No. 1, pp.40–59.
Belot, Michèle, and Jan C van Ours, 2004, “Does the Recent Success of Some OECD
Countries in Lowering their Unemployment Rates Lie in the Clever Design of their Labor Market Reforms?” Oxford Economic Papers, 56 (4), pp. 621–42.
Bernal-Verdugo, L., D. Furceri, and D. Guillaume, 2012a, “Crises, Labor Market Policy, and
Unemployment,” IMF Working Papers 65 (Washington: International Monetary Fund). Bernal-Verdugo, L., D. Furceri, and D. Guillaume, 2012b, “Labor Market Flexibility and
Unemployment: New Empirical Evidence of Static and Dynamics Effects,” IMF Working Papers 64 (Washington: International Monetary Fund).
Botero, Juan C., et al., 2004, “The Regulation of Labor.” Quarterly Journal of Economics,
Vol. 119 (4), 1339–82.
Bruno, S.F., et al., 2001, “Measuring the Effect of Globalization on Labor Demand Elasticity: an empirical application to OECD countries.” FLOWENLA Discussion Paper 2.
Daveri, F., and G. Tabellini, 2000, “Unemployment, Growth and Taxation in Industrial
Countries,” Economic Policy. Döpke, J., 2001, “The Employment Intensity of Growth in Europe,” Kiel Working Paper No. 1021, Kiel Institute of World Economics. Elmeskov, Jørgen, Martin, John P., and Scarpetta, Stefano, 1998, “Key Lessons for Labour
Market Reforms: Evidence from OECD Countries’ Experiences,” Swedish Economic Policy Review, Vol. 5 (2), pp. 205–52.
Feldmann, Horst, 2006, “Government Size and Unemployment: Evidence from Industrial
Countries,” Public Choice, Vol. 127 (3–4), pp. 451–67.
17
____________, 2009, “The Unemployment Effects of Labor Regulation Around the World,”
Journal of Comparative Economics Vol. 37, 1: 76–90. Howell, David, and Miriam Rehm, 2009, “Unemployment Compensation and High European
Unemployment: a Reassessment with New Benefit Indicators,” Oxford Review of Economic Policy, Vol. 25, No. 1, pp.60–93.
Kapsos, S., 2005, “The Employment Intensity of Growth: Trends and Macroeconomic
Determinants,” ILO Employment Strategy Papers No. 12. ILO, 2011, ILO Estimates and Projections of the Economically Active Population: 1990–2020. Mourre, G., 2004, “Did the Pattern of Aggregate Employment Growth Change in the Euro Area
in the late 1990s?” European Central Bank Working Paper Series No. 358. Nickell, S., 1997, “Unemployment and Labor Market Rigidities: Europe Versus North
America,” The Journal of Economic Perspectives, Vol. 11, No. 3. Nickell, S., 1998, “Unemployment: Questions and Some Answers,” The Economic Journal,
Vol. 108, Issue 448 (May). Nunziata, L., 2002, "Unemployment, Labour Market Institutions and Shocks,” Nuffield
College Working Papers in Economics, 2002–W16.
Roodman, D., 2009a, “How to Do xtabond2: An Introduction to Difference and System GMM in Stata,” Stata Journal, Vol. 9(1), pp. 86–136.
____________ 2009b, “A Note on the Theme of Too Many Instruments,” Oxford Bulletin of Economics and Statistics, Vol. 71 (1), pp. 135–58.
Stock, J.H., 1987, “Asymptotic Properties of Least Squares Estimators of Cointegrating Vectors.” Econometrica (55), 277–302.

18
Table 1. Unemployment Statistics, 2010
Unemployment Rate by Age Group and Gender Overall Male Female
Overall 10.0 8.1 19.1 Young (16-24) 21.5 18.6 37.4
Adults (25 and +) 7.1 5.4 15.0
Unemployment Rate by Degree of Instruction and Gender Overall Male Female
Without instruction 1.9 1.7 2.7 Primary 7.6 7.5 8.0 Medium 10.7 10.5 12.8
Secondary 8.9 7.0 17.2 Superior 20.3 10.4 33.3
Unemployment Rate by Areas (Rural vs. Urban) and Gender
Overall Male Female Rural 8.7 7.2 20.1
Urban 10.6 8.6 18.8 Total 10.0 8.1 19.1
Unemployment Rate by Duration (as % of unemployment) and Gender Overall Male Female
Less than one year 35.6 33.8 35.6 12–23 Months 19.3 18.4 19.3
24 Month and more 45.1 47.8 45.1 Total 100 100 100
Unemployment Rate for Graduates
Overall Male Female Humanities 27.3 14.7 34.4
Social Sciences 28.7 14.0 43.7 Sciences 18.1 9.8 28.6 Enginery 14.8 9.4 39.7
Total 21.4 11.1 21.4
Source: ONS.

19
Table 2. Labor Force Statistics, 2010
Labor force participation rate Overall Male Female
15 and + 41.7 68.9 14.2 15-24 28.2 46.5 8.9 25-54 55.5 91.7 19.9 25-34 57.5 90.8 23.9 35-54 53.9 92.4 16.8 15-60 45.9 75.0 15.7
60 and + 9.7 17.5 2.0 Source: ONS.
Table 3. Employment Statistics, 2010
Employment by Sector and Gender Overall Male Female Effective
(thousands) Percent Effective
(thousands)Percent Effective
(thousands) Percent
Agriculture 1,136 11.7 1,040 12.6 95 6.5 Industry 1,337 13.7 924 11.2 413 28.0 BTP 1,886 19.4 1,860 22.5 25 1.7 Services 5,377 55.2 4,436 53.7 941 63.8 Employment Public vs. Private Sector and Gender Overall Male Female Effective
(thousands) Percent Effective
(thousands)Percent Effective
(thousands) Percent
Public 3,346 34.4 2671 32.3 95 45.8 Private 6,390 65.6 5591 67.7 413 54.2 Total 9,735 100 8261 100 25 100 Source: ONS.
Table 4. Employment-GDP Elasticities
Contemporaneous 1-year ahead
2-year ahead
3-year ahead
4-year ahead
5-year ahead
Long-run
0.497 (2.19)***
0.715 (3.519)***
0.811 (5.692)***
0.853 (8.544)***
0.872 (10.852)***
0.880 (11.836)***
0.887 (12.008)***
Note: t-statistics in parenthesis. *** denotes significance at 1 percent.

20
Table 5. Unemployment and Labor Market Flexibility-Static Regression (OLS)
(I) (II) (III) (IV) (V) (VI) (VII) (VIII) Lt -0.567
(-2.97)*** -0.547
(-2.86)*** -0.469
(-2.33)** -0.529
(-2.72)*** -0.566
(-2.84)*** -0.572
(-3.03)*** -0.361 (-1.61)*
-0.210 (-0.88)
Lt *D t -5.947 (-31.10)***
-5.193 (-11.04)***
-6.004 (-31.94)***
-5.974 (-30.94)***
-5.947 (-29.70)***
-5.941 (-31.39)***
-6.153 (-27.26)***
-5.9712 (-10.33)***
Output gap t -0.041
(-1.77)* -0.013 (-0.59)
-0.038 (-1.60)
-0.043 (-1.80)*
-0.042 (-1.79)*
-0.044 (-1.88)*
-0.038 (-1.59)
-0.013 (-0.59)
Government size t - 2.736 (1.78)*
- - - - - 2.326 (1.47)
Openness t - - -0.865 (-0.75)
- - - - 1.614 (0.94)
Urban population t - - - -3.054 (-0.76)
- - - -2.221 (-0.46)
Population density
t - - - - 0.145
(0.06) - - 9.598
(2.02)** Crisis t - - - - - 0.630
(1.16) - 0.780
(1.36) Time trend t - - - - - - -0.053
(-1.42) -0.186
(-2.18)** N 893 893 893 882 882 893 893 882 R2 0.84 0.85 0.85 0.84 0.84 0.85 0.85 0.85 Note: t-statistics in parenthesis based on robust clustered standard errors. *,**,*** denote significance at 10 percent, 5 percent, 1 percent respectively. Country fixed effects included.

21
21
Table 6. Unemployment and Labor Market Flexibility-Dynamic Regression (GMM)
(I) (II) (III) (IV) (V) (VI) (VII) Lt -0.316
(-3.23)*** -0.293
(-3.30)*** -0.301
(-2.96)*** -0.232
(-2.52)** -0.277
(-3.17)*** -0.287
(-3.06)*** -0.137 (-1.54)
Lt *D t -6.332 (-2.38)**
-6.235 (-2.57)***
-6.449 (-2.63)***
-6.882 (-2.98)***
-6.781 (-2.61)***
-6.250 (-2.88)***
-5.131 (-2.24)**
Unemployment t-1 -0.043
(-1.56) -0.057
(-2.10)** -0.084
(-1.95)** -0.058
(-2.16)** -0.058
(-2.03)** -0.063
(-2.13)** -0.046 (-1.64)*
Output gap t 0.013 (0.41)
0.017 (0.51)
0.009 (0.29)
0.013 (0.42)
0.009 (0.32)
0.003 (0.10)
0.030 (0.85)
Government size t - 0.787 (1.45)
- - - - -
Openness t - - -0.682 (-1.43)
- - - -
Urban population t - - - -3.054 (-0.76)
- - -
Population density t - - - - 0.062 (0.49)
- -
Crisis t - - - - - 0.725 (2.10)**
-
Time trend t - - - - - - -0.055 (-2.18)**
N 890 890 890 879 879 890 890 Arellano-Bond, AR(2) test, p-value
0.513 0.504 0.551 0.506 0.523 0.538 0.470
Hansen test, p-value 0.306 0.445 0.427 0.464 0.563 0.458 0.245 Note: z-statistics in parenthesis. ***,**,* denote significance at 1%, 5%, and 10%, respectively. GMM-System Estimator: Two-step using Windmeijer standard errors, all regressors considered as endogenous (instrumented using up to 2 lags).
22
Table 7. Medium-term Scenario, 2011–16
2011 2012 2013 2014 2015 2016 Labor Force (millions) 10.997 11.329 11.569 11.802 12.029 12.252 Baseline: Elasticity = 0.497 Average growth 2011–16= 5% Employed (millions) 9.977 10.224 10.478 10.738 11.005 11.278 Unemployment rate (%) 9.278 9.750 9.432 9.015 8.518 7.947 Average growth 2011–16 = 6% Employed (millions) 10.025 10.324 10.631 10.948 11.274 11.610 Unemployment rate (%) 8.532 8.574 7.842 7.004 6.080 5.075 Alternative: Elasticity = 0.379 Average growth 2011–16 = 5% Employed (millions) 9.920 10.108 10.301 10.496 10.696 10.899 Unemployment rate (%) 9.793 10.773 10.968 11.066 11.088 11.042 Average growth 2011–16 = 8% Employed (millions) 10.027 10.328 10.638 10.958 11.287 11.625 Unemployment rate (%) 8.512 8.535 7.783 6.924 5.979 4.952 Source: ONS, ILO and Author’s calculations.
23
Figure 1. Demographic Indicators
Figure 2. Evolution of Unemployment over Time
Panel A
Panel B
Source: ONS, Author calculation.
0
1
2
3
4
5
6
7
1985 1995 2000 2005 2008
Population Growth (%)
Fertility Rate (Births per married woman)
0
5
10
15
20
25
30
35
2000 2001 2002 2003 2004 2005 2006 2007 2008 2009 2010
Unemployment Youth unemployment
0
0.5
1
1.5
2
2.5
2003 2004 2005 2006 2007 2008 2009 2010
Ratio youth Unemployment/ Unemployment

24
Figure 3. Employment and GDP over Time
Source: ONS, WDI, Author calculation.
Figure 4. Arc Elasticities by Age Groups
Source: ONS, WDI, Author calculation.
-5
0
5
10
15
20
1995 1996 1997 1998 1999 2000 2001 2002 2003 2004 2005 2006 2007 2008 2009 2010
NHGDP growth Employment growth Impllied arc elasticity
-1.5
-1
-0.5
0
0.5
1
1.5
2
2.5
3
2005 2006 2007 2008 2009 2010
Arc 15–24 (Average = 0.3)
Arc 24+ (Average = 0.86)

25
Figure 5. Arc Elasticities by Sectors
Source: ONS, WDI, Author calculation.
Figure 6. Recursive Estimates of Elasticities
Figure 7. Labor Market Flexibility in Algeria, 2008
-15
-10
-5
0
5
10
15
1 2 3 4 5 6 7 8
Agriculture (average = -2.2)
Industry (average = 3.7)
Services (average = 1.3)
0
0.4
0.8
1.2
1.6
1993–2004 1993–2005 1993–2006 1993–2007 1993–2008 1993–2009 1993–2010
Estimate Lower limit Upper limit
0
1
2
3
4
5
6
7
CEE Dynamic Asia MENA Latin America Oil Producers Algeria

26
Figure 8. Evolution of Labor Market Flexibility over Time
Figure 9. Elasticity Unemployment-Output
Panel A. Total Unemployment
4
4.5
5
5.5
2002 2003 2004 2005 2006 2007 2008
ALBALBALBALBALBALBALBALBALBALBALBALBALBALBALBALBALBALBALBALBALBALBALBALBALBALBALBALBALBALB
DZADZADZADZADZADZADZADZADZADZADZADZADZADZADZADZADZADZADZADZADZADZADZADZADZADZADZADZADZADZADZADZA
ARGARGARGARGARGARGARGARGARGARGARGARGARGARGARGARGARGARGARGARGARGARGARGARGARGARGARGARGARGARG
ARMARMARMARMARMARMARMARMARMARMARMARMARMARMARMARMARM
AUSAUSAUSAUSAUSAUSAUSAUSAUSAUSAUSAUSAUSAUSAUSAUSAUSAUSAUSAUSAUSAUSAUSAUSAUSAUSAUSAUSAUSAUS
AZEAZEAZEAZEAZEAZEAZE
BELBELBELBELBELBELBELBELBELBELBELBELBELBELBELBELBELBELBELBELBELBELBELBELBELBELBELBELBELBEL
BLZBLZBLZBLZBLZBLZBLZBLZBLZBLZBLZBLZBLZBLZBLZBLZBLZBLZBLZBLZBIHBIHBIHBIHBIHBIHBIHBIHBIHBIHBIHBIH
BGRBGRBGRBGRBGRBGRBGRBGRBGRBGRBGRBGRBGRBGRBGRBGRBGRBGRBGRBGRBGR
CANCANCANCANCANCANCANCANCANCANCANCANCANCANCANCANCANCANCANCANCANCANCANCANCANCANCANCANCANCAN
CHLCHLCHLCHLCHLCHLCHLCHLCHLCHLCHLCHLCHLCHLCHLCHLCHLCHLCHLCHLCHLCHLCHLCHLCHLCHLCHLCHLCHLCHL
CHNCHNCHNCHNCHNCHNCHNCHNCHNCHNCHNCHNCHNCHNCHNCHNCHNCHNCHNCHNCHNCHNCHNCHNCHNCHNCHNCHNCHNCHN
CRICRICRICRICRICRICRICRICRICRICRICRICRICRICRICRICRICRICRICRICRICRICRICRICRICRICRICRICRICRI
HRVHRVHRVHRVHRVHRVHRVHRVHRVHRVHRVHRVHRVHRVHRVHRVHRVHRVHRV
CYPCYPCYPCYPCYPCYPCYPCYPCYPCYPCYPCYPCYPCYPCYPCYPCYPCYPCYPCYPCYPCYPCYPCYPCYPCYPCYPCYP
CZECZECZECZECZECZECZECZECZECZECZECZECZECZECZE
DOMDOMDOMDOMDOMDOMDOMDOMDOMDOMDOMDOMDOMDOMDOMDOMDOMDOMDOMECUECUECUECUECUECUECUECUECUECUECUECUECUECUECUECUECUECUECUECUECUECU
EGYEGYEGYEGYEGYEGYEGYEGYEGYEGYEGYEGYEGYEGYEGYEGYEGYEGYEGYEGY
SLVSLVSLVSLVSLVSLVSLVSLVSLVSLVSLVSLVSLVSLVSLVSLVSLVSLVSLVSLVSLVSLV
ESTESTESTESTESTESTESTESTESTESTESTESTESTESTESTESTEST
FJIFJIFJIFJIFJIFJIFJIFJIFJIFJIFJIFJIFJIFJIFJIFJIFJIFJIFJIFJIFJIFJIFJIFJI
FINFINFINFINFINFINFINFINFINFINFINFINFINFINFINFINFINFINFINFINFINFINFINFINFINFINFINFINFINFIN
MKDMKDMKDMKDMKDMKDMKDMKDMKDMKDMKDMKDMKDMKDFRAFRAFRAFRAFRAFRAFRAFRAFRAFRAFRAFRAFRAFRAFRAFRAFRAFRAFRAFRAFRAFRAFRAFRAFRAFRAFRAFRAFRAFRA
GEOGEOGEOGEOGEOGEOGEOGEOGEOGEOGEOGEOGEOGEO
DEUDEUDEUDEUDEUDEUDEUDEUDEUDEUDEUDEUDEUDEUDEUDEUDEUDEUDEUDEUDEUDEUDEUDEUDEUDEUDEUDEUDEUDEU GRCGRCGRCGRCGRCGRCGRCGRCGRCGRCGRCGRCGRCGRCGRCGRCGRCGRCGRCGRCGRCGRCGRCGRCGRCGRCGRCGRCGRCGRC
HKGHKGHKGHKGHKGHKGHKGHKGHKGHKGHKGHKGHKGHKGHKGHKGHKGHKGHKGHKGHKGHKGHKGHKGHKGHKGHKGHKGHKGHKG
IRLIRLIRLIRLIRLIRLIRLIRLIRLIRLIRLIRLIRLIRLIRLIRLIRLIRLIRLIRLIRLIRLIRLIRLIRLIRLIRLIRLIRLIRL
IRNIRNIRNIRNIRNIRNIRNIRNIRNIRNIRNIRNIRNIRNIRNIRNIRNIRN
ISRISRISRISRISRISRISRISRISRISRISRISRISRISRISRISRISRISRISRISRISRISRISRISRISRISRISRISRISRISR
ITAITAITAITAITAITAITAITAITAITAITAITAITAITAITAITAITAITAITAITAITAITAITAITAITAITAITAITAITAITA
JAMJAMJAMJAMJAMJAMJAMJAMJAMJAMJAMJAMJAMJAMJAMJAMJAMJAMJAMJAMJAMJAMJAMJAMJAMJAMJAMJAMJAMJAMJORJORJORJORJORJORJORJORJORJORJORJORJORJORJORJORJORJORJORJORJORJORJORJORJORJOR
KAZKAZKAZKAZKAZKAZKAZKAZKAZKAZKAZKAZKAZKAZKAZKAZ
KORKORKORKORKORKORKORKORKORKORKORKORKORKORKORKORKORKORKORKORKORKORKORKORKORKORKORKORKORKOR KGZKGZKGZKGZKGZKGZKGZKGZKGZKGZKGZKGZKGZKGZKGZKGZ
LVALVALVALVALVALVALVALVALVALVALVALVALVALVALVALVALVA
LTULTULTULTULTULTULTULTULTULTULTULTULTULTULTULTULTU
MYSMYSMYSMYSMYSMYSMYSMYSMYSMYSMYSMYSMYSMYSMYSMYSMYSMYSMYSMYSMYSMYSMYSMYSMYS
MLTMLTMLTMLTMLTMLTMLTMLTMLTMLTMLTMLTMLTMLTMLTMLTMLTMLTMLTMLTMLTMLTMLTMLTMLTMLTMLT
MUSMUSMUSMUSMUSMUSMUSMUSMUSMUSMUSMUSMUSMUSMUSMUSMUSMUSMUSMUSMUSMUSMUSMUSMUSMUSMUS
MEXMEXMEXMEXMEXMEXMEXMEXMEXMEXMEXMEXMEXMEXMEXMEXMEXMEXMEXMEXMEXMEXMEXMEXMEXMEXMEXMEXMEXMEX
MDAMDAMDAMDAMDAMDAMDAMDAMDAMDAMDAMDAMDAMDAMDAMDAMDA
MNGMNGMNGMNGMNGMNGMNGMNGMNGMNGMNGMNGMNGMNGMNGMNGMNGMNGMNGMNGMNGMNEMNEMNEMNEMNEMNEMNE
MARMARMARMARMARMARMARMARMARMARMARMARMARMAR
NLDNLDNLDNLDNLDNLDNLDNLDNLDNLDNLDNLDNLDNLDNLDNLDNLDNLDNLDNLDNLDNLDNLDNLDNLDNLDNLDNLDNLDNLD
NZLNZLNZLNZLNZLNZLNZLNZLNZLNZLNZLNZLNZLNZLNZLNZLNZLNZLNZLNZLNZLNZLNZLNZLNZLNZLNZLNZLNZLNZL
NICNICNICNICNICNICNICNICNICNICNICNICNICNICNICNICNICNICNICNICNICNICNICNICNICNICNICNICNICNIC
NGANGANGANGANGANGANGANGANGANGANGANGANGANGANGANGANGANGANGANGANGA
NORNORNORNORNORNORNORNORNORNORNORNORNORNORNORNORNORNORNORNORNORNORNORNORNORNORNORNORNORNOR
PANPANPANPANPANPANPANPANPANPANPANPANPANPANPANPANPANPANPANPANPANPANPANPANPANPANPANPANPANPAN
PERPERPERPERPERPERPERPERPERPERPERPERPERPERPERPERPERPERPERPERPERPERPERPERPERPERPERPERPERPER
PHLPHLPHLPHLPHLPHLPHLPHLPHLPHLPHLPHLPHLPHLPHLPHLPHLPHLPHLPHLPHLPHLPHLPHLPHL
POLPOLPOLPOLPOLPOLPOLPOLPOLPOLPOLPOLPOLPOLPOLPOLPOLPOLPOLPOL
PRTPRTPRTPRTPRTPRTPRTPRTPRTPRTPRTPRTPRTPRTPRTPRTPRTPRTPRTPRTPRTPRTPRTPRTPRTPRTPRTPRTPRTPRT
ROUROUROUROUROUROUROUROUROUROUROUROUROUROUROUROUROUROUROUROUROUROUROUROUROU
RUSRUSRUSRUSRUSRUSRUSRUSRUSRUSRUSRUSRUSRUSRUSRUSRUSRUSSGPSGPSGPSGPSGPSGPSGPSGPSGPSGPSGPSGPSGPSGPSGPSGPSGPSGPSGPSGPSGPSGPSGPSGPSGPSGPSGPSGPSGPSGP
SVKSVKSVKSVKSVKSVKSVKSVKSVKSVKSVKSVKSVKSVKSVKSVKSVK
SVNSVNSVNSVNSVNSVNSVNSVNSVNSVNSVNSVNSVNSVNSVNSVNSVNSVN
ZAFZAFZAFZAFZAFZAFZAFZAFZAFZAFZAFZAFZAFZAFZAFZAFZAFZAFZAFZAFZAFZAFZAFZAFZAFZAFZAFZAFZAFZAF
ESPESPESPESPESPESPESPESPESPESPESPESPESPESPESPESPESPESPESPESPESPESPESPESPESPESPESPESPESPESP
LKALKALKALKALKALKALKALKALKALKALKALKALKALKALKALKALKALKALKALKA
SYRSYRSYRSYRSYRSYRSYRSYRSYRSYRSYRSYR
TWNTWNTWNTWNTWNTWNTWNTWNTWNTWNTWNTWNTWNTWNTWNTWNTWNTWNTWNTWNTWNTWNTWNTWNTWNTWNTWNTWNTWNTWN
THATHATHATHATHATHATHATHATHATHATHATHATHATHATHATHATHATHATHATHATHATHA BHSBHSBHSBHSBHSBHSBHSBHSBHSBHSBHSBHSBHSBHSBHSBHSBHSBHSBHSBHSBHSBHSBHSBHS
TTOTTOTTOTTOTTOTTOTTOTTOTTOTTOTTOTTOTTOTTOTTOTTOTTOTTOTTOTTOTTOTTOTTOTTOTTOTTOTTOTTOTTO
TUNTUNTUNTUNTUNTUNTUNTUNTUNTUNTUNTUNTUNTUNTUNTUNTUNTUNTUNTUN
TURTURTURTURTURTURTURTURTURTURTURTURTURTURTURTURTURTURTURTURTURTURTURTURTURTURTURTURTURTUR
UKRUKRUKRUKRUKRUKRUKRUKRUKRUKRUKRUKRUKRUKRUKRUKRUKR
GBRGBRGBRGBRGBRGBRGBRGBRGBRGBRGBRGBRGBRGBRGBRGBRGBRGBRGBRGBRGBRGBRGBRGBRGBRGBRGBRGBRGBRGBR
USAUSAUSAUSAUSAUSAUSAUSAUSAUSAUSAUSAUSAUSAUSAUSAUSAUSAUSAUSAUSAUSAUSAUSAUSAUSAUSAUSAUSAUSA
URYURYURYURYURYURYURYURYURYURYURYURYURYURYURYURYURYURYURYURYURYURYURYURYURYURYURY
VNMVNMVNMVNMVNMVNMVNMVNMVNMVNMVNMVNMVNMVNMVNMVNMVNMVNMVNMVNM
-2-1
01
Ela
stic
ity u
nem
ploy
men
t-out
put
4 6 8 10Labor market flexibility
27
Panel B. Youth Unemployment
Figure 10. Labor Market Flexibility and Medium-term Unemployment Panel A. Total Unemployment]
Panel B. Youth Unemployment
ALB
DZA
ARG
ARM
AUS
AUT
AZE
BEL
BLZBIH
BGR
CAN
CHL
CHN
COL
CRI
HRV
CYP
CZE
DOMECU
EGY
SLV
EST
FJI
FIN
MKDFRA
GEO
DEU GRC
HND
HKG
IRL
IRN
ISR
ITA
JAM
JPN
JOR
KAZ
KOR KGZ
LVA
LTU
LUX
MYS
MLT
MUSMEX
MDA
MNGMNE
MAR
NLD
NZL
NIC
NGA
NOR
PAK
PAN
PER
PHL
POL
PRT
ROU
RUSSGP
SVK
SVN
ZAF
ESP
LKASYR
TWN
THA BHS
TTO
TUN
TUR
UKRGBR
USA
URY
VNM
-2-1
01
2Ela
stic
ity y
out
h un
empl
oym
ent
-outp
ut
4 6 8 10Labor market flexibility
0
2
4
6
8
10
2010 2011 2012 2013 2014 2015 2016
Unemployment (baseline: 5 percent growth)
Unemployment (reform & 5 percent growth)
Unemployment (7 percent growth)
16
18
20
22
2010 2011 2012 2013 2014 2015 2016
Youth Unemployment (baseline: 5 percent growth)
Youth Unemployment (reform & 5 percent growth)
Youth Unemployment (7 percent growth)