Embed Size (px)
DESCRIPTION
chapter Unemployment
Citation preview
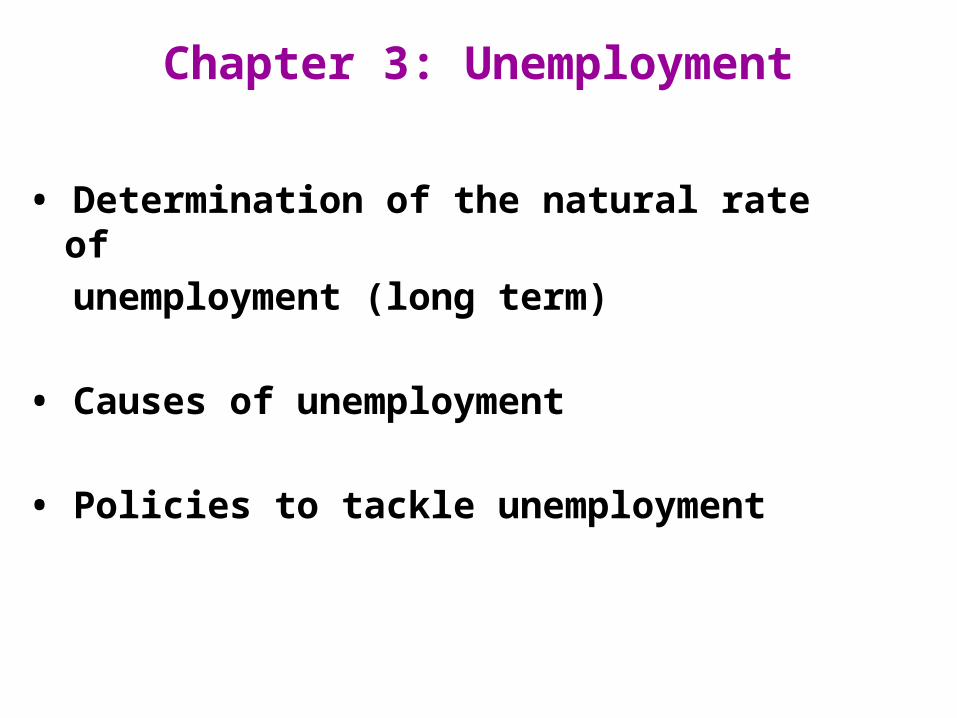
Chapter 3: Unemployment
• Determination of the natural rate of
unemployment (long term)
• Causes of unemployment
• Policies to tackle unemployment
2CHAPTER 6 Unemployment
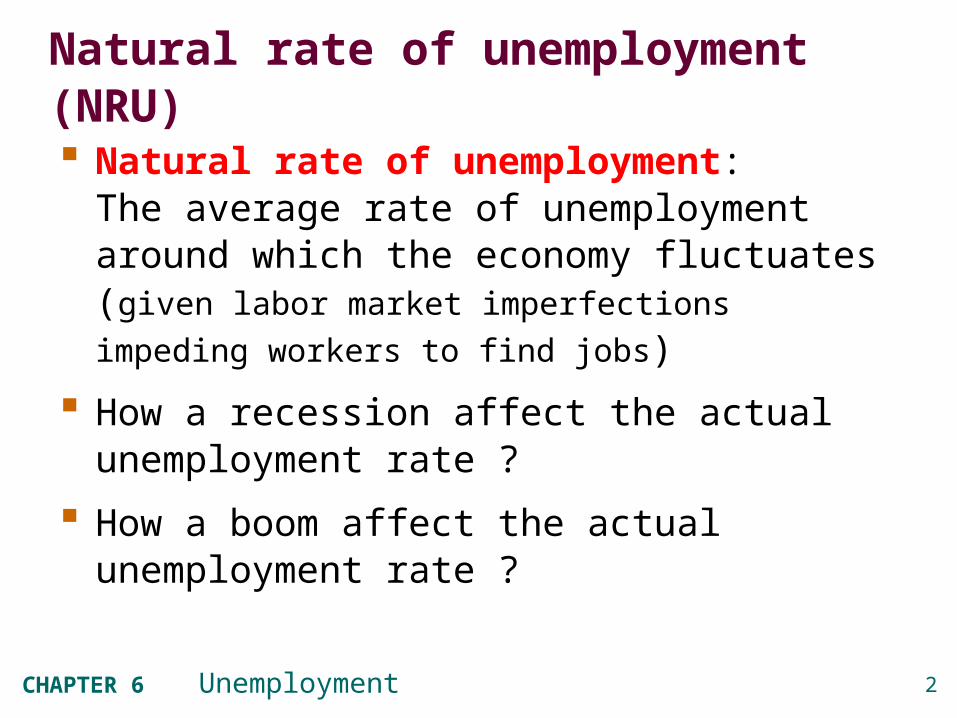
Natural rate of unemployment (NRU) Natural rate of unemployment:
The average rate of unemployment around which the economy fluctuates (given labor market
imperfections impeding workers to find jobs)
How a recession affect the actual unemployment rate ?
How a boom affect the actual unemployment rate ?
3CHAPTER 6 Unemployment
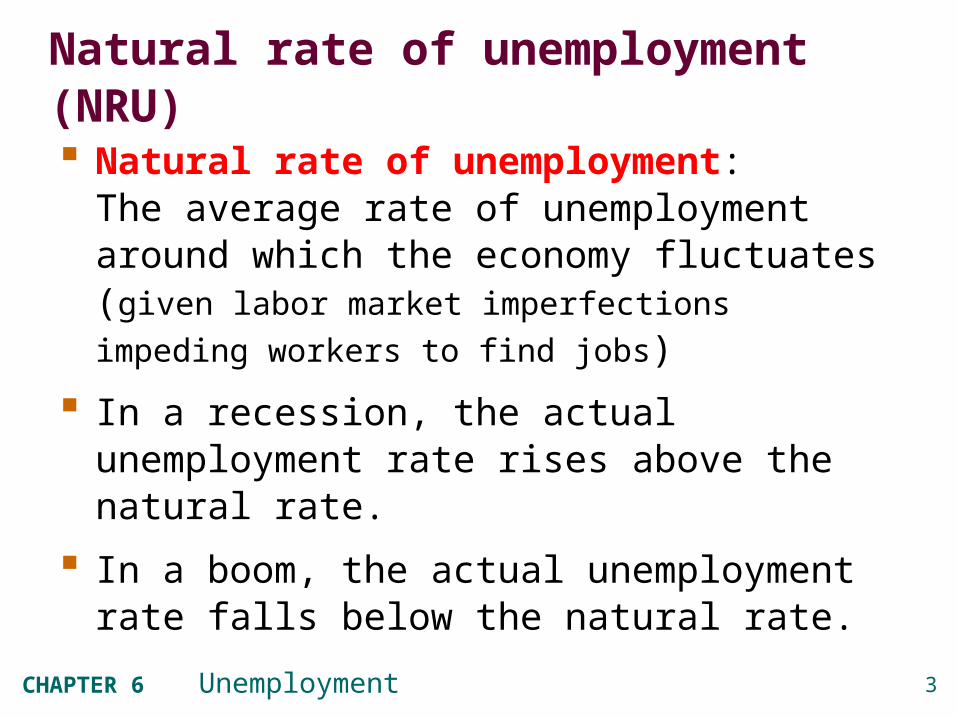
Natural rate of unemployment (NRU) Natural rate of unemployment:
The average rate of unemployment around which the economy fluctuates (given labor market
imperfections impeding workers to find jobs)
In a recession, the actual unemployment rate rises above the natural rate.
In a boom, the actual unemployment rate falls below the natural rate.
1960 1965 1970 1975 1980 1985 1990 1995 2000 2005 20100
2
4
6
8
10
12
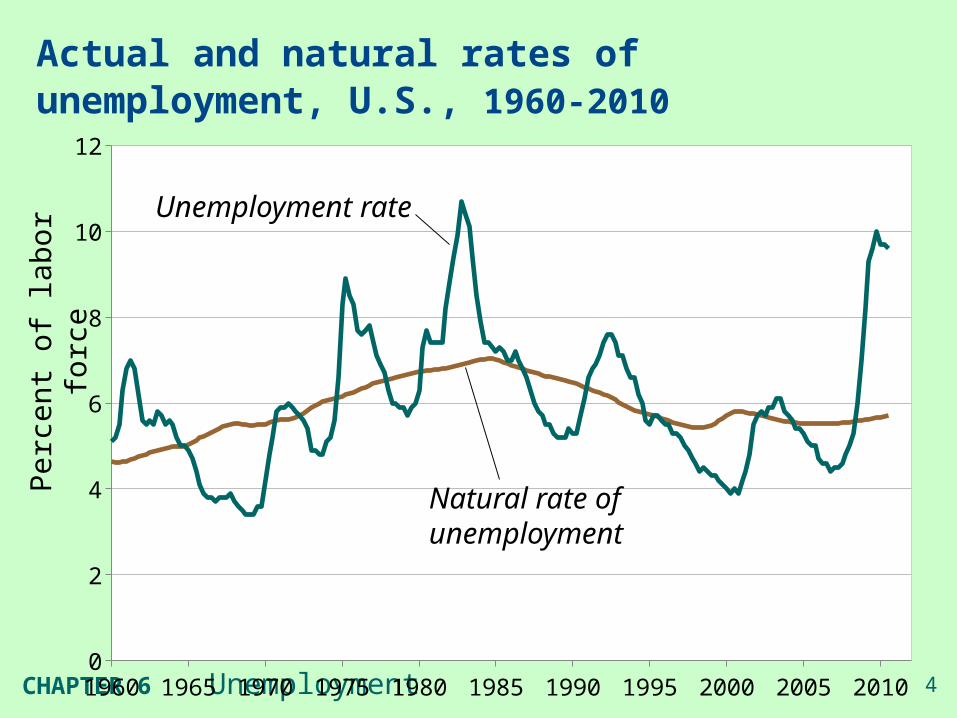
Actual and natural rates of unemployment, U.S., 1960-2010
Per
cent
of l
abor
forc
e Unemployment rate
Natural rate of unemployment
5CHAPTER 6 Unemployment
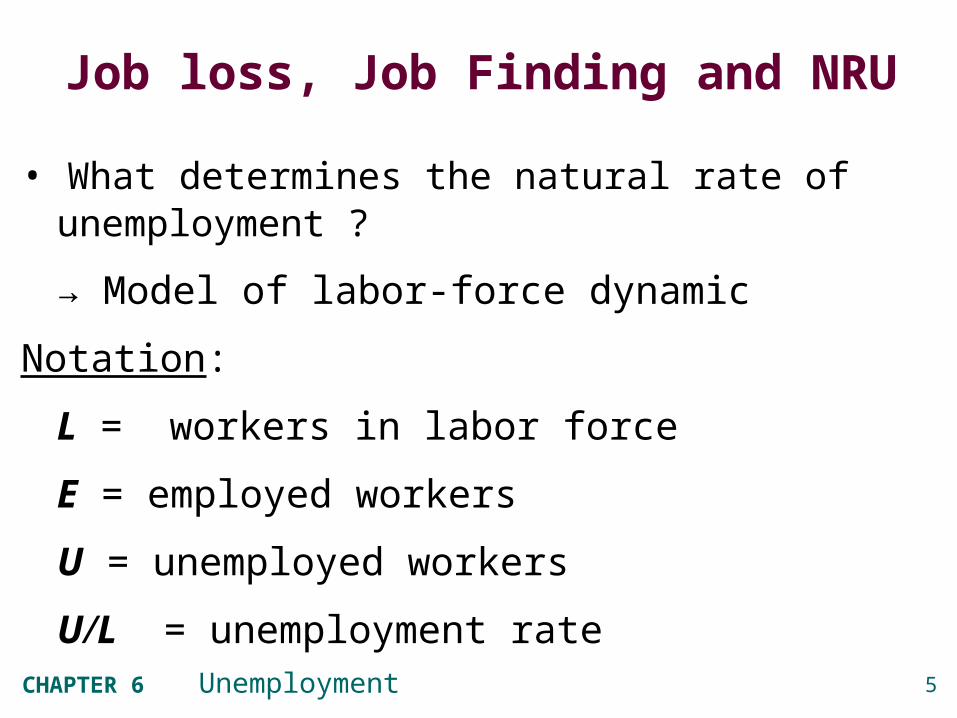
Job loss, Job Finding and NRU
• What determines the natural rate of unemployment ?
→ Model of labor-force dynamic
Notation:
L = workers in labor force
E = employed workers
U = unemployed workers
U/L = unemployment rate

6CHAPTER 6 Unemployment
Assumptions:
1. L is exogenously fixed.
2. During any given month,
s = rate of job separations, the fraction of employed workers that become separated from their jobs
f = rate of job finding, fraction of unemployed workers that find jobs
s and f are exogenous

7CHAPTER 6 Unemployment
The transitions between employment and unemployment
Employed Unemployed
s E
f U

8CHAPTER 6 Unemployment
Finding the “equilibrium” U rate
f U ( job finders) = s E (job losers)
= s (L – U )
= s L – s U
Solve for U/L:
(f + s) U = s L
so,
U s
L s f
• If the unemployment rate is neither rising nor falling

9CHAPTER 6 Unemployment
Example:
Each month, 1% of employed workers lose their jobs
(s = 0.01) 19% of unemployed workers find jobs
(f = 0.19)
Find the natural rate of unemployment ?
10CHAPTER 6 Unemployment
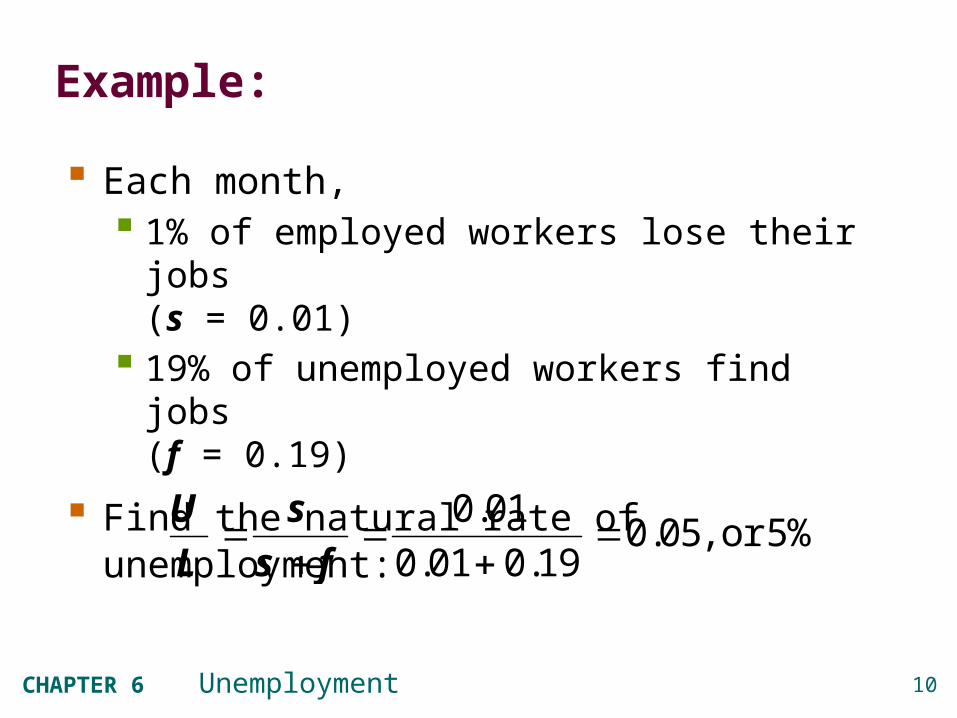
Example:
Each month, 1% of employed workers lose their jobs
(s = 0.01) 19% of unemployed workers find jobs
(f = 0.19)
Find the natural rate of unemployment:
0 010 05, or 5%
0 01 0 19
U sL s f
..
. .
11CHAPTER 6 Unemployment
Policy implication
From
We get
Question: What kind of policy can reduce the unemployment rate ?
12CHAPTER 6 Unemployment
Policy implication
A policy will reduce the natural rate of unemployment only:
if it lowers s : the rate of job separation
or if it increases f : the rate of job finding
13CHAPTER 6 Unemployment
Why is there unemployment in the first place ?
If job finding were instantaneous (f = 1), then the natural rate of unemployment would be near zero.
There are two reasons why f < 1: ??
14CHAPTER 6 Unemployment
Why is there unemployment in the first place ?
If job finding were instantaneous (f = 1), then the natural rate of unemployment would be near zero.
There are two reasons why f < 1:1. job search
2. wage rigidity
15CHAPTER 6 Unemployment
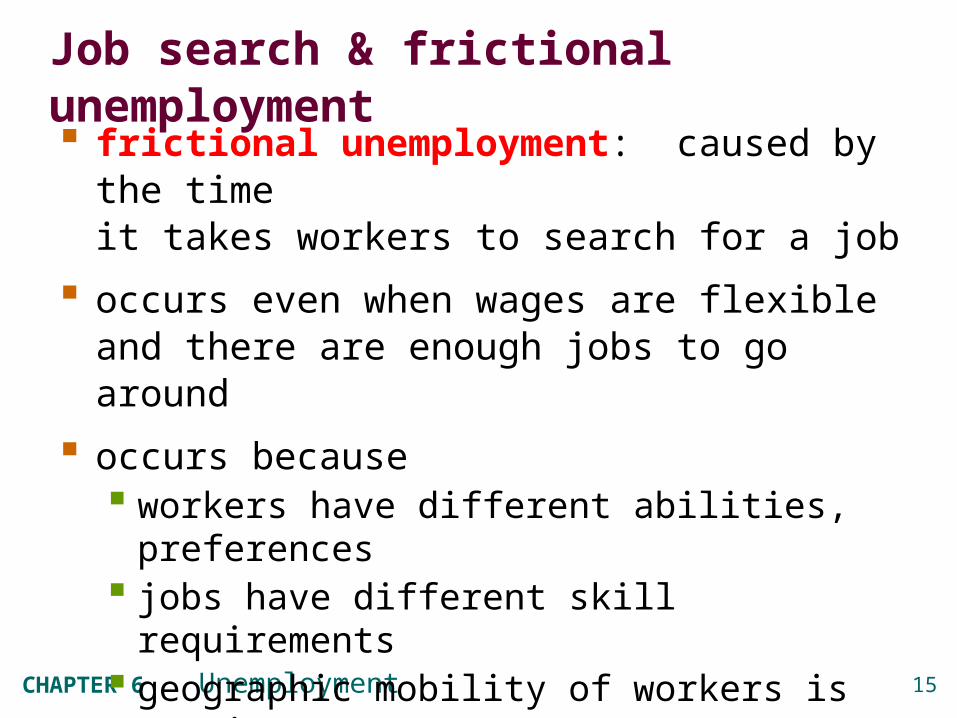
Job search & frictional unemployment frictional unemployment: caused by the time
it takes workers to search for a job
occurs even when wages are flexible and there are enough jobs to go around
occurs because workers have different abilities, preferences jobs have different skill requirements geographic mobility of workers is not
instantaneous flow of information about vacancies and job
candidates is imperfect
16CHAPTER 6 Unemployment
Sectoral shifts and unemployment (I)
The demand for goods and services vary over time…..
…. So How does it affect the labor market ?

17CHAPTER 6 Unemployment
Sectoral shifts and unemployment (I)
The demand for goods and services vary over time…..
…. So does the demand for labor that produces these goods
18CHAPTER 6 Unemployment
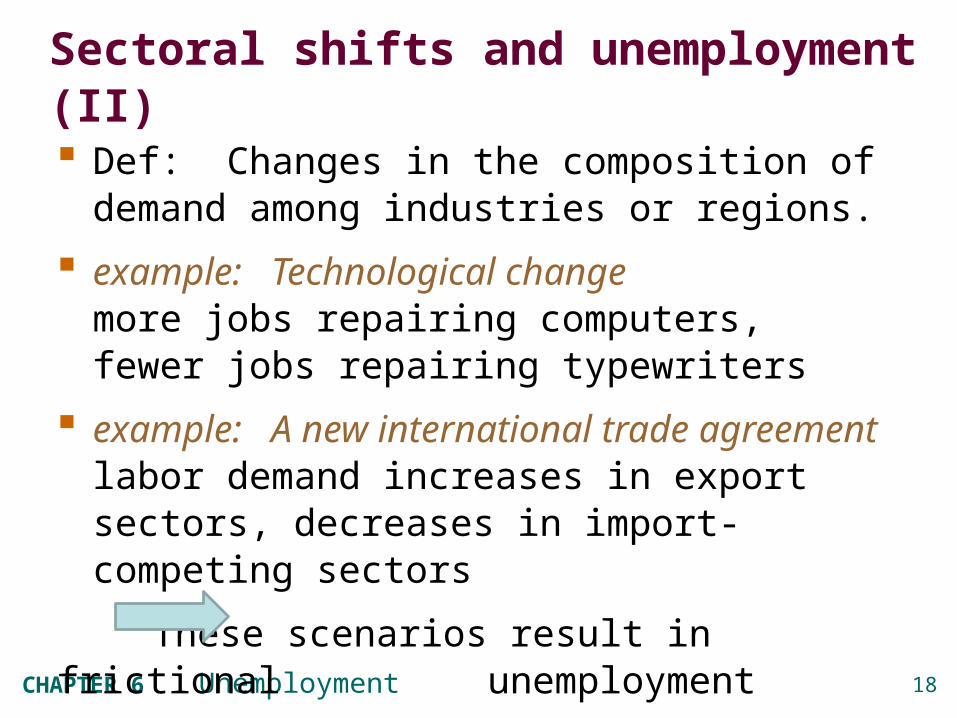
Def: Changes in the composition of demand among industries or regions.
example: Technological change more jobs repairing computers, fewer jobs repairing typewriters
example: A new international trade agreement labor demand increases in export sectors, decreases in import-competing sectors
These scenarios result in frictional unemployment
Sectoral shifts and unemployment (II)
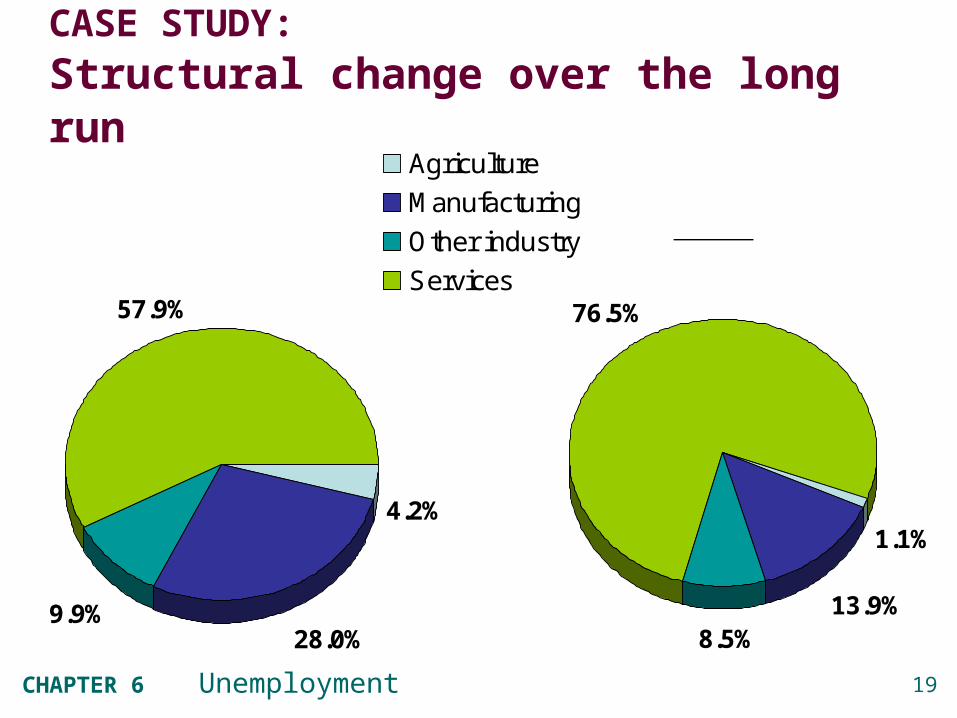
CASE STUDY: Structural change over the long run
4.2%
28.0%9.9%
57.9%
Agriculture
Manufacturing
Other industry
Services
1960
1.1%
13.9%8.5%
76.5%
2006
20CHAPTER 6 Unemployment
More examples of sectoral shifts
Industrial revolution (1800s): agriculture declines, manufacturing soars
Energy crisis (1970s): demand shifts from larger cars to smaller ones
In our dynamic economy, smaller sectoral shifts occur frequently, contributing to frictional unemployment.
21CHAPTER 6 Unemployment
Public policy and job search
Question:
What can governments do to tackle
frictional unemployment ?
22CHAPTER 6 Unemployment
Public policy and job search
Govt programs affecting unemployment include: Govt employment agencies
disseminate info about job openings to better match workers & jobs.
Public job training programshelp workers displaced from declining industries get skills needed for jobs in growing industries.

23CHAPTER 6 Unemployment
Case study Unemployment insurance (UI) UI pays part of a worker’s former wages for a
limited time after losing his/her job.
Studies: (Woodbury et al.(1987)):
- The longer a worker is eligible for UI, the longer the duration of the average spell of
unemployment
- The probability of a person finding a job more than double when its benefits run out
Why ??
24CHAPTER 6 Unemployment
UI increases unemployment because it reduces the opportunity cost of being unemployed the urgency of finding work
Case study Unemployment insurance (UI)
25CHAPTER 6 Unemployment
What are the Benefits of UI ?

26CHAPTER 6 Unemployment
By allowing workers more time to search,
UI may lead to better matches between jobs and workers, which would lead to greater productivity and higher incomes
Benefits of UI

27CHAPTER 6 Unemployment
Why is there unemployment?
Two reasons why f < 1:
1. job search
2. wage rigidity
U sL s f
The natural rate of unemployment:
28CHAPTER 6 Unemployment
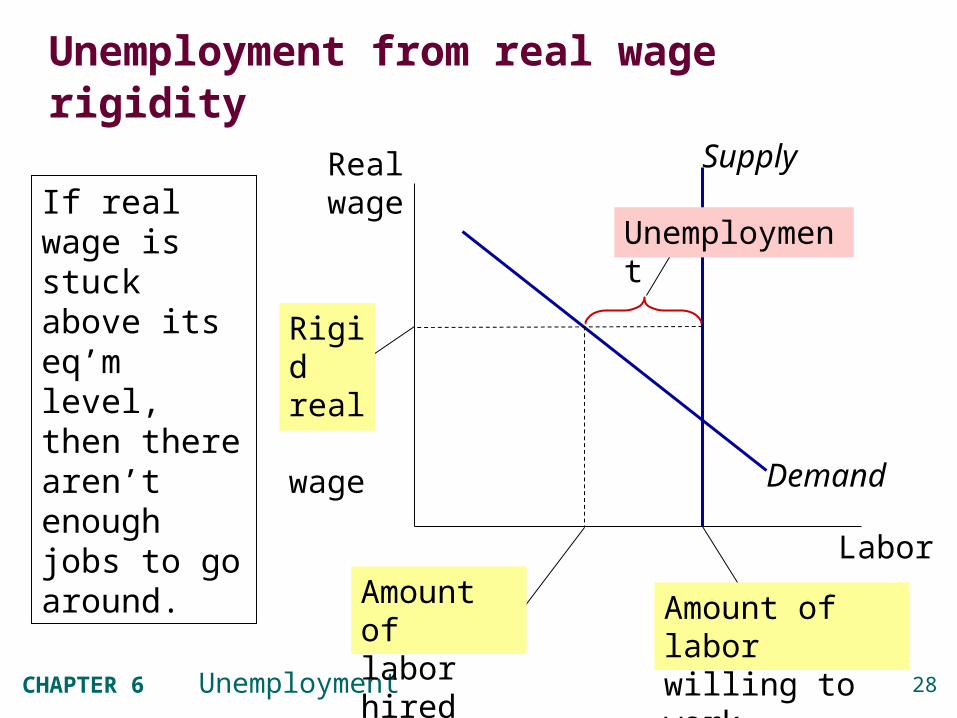
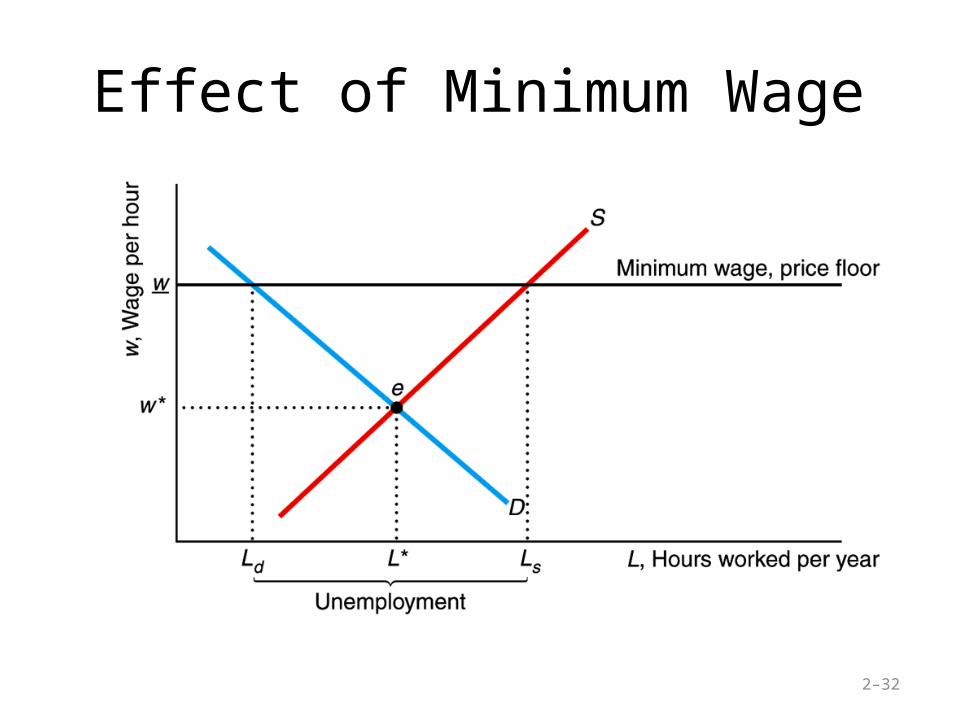
Unemployment from real wage rigidity
Labor
Real wage
Supply
Demand
Unemployment
Rigid
real wage
Amount of labor willing to work
Amount of labor hired
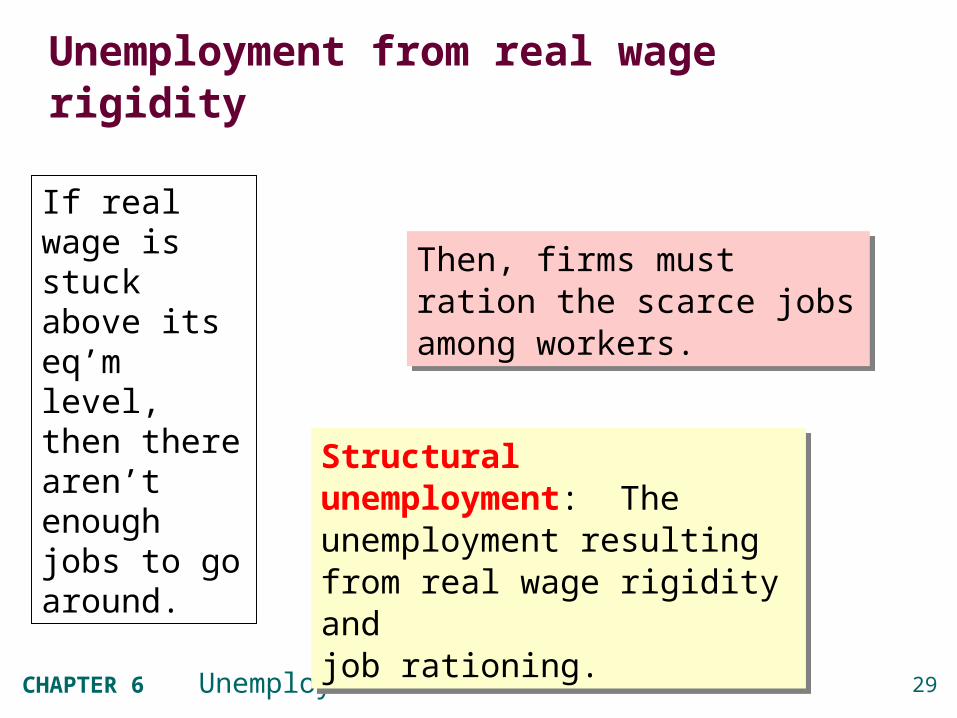
If real wage is stuck above its eq’m level, then there aren’t enough jobs to go around.
29CHAPTER 6 Unemployment
Unemployment from real wage rigidity
Then, firms must ration the scarce jobs among workers.
Then, firms must ration the scarce jobs among workers.
Structural unemployment: The unemployment resulting from real wage rigidity and job rationing.
Structural unemployment: The unemployment resulting from real wage rigidity and job rationing.
If real wage is stuck above its eq’m level, then there aren’t enough jobs to go around.
30CHAPTER 6 Unemployment
Reasons for wage rigidity
1. Minimum wage laws
2. Efficiency wages
3. Unions power

31CHAPTER 6 Unemployment
1. The minimum wage
The min. wage may exceed the equilibrium wage of unskilled workers, especially teenagers.
Studies (Brown (1988), Journal of Economic Perspective): a 10% increase in min. wage reduces teen employment by 1-3%
But !!! the min. wage cannot explain the majority of the natural rate of employment, as most workers’ wages are well above the min. wage
2–32
Effect of Minimum Wage
33CHAPTER 6 Unemployment
2. Efficiency wage theory
Theory in which higher wages increase worker productivity
Idea: A firm operates more efficiently if it pays its workers a high wage
“Efficiency wage theory”
34CHAPTER 6 Unemployment
2. Efficiency wage theory
Theory in which higher wages increase worker productivity
How ? By which mechanisms ?

35CHAPTER 6 Unemployment
2. Efficiency wage theory
Theory in which higher wages increase worker productivity by: attracting higher quality job applicants increasing worker effort, reducing “shirking” reducing turnover (workers leave because wages are
low), which is costly to firms improving health of workers
(in developing countries)
Firms are willing to pay aboveequilibrium wages to raise productivity
Structural unemployment !!
36CHAPTER 6 Unemployment

TREND: The natural rate rises over 1960-84, then falls over 1985-2005
1960 1965 1970 1975 1980 1985 1990 1995 2000 2005 20103
4
5
6
7
8
9
Per
cent
of l
abor
forc
e
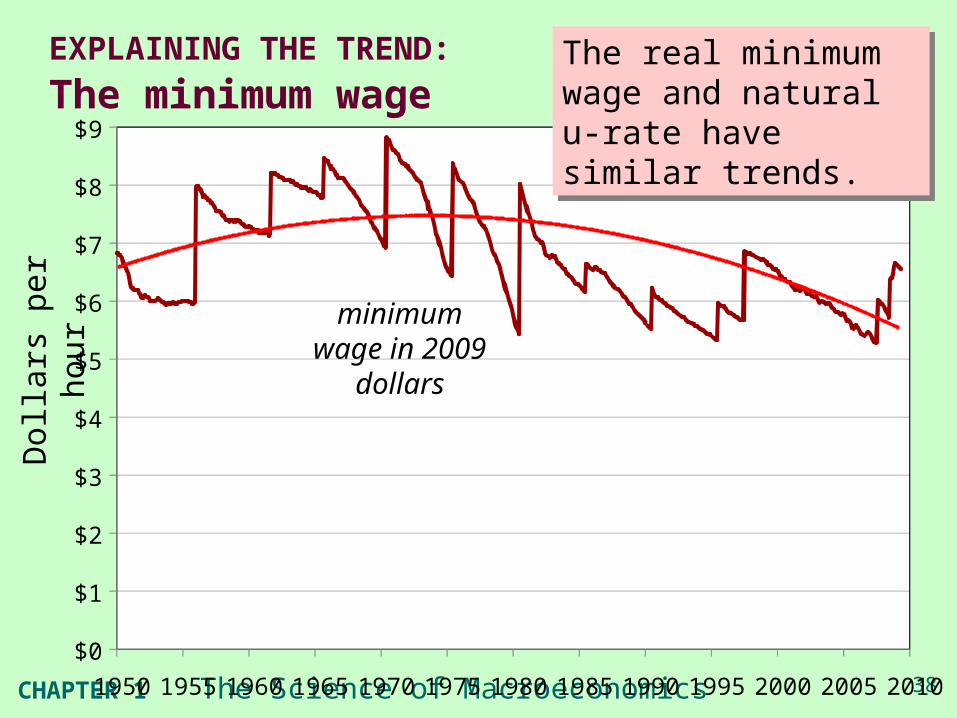
EXPLAINING THE TREND:
The minimum wage
Dol
lars
per
hou
r
$0
$1
$2
$3
$4
$5
$6
$7
$8
$9
1950 1955 1960 1965 1970 1975 1980 1985 1990 1995 2000 2005 2010
minimum wage in 2009 dollars
The real minimum wage and natural u-rate have similar trends.
The real minimum wage and natural u-rate have similar trends.
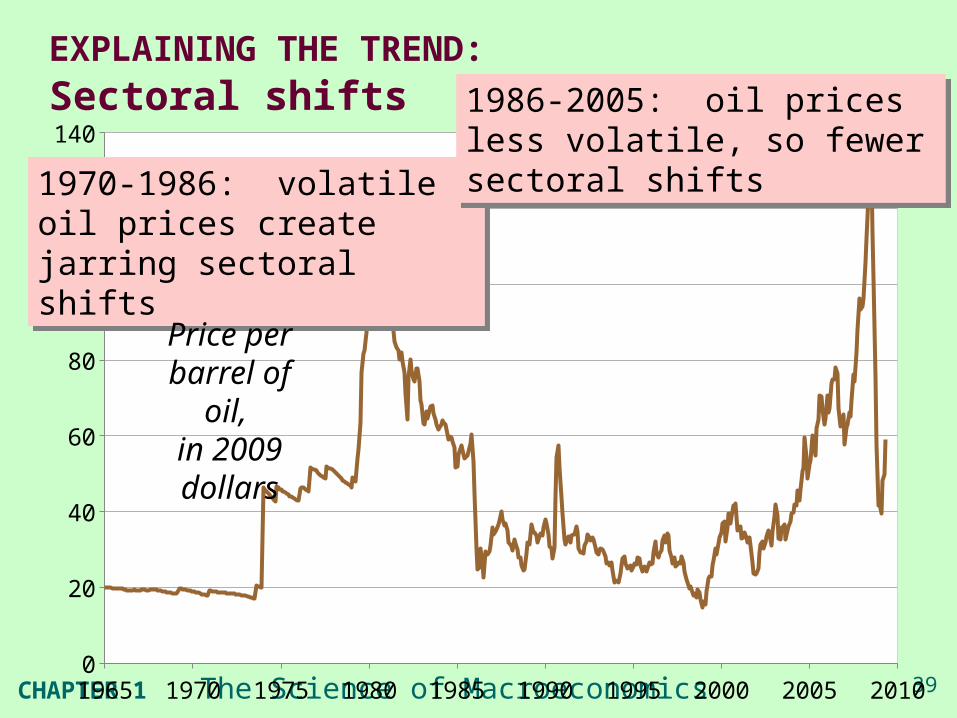
EXPLAINING THE TREND: Sectoral shifts
1965 1970 1975 1980 1985 1990 1995 2000 2005 20100
20
40
60
80
100
120
140
1970-1986: volatile oil prices create jarring sectoral shifts1970-1986: volatile oil prices create jarring sectoral shifts
1986-2005: oil prices less volatile, so fewer sectoral shifts1986-2005: oil prices less volatile, so fewer sectoral shifts
Price per barrel of oil,
in 2009 dollars
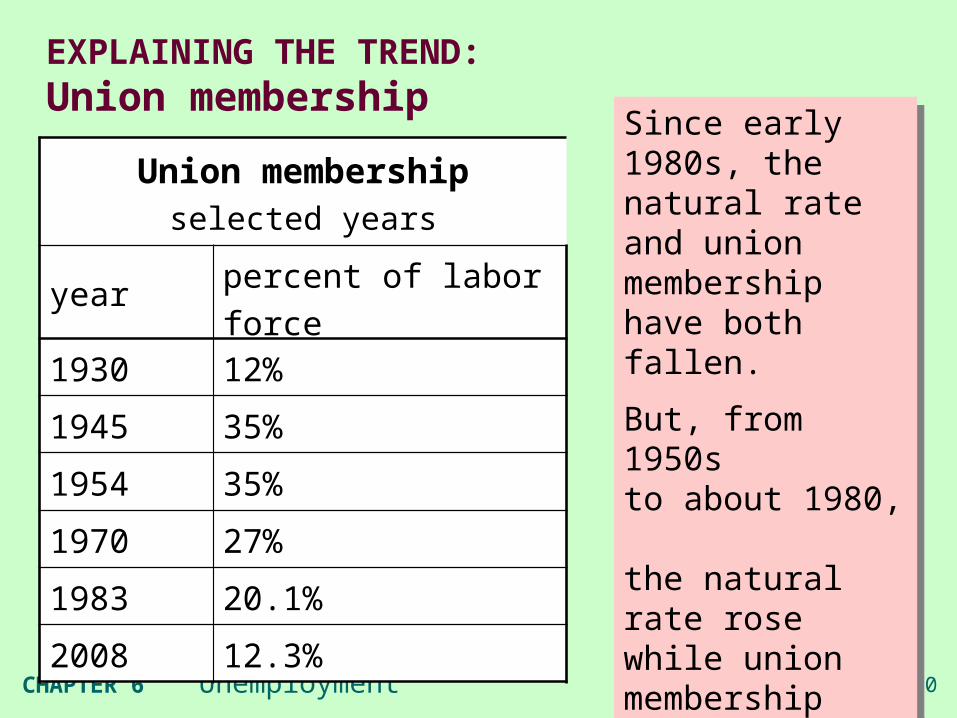
EXPLAINING THE TREND:Union membership
Since early 1980s, the natural rate and union membership have both fallen.
But, from 1950s to about 1980, the natural rate rose while union membership fell.
Since early 1980s, the natural rate and union membership have both fallen.
But, from 1950s to about 1980, the natural rate rose while union membership fell.
Union membershipselected years
year percent of labor force
1930 12%
1945 35%
1954 35%
1970 27%
1983 20.1%
2008 12.3%
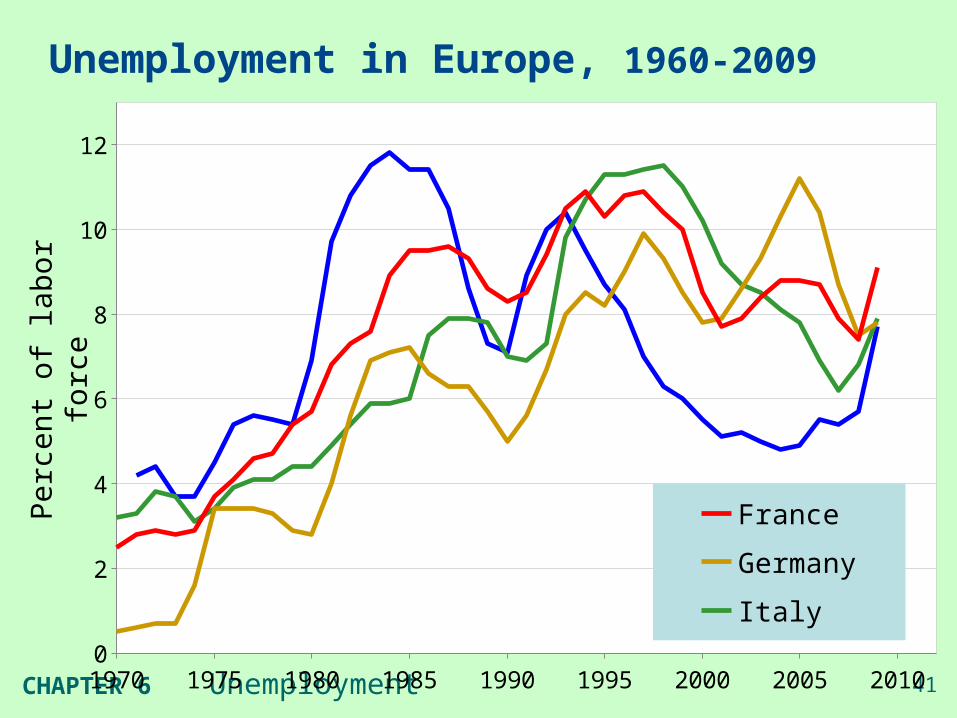
Unemployment in Europe, 1960-2009P
erce
nt o
f lab
or fo
rce
1970 1975 1980 1985 1990 1995 2000 2005 20100
2
4
6
8
10
12
FranceGermanyItalyUnited Kingdom
42CHAPTER 6 Unemployment
Why unemployment rose in Europe but not the U.S.Shock
Technological progress has shifted labor demand from unskilled to skilled workers in recent decades.
Effect in United StatesAn increase in the “skill premium” – the wage gap between skilled and unskilled workers.
Effect in Europe
Higher unemployment: Why ?

43CHAPTER 6 Unemployment
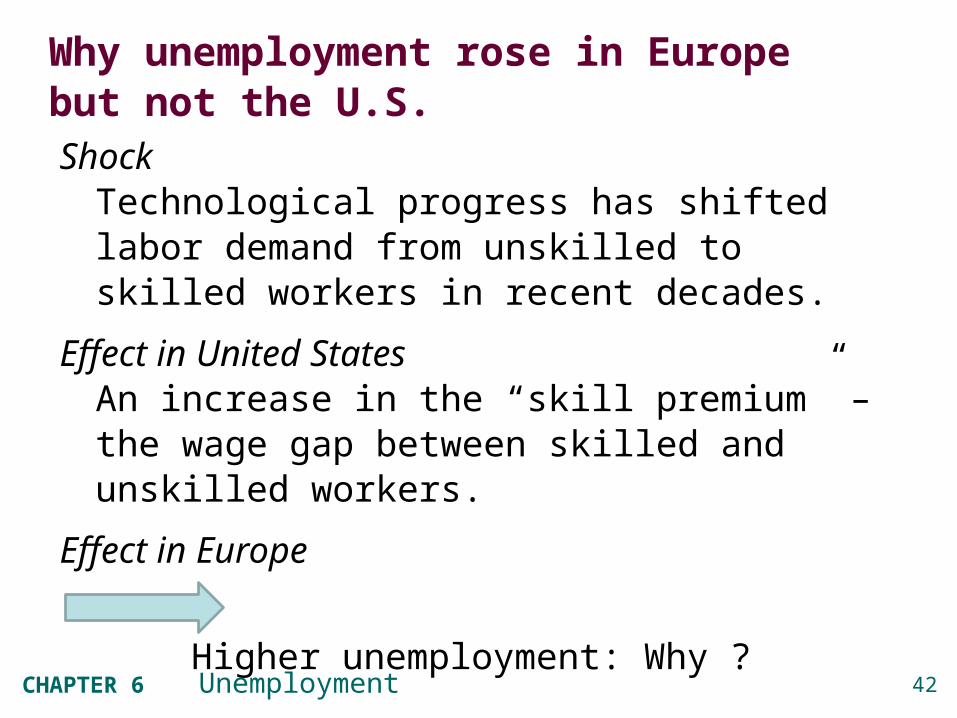
Why unemployment rose in Europe but not the U.S.Shock
Technological progress has shifted labor demand from unskilled to skilled workers in recent decades.
Effect in United StatesAn increase in the “skill premium” – the wage gap between skilled and unskilled workers.
Effect in EuropeHigher unemployment, due to generous govt benefits for unemployed workers and strong union presence and minimum wage laws (France)
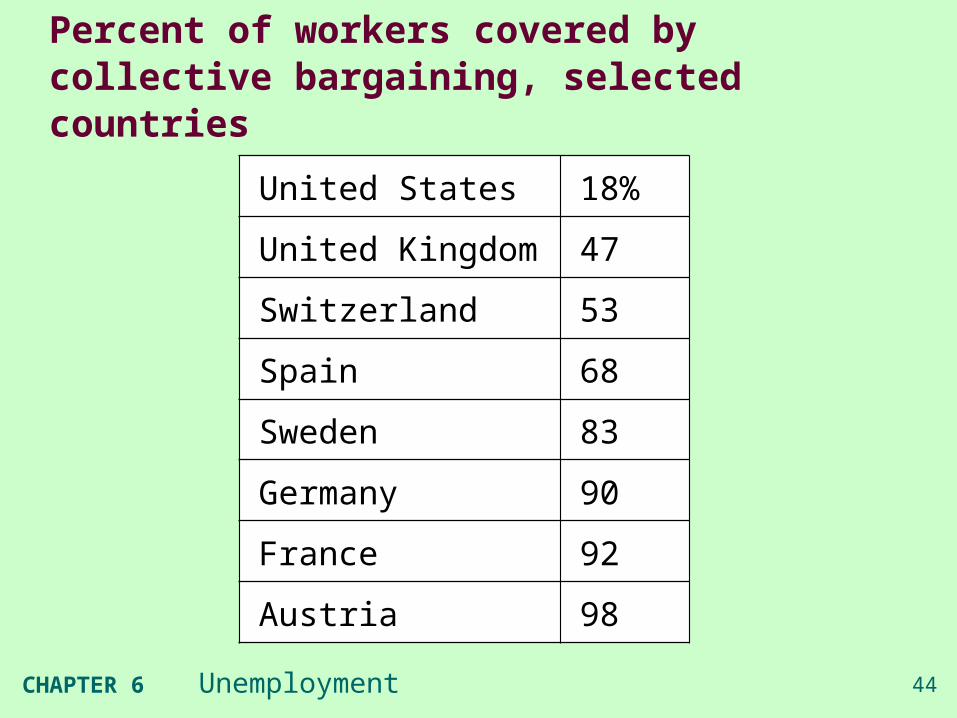
Percent of workers covered by collective bargaining, selected countries
United States 18%
United Kingdom 47
Switzerland 53
Spain 68
Sweden 83
Germany 90
France 92
Austria 98

45CHAPTER 6 Unemployment


47CHAPTER 6 Unemployment
Case study
“Minimum wage: a poor way to reduce poverty”, Cato Institute