Embed Size (px)
Citation preview

Trends and Prospects
UNECE Committee on Forests and the
Forest Industry
November 3, 2015
Prepared by:
Policy, Economics and Industry Branch
Canadian Forest Service
Natural Resources Canada
November 2015
November 2015
1
CANADA
I. An Economic Overview
General Economic Conditions
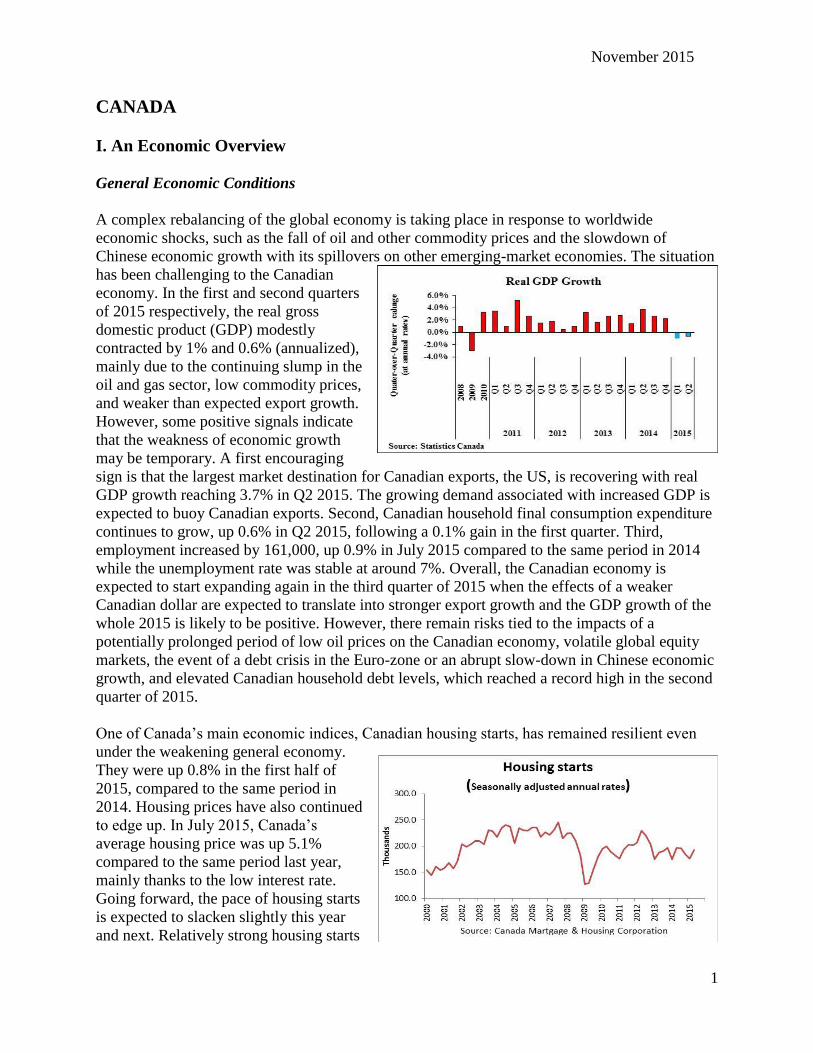
A complex rebalancing of the global economy is taking place in response to worldwide
economic shocks, such as the fall of oil and other commodity prices and the slowdown of
Chinese economic growth with its spillovers on other emerging-market economies. The situation
has been challenging to the Canadian
economy. In the first and second quarters
of 2015 respectively, the real gross
domestic product (GDP) modestly
contracted by 1% and 0.6% (annualized),
mainly due to the continuing slump in the
oil and gas sector, low commodity prices,
and weaker than expected export growth.
However, some positive signals indicate
that the weakness of economic growth
may be temporary. A first encouraging
sign is that the largest market destination for Canadian exports, the US, is recovering with real
GDP growth reaching 3.7% in Q2 2015. The growing demand associated with increased GDP is
expected to buoy Canadian exports. Second, Canadian household final consumption expenditure
continues to grow, up 0.6% in Q2 2015, following a 0.1% gain in the first quarter. Third,
employment increased by 161,000, up 0.9% in July 2015 compared to the same period in 2014
while the unemployment rate was stable at around 7%. Overall, the Canadian economy is
expected to start expanding again in the third quarter of 2015 when the effects of a weaker
Canadian dollar are expected to translate into stronger export growth and the GDP growth of the
whole 2015 is likely to be positive. However, there remain risks tied to the impacts of a
potentially prolonged period of low oil prices on the Canadian economy, volatile global equity
markets, the event of a debt crisis in the Euro-zone or an abrupt slow-down in Chinese economic
growth, and elevated Canadian household debt levels, which reached a record high in the second
quarter of 2015.
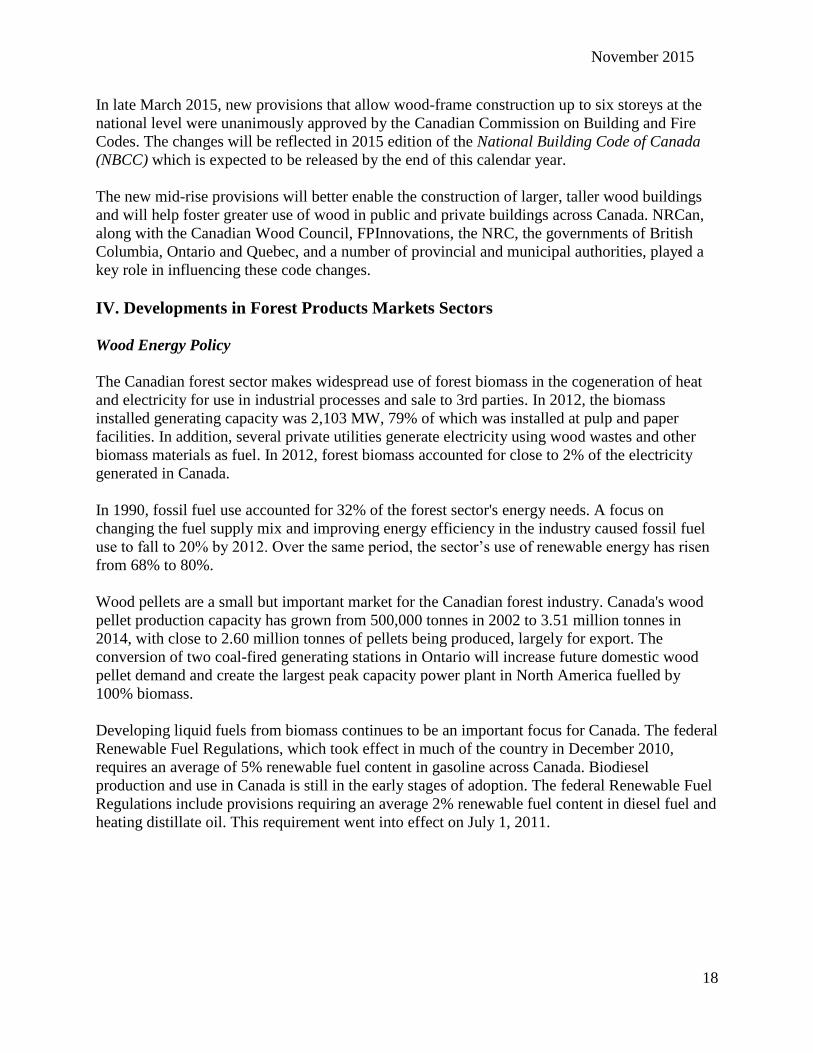
One of Canada’s main economic indices, Canadian housing starts, has remained resilient even
under the weakening general economy.
They were up 0.8% in the first half of
2015, compared to the same period in
2014. Housing prices have also continued
to edge up. In July 2015, Canada’s
average housing price was up 5.1%
compared to the same period last year,
mainly thanks to the low interest rate.
Going forward, the pace of housing starts
is expected to slacken slightly this year
and next. Relatively strong housing starts

November 2015
2
in British Columbia and Ontario could offset the declines in regions hard hit by the oil price
plunge, including Alberta, Saskatchewan, and Newfoundland and Labrador.
Interest rates have been key to the
resiliency of Canadian housing and are
central to the expectation of an economic
rebound in the short term. Between
December 2007 and March 2009 the
Bank of Canada lowered its overnight
rate target (ORT) from 4.5% to 0.5% as
the nation’s economy weakened with the
onset of the global economic downturn.
In 2010 the ORT was increased to 1.0%
and remained unchanged until January
2015, when it was lowered to 0.75%, and then to 0.5% in July 2015 in response to the global
economic turmoil, the sharp drop in oil prices, and its negative impacts on growth and
underlying low inflation in Canada.
The Canadian dollar exhibited considerable variation during 2004 to 2009. During this period, as
a result of the global financial crisis, the Canadian dollar followed the strong fluctuations of the
U.S. economy, going from a monthly high of US $1.04 in November 2007, to a low of US $0.79
in March 2009. The Canadian dollar rebounded thereafter, peaking to a new monthly high of US
$1.05 in July 2011, and remained roughly
on par until February 2013. After a
gradual depreciation since 2014, the
Canadian dollar’s decline accelerated in
2015. From August 2014 to August 2015,
the average monthly exchange rate of the
Canadian dollar slid from US$0.92 down
to US$0.76. However, the Canadian
dollar has performed well against the
Euro, remaining almost unchanged over
the same period.

November 2015
3
While the Canadian-US dollar exchange rate is largely driven by the relative strengths of the
Canadian and U.S. economy, it is also influenced by commodity prices directly, and oil prices in
particular. A major benchmark for North
American crude oil is the West Texas
Intermediate (WTI). The WTI price
increased significantly beginning in 2000,
spiking at a monthly price of US $133.88
in June 2008 before falling to US $41.12 in
December 2008. The price has recovered
since, averaging US $95.60 a barrel over
the period from 2011 to 2013. The price of
oil collapsed again in late 2014 and the first
half of 2015. From July 2014 to July 2015,
the WTI was down 50% driven by ongoing excess supply, global economic turmoil and recent
geopolitical developments. Over the same period, the exchange rate had dropped 17%. The
future trajectory of the exchange rate is unclear: it will depend not only on oil prices but also on
the relative impact of oil prices against other major factors such as U.S. and Canadian monetary
policies and the persistent Canadian current account deficit.
After nearly a decade of stability (from 2000 through 2008), Canada’s trade balance fell
dramatically during the global financial crisis, turning to zero or negative from 2009 to 2013. It
rebounded back to $13 billion in 2014.
Canada’s forest products trade balance,
which had been decreasing since 2004,
has been recovering since 2010 thanks to
sizable net exports to the US and rapidly
growing exports to emerging economies,
particularly to China. The forest trade
balance remained positive even during
the financial crisis. In 2014, it stood at
$21 billion, up 9% from 2013 - a
significant contribution towards the
rebounce of net trade in the overall economy.

November 2015
4
II. Policy Measures in Canada Impacting Forest Management and Forest
Product Trade
Commitment to Growth and Innovation and to Sustainable Forest Management
In 2013, the Canadian Forest Service of Natural Resources Canada (NRCan-CFS) released
Growth and Innovation: Rooted in Sustainable Forests1, a strategic framework that guides
federal programs, science, and policy initiatives. This framework outlines three key priority
areas: supporting forest sector competitiveness, optimizing forest value, and creating prosperity
for Canadians.
Sustainable Forest Management Certification
Canada has a comprehensive legislative and regulatory framework that governs forest
management in each province and territory, which provides assurances that Canada’s forests are
managed sustainably. These laws, regulations and policies govern various aspects including
planning land use, forest management, public consultations, Aboriginal participation, protected
areas, tenure and allocation for wood for harvesting, and regeneration of forest land. In addition,
third-party sustainable forest management certification demonstrates the integrity of forest
management practices.
As of the end of 2014, Canada had 161 million hectares of forest land independently certified as
being sustainably managed by one or more of three globally recognized certification systems: the
Canadian Standards Association, the Forest Stewardship Council and the Sustainable Forestry
Initiative.
Competitiveness Initiatives
The Government of Canada is playing a key role in supporting the transformation of the forest
sector. In recent years, a number of initiatives have been implemented to help secure a more
competitive forest industry by helping the sector develop new products and processes, and take
action on new opportunities in the domestic and international marketplace. Since 2007, the
Government of Canada has invested $1.8 billion in these areas by: fostering innovation through
the Forest Innovation Program and the Investments in Forest Industry Transformation Program;
and market development through the Expanding Market Opportunities Program. Most recently,
Budget 2015 allocated $86 million over two years, starting in 2016/17, to extend the Forest
Innovation and Expanding Market Opportunities programs.
1 For more information on Growth and Innovation: Rooted in Sustainable Forests, see the Natural Resources Canada
website at http://cfs.nrcan.gc.ca/publications?id=35238.

November 2015
5
Innovation
The Government of Canada has committed to a suite of programming that spans the innovation
continuum from pre-commercial research and development in transformative technologies to
later stage programs which focus on proving technologies at the commercial scale.
Forest Innovation Program
The Forest Innovation Program (FIP) provides funding to four main areas: FPInnovations, the
Canadian Wood Fibre Centre, forest biorefinery collaboration and standards development.
FPInnovations
The Forest Innovation Program (FIP) provides funding to FPInnovations, Canada’s national
forest research institute, for pre-commercial R&D in transformative technologies. Funded by the
federal government, 9 provinces and over 200 industry members, FPInnovations is currently
supporting work on some 25 innovations that are at various stages of readiness. From the
promise of cellulose filaments (CF) and cellulosic nanocrystals (CNC), to mid-rise and tall wood
buildings, to drones providing forest inventory data, to lignin extraction, Canada’s forest
products industry is positioning itself to develop new products and penetrate new markets. After
less than five years of intense research and development in FPInnovations’ laboratories, a five
ton/day CF plant was built within an existing newsprint mill in Trois-Rivièrves, Quebec.
Inaugurated in June 2014, the new CF demonstration plant is now producing a high-quality,
world-class, strengthening bioproduct. Additional research by FPInnovations has also helped to
develop a commercial application for lignin by an integrated Canadian forest product firm that
can be used as a substitute for petroleum-based glues. This has helped the company reduce its
supply costs and enable it to produce new, greener plywood products for the marketplace.
Canadian Wood Fibre Centre
The FIP also provides funding to the Canadian Wood Fibre Centre, which is an institutional
arrangement that sees government researchers working in an integrated fashion with
FPInnovations and academia on forest sector transformation. Its work in forest inventory, fibre
characterisation and production, and genomics is helping to ensure that the industry can get the
right fibre to the right mill for the right product – in a way that supports industry competitiveness
and public confidence.
Forest Biorefinery
The Forestry Biorefinery Collaboration brings together the research capacity of NRCan’s
CanmetEnergy and FPInnovations, to further refine the technological solutions needed to support
the forest industry’s contribution to Canada’s bioeconomy. The Canadian forest sector sees the
bioeconomy as an important pillar in its transformation towards higher value added products.
Biorefinery technologies including bioenergy (e.g. pyrolysis and gasification) and innovative
uses of residues (e.g. lignin) are supporting new revenue streams for Canada’s mills which
increases their resilience and the security of the employment they provide. As noted above,

November 2015
6
extracted lignin is now being used as an environmentally friendly adhesive in plywood.
Gasification and liquefaction technologies are creating biogas and biofuels that can be used for
heat, power, and transportation.
Standards Development
The development of national and international standards for novel nanocellulosic materials and
their applications is facilitated through FIP. This is being done in order to facilitate the
regulatory approval and market acceptance of new products.
Investments in Forest Industry Transformation
The Investments in Forest Industry Transformation (IFIT) program was created in 2010 to
support Canada’s forest sector in becoming more economically competitive and environmentally
sustainable. The initial four-year $100-million initiative supported forest industry transformation
by accelerating the deployment of highly innovative, first-in-kind technologies at Canadian
forest industry facilities. These projects included bio-energy, bio-materials, bio-chemicals and
next generation building products.
IFIT was renewed in February 2014, with an additional $90.4 million provided for the program
over four years under Canada’s Economic Action Plan 2014. This continued commitment will
help bring the next wave of innovation to market and will solidify Canada’s position as a leader
in forest industry transformation.
As part of its renewal, the program created a “Performance Report 2010-2014” designed to
provide information regarding how the program operated, what it achieved overall (e.g.
economic, societal and environmental benefits) and how funded technologies were innovative
and transformative for the Canadian forest sector. This document will be updated every two
years to continue to report on the program’s progress along with that of the proponents it has
funded.
The program’s three Calls for Proposals have produced 186 unique applications, demonstrating
the sector’s great appetite for transformative projects. To date, IFIT has supported 23 projects
across a range of forest sub-sectors and businesses, eleven of which are world-first technologies.
Some of these commercial scale projects emerged through R&D support from NRCan’s Forest
Innovation Program, such as the CF and lignin extraction plants. These projects aim to “de-risk”
new technologies and encourage broader adoption of the technologies across the industry. They
are true Canadian innovation success stories.
Examples of projects funded include:
Construction of the world’s first cellulose filament plant. Cellulose filaments are long, thin,
ribbon-like structures found in the cell walls of trees and other plants that can be used as a
reinforcing agent in various pulp and paper and composite products.

November 2015
7
Creation of an engineered fibre mat (EFMs) plant. EFMs which are made of wood and
agricultural fibre residues can be used in the manufacturing of parts for vehicle interiors;
geotextiles; home insulation; air, liquid and gas filters; and noise absorbents.
Installation of an innovative anaerobic digestion system at a pulp mill to produce biogas
which can then be used to generate electricity and heat.
Implementation of an organic rankine cycle system at a lumber processing facility to
generate electricity using biomass-derived waste heat.
Development of a commercial-scale recovery process to produce kraft lignin that can be
used in a variety of innovative applications such as to displace components in commercial
glues used for plywood, medium density fibreboard and laminated veneer lumber
manufacturing.
Optimizing processes to develop advanced strand-based specialty and oriented strand board
commodity products on a single production line.
Building Canada’s first manufacturing plant for prefabricating a panelized system that meets
the rigorous Passive House Standard.
Developing the first made-in-Canada Passivhaus wood window system to produce energy-
efficient windows for passive houses.
Developing a portfolio of new, premium value grades of Northern bleached softwood kraft
(NBSK) pulp (which have greater fiber bonding performance properties compared to
conventional NBSK grades) that can be used to produce tissues, towels and personal care
products and also incorporated into non-traditional, growing, and value added markets such
as fiber reinforced materials, including cement applications.
Implementation of innovative fibre preheating technologies that increase the productivity in
two separate particle board and medium density fibreboard facilities.
Markets
Expanding Market Opportunities Program
The Expanding Market Opportunities Program (EMO) helps to increase and diversify market
opportunities for Canada's forest sector by promoting broader use of Canadian wood products.
The program provides funding to forest product associations to support market diversification
and expansion activities such as: branding, demonstration of Canadian wood-frame construction
techniques, international representation through in-market staff in offshore offices and technical
support to address market access and regulatory issues. In addition, the program supports quality
assurance and activities that reinforce the forest sector’s environmental reputation through the
promotion of Canada’s strong record on sustainable forest management and a preferred global
source of sustainable forest products. Activities in this area also include the development of
science and outreach products related to forest management in Canada’s boreal forest.
Over the past decade, this multi-faceted market diversification strategy has helped Canada’s
wood product sector increase its exports to emerging and fast-growing Asian economies. For
example, the value of Canadian wood product exports to China increased almost 18-fold between

November 2015
8
2005 and 2014 to $1.9 billion. In South Korea, they grew by 204 percent to $221.6 million
during the same period.
In North America, the EMO program has supported industry efforts to increase wood use in non-
residential buildings such as schools, health care facilities and commercial outlets and in mid-rise
buildings up to 6-storeys. As a result, wood has been used in more than 2,063 non-residential
construction projects in Canada and the United States since 2007, representing an estimated $954
million in new wood sales for the wood products sector.
The program has also supported the efforts of the National Research Council (NRC) to undertake
scientific research which led the Canadian Commission on Building and Fire Codes to
unanimously approve new provisions for mid-rise wood construction for up to 6-storeys in the
2015 edition of the National Building Code of Canada (NBCC). The vote took place in late
March 2015 and the new edition of the NBCC is expected to be released by the end of calendar
year 2015.
EMO also continues to help advance public acceptance of taller wood buildings and realized a
number of milestones under the Tall Wood Building Demonstration Initiative (TWB). Led by
NRCan with support from the Canadian Wood Council (CWC), FPInnovations and NRC, TWB
research and development activities enabled the development of Origine, a 13-storey
condominium building in Quebec City, and inspired the Quebec Government’s interest in tall
wood buildings. TWB funding was also instrumental in the development of an 18-storey hybrid
mass timber students’ housing complex at the University of British Columbia (UBC), with
construction expected to commence in the early Fall 2015. This will be the world’s tallest wood
building.
At the provincial level, the Quebec Government became the first jurisdiction in North America
to officially allow the construction of tall mass timber buildings —up to 12 storeys— with the
release a technical guide entitled, Bâtiments de construction massive en bois d’au plus 12 étages
(French only) in August 2015. An English translation is planned due to the great interest in the
Guide by other jurisdictions across Canada.
Climate Change
Adaptation
In 2008, the Canadian Council of Forest Ministers (CCFM) stated, in A Vision for Canada’s
Forests: 2008 and Beyond, that “consideration of climate change and future climate variability is
needed in all aspects of sustainable forest management.” In the same year, provincial and
territorial Premiers, through the Council of the Federation, requested the CCFM Climate Change
Task Force (CCTF) to undertake collaborative work on adaptation in forestry. Phase 1 of this
effort was completed in 2010 and provided an assessment of tree species vulnerability and
management options for adaptation (www.ccfm.org/pdf/TreeSpecies_web_e.pdf ).
The attention paid to the impacts of climate change and potential adaptation strategies has
remained strong. Phase 2 of the CCTF initiative moved beyond trees to consider adaptation for

November 2015
9
forests and in the forest sector. A scalable, nationally-applicable vulnerability assessment
framework for sustainable management under climate change and related adaptation knowledge
syntheses have been developed and are now being disseminated to enable members of the forest
sector to incorporate consideration of changing climatic conditions into sustainable forest
management. The tools and techniques being provided to the sector are designed to be readily
mainstreamed into day-to-day forest management planning and decision-making processes, and
are being field tested through several case studies across Canada. They are described in a special
series of nine reports by the CCFM that are now all available at www.ccfm.org.
The CCFM is currently supporting work on a third phase (2015-2016) of the CCTF. The CCTF
will be analyzing approaches for incorporating climate change into sustainable forest
management criteria and indicators, supporting a Forestry Adaptation Community of Practice
(FACoP, http://www.ccadaptation.ca/facop), and building climate change considerations into the
work plans of the CCFM Forest Pest and Wildland Fire working groups.
Recognizing that business and industry lack timely access to applicable information on climate
change impacts and adaptation, the 2011 federal budget provided funding for five years for work
by nine federal departments on climate change adaptation. The main goal of the Natural
Resources Canada (NRCan) program is to enhance competitiveness in a changing climate.
Through the Forest Change initiative, NRCan is continuing working with members of the forest
sector to develop and transfer targeted adaptation information, knowledge, and tools to help
mainstream adaptation into sustainable forest management policies and practices to enhance
competitiveness. This is meant to help members of Canada’s forest sector, notably the industry,
to understand climate change-related risks and address associated costs and opportunities. The
Canadian Forest Service of NRCan will be disseminating to the public, adaptation information
and tools as they become available. In addition, trends and projections will be provided based on
a logical and cohesive set of indicators of the effects of climate change on forests and forest
management systems. Actionable science and decision-quality information relevant to
competitiveness under a changing climate, including a range of knowledge products such as
maps, synthesis reports, guidebooks, climate projections and decision-support systems, will also
be distributed. Multidisciplinary information and knowledge on past and projected climate
change impacts is being analysed to produce an integrated assessment of the implications of
climate change on Canada’s forest and forest industry under a range of future, “what-if” climate
scenarios. The integrated assessment will identify potential areas and timing of vulnerabilities to
inform policies and investment by the public and private sectors.
Provincial and territorial governments are also continuing to advance adaptation of sustainable
forest management activities. Within several jurisdictions, vulnerability assessments are being
conducted at the forest management unit and regional level as a basis for incorporating climate
change considerations into day-to-day management activities. Through the Forestry Adaptation
working group of the Adaptation platform of NRCan, a Compendium of Forest Adaptation
activities in Canada was developed to document what is currently happening within Canadian
organizations or jurisdictions with respect to policy and regulation on forestry adaptation, and
new forest management practices that incorporate climate change considerations. Also,
membership of FACoP is growing and has facilitated the sharing of best practices and lessons
learned in adaptation among researchers, policy-makers, and forest managers across Canada.

November 2015
10
International efforts
Canada continues to actively participate in the United Nations Framework Convention on
Climate Change (UNFCCC) and is committed to negotiations aimed at producing a
comprehensive, legally binding agreement by 2015 that would enter into force in 2020. In these
negotiations, Canada supports inclusion of forest and other lands in a manner that contributes to
reducing anthropogenic emissions and enhancing carbon removals, and that strengthens
incentives for sustainable land management, while taking into account national circumstances.
Canada has participated actively in international negotiations under the UNFCCC on the
development of a methodological framework to Reduce Emissions from Deforestation and
Forest Degradation and to enhance sustainable forest management in developing countries
(REDD+). The Warsaw Framework for REDD+ was agreed in December 2013, with additional
guidance agreed in June 2015. Canada also participated in the REDD+ Partnership, a global
voluntary initiative which was launched in 2010 to build momentum for REDD+, and which
completed its work in December 2014. In September 2014, Canada endorsed the New York
Declaration on Forests which has a global goal to halve the loss of forests by 2020 and to end net
deforestation altogether by 2030.
In May 2015, the Government of Canada demonstrated its commitment to addressing climate
change by submitting Canada’s Intended Nationally Determined Contribution (INDC) to the
UNFCCC (http://www4.unfccc.int/submissions/INDC). Under the INDC Canada intends to
achieve an economy-wide target to reduce its greenhouse gas (GHG) emissions by 30% below
2005 levels by 2030. As part of this, Canada’s intends to account for its land sector using a net-
net approach, account for harvested wood products, and exclude the impacts of natural
disturbances.
Canada has also demonstrated its commitment to addressing climate change by providing
international climate finance in support of mitigation actions by developing countries and
support for adaptation by the poorest and most vulnerable countries. Canada has fully delivered
on its fast start financing commitment by providing $1.2 billion over 2010-2013, including
funding for the Forest Carbon Partnership Facility, the Congo Basin Forest Fund, the Congo
Basin Forest Partnership, and the BioCarbon Fund. Canada has also committed to providing
$300 million to the Green Climate Fund, which is aimed at supporting projects, programs,
policies and other activities to address climate change in developing countries, including
REDD+.
Domestic Emission Reduction Efforts
Canada’s new INDC pledge to achieve an economy-wide reduction in GHG emissions by 30%
below 2005 levels by 2030 is in addition to Canada’s existing commitment to reduce GHG
emissions by 17% compared to 2005 levels by 2020. Canada is making progress in reducing its
emissions – from 2005 to 2013, Canadian GHG emissions decreased by 3.1% while the economy
grew by 12.9%.

November 2015
11
Environment Canada’s most recent Canada’s Emissions Trends report (December 2014) detailed
projections of progress toward Canada’s 2020 GHG emissions reduction target. The report
shows that Canada’s 2020 GHG emissions are projected to be 130 Mt lower relative to a scenario
with no action. The projected reduction is a result of collective action by governments,
consumers and businesses. Emissions intensity (emissions per dollar of GDP) has shown an
average annual decline since 1990, a trend that is projected to continue to 2020. Emissions per
capita (tonnes per person) have also been decreasing since 2005, and this is also projected to
continue to 2020. However, the projections also indicate that further efforts will be required in
order to meet the 2020 target. The 2015 version of Canada’s Emissions Trends, as well as
Canada’s Second Biennial Report to the UNFCCC, due by the beginning of 2016, will provide
the latest projections, including from the Land Use, Land-Use Change and Forestry (LULUCF)
sector.
The Government of Canada is implementing a sector-by-sector regulatory approach to reduce
GHG emissions. The government has already taken action on two of Canada’s largest sources of
GHG emissions—transportation and electricity. Regulations for passenger vehicles and light
trucks are already achieving GHG reductions and, along with regulations for heavy-duty vehicles
and coal-fired electricity will yield further results in the coming years. The federal government is
currently developing additional regulatory measures that will establish more stringent standards
in the transportation sector for heavy-duty vehicles of post-2018 model years; gradually phase
down use of hydrofluorcarbons; reduce GHG emissions from natural gas-fired electricity, as well
as from chemicals and nitrogen fertilizers; and, reduce methane emissions from the oil and gas
sector.
Canada’s regulatory approach is aligned with that of the United States, where appropriate,
recognizing the importance of cooperative action in an integrated North American marketplace.
Canada will continue to take cooperative action with its continental trading partners, particularly
the United States, and will work towards further action in integrated sectors of the economy,
including energy and transportation.
Climate change is a shared responsibility in Canada. Canadian provinces and territories have
jurisdictional authorities over natural resources, energy, and many aspects of the environment.
Each jurisdiction has its own legal framework and determines which policies and measures to put
in place to reduce GHG emissions. The Canadian Council of Ministers of the Environment, a
federal/provincial/territorial intergovernmental forum, has agreed that climate change will
remain a priority agenda item in the foreseeable future. A variety of actions undertaken to date in
the largest provinces are discussed below.
Canada expects that the LULUCF sector will provide an important contribution to its broader
climate change mitigation efforts. The role of provincial and territorial governments is vital as
they own 90% of Canada’s forests, and federal, provincial and territorial governments are
currently exploring how best to achieve forest-related mitigation. An analysis of how mitigation
actions involving Canada’s managed forests could contribute over the longer term was published
in 2014 (http://www.biogeosciences.net/11/3515/2014/bg-11-3515-2014.pdf). Examination of
forest-related mitigation potential is on-going, including mitigation related to changes in forest

November 2015
12
management; increased afforestation; increased use of harvested wood for long-lived products as
a substitute for products that are more emissions intensive (on a life-cycle basis); and, increased
use of harvest residues for bioenergy in place of fossil fuels. With respect to wood use, on-going
efforts to promote the use of wood in mid-rise and tall building applications in Canada (see
Market Drivers section) are expected to have mitigation benefits.
In June 2012, the Government of Quebec launched its Climate Change Action Plan 2013-2020.
The Plan included the allocation of $2.7 billion for climate change mitigation and adaptation
programs to work toward a GHG reduction target of 20% below 1990 levels by 2020. One key
element of the Plan is a GHG cap and trade system that began operating in 2013 and linked with
California’s trading system in 2014. Other measures under the Plan include the establishment of
green building standards and promotion of renewable energy. Quebec’s Programme de biomasse
forestière résiduelle finances projects to use residual forest biomass for energy.
The Government of Ontario’s Climate Change Action Plan was released in 2007 and included a
set of short-term (6% below 1990 levels by 2014), medium-term (15% below 1990 levels by
2020), and long-term (80% below 1990 levels by 2050) targets for reducing the province’s GHG
emissions. The plan included a 50 Million Tree Program to plant trees on the settled landscape of
southern Ontario, which is expected to sequester 6.6 Mt CO2 by 2050 and help restore forest
cover on this fragmented landscape. As well, the Ontario Greenbelt Plan has identified about 725
thousand hectares of prime agricultural land and environmentally-sensitive areas for permanent
protection from urbanization.
In October 2014, the provincial government released Ontario’s Climate Change Update 2014
(http://www.ontario.ca/document/ontarios-climate-change-update-2014) and announced that the
province is expected to achieve its 2014 target. In February 2015 the government initiated a
public consultation process and released a Climate Change Discussion paper
(http://www.ontario.ca/environment-and-energy/climate-change-consultation). The document
sets a vision to establish Ontario as a leader in climate change mitigation and science, and
indicates areas for immediate actions such as putting a price on carbon, supporting science,
research and technology, and promoting climate resilience and risk management. In April 2015,
Ontario announced plans to introduce a cap and trade system to reduce GHG emissions. As part
of its participation in the Western Climate Initiative, Ontario has joined with British Columbia,
California and Quebec in a process to establish a new GHG reduction target.
In Alberta, the government announced its climate change action plan in 2008 with an objective to
reduce GHG emissions by 50 megatonnes from a business-as-usual scenario by 2020 and by 200
megatonnes by 2050. In 2011, Alberta extended and expanded its Bioenergy Producer Credit
Program until 2016. The program has been in place since 2006 and provides incentives to
develop bioenergy products to support the development of new technologies and facilities the
use non-food crops, waste biomass and wood fibre for fuel, power and heat. In 2011, the
province implemented a Renewable Fuels Standard to accelerate the use of fuels derived from
renewable sources.
The Government of Alberta is currently working on renewing its strategy to ensure policies and
programs are in place to meet its targets. In August 2015, the government named a Climate

November 2015
13
Change Advisory Panel to engage Albertans and technical stakeholders on key issues related to
climate change. The panel will provide advice to the government in order to inform a new
provincial action plan on climate change expected in autumn 2015.
The Government of British Columbia enacted its Greenhouse Gas Reduction Act in 2008. Under
the Act, B.C.'s GHG emissions are to be reduced by at least 33 per cent below 2007 levels by
2020 and 80% below 2007 levels by 2050. A key element of the province’s Climate Action Plan
is a revenue-neutral carbon tax that puts a price on GHG emissions – the price started at $5/tonne
CO2e in 2008 and was increased by $5/year to $30/tonne in 2012 where it has remained. British
Columbia’s Energy Plan: A Vision for Clean Energy Leadership (2007), its Clean Energy Act
(2010) and other initiatives have been adopted to reduce emissions from the energy sector and
foster innovation including through carbon capture and sequestration for coal-fired electricity
and a commitment to generate at least 93% of energy from clean or renewable sources
The province has developed an initial institutional framework for carbon offsets as part of
working toward a carbon neutral public sector. In 2011, the province introduced a forest carbon
offset protocol to guide the design, development, quantification and verification of forest carbon
offsets generated on private and public lands in the province. Forest carbon mitigation activities
that are eligible include afforestation, improved forest management and forest conservation. In
May 2013, the British Columbia Forest Carbon Partnership Program (BCFCPP) was launched
with the aim of restoring damaged public forests. Under the program, the province leverages
private sector investments in forest management to restore damaged public forest land in
exchange for carbon offset entitlement. The BCFCPP seeks to stimulate forest ecosystem
restoration and forest regeneration, which could see more than one million trees planted by 2018.
In summer 2015, the British Columbia government initiated a public consultation
(http://engage.gov.bc.ca/climateleadership) as part of the process to develop a provincial Climate
Leadership Plan that aims to prepare the province to achieve its 2020 and 2050 emissions
reductions targets. The province intends to release a detailed draft plan in December 2015 for
further public input.
Major Forest Pest Disturbances in Canada
The Spruce Budworm Infestation in Eastern Canada
Spruce Budworm (SBW) is one of the most damaging pests in North America, with most regions
of Canada reporting damage by defoliation each year. During periods of major outbreaks, SBW
causes disruptions to the forest industry and affects jobs, recreation and tourism, especially for
those communities and regions that are heavily forest-sector dependant. The last extensive
outbreak of Spruce Budworm in Canada reached its peak in the 1970s, and covered more than 50
million hectares across Quebec, Ontario, and Atlantic Canada, resulting in fibre losses of
approximately 500 million m3 of spruce and fir, with a commercial value of approximately $12.5
billion in Quebec alone.

November 2015
14
The most recent Spruce Budworm outbreak began in 2006 in Quebec and as of 2014 had already
spread to cover more than 4.2 million hectares; with the potential to spread further through
Canada’s Atlantic provinces and the eastern United States. Due to the potential negative effects
of an outbreak in eastern Canada, the federal government is working with provincial partners,
industry, and academia to test and evaluate early intervention strategies aimed at minimizing the
extent of the epidemic by targeting high-population Spruce Budworm epicentres.
The Mountain Pine Beetle Infestation in Western Canada
The Mountain Pine Beetle is a native insect that attacks pines in Western North American forests
and the infestation has caused widespread timber losses in the province of British Columbia.
Since the current beetle epidemic started in the early 1990s, it has killed more than 50% of
British Columbia’s commercial pine volume, largely dense stands of lodgepole pine in the
central interior of the province.
The beetle has since spread far beyond its historic range into northern British Columbia and
eastward into the boreal forest of north-central Alberta. Scientists are assessing the risk that the
beetle may continue to spread eastward across Canada’s boreal forest, potentially impacting
Canada’s forest industries and the well-being of forest-dependent communities located
throughout Canada’s boreal zone.
Because of the vital role the forest industry plays in Canada’s economy as a whole, and the
growing threat the beetle poses to forests throughout Western Canada, the Government of
Canada is concerned about the impact of the beetle infestation on forest communities and is
working in collaboration with the provinces, territories, stakeholders and communities across
Canada to respond to the challenges it poses.
Trade Policy
In addition to the North American Free Trade Agreement with the United States and Mexico
(1994), Canada has free trade agreements in force with Korea (2015), Honduras (2014), Panama
(2013), Jordan (2012), Colombia (2011), Peru (2009), the European Free Trade Association
(2009), Costa Rica (2002), Chile (1997) and Israel (1997). Negotiations are currently concluded
with the TransPacific Partnership (2015), Ukraine (2015) and the European Union (2014).
Negotiations for free trade agreements are underway with Japan as well as with Morocco, the
Caribbean Community, Dominican Republic, India, Singapore, Guatemala, Nicaragua and El
Salvador. Negotiations are also underway to modernize the existing free trade agreement with
Costa Rica.
Finally, Canada is engaged in exploratory trade discussions with Turkey, Philippines, Thailand
and Mercosur.

November 2015
15
Phytosanitary Measures
Canada is a strong supporter of the International Plant Protection Convention (IPPC) and is
active in the development of regional and international phytosanitary standards (e.g. wood
packaging standard, ISPM No. 15, and draft wood commodities standard). Canada has
demonstrated leadership in implementation of wood-related standards through the development
of certification systems for wood exports and for wood packaging. The Canadian Heat Treated
Wood Products Certification Program (CHTWPCP) is the official certification system for the
export of wood products to countries requiring heat treatment prior to entry. The Canadian Wood
Packaging Certification Program (CWPCP) certifies that the wood packaging materials for
export satisfies the international requirement of ISPM-15.
Canadian experts continue to take an active role in international fora related to phytosanitary
measures, including: the North American Plant Protection Organization (NAPPO), the
International Plant Protection Convention (IPPC) and the International Forest Quarantine
Research Organization (IFQRG). Phytosanitary scientific research is conducted nationally and
coordinated internationally to ensure that import regulations for internationally traded wood
commodities are based on the best available science.
III. Market Drivers
The Canadian forest sector has begun emerging from the global economic downturn of 2008/09.
Recovery in the sector has been driven primarily by growing demand from Asia (particularly by
China and South Korea) for wood products. In addition, recovery has also been aided by the
strengthening of the U.S. housing market. More recently, over the course of 2013 to present, the
weakening of the Canadian dollar also facilitated exports from Canada and supported solid profit
margins for Canadian producers.
The ongoing strength of emerging markets has maintained a significant trend of market
diversification over the past decade. While in 2004, 79.5% of forest product exports were
destined to the U.S., this percentage has dropped to 65.6% in 2014. Demand for wood products
in Asia, and China in particular, has grown exponentially over the course of the past decade as a
result of rapidly developing economies. Although China’s GDP growth has slowed to 7 percent
in the second quarter of 2015 compared to an average of 10% between 2005 and 2014, rates of
urbanisation are expected to continue with an estimated 200 million Chinese people moving into
urban areas over the next decade. As a result, the value of Canadian wood product exports to
China has increased almost 18-fold between 2005 and 2014. Likewise, the demand for Canadian
pulp has been strong in China which has seen exports increase by 219% between 2005 and 2014.
Overall, the share of forest products exports destined to China increased from 2.4% in 2005 to
15.6% in 2014. In India, demand for paper and paperboard has also been robust with exports
increasing by 27% between 2005 and 2014.
Canada’s forest sector still faces numerous challenges; among them are fibre supply availability
in some regions and increasingly aggressive foreign competition.

November 2015
16
Emerging Opportunities
While many traditional markets for Canadian forest products are mature, there are still
opportunities for growth by pursuing developing or emerging markets. This also includes
increased use of wood in non-residential and mid-rise construction and expanding offshore
export opportunities for Canadian wood products in emerging markets. Climate change
considerations and a growing recognition of the environmental benefits of wood use are helping
to open up opportunities for wood products, including bio-energy and next generation bio-fuels.
Energy Prices
Given the significant increases in oil production over the past decade in North America – namely
from the Canadian oil sands and the shale rock formations in the U.S., oil prices have softened
significantly since supply began exceeding demand. The recent collapse in oil prices is primarily
due to an oversupply of crude oil, particularly from the U.S., where crude output is at its highest
level in 30 years and Saudi Arabia, which is producing crude oil at record volumes. OPEC oil
producing states have ramped up production in a bid to maintain market share, further
exacerbating excess supply and driving down global prices.
The price of oil (West Texas Intermediate) had risen 17.5 percent to US$93 per barrel from 2010
to 2014. However, prices have declined significantly in the first 8 months of 2015, averaging
US$42.87 per barrel in August 2015, a decline of 55.6 percent from August 2014.
Natural gas prices remain weak in North America due to an oversupply in the market. The
National Energy Board anticipates that the North American natural gas market will remain
saturated from 2015 to 2017. Propane prices have also seen significant declines due to excess
supply in the market. Liquid propane prices have declined by 25 percent between the first 8
months of 2014 to the same period in 2015.
Lower energy costs have helped to boost the overall competitiveness of the forest industry.
Exchange Rates
Exchange rates continue to play a role in the prosperity of the forest industry since most
Canadian forest products are sold in U.S. dollar terms while the sector pays most of its costs in
Canadian dollars. The Canadian dollar appreciated against the U.S. dollar between 2009 and
2012, to reach parity in 2012. It decreased over the course of 2013 to US$0.97 and in 2014 to
US$0.95. The Canadian dollar continued its downward trend in 2015, averaging US$0.75 in
September 2015, in large part due to weakness in oil prices.

November 2015
17
In recent years, the Russian Ruble has depreciated considerably against both the Canadian and
US dollars. By September of 2015, the Russian currency was worth 50.2 rubles per Canadian
dollar and 66.8 rubles per US dollar.
US Housing Market
The U.S. housing market is the primary driver behind softwood lumber and wood panel demand
in North America. The U.S. housing market has strengthened considerably from the depths of
economic recession. Starts have grown considerably since 2012, when they totalled 784,000
units. Starts grew to 928,000 units in 2013 and reached 1 million units in 2014. In the first 8
months of 2015, annualized starts averaged 1.126 million units. This level of housing starts is
still below the long-term (20 year) average of 1.4 million annual starts, although the market has
seen steady improvement from 2009 when housing starts had dropped to a low of 554,000 units.
Exports of softwood lumber to the U.S. have increased markedly, rising 127 percent above 2009
levels to $5.5 billion. In the first 6 months of 2015, the value of softwood lumber exports to the
U.S. have risen by 6.7 percent to $2.86 billion compared to the same period last year and the
anticipation of the U.S. market recovery should sustain softwood lumber demand.
National and Provincial Building Code Changes In Support of Wood in Mid-Rise Building
Construction
A number of Canadian policies and initiatives changed in 2015 to better enable the use of wood
in mid-rise building applications.
Ontario’s new building code that raises the limit of wood frame buildings from four to six
storeys came into force on January 1, 2015. These amendments go beyond British Columbia’s
Building Code changes in 2009, by allowing mid-rise wood construction in residential,
commercial and mixed occupancy markets.
Changes to Ontario’s building code are expected to enhance the competitiveness of the
province’s wood products sector by generating new demand for forestry products. This has been
the case in British Colombia where over 396 wood mid-rise buildings are in various stages
(contemplated, preparing drawings, under construction, and completed), of which 67 buildings
have been completed to date.
In March 2015, Private Member’s Bill 203 was passed, allowing up to six-storey wood-frame
construction in Alberta. This brought the province in line with the City of Calgary which began
accepting applications for six-storey wood-frame construction where zoning allows, in
November 2014. With Bill 203, Alberta joined British Columbia, Ontario and Quebec on the list
provinces adopting provisions for wood in mid-rise construction within their respective building
codes ahead of changes to Canada’s national model building code.
November 2015
18
In late March 2015, new provisions that allow wood-frame construction up to six storeys at the
national level were unanimously approved by the Canadian Commission on Building and Fire
Codes. The changes will be reflected in 2015 edition of the National Building Code of Canada
(NBCC) which is expected to be released by the end of this calendar year.
The new mid-rise provisions will better enable the construction of larger, taller wood buildings
and will help foster greater use of wood in public and private buildings across Canada. NRCan,
along with the Canadian Wood Council, FPInnovations, the NRC, the governments of British
Columbia, Ontario and Quebec, and a number of provincial and municipal authorities, played a
key role in influencing these code changes.
IV. Developments in Forest Products Markets Sectors
Wood Energy Policy
The Canadian forest sector makes widespread use of forest biomass in the cogeneration of heat
and electricity for use in industrial processes and sale to 3rd parties. In 2012, the biomass
installed generating capacity was 2,103 MW, 79% of which was installed at pulp and paper
facilities. In addition, several private utilities generate electricity using wood wastes and other
biomass materials as fuel. In 2012, forest biomass accounted for close to 2% of the electricity
generated in Canada.
In 1990, fossil fuel use accounted for 32% of the forest sector's energy needs. A focus on
changing the fuel supply mix and improving energy efficiency in the industry caused fossil fuel
use to fall to 20% by 2012. Over the same period, the sector’s use of renewable energy has risen
from 68% to 80%.
Wood pellets are a small but important market for the Canadian forest industry. Canada's wood
pellet production capacity has grown from 500,000 tonnes in 2002 to 3.51 million tonnes in
2014, with close to 2.60 million tonnes of pellets being produced, largely for export. The
conversion of two coal-fired generating stations in Ontario will increase future domestic wood
pellet demand and create the largest peak capacity power plant in North America fuelled by
100% biomass.
Developing liquid fuels from biomass continues to be an important focus for Canada. The federal
Renewable Fuel Regulations, which took effect in much of the country in December 2010,
requires an average of 5% renewable fuel content in gasoline across Canada. Biodiesel
production and use in Canada is still in the early stages of adoption. The federal Renewable Fuel
Regulations include provisions requiring an average 2% renewable fuel content in diesel fuel and
heating distillate oil. This requirement went into effect on July 1, 2011.

November 2015
19
Value-Added Wood Products2
Market acceptance of Engineered Wood Products (EWPs) —the shift from larger dimension
lumber to EWPs and the shift from stick-built homes to factory-built homes— contributed to the
significant growth of this segment that began in the mid-1990s.
In 2014, just under $2B in value-added products were exported, the majority of it supplying the
US market (83.8%) followed by the U.K (8.2%) and Italy (2.0%). In 2014, the value of total
exports of value-added wood products increased 11.4 percent compared to the year prior.
Sawn Softwood
Since the marked improvements between 2009 and 2010, softwood lumber production has
continued to recover but at a slower pace. Between 2010 and 2014, Canadian sawn softwood
production increased by 12% to 58.2 million cubic metres. However, North American sawn
softwood prices increased substantially, growing 35% over the same 5 years. The strengthening
U.S. housing market, along with continued demand from China for softwood lumber, was behind
the price increase in 2014. Indeed, in 2014, the volume of Canadian sawn softwood exports to
the U.S. increased by 34.4%.
While the pace of demand growth is tapering, the U.S. demand for Canadian softwood lumber is
still rebounding thanks to improvements in the housing market. Between 2013 and 2014,
Canadian exports of softwood lumber to the U.S. increased 22% to $5.5 billion and in the first 6
months of 2015 exports have increased 6.7% compared to the same period previously.
China has become a significant offshore market for Canadian sawn softwood products as exports
have increased tremendously over the span of a decade. As of January to August 2015, China
holds a 16.9% share of total Canadian sawn softwood exports (by volume). Demand in China has
been driven by large government infrastructure projects. A switch to a slower-growth, more
consumer-driven economy, could negatively impact demand for lumber. During 2005 to 2014,
sawn softwood exports to China increased by almost 30-fold on a volume basis, from 253,280
m3 to 7,556,094 m3. More recently, the value of softwood lumber exports to China increased
3.4% in the first 6 months of 2015 compared to the same period in 2014 while the volume of
softwood lumber exports to China decreased by 4.5% during that time. While China will remain
a key market for sawn softwood, who will supply that lumber is unclear. In 2014, Russia
surpassed Canada to become the largest softwood lumber exporter to China.
2 In the Canadian context, the value-added wood products group includes wood windows and doors, factory-built
homes, millwork and joinery products, shingles and shakes, containers and pallets, engineered wood products
(EWPs) such as I-beams and roof trusses, and other structural products.

November 2015
20
Oriented Strand Board
OSB represents a large portion of Canada’s total structural panel exports (almost 95%). It is
expected that as the U.S. housing market continues to improve, OSB’s production will rebound.
Given that 89.7% of OSB is destined for the U.S. market, and in particular goes towards housing
construction end-uses, OSB exports suffered during the downturn in the U.S. housing market that
began in 2008, but have started growing again thanks to a recovery that has gained traction.
Between 2009 and 2014, total exports of Canadian OSB grew by 108.5% to $1.1 billion.
However, the rebalancing of capacity with demand has proven challenging: in 2014, OSB
production was significantly outpacing the demand and OSB prices were struggling. Despite the
solid increase in export volumes, the value of OSB exports in 2014 was 10% lower than in 2013
due to persistently low OSB prices.
Paper and Paperboard
The value of Canadian paper and paperboard exports declined by 4 percent between 2010 and
2014 to $9.5 billion. The industry faces weak producer margins and is highly sensitive to any
cost increases. The main issue facing paper and paperboard producers lies in the demand
outlook for newsprint and other graphic paper, which is dire. In fact, demand for all types of
paper used to communicate printed information is declining, due to the transition towards
electronic media, particularly in the U.S.. In addition, an ongoing trade dispute with the U.S.
further challenges the competitiveness of some Canadian paper exports. In July, the U.S.
Department of Commerce imposed tariffs on Canadian supercalendered paper based on
allegations that Canadian exporters receive subsidies. On the positive side, the decline of the
US$/CAD$ exchange rate has provided the sector with an advantage over US producers and
enhanced its competitiveness.
There are some segments facing positive outlooks such as packaging paper or household and
sanitary papers. However, given the prominence of graphic paper production in Canada, there
appear to be limited growth prospects for this sub-segment.
Wood Pulp
While the current global pulp markets are susceptible to fluctuations, they continue to be
generally robust. Despite the current loss of end-use from a declining printing and writing paper
segment, demand from other segments is growing (sanitary, packaging and viscose staple fibres
in the textile industry). In 2014, the value of Canadian wood pulp exports increased by 6.7%
while the volume of overall Canadian wood pulp exports actually decreased by 1.6% compared
to 2013. The improved performance in 2014 was largely due to the price increase, with average
North American Northern Bleached Softwood Kraft (NBSK) pulp prices up 9% compared to
2013.
An increasingly important determinant of pulp markets is Asian demand. In particular, global
pulp prices are largely influenced by inventory management cycles in China. The value of
Canadian pulp exports to China has grown at an annual average rate of 10.5% from 2004 through

November 2015
21
2014. China has surpassed the U.S. to become Canada’s number one pulp export market since
2012, accounting for 38% of Canadian exports (exports to US accounted for 36% of total) in
2014.The Chinese pulp market is expected to keep growing, fuelled by two main factors. First,
China has greatly expanded its paper capacity and this is contributing to increased demand for
pulp. Second, China has significantly reduced its domestic non-wood pulp capacity (e.g. reed,
bamboo and bagasse), causing Chinese paper producers to further source pulp supplies from
international markets. The drive to reduce inefficient, highly polluting non-wood Chinese pulp
capacity will likely continue.
In the long-term, Chinese pulp demand is likely to keep growing. However, low-cost foreign
competition will play a role in determining Canada’s market share. For instance, the low Ruble
has led to dramatic increase in pulp imports from Russia in 2014 (over 24%) while Canadian
imports only rose 4%.
Dissolving pulp demand has been steadily growing for several years, primarily driven by the
textile industry and experienced a remarkable growth a few years ago. It is primarily exported to
markets in China (40%), the U.S. (14%) and India (15%). However, a rapid global expansion in
capacity, especially in Brazil, China, the U.S. and Canada, has led to global supply outpacing
demand, significantly lowering prices. This very competitive segment has been the subject of
trade dispute. Canadian exports to China were down 20% over 2014 relative to 2013, mainly due
to the anti-dumping duties against Canadian producers by China’s Ministry of Commerce.
Countries not impacted by duties saw their market share increase, however, Brazil and the U.S.,
which have also been impacted by duties, managed to see export growth by shifting export
markets.

November 2015
22
Appendix
Statistics and Prospects
* Figures for 2015 and 2016 are estimated/forecasted
Sawn Softwood (000 Cubic Metres)
2013 2014 2015* 2016*
Production 41,424 41,891 42,654 44,422
Apparent consumption 14,962 14,425 14,714 15,184
Imports 1,105 1,477 1,561 1,565
Exports 27,567 28,943 29,501 30,802
Coniferous Veneer and Sawlogs (000 Cubic Metres)
2013 2014
Imports 2,734 2,147
Apparent consumption 112,326 112,140
Exports (Total) 6,623 6,222
Sawn Hardwood (000 Cubic Metres)
2013 2014 2015* 2016*
Production 1,389 1,460 1,485 1,525
Apparent consumption 2,055 1,776 2,198 2,272
Imports 1,116 878 1,237 1,245
Exports (Total) 450 562 524 498
Oriented Strandboard (OSB) (000 Cubic Metres)
2013 2014 2015* 2016*
Production 6,268 6,877 7,107 8,032
Apparent consumption 2,478 2,607 2,231 2,318
Imports 102 134 96 95
Exports (Total) 3,892 4,404 4,972 5,809

November 2015
23
Plywood (000 Cubic Metres)
2013 2014 2015* 2016*
Production 1,792 1,810 1,905 1,953
Apparent consumption 2,835 2,913 2,959 3,064
Imports 1,469 1,585 1,601 1,655
Exports (Total) 426 482 546 544
Particleboard (000 Cubic Metres)
2013 2014 2015* 2016*
Production 7,968 8,587 8,868 9,873
Apparent consumption 3,802 4,570 4,840 4,187
Imports 605 1,261 1,847 1,092
Exports (Total) 4,771 5,278 5,875 6,777
MDF (000 Cubic Metres)
2013 2014 2015* 2016*
Production 811 849 969 1,095
Apparent consumption 562 717 693 721
Imports 260 450 381 366
Exports (Total) 509 582 657 740
Fibreboard (000 Cubic Metres)
2013 2014 2015* 2016*
Production 891 931 1,022 1,148
Apparent consumption 912 1,015 902 906
Imports 644 760 643 618
Exports (Total) 623 676 764 859
Wood Pulp (000 tonnes)
2013 2014 2015* 2016*
Production 17,253 16,961 16,088 16,221
Apparent consumption 7,696 7,680 6,786 6,600
Imports 265 399 282 250
Exports (Total) 9,822 9,680 9,583 9,871

November 2015
24
Paper and Paperboard (000 tonnes)
2013 2014 2015* 2016*
Production 11,174 11,102 10,179 10,302
Apparent consumption 5,577 5,337 4,532 4,828
Imports 2,636 2,641 2,667 2,739
Exports (Total) 8,233 8,406 8,314 8,212
n/a – Data are unavailable
Figures in grey shading and blue font indicate revised 2013 data
Note 1: Figures above have been adjusted to reflect actual volumes as opposed to nominal.
Figures are consistent with those provided for the 2015 UNECE Timber Committee Forecasts
(Forest Products).