Embed Size (px)
Citation preview
Underwater radiated noise levels of a research icebreakerin the central Arctic Ocean
Ethan H Rotha)
Scripps Institution of Oceanography, University of California, San Diego, 9500 Gilman Drive,La Jolla, California 92093-0205
Val SchmidtCenter for Coastal and Ocean Mapping/Joint Hydrographic Center, University of New Hampshire,Durham, New Hampshire 03824
John A. Hildebrand and Sean M. WigginsScripps Institution of Oceanography, University of California, San Diego, 9500 Gilman Drive,La Jolla, California 92093-0205
(Received 10 January 2012; revised 21 December 2012; accepted 22 January 2013)
U.S. Coast Guard Cutter Healy’s underwater radiated noise signature was characterized in the cen-
tral Arctic Ocean during different types of ice-breaking operations. Propulsion modes included
transit in variable ice cover, breaking heavy ice with backing-and-ramming maneuvers, and dynamic
positioning with the bow thruster in operation. Compared to open-water transit, Healy’s noise signa-
ture increased approximately 10 dB between 20 Hz and 2 kHz when breaking ice. The highest noise
levels resulted while the ship was engaged in backing-and-ramming maneuvers, owing to cavitation
when operating the propellers astern or in opposing directions. In frequency bands centered near 10,
50, and 100 Hz, source levels reached 190–200 dB re: 1 lPa at 1 m (full octave band) during ice-
breaking operations. VC 2013 Acoustical Society of America. [http://dx.doi.org/10.1121/1.4790356]
PACS number(s): 43.30.Nb, 43.50.Lj, 43.60.Cg [MS] Pages: 1971–1980
I. INTRODUCTION
A. Background
Icebreakers are designed to operate in ice-covered waters
with a strengthened hull, an ice-clearing shape, and the pro-
pulsion power to push through consolidated ice. Convention-
ally powered (i.e., non-nuclear) icebreakers have operated
successfully on trans-Arctic voyages in summer as well as on
scientific expeditions to high-latitudes in almost all regions of
the Arctic Ocean. Although icebreakers represent a relatively
small proportion of the total vessel traffic in the Arctic (�50
active icebreakers in the world fleet), they are invaluable for
surveying, oceanographic research, vessel escort in ice, sal-
vage, pollution response, and search and rescue.
The thinning Arctic ice pack and advances in ship design
are allowing for longer seasons of navigation for both ice-
breakers and other polar-class vessels (Jensen, 2007). Like-
wise, an increasing number of research icebreakers are
conducting geological and geophysical studies throughout the
Arctic Ocean related to establishing the limits of an Extended
Continental Shelf under the U.N. Convention on the Law of
the Sea (Arctic Council, 2009). Icebreaker activity will also
increase as mineral and petroleum resources are developed in
the offshore region (Jensen, 2007). Seasonal shipping traffic
is expected to keep increasing in the near future due to indus-
trial development as well as political and scientific interests
in the Arctic region, and the use of polar icebreakers could
significantly lengthen the shipping season (Arctic Council,
2009). The potential for an expanding presence of ice-
breakers in the Arctic motivates characterization of their
noise signatures to better understand their future contribution
to Arctic underwater noise.
Compared to other vessels, icebreakers generate higher
and more variable noise levels from propeller cavitation due
to the episodic nature of breaking ice, which often involves
maneuvers such as backing-and-ramming into the ice. Some
icebreakers are equipped with bubbler systems that blow high-
pressure air into the water to push floating ice away from the
ship, creating an additional noise source over short ranges.
Sound propagation under sea ice is an area of acoustics
research that is complex due to scattering effects from ice,
absorption of acoustic energy at the ice-water interface, and
the possibility that shear waves transmitted through ice might
re-radiate into the water column (Etter, 2003). Under ice
transmission loss is largely unaffected by ice coverage at
ranges where direct path propagation is possible. Conversely,
transmission loss is greatly affected at distances in which the
only propagation path requires at least one water-ice reflection
(Milne and Ganton, 1964). Incorporating sea ice conditions,
water depth, and sound speed profile may help to model long-
range sound propagation in the Arctic Ocean and therefore
predict the ranges at which icebreaker noise may be detected.
We present results from in situ shipboard experiments
designed to measure underwater sound pressure levels radi-
ated by an icebreaker operating in the Arctic Ocean. While
past studies have measured icebreaker noise from stationary
locations near shore or on the ice, real-time acoustic moni-
toring of an icebreaker has not previously been reported for
a)Author to whom correspondence should be addressed. Electronic mail:
J. Acoust. Soc. Am. 133 (4), April 2013 VC 2013 Acoustical Society of America 19710001-4966/2013/133(4)/1971/10/$30.00
Downloaded 30 May 2013 to 132.177.103.226. Redistribution subject to ASA license or copyright; see http://asadl.org/terms
the offshore ice-covered waters of the central Arctic Ocean.
Received sound pressure levels were recorded at various dis-
tances in typical ice-breaking conditions. Source level esti-
mates are reported while making comparisons with various
ship operation parameters such as propeller shaft rotations
and speed-over-ground.
B. Characteristics of the icebreaker Healy
U.S. Coast Guard Cutter (USCGC) Healy (WAGB-20) is
one of the world’s largest non-nuclear polar icebreakers and
was designed as a high-latitude platform for conducting a va-
riety of Arctic and sub-Arctic research. The ship is equipped
with an automated engineering plant, state-of-the-art naviga-
tional equipment, extensive communication and computer
systems, a voyage management system, and a modern suite of
science systems (Berkson and DuPree, 1998).
Healy was commissioned in August 2000 and has an
overall length of 128 m (420 ft), maximum beam of 25 m
(82 ft), full-load draft of 8.9 m (29.2 ft), and full-load dis-
placement of 16,400 LT (Berkson and DuPree, 1998). The
ship’s propulsion is diesel-electric with an ac/ac cyclo-
converter system. The generating plant consists of four Sult-
zer (12Z AU40S) main diesel engines, while propulsion
power is provided by two fully reversing, variable speed,
Westinghouse AC Synchronous drive motors (11.2 MW).
The ship’s control includes two rudders and two fixed pitch
four-bladed propellers with a maximum shaft horsepower of
30 000 horsepower (HP) at 130 revolutions per minute
(rpm). Healy also has a 2500 HP bow thruster with Alstom
dynamic positioning system. There is no bubbler system; a
bow-wash system was installed to lubricate the hull during
icebreaking, but it is rarely used.
Healy’s cruising speed is 12 kn (6.2 m/s) at 105 rpm
with a maximum speed of 17 kn (8.7 m/s) at 147 rpm. Its ice-
breaking capability was designed for breaking through
1.4 m (4.5 ft) thick ice of 690-kPa (100-psi) strength at 3 kn
(1.5 m/s) continuous, while actual (best) performance is
1.7 m (5.5 ft) at 2.6 kn (1.3 m/s) continuous. Healy has pro-
ven capable of breaking ice up to 2.4 m (8 ft) thick while
backing and ramming. For the purposes of this study, we
will consider substantial coverage of ice that is 1.2 m (4 ft)
thick or greater to present heavy ice breaking conditions. In
general, however, the Healy is considered a medium polar
icebreaker (O’Rourke, 2012).
In summer 2008, a research expedition (HLY-0805)
took place in the central Arctic Ocean to map the seafloor in
support of U.S. delineation of an Extended Continental Shelf
under provisions of the U.N. Convention on the Law of the
Sea (Mayer and Armstrong, 2008). During the HLY-0805
cruise from August 14, 2008 to September 5, 2008, passive
acoustic monitoring of USCGC Healy was conducted during
ice-breaking operations in the Chukchi and Beaufort Seas.
These measurements were taken opportunistically by
deploying and tracking omnidirectional sonobuoys on a non-
interference basis with the main science objective. An analy-
sis of these recordings was conducted with the goal of esti-
mating radiated underwater acoustic source levels during
different modes of propulsion in various sea ice conditions.
II. MATERIALS AND METHODS
A. Data collection
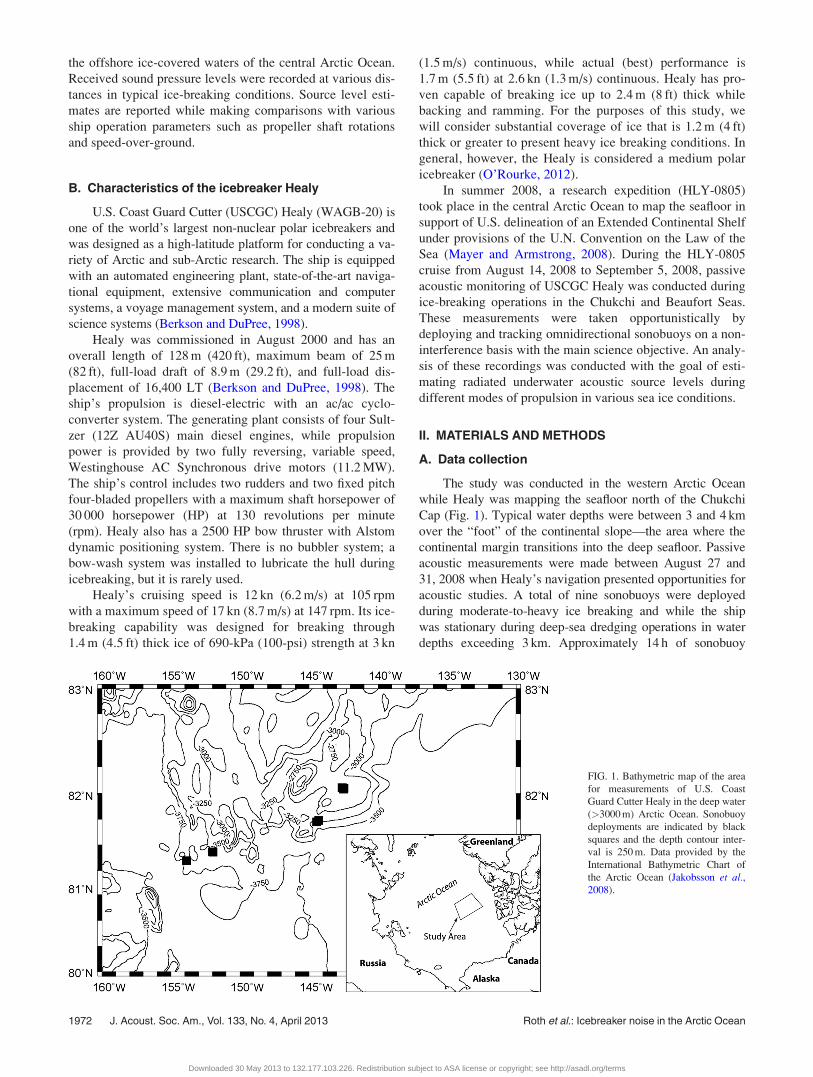
The study was conducted in the western Arctic Ocean
while Healy was mapping the seafloor north of the Chukchi
Cap (Fig. 1). Typical water depths were between 3 and 4 km
over the “foot” of the continental slope—the area where the
continental margin transitions into the deep seafloor. Passive
acoustic measurements were made between August 27 and
31, 2008 when Healy’s navigation presented opportunities for
acoustic studies. A total of nine sonobuoys were deployed
during moderate-to-heavy ice breaking and while the ship
was stationary during deep-sea dredging operations in water
depths exceeding 3 km. Approximately 14 h of sonobuoy
FIG. 1. Bathymetric map of the area
for measurements of U.S. Coast
Guard Cutter Healy in the deep water
(>3000 m) Arctic Ocean. Sonobuoy
deployments are indicated by black
squares and the depth contour inter-
val is 250 m. Data provided by the
International Bathymetric Chart of
the Arctic Ocean (Jakobsson et al.,2008).
1972 J. Acoust. Soc. Am., Vol. 133, No. 4, April 2013 Roth et al.: Icebreaker noise in the Arctic Ocean
Downloaded 30 May 2013 to 132.177.103.226. Redistribution subject to ASA license or copyright; see http://asadl.org/terms
recordings were made. Portions of the sonobuoy recordings in
close proximity to the ship were clipped due to high noise lev-
els and were not used for analysis. Although we assume that
noise generated by the Healy’s propulsion and machinery
dominate the radiated noise, the sounds of breaking ice may
also be included in our recordings.
B. Acoustic recording equipment
The Sparton AN/SSQ-57B is a low frequency analysis
and recording (LOFAR) sonobuoy that provides omnidirec-
tional passive acoustic data between 10 Hz and 30 kHz. The
hydrophone depth was selected to be 122 m (400 ft) for noise
measurements in deep water. A frequency modulated radio
signal was transmitted from the sonobuoys’ very high fre-
quency (VHF) transmitter at the sea surface to an omni-
directional antenna mounted atop Healy’s mast. Signals
were passed to an antenna splitter/amplifier, two ICOM
R100 frequency modulated (FM) radio receivers, a Sound
Blaster Audigy 2NX analog-to-digital (A/D) converter, and
laptop computer. The data were sampled at 48 kHz and
recorded using the real-time data acquisition software ISH-
MAEL (Mellinger, 2001).
Sonobuoys scuttle after 8 h, but more often they would
first exceed the transmission range for sufficient VHF recep-
tion (�5 km). Because sonobuoys were not designed for ice-
covered waters, several deployments failed as the pack ice
reconsolidated aft of Healy’s stern. The increase in surround-
ing pressure sometimes caused damage to the surface elec-
tronics or hydrophone cable. There were also instances
where Healy would reverse direction due to ice conditions,
and the sonobuoy was either destroyed or experienced inter-
mittent data loss due to contact with the ship.
C. Hydrophone calibration
The Sparton Corporation provides nominal calibration
curves for the sonobuoy model used in these measurements.
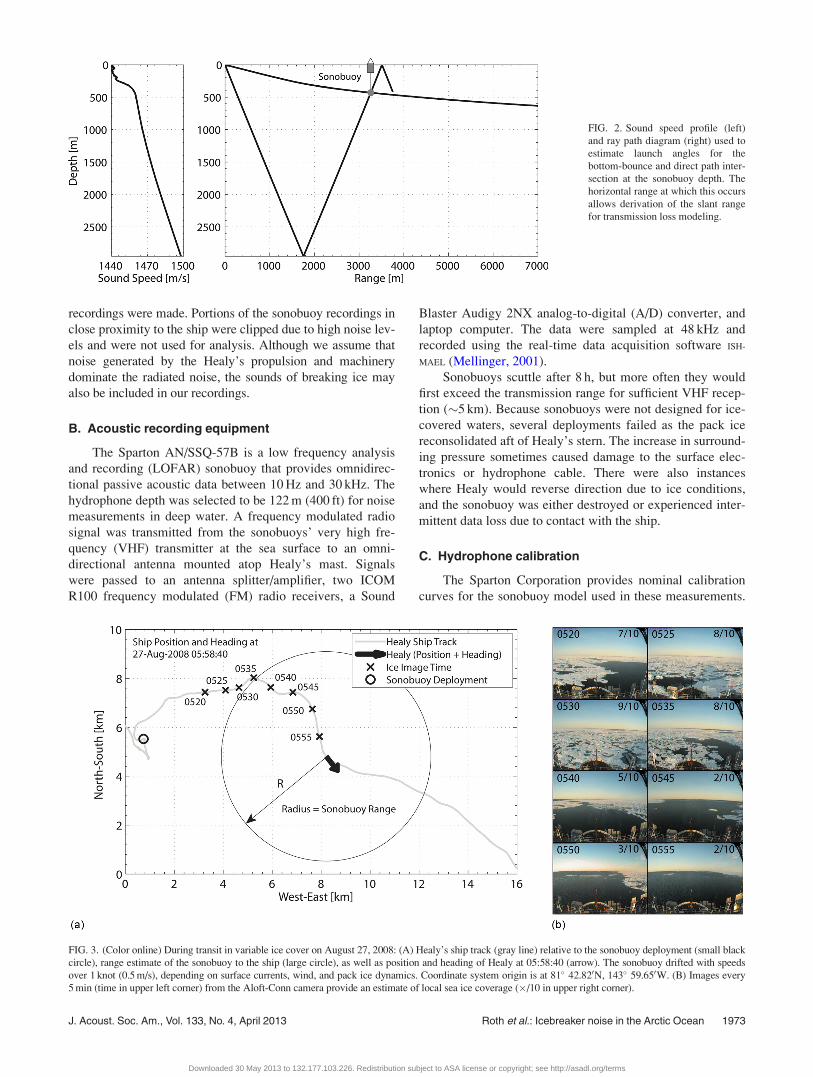
FIG. 2. Sound speed profile (left)
and ray path diagram (right) used to
estimate launch angles for the
bottom-bounce and direct path inter-
section at the sonobuoy depth. The
horizontal range at which this occurs
allows derivation of the slant range
for transmission loss modeling.
FIG. 3. (Color online) During transit in variable ice cover on August 27, 2008: (A) Healy’s ship track (gray line) relative to the sonobuoy deployment (small black
circle), range estimate of the sonobuoy to the ship (large circle), as well as position and heading of Healy at 05:58:40 (arrow). The sonobuoy drifted with speeds
over 1 knot (0.5 m/s), depending on surface currents, wind, and pack ice dynamics. Coordinate system origin is at 81� 42.820N, 143� 59.650W. (B) Images every
5 min (time in upper left corner) from the Aloft-Conn camera provide an estimate of local sea ice coverage (�/10 in upper right corner).
J. Acoust. Soc. Am., Vol. 133, No. 4, April 2013 Roth et al.: Icebreaker noise in the Arctic Ocean 1973
Downloaded 30 May 2013 to 132.177.103.226. Redistribution subject to ASA license or copyright; see http://asadl.org/terms
Because actual calibration values may vary slightly in manu-
facturing, several sonobuoys were saved from the same
manufacturing batches as those used in the field. Post-
experiment calibrations of the hydrophones were conducted
at the Transducer Evaluation Center (TRANSDEC) facility
in San Diego, CA.
Calibration runs were performed at a depth of 6 m to
measure the received sensitivity of each sonobuoy in
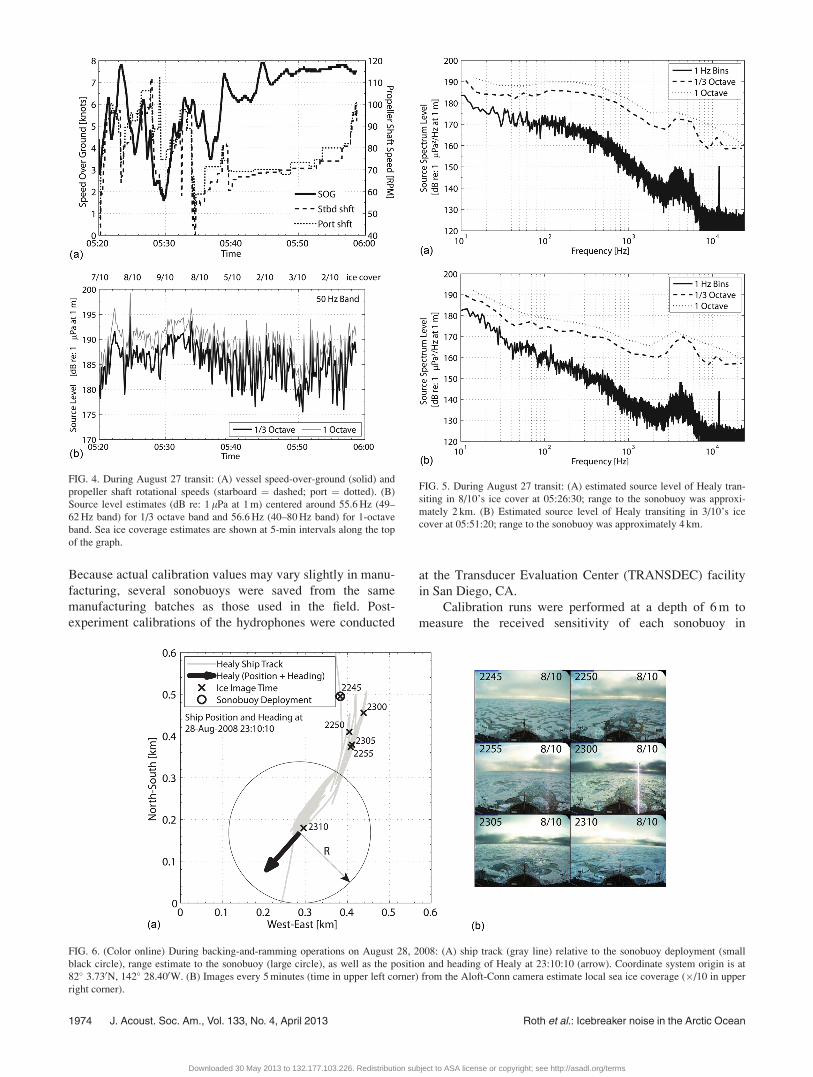
FIG. 4. During August 27 transit: (A) vessel speed-over-ground (solid) and
propeller shaft rotational speeds (starboard ¼ dashed; port ¼ dotted). (B)
Source level estimates (dB re: 1 lPa at 1 m) centered around 55.6 Hz (49–
62 Hz band) for 1/3 octave band and 56.6 Hz (40–80 Hz band) for 1-octave
band. Sea ice coverage estimates are shown at 5-min intervals along the top
of the graph.
FIG. 5. During August 27 transit: (A) estimated source level of Healy tran-
siting in 8/10’s ice cover at 05:26:30; range to the sonobuoy was approxi-
mately 2 km. (B) Estimated source level of Healy transiting in 3/10’s ice
cover at 05:51:20; range to the sonobuoy was approximately 4 km.
FIG. 6. (Color online) During backing-and-ramming operations on August 28, 2008: (A) ship track (gray line) relative to the sonobuoy deployment (small
black circle), range estimate to the sonobuoy (large circle), as well as the position and heading of Healy at 23:10:10 (arrow). Coordinate system origin is at
82� 3.730N, 142� 28.400W. (B) Images every 5 minutes (time in upper left corner) from the Aloft-Conn camera estimate local sea ice coverage (�/10 in upper
right corner).
1974 J. Acoust. Soc. Am., Vol. 133, No. 4, April 2013 Roth et al.: Icebreaker noise in the Arctic Ocean
Downloaded 30 May 2013 to 132.177.103.226. Redistribution subject to ASA license or copyright; see http://asadl.org/terms
response to calibrated source transducers transmitting differ-
ent frequency tones from 10 Hz to 30 kHz at a distance of
2-10 m. An expected transfer function or frequency response
calibration was computed based on the sensitivity of the
transducer elements in addition to the signal conditioning
provided by the amplifiers in the hydrophone, radio, and
A/D converter. There was an uncertainty of 61–2 dB associ-
ated with the calculated transfer function compared to the
measured calibration response. Once the transfer function
was applied to the raw data, measurements were reported as
received pressure levels (dB re: 1 lPa rms).
D. Signal processing
The MATLAB-based (The MathWorks Inc., Natick, MA)
software package TRITON (Wiggins and Hildebrand, 2007)
was used for first-level signal processing to determine
whether data were clipped or not of suitable quality due to
poor VHF radio transmission. In general, if the hydrophone
was within 1 km of Healy, the data were clipped and not
used. When the sonobuoy was greater than 5 km from Healy,
it became difficult for the radio receiver to acquire continu-
ous data with good quality.
Spectral measurements are calculated from 1 or 5 s sam-
ples of continuous data with no overlap between each spectral
average using the Goertzel algorithm to calculate power spec-
tral densities from discrete-time fast Fourier transforms
(FFTs). All spectra were processed with a Hanning window
and 48 000-point FFT length, yielding 1 Hz frequency bins.
For comparative analysis, spectral measurements are reported
using 1 Hz bins as well as 1/3 and 1 octave bands based on a
starting frequency of 10 Hz. After correcting for transmission
loss, measurements are reported as source levels at 1 m.
E. Source/receiver range and azimuth
To estimate source levels from measured received lev-
els, range estimation from the ship to the sonobuoy was
required to calculate transmission losses. In correcting for
transmission loss, a range dependent spreading loss of
20 log10(R) was assumed, where R is the source/receiver
slant range in meters. Ray-trace refraction and reflection
analysis was used to estimate the distance between Healy’s
sonar and the sonobuoy hydrophone. The time difference
between arrivals resulting from direct path and first bottom
reflection of the ship’s 12 kHz echo sounder were measured
in the sonobuoy acoustic data. These direct-path/first-reflec-
tion time differences were converted to ranges between the
ship and the sonobuoy through an iterative procedure in
which an acoustic propagation model, incorporating the
measured sound speed profile, local water depth, and depth
of the sonobuoy hydrophone, were adjusted until the
observed time difference was matched (Fig. 2 and supple-
mentary Figs. 1 and 2).1 Over the relatively short propaga-
tion ranges used for this study (1–5 km), we found that
20 log10(R) was a good approximation for the transmission
loss. The geometry and range of our measurements are such
that direct path propagation is all but guaranteed, and sound
scattering or reradiating from the water-ice interface is not
thought to contribute meaningfully to our measurements.
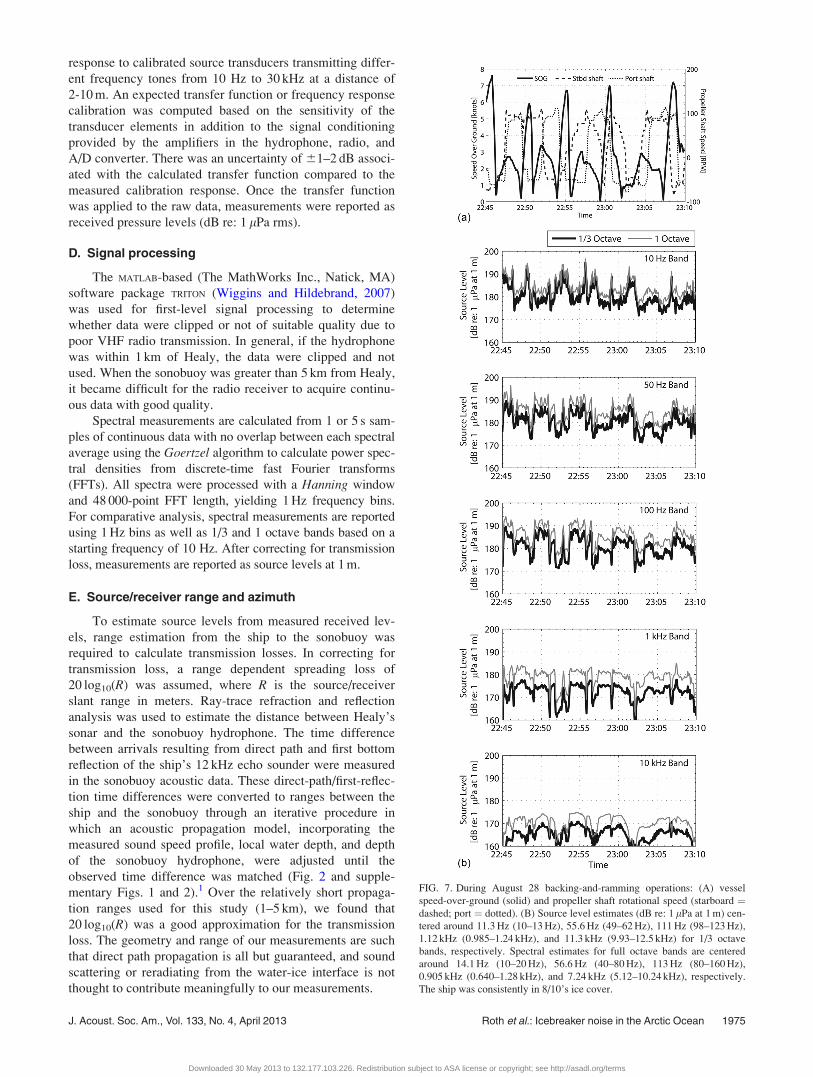
FIG. 7. During August 28 backing-and-ramming operations: (A) vessel
speed-over-ground (solid) and propeller shaft rotational speed (starboard ¼dashed; port ¼ dotted). (B) Source level estimates (dB re: 1 lPa at 1 m) cen-
tered around 11.3 Hz (10–13 Hz), 55.6 Hz (49–62 Hz), 111 Hz (98–123 Hz),
1.12 kHz (0.985–1.24 kHz), and 11.3 kHz (9.93–12.5 kHz) for 1/3 octave
bands, respectively. Spectral estimates for full octave bands are centered
around 14.1 Hz (10–20 Hz), 56.6 Hz (40–80 Hz), 113 Hz (80–160 Hz),
0.905 kHz (0.640–1.28 kHz), and 7.24 kHz (5.12–10.24 kHz), respectively.
The ship was consistently in 8/10’s ice cover.
J. Acoust. Soc. Am., Vol. 133, No. 4, April 2013 Roth et al.: Icebreaker noise in the Arctic Ocean 1975
Downloaded 30 May 2013 to 132.177.103.226. Redistribution subject to ASA license or copyright; see http://asadl.org/terms
Because the sonobuoys drifted due to pack ice move-
ments, winds, and ocean currents, the relative bearing of the
sonobuoy to the ship, and hence the azimuthal aspect of the
ship that was measured at any instant is not known. There-
fore azimuthal variations in the ship’s radiated noise are not
considered in the analysis. When directionality in ship-
generated noise due to propeller cavitation has been previ-
ously observed, it is described as a dipole with smaller
amplitudes on the ship’s bow and stern (Arveson and Vendit-
tis, 2000). Limited visual observations of the sonobuoy
deployments indicated that the sonobuoy likely remained
abaft the beam when Healy was transiting. This may lead to
slightly decreased measurements from those produced in ac-
cordance with the ANSI standard (ANSI, 2009), which
specifies measurements within 30� of the ship’s beam.
F. Ancillary data
Healy is equipped with a ship-wide computerized data
logging system that records and stores data from the naviga-
tion, oceanographic, engineering, and communications sys-
tems. Several of these ancillary measurements were used for
analysis, including Healy’s position, heading, and speed over
ground, as well as environmental information such as the
local sea ice coverage, which was estimated from time-lapse
images to the nearest 10%. The engineering data provided the
time along with corresponding port and starboard propeller
shaft speeds averaged from the cycloconverter readings and
converted from percentages to pure shaft rpm’s.
III. RESULTS
Several transient and continuous acoustic events were
selected as case studies for analysis that most accurately
reflect Healy’s noise signature. Propulsion modes include
transit in varying pack ice conditions, backing-and-ramming
maneuvers, and dynamic positioning.
A. Transit in variable ice cover
During August 27, Healy transited from nearly complete
sea ice cover to an open-water polynya (Fig. 3 and supple-
mentary Fig. 1). Healy’s transition from ice-breaking to
open water is evident at approximately 05:37 when propeller
shaft rpm’s decreased and speed over ground (SOG)
increased as the resistance to movement abated in open
water [Fig. 4(A)]. A time series of source level estimates
centered near 50 Hz shows a decrease in mean level during
the transition from ice-breaking to open water [at 05:37 in
Fig. 4(B)]. Moreover, large amplitude noise peaks [e.g.,
05:22 and 05:24 in Fig. 4(B)] are reduced when the ship is
operating in open water.
A comparison of source spectrum levels while Healy is
transiting through 8/10’s and 3/10’s ice cover is shown in
Figs. 5(A) and 5(B), respectively. At 10 Hz, both source spec-
tra exhibit similar levels of about 182–183 dB re: 1 lPa2/Hz at
1 m (1 Hz bins). Above 20 Hz, however, there is a 10 dB dif-
ference on average between the two source spectra. In ice-
covered waters, the full octave band remains approximately
flat between 100 and 300 Hz [Fig. 5(A)], while in open water
the full octave band slopes steadily downward with frequency
up to 2 kHz [Fig. 5(B)]. In the 1 Hz bin spectra, underwater
noise levels are higher by as much as 15 dB between 200 Hz
and 2 kHz during moderate ice-breaking conditions when
compared to open-water transit. In both spectra, elevated lev-
els between 3 and 5 kHz are attributed to the acoustic chirp
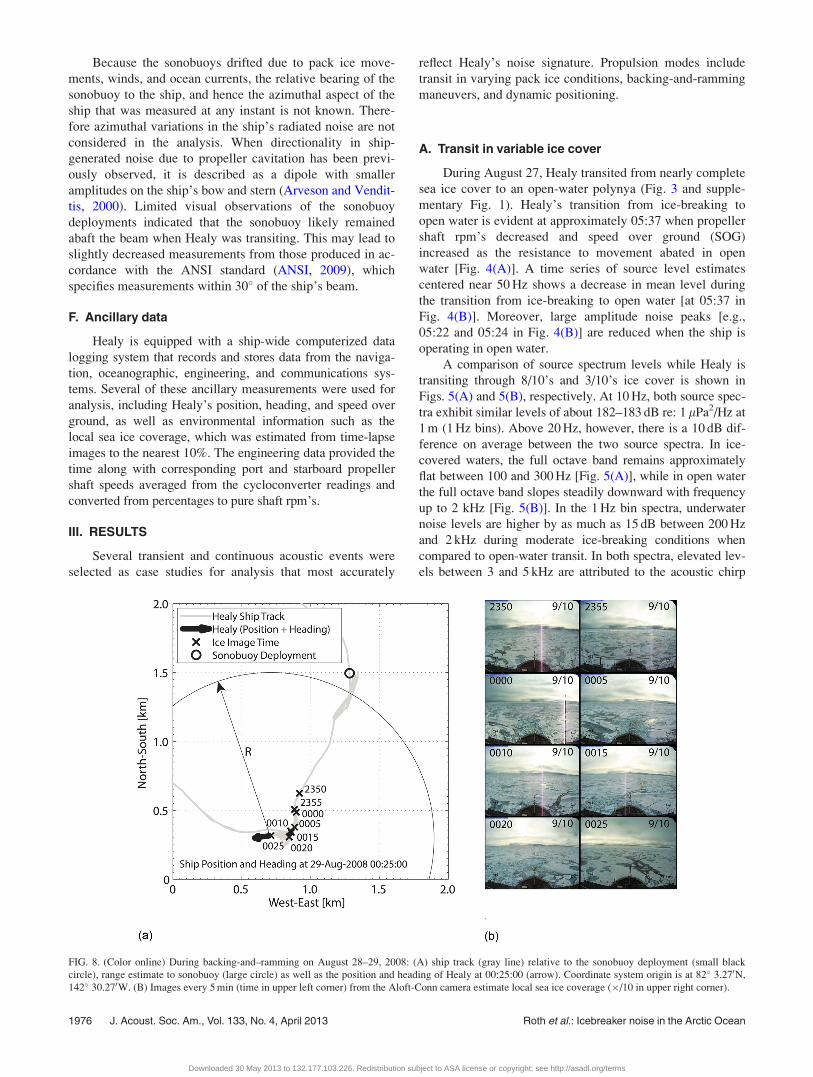
FIG. 8. (Color online) During backing-and–ramming on August 28–29, 2008: (A) ship track (gray line) relative to the sonobuoy deployment (small black
circle), range estimate to sonobuoy (large circle) as well as the position and heading of Healy at 00:25:00 (arrow). Coordinate system origin is at 82� 3.270N,
142� 30.270W. (B) Images every 5 min (time in upper left corner) from the Aloft-Conn camera estimate local sea ice coverage (�/10 in upper right corner).
1976 J. Acoust. Soc. Am., Vol. 133, No. 4, April 2013 Roth et al.: Icebreaker noise in the Arctic Ocean
Downloaded 30 May 2013 to 132.177.103.226. Redistribution subject to ASA license or copyright; see http://asadl.org/terms
from the ship’s Knudsen sub-bottom profiler. Narrowband
peaks at 12 kHz are due to the ping produced by Healy’s Sea-
Beam 2102 multibeam echo sounder.
B. Backing-and-ramming in full ice cover
On August 28, a sonobuoy recording was made during
multiple backing-and-ramming maneuvers [Fig. 6(A) and
supplementary Fig. 2]. Twenty-five minutes of the recording
were analyzed while the ship was in consistent 8/10’s ice
cover [Fig. 6(B)]. The port and starboard screws were not
operated simultaneously in the same direction as the ship
attempted to change its heading in the ice [Fig. 7(A)]. The
non-synchronous operation of the two screws complicated
attempts to correlate rpm’s with source levels during this re-
cording. Positive (i.e., forward) rpm movement and subse-
quent increases in SOG characterize ramming. Negative (i.e.,
sternward) rpm movement and subsequent increases in SOG
characterize backing. The ship reached 6–7 kn (3.1–3.6 m/s)
forward speed before progress was halted by the pack ice.
Reversing the direction of the screws, the ship backed up,
reaching speeds around 3 kn (1.5 m/s) before attempting to
make forward progress again. This alteration in SOG indicates
that the ship was breaking heavy ice while making forward
progress into the hole created by the previous ram.
The modulation in SOG over the course of the recording
corresponds with the source level time series shown in Fig.
7(B). Healy’s noise signature was examined in frequency
bands by orders of magnitude (i.e., centered near 101, 102,
103, and 104 Hz), including one centered near 50 Hz, to see if
the distribution of source levels was frequency dependent.
For the time series centered near 10, 50, and 100 Hz, source
levels increased 10 dB in several instances, correlating with
negative rpm’s of one or both of the ship’s propeller shafts.
The effect is shown to a lesser extent in frequency bands
centered near 1 and 10 kHz. The highest estimated source
level reached during this recording was about 195 dB re:
1 lPa at 1 m, in full octave bands at 10 and 50 Hz.
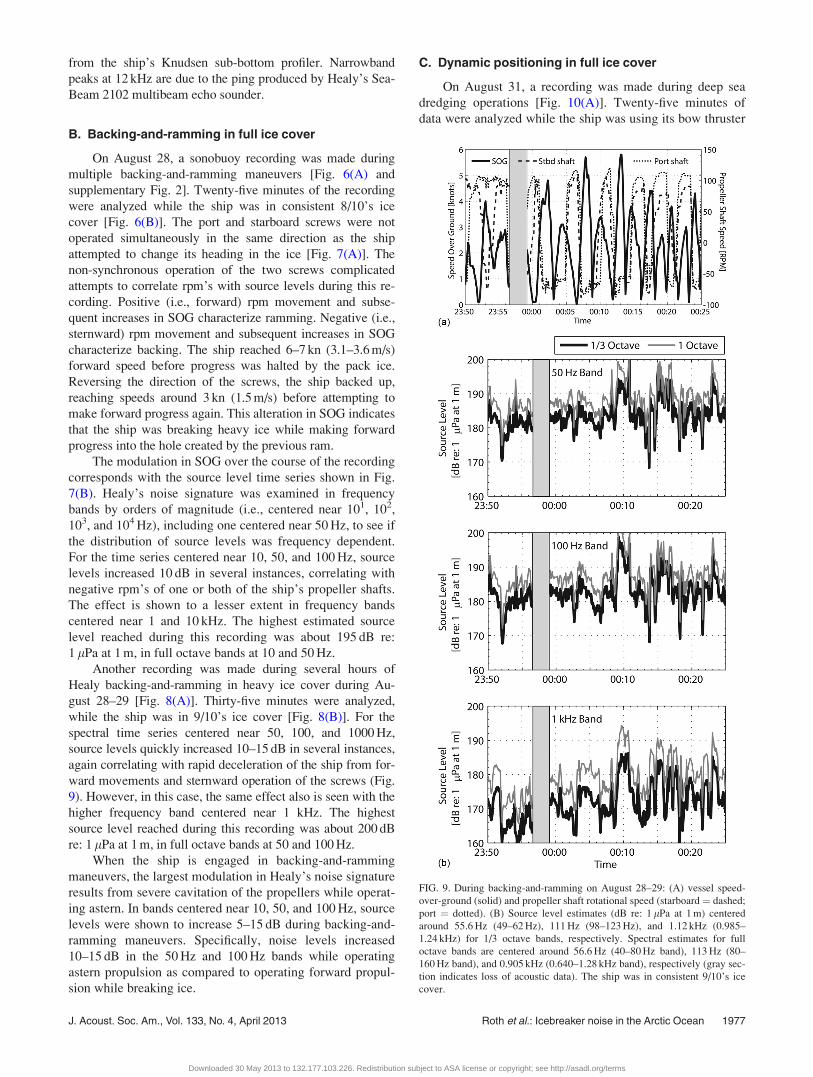
Another recording was made during several hours of
Healy backing-and-ramming in heavy ice cover during Au-
gust 28–29 [Fig. 8(A)]. Thirty-five minutes were analyzed,
while the ship was in 9/10’s ice cover [Fig. 8(B)]. For the
spectral time series centered near 50, 100, and 1000 Hz,
source levels quickly increased 10–15 dB in several instances,
again correlating with rapid deceleration of the ship from for-
ward movements and sternward operation of the screws (Fig.
9). However, in this case, the same effect also is seen with the
higher frequency band centered near 1 kHz. The highest
source level reached during this recording was about 200 dB
re: 1 lPa at 1 m, in full octave bands at 50 and 100 Hz.
When the ship is engaged in backing-and-ramming
maneuvers, the largest modulation in Healy’s noise signature
results from severe cavitation of the propellers while operat-
ing astern. In bands centered near 10, 50, and 100 Hz, source
levels were shown to increase 5–15 dB during backing-and-
ramming maneuvers. Specifically, noise levels increased
10–15 dB in the 50 Hz and 100 Hz bands while operating
astern propulsion as compared to operating forward propul-
sion while breaking ice.
C. Dynamic positioning in full ice cover
On August 31, a recording was made during deep sea
dredging operations [Fig. 10(A)]. Twenty-five minutes of
data were analyzed while the ship was using its bow thruster
FIG. 9. During backing-and-ramming on August 28–29: (A) vessel speed-
over-ground (solid) and propeller shaft rotational speed (starboard ¼ dashed;
port ¼ dotted). (B) Source level estimates (dB re: 1 lPa at 1 m) centered
around 55.6 Hz (49–62 Hz), 111 Hz (98–123 Hz), and 1.12 kHz (0.985–
1.24 kHz) for 1/3 octave bands, respectively. Spectral estimates for full
octave bands are centered around 56.6 Hz (40–80 Hz band), 113 Hz (80–
160 Hz band), and 0.905 kHz (0.640–1.28 kHz band), respectively (gray sec-
tion indicates loss of acoustic data). The ship was in consistent 9/10’s ice
cover.
J. Acoust. Soc. Am., Vol. 133, No. 4, April 2013 Roth et al.: Icebreaker noise in the Arctic Ocean 1977
Downloaded 30 May 2013 to 132.177.103.226. Redistribution subject to ASA license or copyright; see http://asadl.org/terms
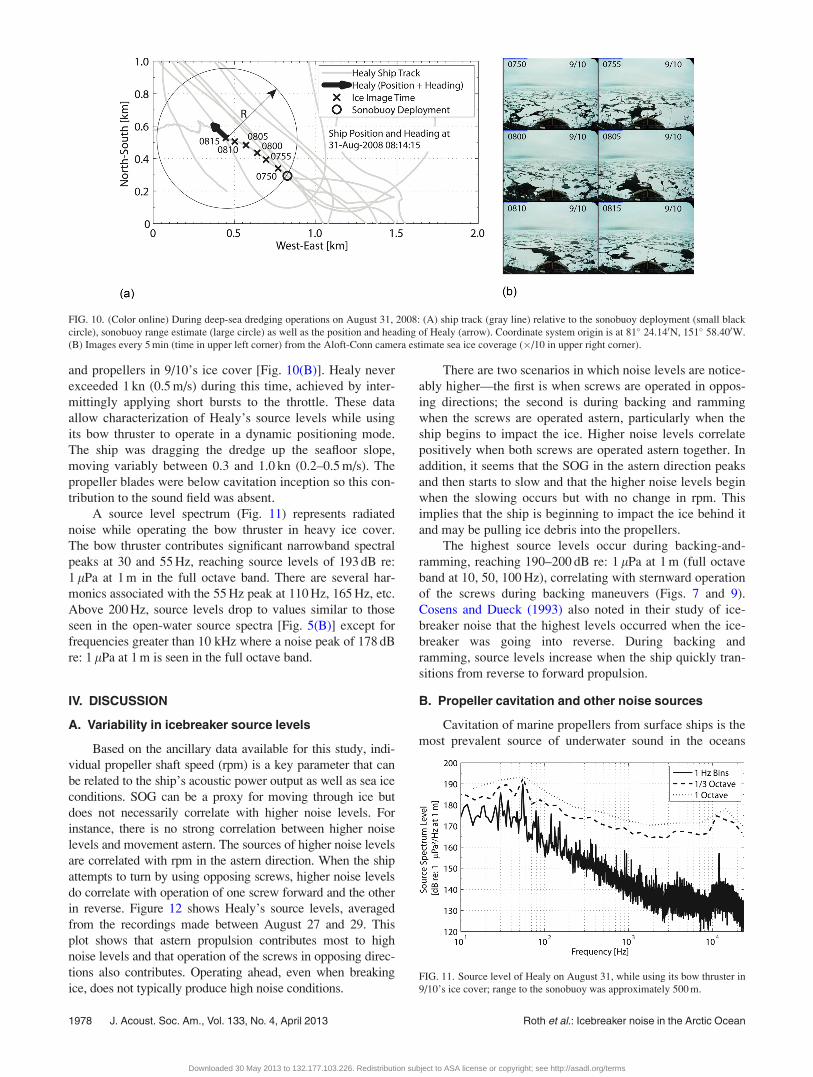
and propellers in 9/10’s ice cover [Fig. 10(B)]. Healy never
exceeded 1 kn (0.5 m/s) during this time, achieved by inter-
mittingly applying short bursts to the throttle. These data
allow characterization of Healy’s source levels while using
its bow thruster to operate in a dynamic positioning mode.
The ship was dragging the dredge up the seafloor slope,
moving variably between 0.3 and 1.0 kn (0.2–0.5 m/s). The
propeller blades were below cavitation inception so this con-
tribution to the sound field was absent.
A source level spectrum (Fig. 11) represents radiated
noise while operating the bow thruster in heavy ice cover.
The bow thruster contributes significant narrowband spectral
peaks at 30 and 55 Hz, reaching source levels of 193 dB re:
1 lPa at 1 m in the full octave band. There are several har-
monics associated with the 55 Hz peak at 110 Hz, 165 Hz, etc.
Above 200 Hz, source levels drop to values similar to those
seen in the open-water source spectra [Fig. 5(B)] except for
frequencies greater than 10 kHz where a noise peak of 178 dB
re: 1 lPa at 1 m is seen in the full octave band.
IV. DISCUSSION
A. Variability in icebreaker source levels
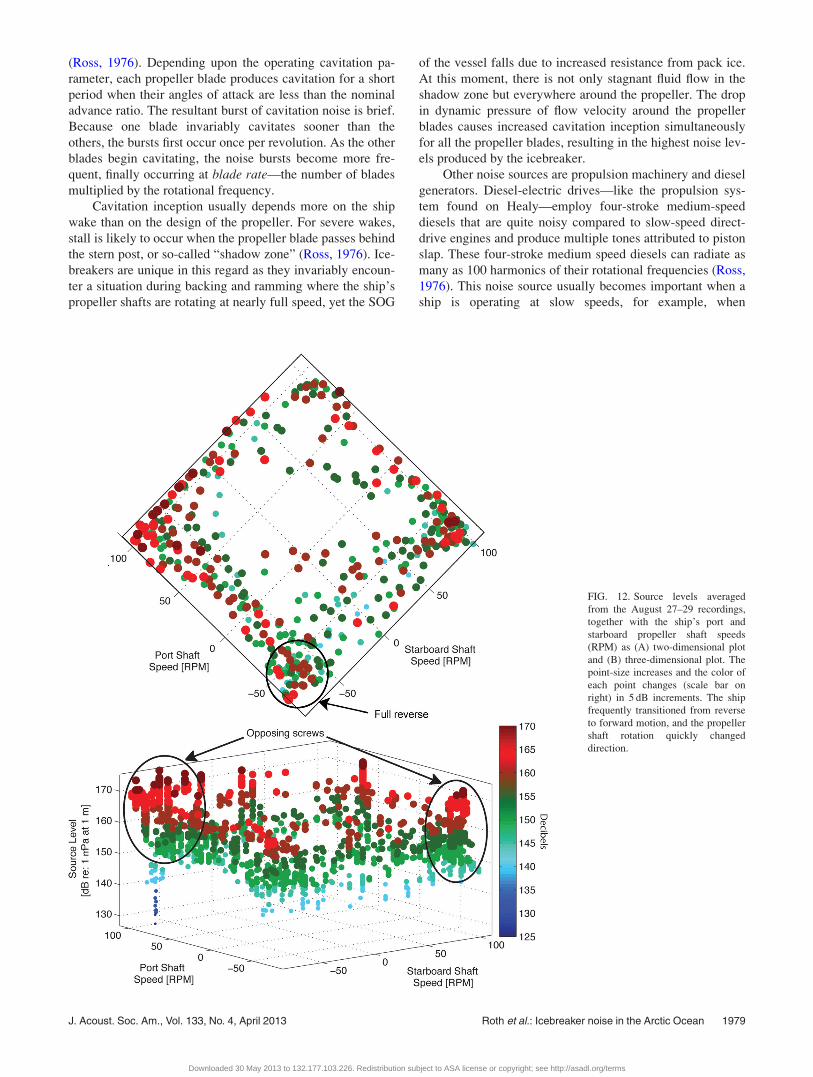
Based on the ancillary data available for this study, indi-
vidual propeller shaft speed (rpm) is a key parameter that can
be related to the ship’s acoustic power output as well as sea ice
conditions. SOG can be a proxy for moving through ice but
does not necessarily correlate with higher noise levels. For
instance, there is no strong correlation between higher noise
levels and movement astern. The sources of higher noise levels
are correlated with rpm in the astern direction. When the ship
attempts to turn by using opposing screws, higher noise levels
do correlate with operation of one screw forward and the other
in reverse. Figure 12 shows Healy’s source levels, averaged
from the recordings made between August 27 and 29. This
plot shows that astern propulsion contributes most to high
noise levels and that operation of the screws in opposing direc-
tions also contributes. Operating ahead, even when breaking
ice, does not typically produce high noise conditions.
There are two scenarios in which noise levels are notice-
ably higher—the first is when screws are operated in oppos-
ing directions; the second is during backing and ramming
when the screws are operated astern, particularly when the
ship begins to impact the ice. Higher noise levels correlate
positively when both screws are operated astern together. In
addition, it seems that the SOG in the astern direction peaks
and then starts to slow and that the higher noise levels begin
when the slowing occurs but with no change in rpm. This
implies that the ship is beginning to impact the ice behind it
and may be pulling ice debris into the propellers.
The highest source levels occur during backing-and-
ramming, reaching 190–200 dB re: 1 lPa at 1 m (full octave
band at 10, 50, 100 Hz), correlating with sternward operation
of the screws during backing maneuvers (Figs. 7 and 9).
Cosens and Dueck (1993) also noted in their study of ice-
breaker noise that the highest levels occurred when the ice-
breaker was going into reverse. During backing and
ramming, source levels increase when the ship quickly tran-
sitions from reverse to forward propulsion.
B. Propeller cavitation and other noise sources
Cavitation of marine propellers from surface ships is the
most prevalent source of underwater sound in the oceans
FIG. 10. (Color online) During deep-sea dredging operations on August 31, 2008: (A) ship track (gray line) relative to the sonobuoy deployment (small black
circle), sonobuoy range estimate (large circle) as well as the position and heading of Healy (arrow). Coordinate system origin is at 81� 24.140N, 151� 58.400W.
(B) Images every 5 min (time in upper left corner) from the Aloft-Conn camera estimate sea ice coverage (�/10 in upper right corner).
FIG. 11. Source level of Healy on August 31, while using its bow thruster in
9/10’s ice cover; range to the sonobuoy was approximately 500 m.
1978 J. Acoust. Soc. Am., Vol. 133, No. 4, April 2013 Roth et al.: Icebreaker noise in the Arctic Ocean
Downloaded 30 May 2013 to 132.177.103.226. Redistribution subject to ASA license or copyright; see http://asadl.org/terms
(Ross, 1976). Depending upon the operating cavitation pa-
rameter, each propeller blade produces cavitation for a short
period when their angles of attack are less than the nominal
advance ratio. The resultant burst of cavitation noise is brief.
Because one blade invariably cavitates sooner than the
others, the bursts first occur once per revolution. As the other
blades begin cavitating, the noise bursts become more fre-
quent, finally occurring at blade rate—the number of blades
multiplied by the rotational frequency.
Cavitation inception usually depends more on the ship
wake than on the design of the propeller. For severe wakes,
stall is likely to occur when the propeller blade passes behind
the stern post, or so-called “shadow zone” (Ross, 1976). Ice-
breakers are unique in this regard as they invariably encoun-
ter a situation during backing and ramming where the ship’s
propeller shafts are rotating at nearly full speed, yet the SOG
of the vessel falls due to increased resistance from pack ice.
At this moment, there is not only stagnant fluid flow in the
shadow zone but everywhere around the propeller. The drop
in dynamic pressure of flow velocity around the propeller
blades causes increased cavitation inception simultaneously
for all the propeller blades, resulting in the highest noise lev-
els produced by the icebreaker.
Other noise sources are propulsion machinery and diesel
generators. Diesel-electric drives—like the propulsion sys-
tem found on Healy—employ four-stroke medium-speed
diesels that are quite noisy compared to slow-speed direct-
drive engines and produce multiple tones attributed to piston
slap. These four-stroke medium speed diesels can radiate as
many as 100 harmonics of their rotational frequencies (Ross,
1976). This noise source usually becomes important when a
ship is operating at slow speeds, for example, when
FIG. 12. Source levels averaged
from the August 27–29 recordings,
together with the ship’s port and
starboard propeller shaft speeds
(RPM) as (A) two-dimensional plot
and (B) three-dimensional plot. The
point-size increases and the color of
each point changes (scale bar on
right) in 5 dB increments. The ship
frequently transitioned from reverse
to forward motion, and the propeller
shaft rotation quickly changed
direction.
J. Acoust. Soc. Am., Vol. 133, No. 4, April 2013 Roth et al.: Icebreaker noise in the Arctic Ocean 1979
Downloaded 30 May 2013 to 132.177.103.226. Redistribution subject to ASA license or copyright; see http://asadl.org/terms
icebreakers maneuver through substantially thick, ice-
covered waters. For this reason, Healy’s engines are located
on the main deck to reduce noise for the sonar systems.
Ross (1976) has suggested that the total noise radiated
by a surface ship may be estimated from
SPL ¼ 126þ 15 logðHPÞin dB re: 1lPa at 1 m;where HP ¼ horsepower. As an example, if Healy’s maxi-
mum shaft horsepower is 30 000 HP at 130 rpm, then the
source level would be about 193 dB re: 1lPa at 1 m, which is
similar to those peak values presented here for low frequen-
cies during low SOG when operating in pack ice.
V. CONCLUSIONS
The presence of sea ice represents a significant obstacle
to vessels operating anywhere in polar waters, and requires
specially constructed ships and navigational skills (Brigham,
2000). The thinning Arctic ice pack is allowing for longer sea-
sons of navigation for icebreakers and other polar-class ves-
sels. Increases in vessel traffic around the Arctic Ocean may
result in an increase in the risk of disturbance from ship noise
on migrating and foraging whales as well as other marine ani-
mals. In an effort to better predict these risks, protocols for
the measurement of radiated ship noise (ANSI, 2009) should
be expanded specifically to icebreakers operating in polar
regions with ice-covered waters. Combined with a more thor-
ough understanding of under-ice acoustic propagation, stand-
ard measurements such as these will allow better management
of our shared Arctic resources.
ACKNOWLEDGMENTS
Support for the field program was provided by the Center
for Coastal and Ocean Mapping/Joint Hydrographic Center
(CCOM/JHC) and the U.S. Coast Guard. The authors would
like to thank Jon Childs of the U.S. Geological Survey for
providing funding and support for this work. We also thank
Larry Mayer of CCOM/JHC, who provided field support and
allowed us to conduct acoustic measurements opportunisti-
cally during the HLY-0805 cruise; Philip McGillivary of the
U.S. Coast Guard, who encouraged us to initiate the study;
the crew of USCGC Healy, especially engineering officers
LCDR Doug Petrusa and ENS Lisa Myatt, who provided en-
gineering data recorded during our acoustic measurements;
and Don Ross who provided valuable insight and guidance on
underwater noise research. Funding for this work has been
provided by the U.S. Interagency Extended Continental Shelf
Task Force, consisting of representatives from the Department
of State, NOAA, Department of Interior (USGS, MMS), U.S.
Coast Guard, National Science Foundation, and Arctic
Research Commission, among others. Neither the Extended
Continental Task Force, nor individual agencies endorse the
conclusions of this study.
1See supplementary material at http://dx.doi.org/10.1121/1.4790356 for
supplemental Figs. 1 and 2.
ANSI (2009). S12.64, American National Standard, Quantities and Proce-dures for Description and Measurement of Underwater Sound from Ships.Part 1. General Requirements (Acoustical Society of America, New
York).
Arctic Council (2009). Arctic Marine Shipping Assessment 2009 Report,2nd printing (Arctic Council, Troms�, Norway), p. 194.
Arveson, P. T., and Vendittis, D. J. (2000). “Radiated noise characteristics
of a modern cargo ship,” J. Acoust. Soc. Am. 107(1), 118–129.
Berkson, J., and DuPree, G. (1998). “USCGC Healy: The United States’
new polar research icebreaking vessel,” www.uscg.mil/history/webcutters/
HealyNarrative.pdf (Last viewed January 27, 2010).
Brigham, L. W. (2000). The Emerging International Polar NavigationCode: Bi-Polar Relevance? (Cambridge University Press, Cambridge,
UK), p. 221–243.
Cosens, S. E., and Dueck, L. P. (1993). “Icebreaker noise in Lancaster
Sound, N.W.T., Canada: Implications for marine mammal behavior,” Ma-
rine Mammal Sci. 9(3), 285–300.
Etter, P. C. (2003). Underwater Acoustic Modeling and Simulation (Spon
Press, New York), p. 384.
Jakobsson, M., Macnab, R., Mayer, L., Anderson, R., Edwards, M., Hatzky,
J., Schenke, H. W., and Johnson, P. (2008). “An improved bathymetric
portrayal of the Arctic Ocean: Implications for ocean modeling and geo-
logical, geophysical and oceanographic analyses,” Geophys. Res. Lett. 35,
L07602.
Jensen, Ø. (2007). “The IMO guidelines for ships operating in arctic ice-
covered waters: From voluntary to mandatory tool for navigation safety
and environmental protection,” FNI-rapport 2/2007 (The Fridtjof Nansen
Institute, Lysaker, Norway), p. 32.
Mayer, L. A., and Armstrong, A. A. (2008). USCGC Icebreaker Healy(WAGB-20) U.S. Law of the Sea Cruise to Map the Foot of the Slope and2500-m Isobath of the US Arctic Ocean Margin (Center for Coastal and
Ocean Mapping/Joint Hydrographic Center, University of New Hamp-
shire, Durham. NH), p. 179.
Mellinger, D. K. (2001). Ishmael 1.0 User’s Guide. NOAA Technical Report
OAR-PMEL-120 (NOAA Pacific Marine Environmental Laboratory, Seat-
tle, WA), p. 30.
Milne, A. R., and Ganton, J. H. (1964). “Ambient noise under Arctic-Sea
ice,” J. Acoust. Soc. Am. 36(5), 855–863.
O’Rourke, R. (2012). Coast Guard Polar Icebreaker Modernization: Back-ground and Issues for Congress (Congressional Research Service, Wash-
ington, DC), p. 4–6.
Ross, D. (1976). Mechanics of Underwater Noise (Pergamon, New York), p.
375.
Wiggins, S. M., and Hildebrand, J. A. (2007). “High-Frequency Acoustic
Recording Package (HARP) for broad-band, long-term marine mammal
monitoring,” in International Symposium on Underwater Technology2007 and International Workshop on Scientific Use of Submarine Cablesand Related Technologies 2007, Tokyo, Japan, Institute of Electrical and
Electronics Engineers.
1980 J. Acoust. Soc. Am., Vol. 133, No. 4, April 2013 Roth et al.: Icebreaker noise in the Arctic Ocean
Downloaded 30 May 2013 to 132.177.103.226. Redistribution subject to ASA license or copyright; see http://asadl.org/terms