Embed Size (px)
Citation preview

May 2008 AG/Soils/2008-01pr
Understanding Your Soil Test Report Grant E. Cardon, USU Extension Soil Specialist
Jan Kotuby-Amacher, Coordinator for North American Proficiency Testing Program Pam Hole, Supervisor USU Analytical Labs Rich Koenig, Washington State University
Regular soil testing helps to develop and maintain more productive soils for farming, gardening, and landscaping. The purpose of this guide is to help you understand and interpret the results from a Utah State University soil test report. Additional Utah State University Extension bulletins are available, which address solutions to specific soil problems and offer guidance on fertilizer selection and use. See “Where to obtain additional information” at the end of this guide. General Information A soil test report (Figure 1) lists the date the sample was received and when analyses were completed, as well as the lab number assigned to your sample. Use this number when contacting the lab with questions about your report. The sample identification is the name you assigned to your sample. The crop to be grown (or garden or lawn) is also listed, as well as any comments you provided on the information form submitted with your sample. The bulk of the report is composed of the results of tests you specified, test interpretations, and recommendations. The utility of a soil test report depends largely on understanding the results in the context of the need for improvements or remedial measures in the soil physical (texture, structure, etc.) and chemical (pH, salinity, plant nutrient content, etc.) characteristics. To better understand the need for manipulation of these important soil conditions, this report offers two resources. First, each section of the soil test report is described along with a brief overview of
the role of that soil condition on the soil’s function and productivity. Secondly, a set of detailed tables of soil test interpretations and associated recommendations for amending soil is provided for the various settings or land uses under consideration for any given soil. As research continues, soil test interpretations can change as new information or technologies emerge. Therefore, the interpretations are subject to modification from time to time, and will be periodically updated within this publication. A routine soil analysis includes an estimate of soil texture, and lab analysis of pH, soil salinity (ECe), and the levels of plant available phosphorus and potassium in the sample. This core of tests provides the minimum information needed to manage a soil for optimum physical conditioning and plant growth and performance. Additional tests are available to determine soil nitrogen levels, micronutrient levels (such as sulfur, iron, zinc, etc.), organic matter content, salt ion balances, and specific elemental analysis.

Figure 1. Example Soil Test Report

A regular program of soil testing and evaluation of the results (particularly of routine analyses), coupled with the guidance provided by this document and Extension personnel at the county and state levels, will ensure that soil quality and productivity can be optimized and maintained at desirable levels. In addition to this publication, please refer to the companion documents: “Selecting and Using Inorganic Fertilizers” and “Selecting and Using Organic Fertilizers” (HG509 and HG510, respectively. These publications provide detailed guidance on fertilizer sources, nutrient content determination, and calculation of application rates. These documents are available online at no charge at http://extension.usu.edu. Texture
Texture refers to the texture class of the soil. Sandy soils (sand, loamy sand, sandy loam) have lower water and nutrient holding capacities, whereas high clay soils (clay, silty clay, clay loam, silty clay loam) tend to be poorly drained and are subject to compaction. Additions of organic matter will increase the ability of sandy soils to hold water and nutrients, and the ability of high clay soils to drain water and resist compaction.
pH
pH indicates the acidity or alkalinity of soil. A pH of 7 is neutral. Values less than 7 are acidic and values greater than 7 are alkaline. Utah soils tend to be moderately alkaline (pH range 7.5 to 8.5). Most plants grow well in soils with pH values between 6.0 and 8.0. Trace element (e.g., iron) deficiencies can occur in soils with pH values greater than 8.0, and with some sensitive plants (e.g., berries, grapes, silver maple, pin oak) in soils with pH values greater than 7.5.
Salinity-ECe
Salinity indicates the amount of soluble salt in soil. High salinity levels inhibit seed germination and plant growth. Different plants have different salt tolerance levels. Generally, if ECe = 0 to 2, salinity effects are mostly negligible; if ECe = 2 to 4, salinity may affect sensitive plants; if ECe = 4 to 8, yields of many plants are restricted; if ECe = 8 to 16, only tolerant plants will grow; if ECe is above 16, only a few, very tolerant plants will grow.
A soil pH greater than 8.2 together with moderate to high salinity (ECe > 2 to 4) may indicate a problem with excess sodium. This can be verified by determining the sodium adsorption ratio (SAR) of soil (described below).
For more information on managing saline soils, please refer to: “Salinity and Plant Tolerance” (AG-SO-03) online at http://extension.usu.edu.
Phosphorus-P
The phosphorus soil test result is in units of parts per million (or ppm), which is equivalent to pounds of available phosphorus per million pounds of soil. The soil test value is a measure of the amount of phosphorus available to plants during the growing season. A very low or low phosphorus test value indicates that additional phosphorus must be applied to prevent a deficiency. An adequate to high soil test value indicates that sufficient phosphorus is available to grow the plants you identified. Very high amounts of phosphorus indicate excessive fertilizer or manure application, and may lead to nutrient imbalances in plants, or negative environmental impacts to nearby water sources..
Potassium-K
The potassium soil test value is a measure of the amount of potassium available to plants during the growing season. A very low or low potassium test value indicates that additional potassium must be applied to prevent a deficiency. An adequate or
Click here for a table of soil test interpretations and recommendations.
Click here for a table of soil test interpretations and recommendations.
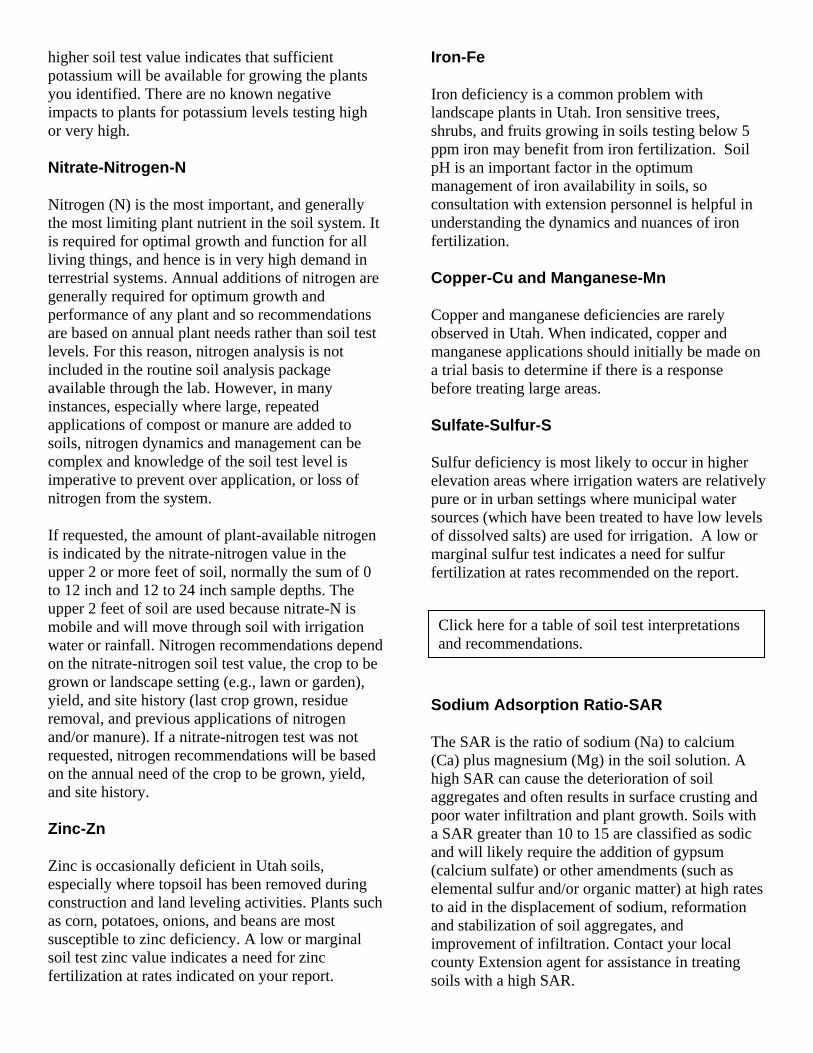
higher soil test value indicates that sufficient potassium will be available for growing the plants you identified. There are no known negative impacts to plants for potassium levels testing high or very high.
Nitrate-Nitrogen-N
Nitrogen (N) is the most important, and generally the most limiting plant nutrient in the soil system. It is required for optimal growth and function for all living things, and hence is in very high demand in terrestrial systems. Annual additions of nitrogen are generally required for optimum growth and performance of any plant and so recommendations are based on annual plant needs rather than soil test levels. For this reason, nitrogen analysis is not included in the routine soil analysis package available through the lab. However, in many instances, especially where large, repeated applications of compost or manure are added to soils, nitrogen dynamics and management can be complex and knowledge of the soil test level is imperative to prevent over application, or loss of nitrogen from the system.
If requested, the amount of plant-available nitrogen is indicated by the nitrate-nitrogen value in the upper 2 or more feet of soil, normally the sum of 0 to 12 inch and 12 to 24 inch sample depths. The upper 2 feet of soil are used because nitrate-N is mobile and will move through soil with irrigation water or rainfall. Nitrogen recommendations depend on the nitrate-nitrogen soil test value, the crop to be grown or landscape setting (e.g., lawn or garden), yield, and site history (last crop grown, residue removal, and previous applications of nitrogen and/or manure). If a nitrate-nitrogen test was not requested, nitrogen recommendations will be based on the annual need of the crop to be grown, yield, and site history. Zinc-Zn
Zinc is occasionally deficient in Utah soils, especially where topsoil has been removed during construction and land leveling activities. Plants such as corn, potatoes, onions, and beans are most susceptible to zinc deficiency. A low or marginal soil test zinc value indicates a need for zinc fertilization at rates indicated on your report.
Iron-Fe
Iron deficiency is a common problem with landscape plants in Utah. Iron sensitive trees, shrubs, and fruits growing in soils testing below 5 ppm iron may benefit from iron fertilization. Soil pH is an important factor in the optimum management of iron availability in soils, so consultation with extension personnel is helpful in understanding the dynamics and nuances of iron fertilization.
Copper-Cu and Manganese-Mn
Copper and manganese deficiencies are rarely observed in Utah. When indicated, copper and manganese applications should initially be made on a trial basis to determine if there is a response before treating large areas.
Sulfate-Sulfur-S
Sulfur deficiency is most likely to occur in higher elevation areas where irrigation waters are relatively pure or in urban settings where municipal water sources (which have been treated to have low levels of dissolved salts) are used for irrigation. A low or marginal sulfur test indicates a need for sulfur fertilization at rates recommended on the report.
Sodium Adsorption Ratio-SAR
The SAR is the ratio of sodium (Na) to calcium (Ca) plus magnesium (Mg) in the soil solution. A high SAR can cause the deterioration of soil aggregates and often results in surface crusting and poor water infiltration and plant growth. Soils with a SAR greater than 10 to 15 are classified as sodic and will likely require the addition of gypsum (calcium sulfate) or other amendments (such as elemental sulfur and/or organic matter) at high rates to aid in the displacement of sodium, reformation and stabilization of soil aggregates, and improvement of infiltration. Contact your local county Extension agent for assistance in treating soils with a high SAR.
Click here for a table of soil test interpretations and recommendations.

For more information on high sodium soils, refer to: “Managing Sodic Soils in Utah” (AG275) online at http://extension.usu.edu.
Organic Matter-O.M.
Organic matter provides nutrients such as nitrogen and sulfur for plant growth while improving soil tilth (physical condition). Generally, higher levels of organic matter are desirable. Soil organic matter content also influences the effectiveness and application rate of certain herbicides. Follow the instructions on your herbicide label or contact your local county Extension agent for assistance.
Recommendations
Nutrient recommendations are expressed in pounds per acre for agricultural soil samples, or pounds per
1000 square feet for turf, landscape, and garden soil samples. These recommendations are used as the basis for calculating the application rates of fertilizers you select to meet the nutrient needs.
Where to Obtain Additional Information
The Utah State University Analytical Laboratory has information on soil, plant, feed, and water analysis. Other Utah State University Extension bulletins are also available on a wide range of topics. For information and assistance in obtaining these guides, contact your local county Extension agent, the Utah State University Analytical Laboratory (Utah State University, Logan, Utah 84322-4830; 435-797-2217), or the Utah State University Extension Web site: http://extension.usu.edu.
Utah State University is committed to providing an environment free from harassment and other forms of illegal discrimination based on race, color, religion, sex, national origin, age (40 and older), disability, and veteran’s status. USU’s policy also prohibits discrimination on the basis of sexual orientation in employment and academic related practices and decisions. Utah State University employees and students cannot, because of race, color, religion, sex, national origin, age, disability, or veteran’s status, refuse to hire; discharge; promote; demote; terminate; discriminate in compensation; or discriminate regarding terms, privileges, or conditions of employment, against any person otherwise qualified. Employees and students also cannot discriminate in the classroom, residence halls, or in on/off campus, USU-sponsored events and activities.
This publication is issued in furtherance of Cooperative Extension work, acts of May 8 and June 30, 1914, in cooperation with the U.S. Department of Agriculture, Noelle E. Cockett, Vice President for Extension and Agriculture, Utah State University.

Soil Test Interpretations and Recommendations Tables
Agricultural Crops: Alfalfa Barley Corn (grain) Corn (silage) Dryland Alfalfa Dryland Small Grains Dryland Pasture Grass Hay Legume/Grass Mix Pasture Oats Potato Wheat
Urban Landscape Settings: Garden Lawn Sports/Recreational Turf Trees & Shrubs Fruit Trees Site Reclamation
Click here to return to beginning of document.
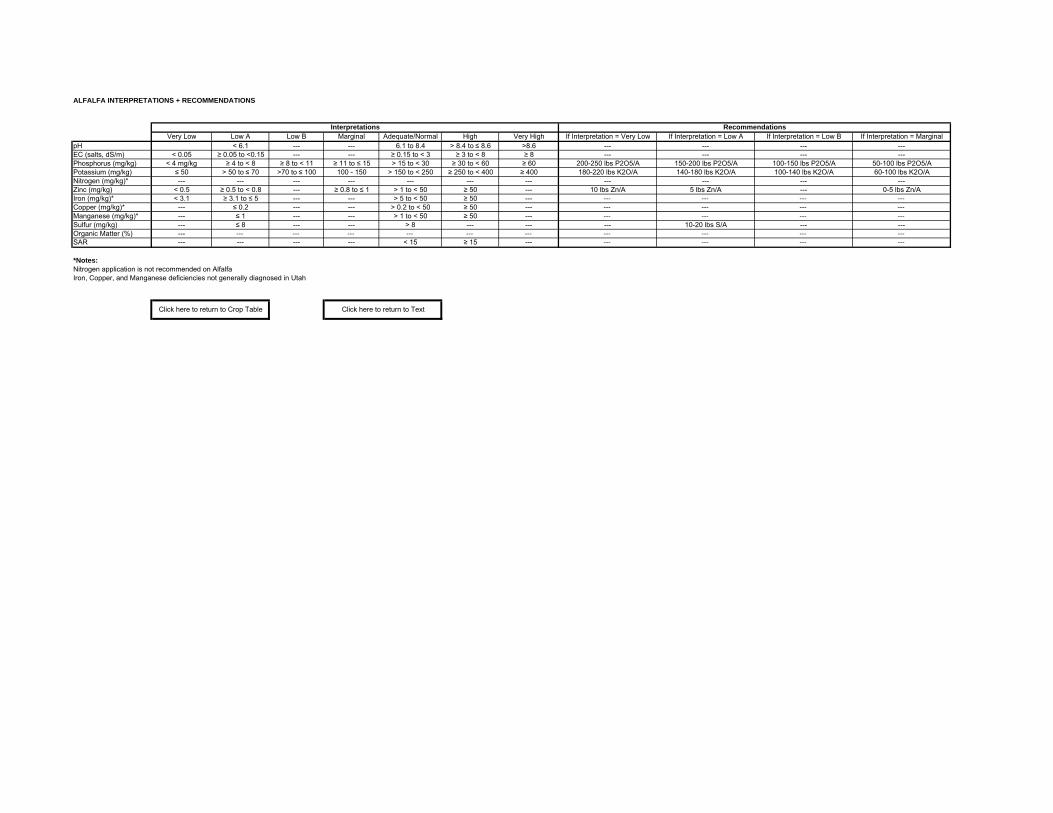
ALFALFA INTERPRETATIONS + RECOMMENDATIONS
Very Low Low A Low B Marginal Adequate/Normal High Very High If Interpretation = Very Low If Interpretation = Low A If Interpretation = Low B If Interpretation = MarginalpH < 6.1 --- --- 6.1 to 8.4 > 8.4 to ≤ 8.6 >8.6 --- --- --- ---EC (salts, dS/m) < 0.05 ≥ 0.05 to <0.15 --- --- ≥ 0.15 to < 3 ≥ 3 to < 8 ≥ 8 --- --- --- ---Phosphorus (mg/kg) < 4 mg/kg ≥ 4 to < 8 ≥ 8 to < 11 ≥ 11 to ≤ 15 > 15 to < 30 ≥ 30 to < 60 ≥ 60 200-250 lbs P2O5/A 150-200 lbs P2O5/A 100-150 lbs P2O5/A 50-100 lbs P2O5/APotassium (mg/kg) ≤ 50 > 50 to ≤ 70 >70 to ≤ 100 100 - 150 > 150 to < 250 ≥ 250 to < 400 ≥ 400 180-220 lbs K2O/A 140-180 lbs K2O/A 100-140 lbs K2O/A 60-100 lbs K2O/ANitrogen (mg/kg)* --- --- --- --- --- --- --- --- --- --- ---Zinc (mg/kg) < 0.5 ≥ 0.5 to < 0.8 --- ≥ 0.8 to ≤ 1 > 1 to < 50 ≥ 50 --- 10 lbs Zn/A 5 lbs Zn/A --- 0-5 lbs Zn/AIron (mg/kg)* < 3.1 ≥ 3.1 to ≤ 5 --- --- > 5 to < 50 ≥ 50 --- --- --- --- ---Copper (mg/kg)* --- ≤ 0.2 --- --- > 0.2 to < 50 ≥ 50 --- --- --- --- ---Manganese (mg/kg)* --- ≤ 1 --- --- > 1 to < 50 ≥ 50 --- --- --- --- ---Sulfur (mg/kg) --- ≤ 8 --- --- > 8 --- --- --- 10-20 lbs S/A --- ---Organic Matter (%) --- --- --- --- --- --- --- --- --- --- ---SAR --- --- --- --- < 15 ≥ 15 --- --- --- --- ---
*Notes:Nitrogen application is not recommended on AlfalfaIron, Copper, and Manganese deficiencies not generally diagnosed in Utah
RecommendationsInterpretations
Click here to return to Crop Table Click here to return to Text

BARLEY INTERPRETATIONS + RECOMMENDATIONS
Very Low Low A Low B Marginal Adequate/Normal High Very High If Interpretation = Very Low If Interpretation = Low A If Interpretation = Low B If Interpretation = MarginalpH < 6.1 --- --- 6.1 to 8.4 > 8.4 to ≤ 8.6 >8.6 --- --- --- ---EC (salts, dS/m) < 0.05 ≥ 0.05 to <0.15 --- --- ≥ 0.15 to < 8 ≥ 8 to < 12 ≥ 12 --- --- --- ---Phosphorus (mg/kg) < 4 mg/kg ≥ 4 to < 8 ≥ 8 to < 11 ≥ 11 to ≤ 15 > 15 to < 30 ≥ 30 to < 60 ≥ 60 150-170 lbs P2O5/A 70-90 lbs P2O5/A 40-60 lbs P2O5/A 0-50 lbs P2O5/APotassium (mg/kg) ≤ 50 > 50 to ≤ 70 >70 to ≤ 100 100 - 150 > 150 to < 250 ≥ 250 to < 400 ≥ 400 180-220 lbs K2O/A 140-180 lbs K2O/A 80-120 lbs K2O/A 40-60 lbs K2O/ANitrogen (mg/kg) --- --- --- --- --- --- --- See Below See Below See Below See BelowZinc (mg/kg) ≤ 0.5 > 0.5 to < 0.8 --- ≥ 0.8 to ≤ 1 > 1 to < 50 ≥ 50 --- 10 lbs Zn/A 5 lbs Zn/A 0-5 lbs Zn/AIron (mg/kg)* < 3.1 ≥ 3.1 to ≤ 5 --- --- > 5 to < 50 ≥ 50 ---Copper (mg/kg)* --- ≤ 0.2 --- --- > 0.2 to < 50 ≥ 50 ---Manganese (mg/kg)* --- ≤ 1 --- --- > 1 to < 50 ≥ 50 ---Sulfur (mg/kg) --- ≤ 8 --- --- > 8 --- --- 10-20 lbs S/AOrganic Matter (%) --- --- --- --- --- --- ---SAR --- --- --- --- < 15 ≥ 15 ---
Nitrogen RecommendationsFor Yield Goal = 110 bushels/acre 130 lbs N/acreFor Yield Goal = 100 bushels/acre 110 lbs N/acreFor Yield Goal = 85 bushels/acre 85 lbs N/acreAdjustment for different yield goals add or subtract 1.6 lbs N/bu/acreAdjustment if NO3-N is determined 50 + (Yield goal(bu/ac)) - 4(Soil Test Nitrate)
*Notes:Iron, Copper, and Manganese deficiencies not generally diagnosed in Utah
RecommendationsInterpretations
Click here to return to Crop Table Click here to return to Text
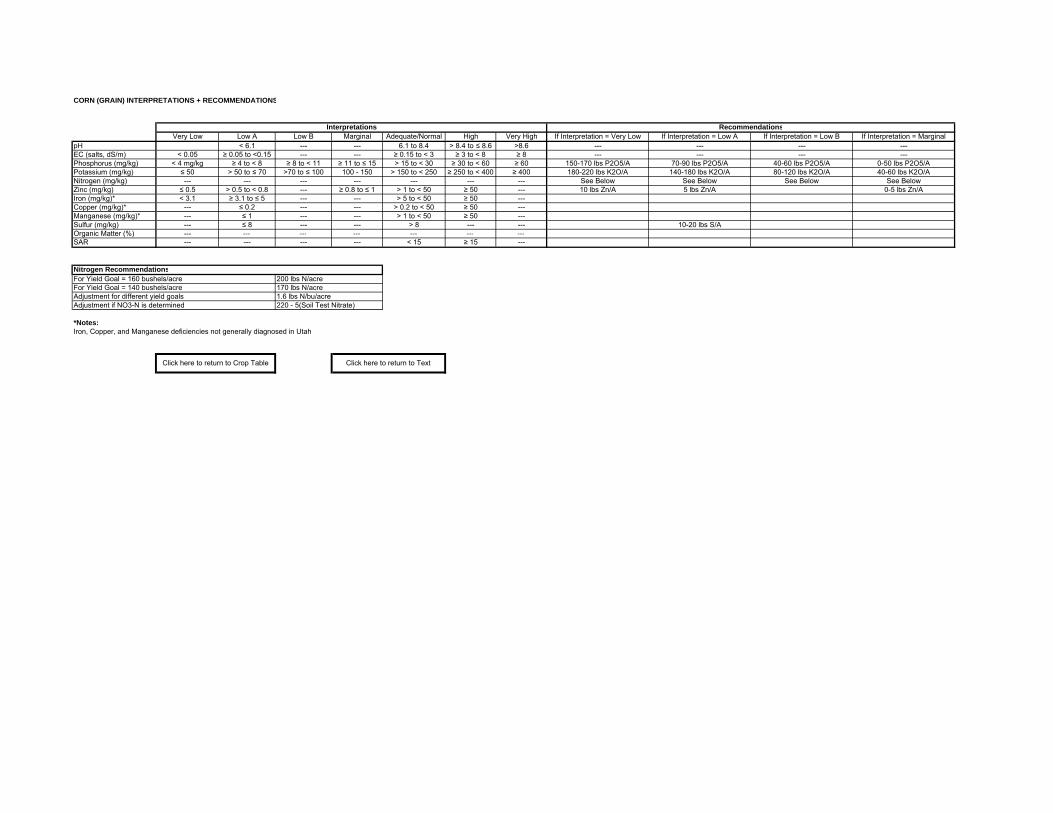
CORN (GRAIN) INTERPRETATIONS + RECOMMENDATIONS
Very Low Low A Low B Marginal Adequate/Normal High Very High If Interpretation = Very Low If Interpretation = Low A If Interpretation = Low B If Interpretation = MarginalpH < 6.1 --- --- 6.1 to 8.4 > 8.4 to ≤ 8.6 >8.6 --- --- --- ---EC (salts, dS/m) < 0.05 ≥ 0.05 to <0.15 --- --- ≥ 0.15 to < 3 ≥ 3 to < 8 ≥ 8 --- --- --- ---Phosphorus (mg/kg) < 4 mg/kg ≥ 4 to < 8 ≥ 8 to < 11 ≥ 11 to ≤ 15 > 15 to < 30 ≥ 30 to < 60 ≥ 60 150-170 lbs P2O5/A 70-90 lbs P2O5/A 40-60 lbs P2O5/A 0-50 lbs P2O5/APotassium (mg/kg) ≤ 50 > 50 to ≤ 70 >70 to ≤ 100 100 - 150 > 150 to < 250 ≥ 250 to < 400 ≥ 400 180-220 lbs K2O/A 140-180 lbs K2O/A 80-120 lbs K2O/A 40-60 lbs K2O/ANitrogen (mg/kg) --- --- --- --- --- --- --- See Below See Below See Below See BelowZinc (mg/kg) ≤ 0.5 > 0.5 to < 0.8 --- ≥ 0.8 to ≤ 1 > 1 to < 50 ≥ 50 --- 10 lbs Zn/A 5 lbs Zn/A 0-5 lbs Zn/AIron (mg/kg)* < 3.1 ≥ 3.1 to ≤ 5 --- --- > 5 to < 50 ≥ 50 ---Copper (mg/kg)* --- ≤ 0.2 --- --- > 0.2 to < 50 ≥ 50 ---Manganese (mg/kg)* --- ≤ 1 --- --- > 1 to < 50 ≥ 50 ---Sulfur (mg/kg) --- ≤ 8 --- --- > 8 --- --- 10-20 lbs S/AOrganic Matter (%) --- --- --- --- --- --- ---SAR --- --- --- --- < 15 ≥ 15 ---
Nitrogen RecommendationsFor Yield Goal = 160 bushels/acre 200 lbs N/acreFor Yield Goal = 140 bushels/acre 170 lbs N/acreAdjustment for different yield goals 1.6 lbs N/bu/acreAdjustment if NO3-N is determined 220 - 5(Soil Test Nitrate)
*Notes:Iron, Copper, and Manganese deficiencies not generally diagnosed in Utah
RecommendationsInterpretations
Click here to return to Crop Table Click here to return to Text

CORN (SILAGE) INTERPRETATIONS + RECOMMENDATIONS
Very Low Low A Low B Marginal Adequate/Normal High Very High If Interpretation = Very Low If Interpretation = Low A If Interpretation = Low B If Interpretation = MarginalpH --- < 6.1 --- --- 6.1 to 8.4 > 8.4 to ≤ 8.6 >8.6 --- --- --- ---EC (salts, dS/m) < 0.05 ≥ 0.05 to <0.15 --- --- ≥ 0.15 to < 3 ≥ 3 to < 8 ≥ 8 --- --- --- ---Phosphorus (mg/kg) < 4 mg/kg ≥ 4 to < 8 ≥ 8 to < 11 ≥ 11 to ≤ 15 > 15 to < 30 ≥ 30 to < 60 ≥ 60 150-170 lbs P2O5/A 70-90 lbs P2O5/A 40-60 lbs P2O5/A 0-50 lbs P2O5/APotassium (mg/kg) ≤ 50 > 50 to ≤ 70 >70 to ≤ 100 100 - 150 > 150 to < 250 ≥ 250 to < 400 ≥ 400 180-220 lbs K2O/A 140-180 lbs K2O/A 80-120 lbs K2O/A 40-60 lbs K2O/ANitrogen (mg/kg) --- --- --- --- --- --- --- See Below See Below See Below See BelowZinc (mg/kg) < 0.5 ≥ 0.5 to < 0.8 --- ≥ 0.8 to ≤ 1 > 1 to < 50 ≥ 50 --- 10 lbs Zn/A 5 lbs Zn/A 0-5 lbs Zn/AIron (mg/kg)* < 3.1 ≥ 3.1 to ≤ 5 --- --- > 5 to < 50 ≥ 50 ---Copper (mg/kg)* --- ≤ 0.2 --- --- > 0.2 to < 50 ≥ 50 ---Manganese (mg/kg)* --- ≤ 1 --- --- > 1 to < 50 ≥ 50 ---Sulfur (mg/kg) --- ≤ 8 --- --- > 8 --- --- 10-20 lbs S/AOrganic Matter (%) --- --- --- --- --- --- ---SAR --- --- --- --- < 15 ≥ 15 ---
Nitrogen RecommendationsFor Yield Goal = 28 tons/acre 200 lbs N/acreFor Yield Goal = 22 tons/acre 150 lbs N/acreAdjustment for different yield goals 4 lbs N/ton/acreAdjustment if NO3-N is determined 100 + 5(yield goal) - 5(Soil Test Nitrate)
*Notes:Iron, Copper, and Manganese deficiencies not generally diagnosed in Utah
RecommendationsInterpretations
Click here to return to Crop Table Click here to return to Text
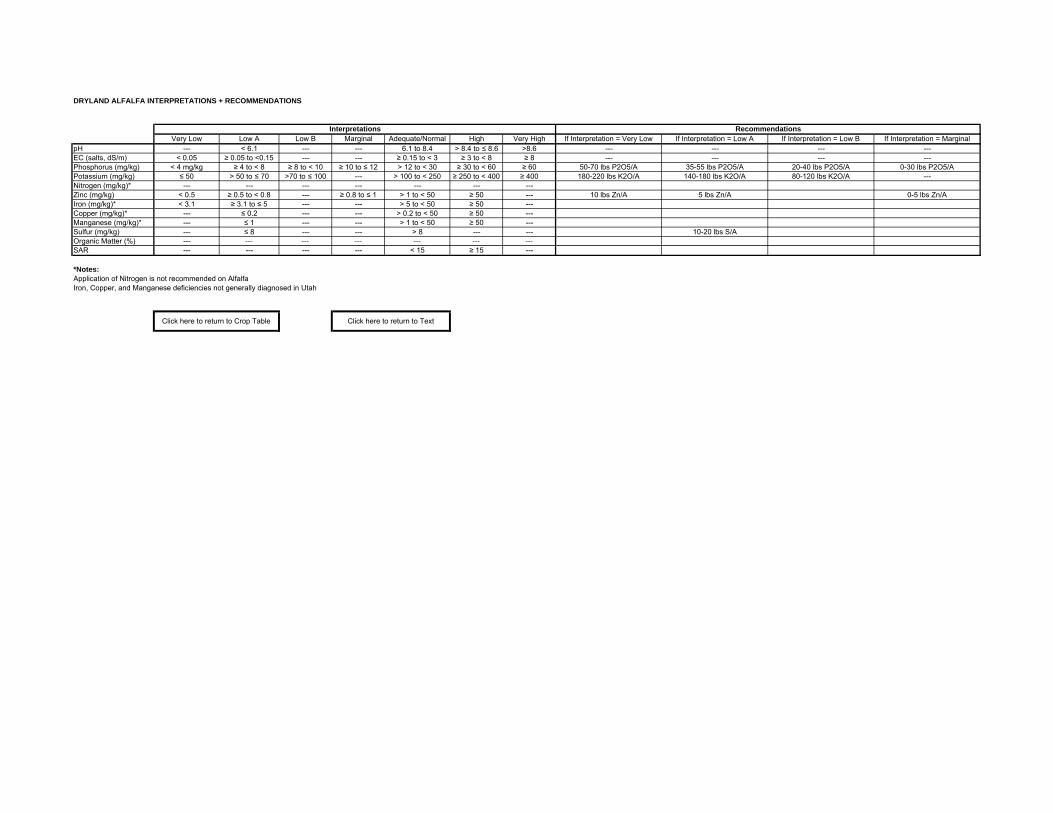
DRYLAND ALFALFA INTERPRETATIONS + RECOMMENDATIONS
Very Low Low A Low B Marginal Adequate/Normal High Very High If Interpretation = Very Low If Interpretation = Low A If Interpretation = Low B If Interpretation = MarginalpH --- < 6.1 --- --- 6.1 to 8.4 > 8.4 to ≤ 8.6 >8.6 --- --- --- ---EC (salts, dS/m) < 0.05 ≥ 0.05 to <0.15 --- --- ≥ 0.15 to < 3 ≥ 3 to < 8 ≥ 8 --- --- --- ---Phosphorus (mg/kg) < 4 mg/kg ≥ 4 to < 8 ≥ 8 to < 10 ≥ 10 to ≤ 12 > 12 to < 30 ≥ 30 to < 60 ≥ 60 50-70 lbs P2O5/A 35-55 lbs P2O5/A 20-40 lbs P2O5/A 0-30 lbs P2O5/APotassium (mg/kg) ≤ 50 > 50 to ≤ 70 >70 to ≤ 100 --- > 100 to < 250 ≥ 250 to < 400 ≥ 400 180-220 lbs K2O/A 140-180 lbs K2O/A 80-120 lbs K2O/A ---Nitrogen (mg/kg)* --- --- --- --- --- --- ---Zinc (mg/kg) < 0.5 ≥ 0.5 to < 0.8 --- ≥ 0.8 to ≤ 1 > 1 to < 50 ≥ 50 --- 10 lbs Zn/A 5 lbs Zn/A 0-5 lbs Zn/AIron (mg/kg)* < 3.1 ≥ 3.1 to ≤ 5 --- --- > 5 to < 50 ≥ 50 ---Copper (mg/kg)* --- ≤ 0.2 --- --- > 0.2 to < 50 ≥ 50 ---Manganese (mg/kg)* --- ≤ 1 --- --- > 1 to < 50 ≥ 50 ---Sulfur (mg/kg) --- ≤ 8 --- --- > 8 --- --- 10-20 lbs S/AOrganic Matter (%) --- --- --- --- --- --- ---SAR --- --- --- --- < 15 ≥ 15 ---
*Notes:Application of Nitrogen is not recommended on AlfalfaIron, Copper, and Manganese deficiencies not generally diagnosed in Utah
RecommendationsInterpretations
Click here to return to Crop Table Click here to return to Text

DRYLAND GRAINS INTERPRETATIONS + RECOMMENDATIONS
Very Low Low A Low B Marginal Adequate/Normal High Very High If Interpretation = Very Low If Interpretation = Low A If Interpretation = Low B If Interpretation = MarginalpH --- < 6.1 --- --- 6.1 to 8.4 > 8.4 to ≤ 8.6 >8.6 --- --- --- ---EC (salts, dS/m) < 0.05 ≥ 0.05 to <0.15 --- --- ≥ 0.15 to < 3 ≥ 3 to < 8 ≥ 8 --- --- --- ---Phosphorus (mg/kg) < 4 mg/kg ≥ 4 to < 8 ≥ 8 to < 10 ≥ 10 to ≤ 12 > 12 to < 30 ≥ 30 to < 60 ≥ 60 50-70 lbs P2O5/A 35-55 lbs P2O5/A 20-40 lbs P2O5/A 0-30 lbs P2O5/APotassium (mg/kg) ≤ 50 > 50 to ≤ 70 >70 to ≤ 100 --- > 100 to < 250 ≥ 250 to < 400 ≥ 400 180-220 lbs K2O/A 140-180 lbs K2O/A 80-120 lbs K2O/A ---Nitrogen (mg/kg) --- --- --- --- --- --- --- See Below See Below See Below See BelowZinc (mg/kg) < 0.5 ≥ 0.5 to < 0.8 --- ≥ 0.8 to ≤ 1 > 1 to < 50 ≥ 50 --- 10 lbs Zn/A 5 lbs Zn/A 0-5 lbs Zn/AIron (mg/kg)* < 3.1 ≥ 3.1 to ≤ 5 --- --- > 5 to < 50 ≥ 50 ---Copper (mg/kg)* --- ≤ 0.2 --- --- > 0.2 to < 50 ≥ 50 ---Manganese (mg/kg)* --- ≤ 1 --- --- > 1 to < 50 ≥ 50 ---Sulfur (mg/kg) --- ≤ 8 --- --- > 8 --- --- 10-20 lbs S/AOrganic Matter (%) --- --- --- --- --- --- ---SAR --- --- --- --- < 15 ≥ 15 ---
Nitrogen RecommendationsIf NO3-N is not determined 40-70 lbs N/acreIf NO3-N is determined (40-70 lbs N/acre) - 4(Soil Test Nitrate)
*Notes:Iron, Copper, and Manganese deficiencies not generally diagnosed in Utah
RecommendationsInterpretations
Click here to return to Crop Table Click here to return to Text
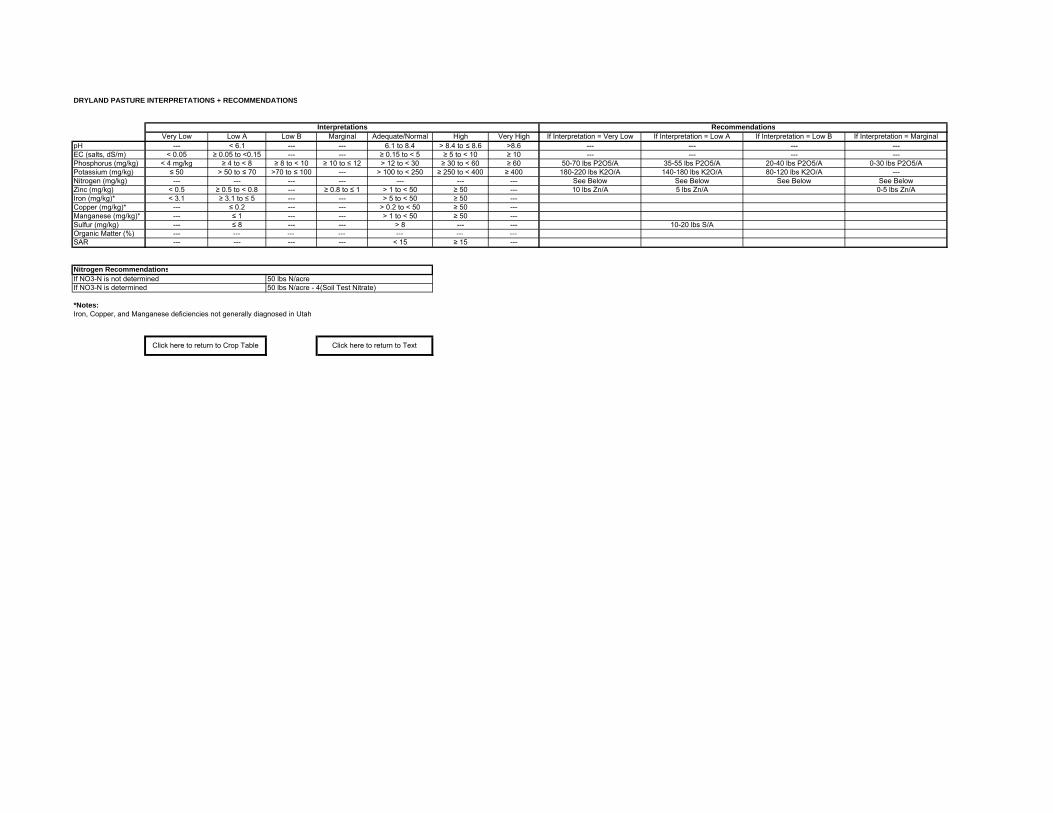
DRYLAND PASTURE INTERPRETATIONS + RECOMMENDATIONS
Very Low Low A Low B Marginal Adequate/Normal High Very High If Interpretation = Very Low If Interpretation = Low A If Interpretation = Low B If Interpretation = MarginalpH --- < 6.1 --- --- 6.1 to 8.4 > 8.4 to ≤ 8.6 >8.6 --- --- --- ---EC (salts, dS/m) < 0.05 ≥ 0.05 to <0.15 --- --- ≥ 0.15 to < 5 ≥ 5 to < 10 ≥ 10 --- --- --- ---Phosphorus (mg/kg) < 4 mg/kg ≥ 4 to < 8 ≥ 8 to < 10 ≥ 10 to ≤ 12 > 12 to < 30 ≥ 30 to < 60 ≥ 60 50-70 lbs P2O5/A 35-55 lbs P2O5/A 20-40 lbs P2O5/A 0-30 lbs P2O5/APotassium (mg/kg) ≤ 50 > 50 to ≤ 70 >70 to ≤ 100 --- > 100 to < 250 ≥ 250 to < 400 ≥ 400 180-220 lbs K2O/A 140-180 lbs K2O/A 80-120 lbs K2O/A ---Nitrogen (mg/kg) --- --- --- --- --- --- --- See Below See Below See Below See BelowZinc (mg/kg) < 0.5 ≥ 0.5 to < 0.8 --- ≥ 0.8 to ≤ 1 > 1 to < 50 ≥ 50 --- 10 lbs Zn/A 5 lbs Zn/A 0-5 lbs Zn/AIron (mg/kg)* < 3.1 ≥ 3.1 to ≤ 5 --- --- > 5 to < 50 ≥ 50 ---Copper (mg/kg)* --- ≤ 0.2 --- --- > 0.2 to < 50 ≥ 50 ---Manganese (mg/kg)* --- ≤ 1 --- --- > 1 to < 50 ≥ 50 ---Sulfur (mg/kg) --- ≤ 8 --- --- > 8 --- --- 10-20 lbs S/AOrganic Matter (%) --- --- --- --- --- --- ---SAR --- --- --- --- < 15 ≥ 15 ---
Nitrogen RecommendationsIf NO3-N is not determined 50 lbs N/acreIf NO3-N is determined 50 lbs N/acre - 4(Soil Test Nitrate)
*Notes:Iron, Copper, and Manganese deficiencies not generally diagnosed in Utah
RecommendationsInterpretations
Click here to return to Crop Table Click here to return to Text
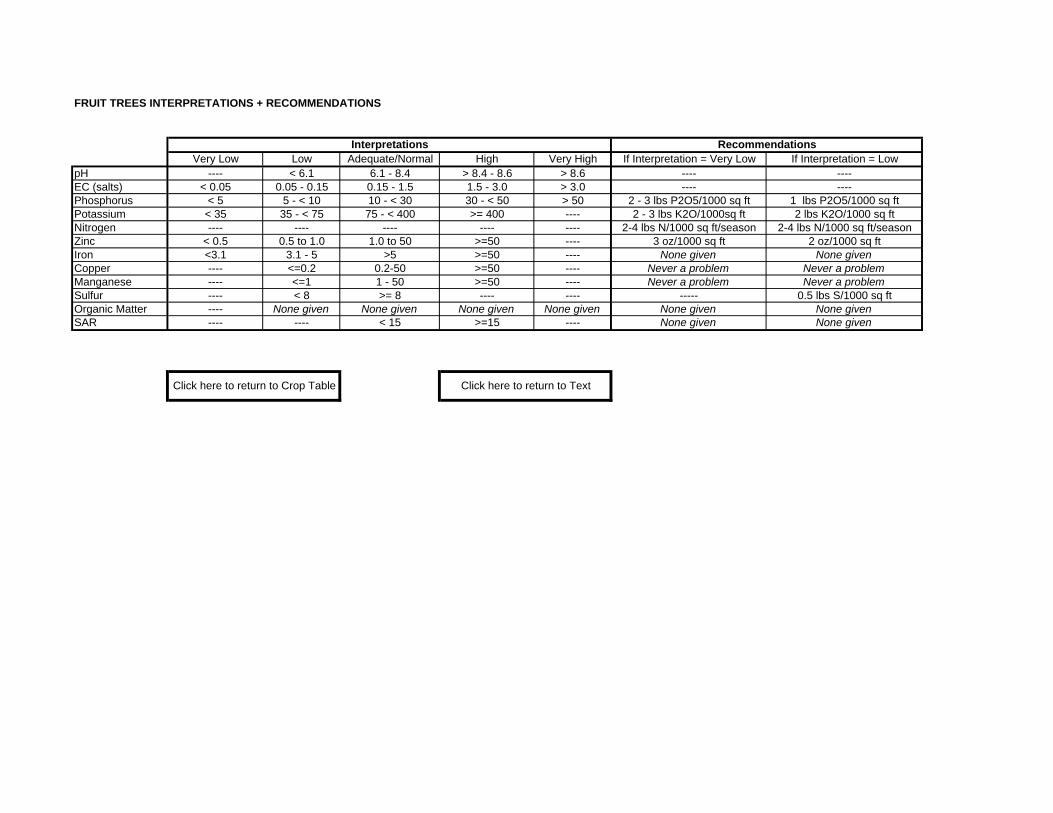
FRUIT TREES INTERPRETATIONS + RECOMMENDATIONS
Very Low Low Adequate/Normal High Very High If Interpretation = Very Low If Interpretation = LowpH ---- < 6.1 6.1 - 8.4 > 8.4 - 8.6 > 8.6 ---- ----EC (salts) < 0.05 0.05 - 0.15 0.15 - 1.5 1.5 - 3.0 > 3.0 ---- ----Phosphorus < 5 5 - < 10 10 - < 30 30 - < 50 > 50 2 - 3 lbs P2O5/1000 sq ft 1 lbs P2O5/1000 sq ftPotassium < 35 35 - < 75 75 - < 400 >= 400 ---- 2 - 3 lbs K2O/1000sq ft 2 lbs K2O/1000 sq ftNitrogen ---- ---- ---- ---- ---- 2-4 lbs N/1000 sq ft/season 2-4 lbs N/1000 sq ft/seasonZinc < 0.5 0.5 to 1.0 1.0 to 50 >=50 ---- 3 oz/1000 sq ft 2 oz/1000 sq ftIron <3.1 3.1 - 5 >5 >=50 ---- None given None givenCopper ---- <=0.2 0.2-50 >=50 ---- Never a problem Never a problemManganese ---- <=1 1 - 50 >=50 ---- Never a problem Never a problemSulfur ---- < 8 >= 8 ---- ---- ----- 0.5 lbs S/1000 sq ftOrganic Matter ---- None given None given None given None given None given None givenSAR ---- ---- < 15 >=15 ---- None given None given
Click here to return to Crop Table Click here to return to Text
RecommendationsInterpretations
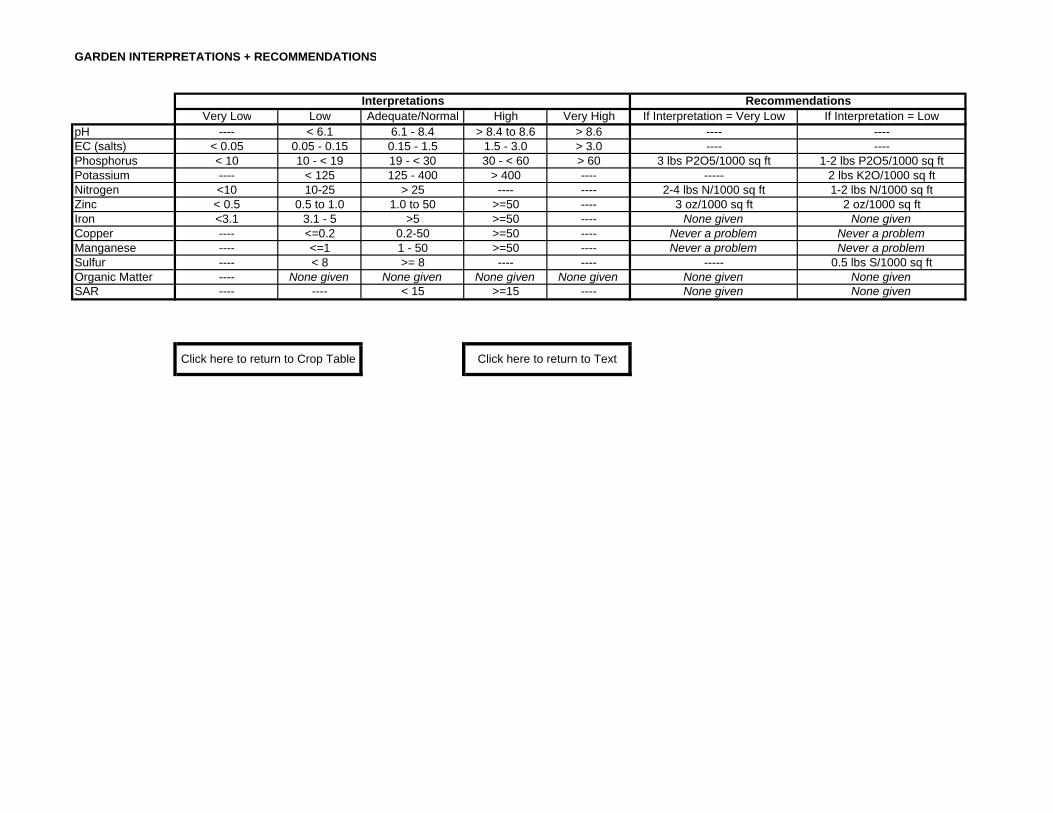
GARDEN INTERPRETATIONS + RECOMMENDATIONS
Very Low Low Adequate/Normal High Very High If Interpretation = Very Low If Interpretation = LowpH ---- < 6.1 6.1 - 8.4 > 8.4 to 8.6 > 8.6 ---- ----EC (salts) < 0.05 0.05 - 0.15 0.15 - 1.5 1.5 - 3.0 > 3.0 ---- ----Phosphorus < 10 10 - < 19 19 - < 30 30 - < 60 > 60 3 lbs P2O5/1000 sq ft 1-2 lbs P2O5/1000 sq ftPotassium ---- < 125 125 - 400 > 400 ---- ----- 2 lbs K2O/1000 sq ftNitrogen <10 10-25 > 25 ---- ---- 2-4 lbs N/1000 sq ft 1-2 lbs N/1000 sq ftZinc < 0.5 0.5 to 1.0 1.0 to 50 >=50 ---- 3 oz/1000 sq ft 2 oz/1000 sq ftIron <3.1 3.1 - 5 >5 >=50 ---- None given None givenCopper ---- <=0.2 0.2-50 >=50 ---- Never a problem Never a problemManganese ---- <=1 1 - 50 >=50 ---- Never a problem Never a problemSulfur ---- < 8 >= 8 ---- ---- ----- 0.5 lbs S/1000 sq ftOrganic Matter ---- None given None given None given None given None given None givenSAR ---- ---- < 15 >=15 ---- None given None given
Click here to return to Crop Table Click here to return to Text
RecommendationsInterpretations

GRASS HAY INTERPRETATIONS + RECOMMENDATIONS
Very Low Low A Low B Marginal Adequate/Normal High Very High If Interpretation = Very Low If Interpretation = Low A If Interpretation = Low B If Interpretation = MarginalpH --- < 6.1 --- --- 6.1 to 8.4 > 8.4 to ≤ 8.6 >8.6 --- --- --- ---EC (salts, dS/m) < 0.05 ≥ 0.05 to <0.15 --- --- ≥ 0.15 to < 5 ≥ 5 to < 10 ≥ 10 --- --- --- ---Phosphorus (mg/kg) < 4 mg/kg ≥ 4 to < 8 ≥ 8 to < 11 ≥ 11 to ≤ 15 > 15 to < 30 ≥ 30 to < 60 ≥ 60 100-125 lbs P2O5/A 75-100 lbs P2O5/A 50-75 lbs P2O5/A 0-50 lbs P2O5/APotassium (mg/kg) ≤ 50 > 50 to ≤ 70 >70 to ≤ 100 100 - 150 > 150 to < 250 ≥ 250 to < 400 ≥ 400 180-220 lbs K2O/A 140-180 lbs K2O/A 80-120 lbs K2O/A 40-60 lbs K2O/ANitrogen (mg/kg) --- --- --- --- --- --- --- See Below See Below See Below See BelowZinc (mg/kg) < 0.5 ≥ 0.5 to < 0.8 --- ≥ 0.8 to ≤ 1 > 1 to < 50 ≥ 50 --- 10 lbs Zn/A 5 lbs Zn/A 0-5 lbs Zn/AIron (mg/kg)* < 3.1 ≥ 3.1 to ≤ 5 --- --- > 5 to < 50 ≥ 50 ---Copper (mg/kg)* --- ≤ 0.2 --- --- > 0.2 to < 50 ≥ 50 ---Manganese (mg/kg)* --- ≤ 1 --- --- > 1 to < 50 ≥ 50 ---Sulfur (mg/kg) --- ≤ 8 --- --- > 8 --- --- 10-20 lbs S/AOrganic Matter (%) --- --- --- --- --- --- ---SAR --- --- --- --- < 15 ≥ 15 ---
Nitrogen RecommendationsFor Yield Goal = 1-2 tons/acre 50 lbs N/acreFor Yield Goal = 2-4 tons/acre 75 lbs N/acreFor Yield Goal = 4-6 tons/acre 100-150 lbs N/acreFor Yield Goal = 6-8 tons/acre 150-200 lbs N/acreIf NO3-N is determined (Goal Recommendation) - 4(Soil Test Nitrate)
*Notes:Iron, Copper, and Manganese deficiencies not generally diagnosed in Utah
RecommendationsInterpretations
Click here to return to Crop Table Click here to return to Text

LAWN INTERPRETATIONS + RECOMMENDATIONS
Very Low Low Adequate/Normal High Very High If Interpretation = Very Low If Interpretation = LowpH ---- < 6.1 6.1 - 8.4 > 8.4 to 8.6 > 8.6 ---- ----EC (salts) < 0.05 0.05 - 0.15 0.15 - 1.5 1.5 - 3.0 > 3.0 ---- ----Phosphorus < 5 5-15 >15 - 30 > 30 - 50 > 50 2 - 3 lbs P2O5/1000 sq ft 1 lbs P2O5/1000 sq ftPotassium <= 75 75 -125 > 125-400 > 400 ---- 2 - 3 lbs K2O/1000sq ft 2 lbs K2O/1000 sq ftNitrogen ---- ---- ---- ---- ---- 2-4 lbs N/1000 sq ft/season 2-4 lbs N/1000 sq ft/seasonZinc < 0.5 0.5 to 1.0 1.0 to 50 >=50 ---- 3 oz/1000 sq ft 2 oz/1000 sq ftIron <3.1 3.1 - 5 >5 >=50 ---- None given None givenCopper ---- <=0.2 0.2-50 >=50 ---- Never a problem Never a problemManganese ---- <=1 1 - 50 >=50 ---- Never a problem Never a problemSulfur ---- < 8 >= 8 ---- ---- ----- 0.5 lbs S/1000 sq ftOrganic Matter ---- None given None given None given None given None given None givenSAR ---- ---- < 15 >=15 ---- None given None given
Click here to return to Crop Table Click here to return to Text
RecommendationsInterpretations

LEGUME/GRASS MIX INTERPRETATIONS + RECOMMENDATIONS
Very Low Low A Low B Marginal Adequate/Normal High Very High If Interpretation = Very Low If Interpretation = Low A If Interpretation = Low B If Interpretation = MarginalpH --- < 6.1 --- --- 6.1 to 8.4 > 8.4 to ≤ 8.6 >8.6 --- --- --- ---EC (salts, dS/m) < 0.05 ≥ 0.05 to <0.15 --- --- ≥ 0.15 to < 3 ≥ 3 to < 8 ≥ 8 --- --- --- ---Phosphorus (mg/kg) < 4 mg/kg ≥ 4 to < 8 ≥ 8 to < 11 ≥ 11 to ≤ 15 > 15 to < 30 ≥ 30 to < 60 ≥ 60 100-125 lbs P2O5/A 75-100 lbs P2O5/A 50-75 lbs P2O5/A 0-50 lbs P2O5/APotassium (mg/kg) ≤ 50 > 50 to ≤ 70 >70 to ≤ 100 100 - 150 > 150 to < 250 ≥ 250 to < 400 ≥ 400 180-220 lbs K2O/A 140-180 lbs K2O/A 80-120 lbs K2O/A 40-60 lbs K2O/ANitrogen (mg/kg) --- --- --- --- --- --- --- See Below See Below See Below See BelowZinc (mg/kg) < 0.5 ≥ 0.5 to < 0.8 --- ≥ 0.8 to ≤ 1 > 1 to < 50 ≥ 50 --- 10 lbs Zn/A 5 lbs Zn/A 0-5 lbs Zn/AIron (mg/kg)* < 3.1 ≥ 3.1 to ≤ 5 --- --- > 5 to < 50 ≥ 50 ---Copper (mg/kg)* --- ≤ 0.2 --- --- > 0.2 to < 50 ≥ 50 ---Manganese (mg/kg)* --- ≤ 1 --- --- > 1 to < 50 ≥ 50 ---Sulfur (mg/kg) --- ≤ 8 --- --- > 8 --- --- 10-20 lbs S/AOrganic Matter (%) --- --- --- --- --- --- ---SAR --- --- --- --- < 15 ≥ 15 ---
Nitrogen RecommendationsFor 75% grass, 25% legume and Yield Goal = 1-2 tons/acre 25 lbs N/AFor 75% grass, 25% legume and Yield Goal = 2-4 tons/acre 50 lbs N/AFor 75% grass, 25% legume and Yield Goal = 4-6 tons/acre 75-100 lbs N/AFor 75% grass, 25% legume and Yield Goal = 6-8 tons/acre 100-150 lbs N/AFor 50% grass, 50% legume and Yield Goal = 1-2 tons/acre 0 lbs N/AFor 50% grass, 50% legume and Yield Goal = 2-4 tons/acre 25 lbs N/AFor 50% grass, 50% legume and Yield Goal = 4-6 tons/acre 50 lbs N/AFor 50% grass, 50% legume and Yield Goal = 6-8 tons/acre 75 lbs N/AFor 25% grass, 75% legume and Yield Goal = 1-2 tons/acre 0 lbs N/AFor 25% grass, 75% legume and Yield Goal = 2-4 tons/acre 0 lbs N/AFor 25% grass, 75% legume and Yield Goal = 4-6 tons/acre 25 lbs N/AFor 25% grass, 75% legume and Yield Goal = 6-8 tons/acre 50 lbs N/AAdjustment if NO3-N is determined (note recommendation never less than 0 lbs N/acre) (Goal Recommendation) - 4(Soil Test Nitrate)
*Notes:Iron, Copper, and Manganese deficiencies not generally diagnosed in Utah
RecommendationsInterpretations
Click here to return to Crop Table Click here to return to Text

OATS INTERPRETATIONS + RECOMMENDATIONS
Very Low Low A Low B Marginal Adequate/Normal High Very High If Interpretation = Very Low If Interpretation = Low A If Interpretation = Low B If Interpretation = MarginalpH < 6.1 --- --- 6.1 to 8.4 > 8.4 to ≤ 8.6 >8.6 --- --- --- ---EC (salts, dS/m) < 0.05 ≥ 0.05 to <0.15 --- --- ≥ 0.15 to < 8 ≥ 8 to < 12 ≥ 12 --- --- --- ---Phosphorus (mg/kg) < 4 mg/kg ≥ 4 to < 8 ≥ 8 to < 11 ≥ 11 to ≤ 15 > 15 to < 30 ≥ 30 to < 60 ≥ 60 150-170 lbs P2O5/A 70-90 lbs P2O5/A 40-60 lbs P2O5/A 0-50 lbs P2O5/APotassium (mg/kg) ≤ 50 > 50 to ≤ 70 >70 to ≤ 100 100 - 150 > 150 to < 250 ≥ 250 to < 400 ≥ 400 180-220 lbs K2O/A 140-180 lbs K2O/A 80-120 lbs K2O/A 40-60 lbs K2O/ANitrogen (mg/kg) --- --- --- --- --- --- --- See Below See Below See Below See BelowZinc (mg/kg) < 0.5 ≥ 0.5 to < 0.8 --- ≥ 0.8 to ≤ 1 > 1 to < 50 ≥ 50 --- 10 lbs Zn/A 5 lbs Zn/A 0-5 lbs Zn/AIron (mg/kg)* < 3.1 ≥ 3.1 to ≤ 5 --- --- > 5 to < 50 ≥ 50 ---Copper (mg/kg)* --- ≤ 0.2 --- --- > 0.2 to < 50 ≥ 50 ---Manganese (mg/kg)* --- ≤ 1 --- --- > 1 to < 50 ≥ 50 ---Sulfur (mg/kg) --- ≤ 8 --- --- > 8 --- --- 10-20 lbs S/AOrganic Matter (%) --- --- --- --- --- --- ---SAR --- --- --- --- < 15 ≥ 15 ---
Nitrogen RecommendationsFor Yield Goal = 110 bushels/acre 130 lbs N/acreFor Yield Goal = 100 bushels/acre 110 lbs N/acreFor Yield Goal = 85 bushels/acre 85 lbs N/acreAdjustment for different yield goals 1.6 lbs N/bushel/acreAdjustment if NO3-N is determined 50 + (Yield goal) - 4(Soil Test Nitrate)
*Notes:Iron, Copper, and Manganese deficiencies not generally diagnosed in Utah
RecommendationsInterpretations
Click here to return to Crop Table Click here to return to Text

POTATO INTERPRETATIONS + RECOMMENDATIONS
Very Low Very Low Low Marginal Adequate High Very High If Interpretation = Very Low If Interpretation = Low If Interpretation = Low If Interpretation = MarginalpH --- < 6.1 --- --- 6.1 to 8.4 > 8.4 to ≤ 8.6 >8.6 --- --- ---EC (salts, dS/m) < 0.05 ≥ 0.05 to <0.15 --- ≥ 0.15 to < 2.5 ≥ 2.5 to < 5 ≥ 5 --- --- ---Phosphorus (mg/kg) < 7 mg/kg ≥ 7 to < 16 ≥16 to < 21 ≥ 21 to < 30 ≥ 30 to < 40 ≥ 40 to < 60 ≥ 60 200-240 lbs P2O5/A 150-170 lbs P2O5/A 90-110 lbs P2O5/A 0-50 lbs P2O5/APotassium (mg/kg) ≤ 40 > 40 to ≤ 70 >70 to ≤ 100 > 100 to ≤ 140 > 140 to < 350 ≥ 350 to < 400 ≥ 400 230-270 lbs K2O/A 190-230 lbs K2O/A 120-160 lbs K2O/A 80-120 lbs K2O/ANitrogen (mg/kg) --- --- --- --- --- --- --- See Below See Below See Below See BelowZinc (mg/kg) < 0.5 --- ≥ 0.5 to < 0.8 ≥ 0.8 to ≤ 1 > 1 to < 50 ≥ 50 --- 10 lbs Zn/A 5 lbs Zn/A 0-5 lbs Zn/AIron (mg/kg)* < 3.1 ≥ 3.1 to ≤ 5 --- --- > 5 to < 50 ≥ 50 ---Copper (mg/kg)* --- --- ≤ 0.2 --- > 0.2 to < 50 ≥ 50 ---Manganese (mg/kg)* --- --- ≤ 1 --- > 1 to < 50 ≥ 50 ---Sulfur (mg/kg) --- --- ≤ 8 --- > 8 --- --- 10-20 lbs S/AOrganic Matter (%) --- --- --- --- --- --- ---SAR --- --- --- --- < 15 ≥ 15 ---
Nitrogen RecommendationFor Yield Goal = 300 cwt/acre 130 lbs N/acreFor Yield Goal = 250 cwt/acre 100 lbs N/acreAdjustment for different yield goals 0.5 lbs N/cwt/acreAdjustement if NO3-N is determined 180 + 0.6(yield goal - 100) - 6(Soil Test Nitrate)
*Notes:Iron, Copper, and Manganese deficiencies not generally diagnosed in Utah
RecommendationsInterpretations
Click here to return to Crop Table Click here to return to Text
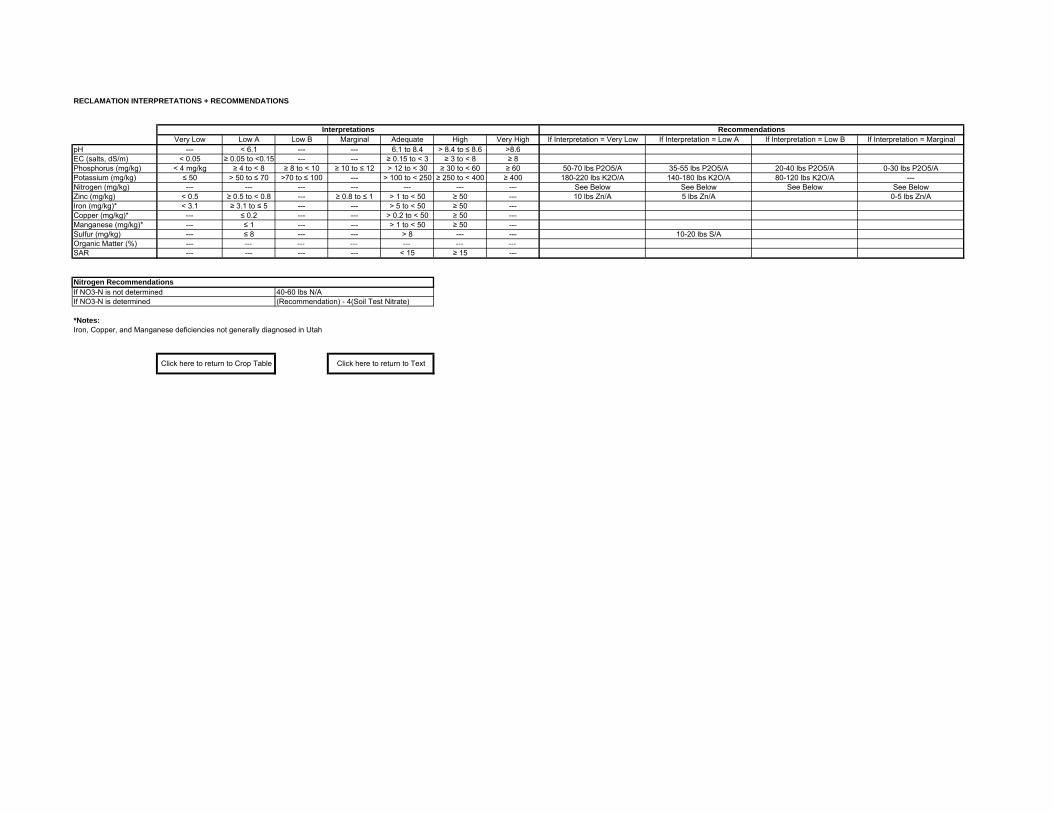
RECLAMATION INTERPRETATIONS + RECOMMENDATIONS
Very Low Low A Low B Marginal Adequate High Very High If Interpretation = Very Low If Interpretation = Low A If Interpretation = Low B If Interpretation = MarginalpH --- < 6.1 --- --- 6.1 to 8.4 > 8.4 to ≤ 8.6 >8.6EC (salts, dS/m) < 0.05 ≥ 0.05 to <0.15 --- --- ≥ 0.15 to < 3 ≥ 3 to < 8 ≥ 8Phosphorus (mg/kg) < 4 mg/kg ≥ 4 to < 8 ≥ 8 to < 10 ≥ 10 to ≤ 12 > 12 to < 30 ≥ 30 to < 60 ≥ 60 50-70 lbs P2O5/A 35-55 lbs P2O5/A 20-40 lbs P2O5/A 0-30 lbs P2O5/APotassium (mg/kg) ≤ 50 > 50 to ≤ 70 >70 to ≤ 100 --- > 100 to < 250 ≥ 250 to < 400 ≥ 400 180-220 lbs K2O/A 140-180 lbs K2O/A 80-120 lbs K2O/A ---Nitrogen (mg/kg) --- --- --- --- --- --- --- See Below See Below See Below See BelowZinc (mg/kg) < 0.5 ≥ 0.5 to < 0.8 --- ≥ 0.8 to ≤ 1 > 1 to < 50 ≥ 50 --- 10 lbs Zn/A 5 lbs Zn/A 0-5 lbs Zn/AIron (mg/kg)* < 3.1 ≥ 3.1 to ≤ 5 --- --- > 5 to < 50 ≥ 50 ---Copper (mg/kg)* --- ≤ 0.2 --- --- > 0.2 to < 50 ≥ 50 ---Manganese (mg/kg)* --- ≤ 1 --- --- > 1 to < 50 ≥ 50 ---Sulfur (mg/kg) --- ≤ 8 --- --- > 8 --- --- 10-20 lbs S/AOrganic Matter (%) --- --- --- --- --- --- ---SAR --- --- --- --- < 15 ≥ 15 ---
Nitrogen RecommendationsIf NO3-N is not determined 40-60 lbs N/AIf NO3-N is determined (Recommendation) - 4(Soil Test Nitrate)
*Notes:Iron, Copper, and Manganese deficiencies not generally diagnosed in Utah
RecommendationsInterpretations
Click here to return to Crop Table Click here to return to Text

SPORTS TURF INTERPRETATIONS + RECOMMENDATIONS
Very Low Low Adequate/Normal High Very High If Interpretation = Very Low If Interpretation = LowpH ---- < 6.1 6.1 - 8.4 > 8.4 to 8.6 > 8.6 ---- ----EC (salts, dS/m) < 0.05 0.05 - 0.15 0.15 - 1.5 1.5 - 3.0 > 3.0 ---- ----Phosphorus (mg/kg) < 5 5-15 >15 - 30 > 30 - 50 > 50 2 - 3 lbs P2O5/1000 sq ft 1 lbs P2O5/1000 sq ftPotassium (mg/kg) <= 75 75 -125 > 125-400 > 400 ---- 2 - 3 lbs K2O/1000sq ft 2 lbs K2O/1000 sq ftNitrogen (mg/kg) ---- ---- ---- ---- ---- 2-4 lbs N/1000 sq ft/season 2-4 lbs N/1000 sq ft/seasonZinc (mg/kg) < 0.5 0.5 to 1.0 1.0 to 50 >=50 ---- 3 oz/1000 sq ft 2 oz/1000 sq ftIron (mg/kg)* <3.1 3.1 - 5 >5 >=50 ---- None given None givenCopper (mg/kg)* ---- <=0.2 0.2-50 >=50 ---- Never a problem Never a problemManganese (mg/kg)* ---- <=1 1 - 50 >=50 ---- Never a problem Never a problemSulfur (mg/kg) ---- < 8 >= 8 ---- ---- ----- 0.5 lbs S/1000 sq ftOrganic Matter (%) ---- None given None given None given None given None given None givenSAR ---- ---- < 15 >=15 ---- None given None given
*Notes:Iron, Copper, and Manganese deficiencies not generally diagnosed in Utah
Click here to return to Crop Table Click here to return to Text
RecommendationsInterpretations

TREES AND SHRUBS INTERPRETATIONS + RECOMMENDATIONS
Very Low Low Adequate/Normal High Very High If Interpretation = Very Low If Interpretation = LowpH ---- < 6.1 6.1 - 8.4 > 8.4 to 8.6 > 8.6 ---- ----EC (salts, dS/m) < 0.05 0.05 - 0.15 0.15 - 1.5 1.5 - 3.0 > 3.0 ---- ----Phosphorus (mg/kg) < 5 5 - < 10 10 - < 30 30 - < 50 > 50 2 - 3 lbs P2O5/1000 sq ft 1 lbs P2O5/1000 sq ftPotassium (mg/kg) < 75 75 - 125 126 - 400 > 400 ---- 2 - 3 lbs K2O/1000sq ft 2 lbs K2O/1000 sq ftNitrogen (mg/kg) ---- ---- ---- ---- ---- 2-4 lbs N/1000 sq ft/season 2-4 lbs N/1000 sq ft/seasonZinc (mg/kg) < 0.5 0.5 to 1.0 1.0 to 50 >=50 ---- 3 oz/1000 sq ft 2 oz/1000 sq ftIron (mg/kg)* <3.1 3.1 - 5 >5 >=50 ---- None given None givenCopper (mg/kg)* ---- <=0.2 0.2-50 >=50 ---- Never a problem Never a problemManganese (mg/kg)* ---- <=1 1 - 50 >=50 ---- Never a problem Never a problemSulfur (mg/kg) ---- < 8 > 8 ---- ---- ----- 0.5 lbs S/1000 sq ftOrganic Matter (%) ---- None given None given None given None given None given None givenSAR ---- ---- < 15 >=15 ---- None given None given
*Notes:Iron, Copper, and Manganese deficiencies not generally diagnosed in Utah
Click here to return to Crop Table Click here to return to Text
RecommendationsInterpretations
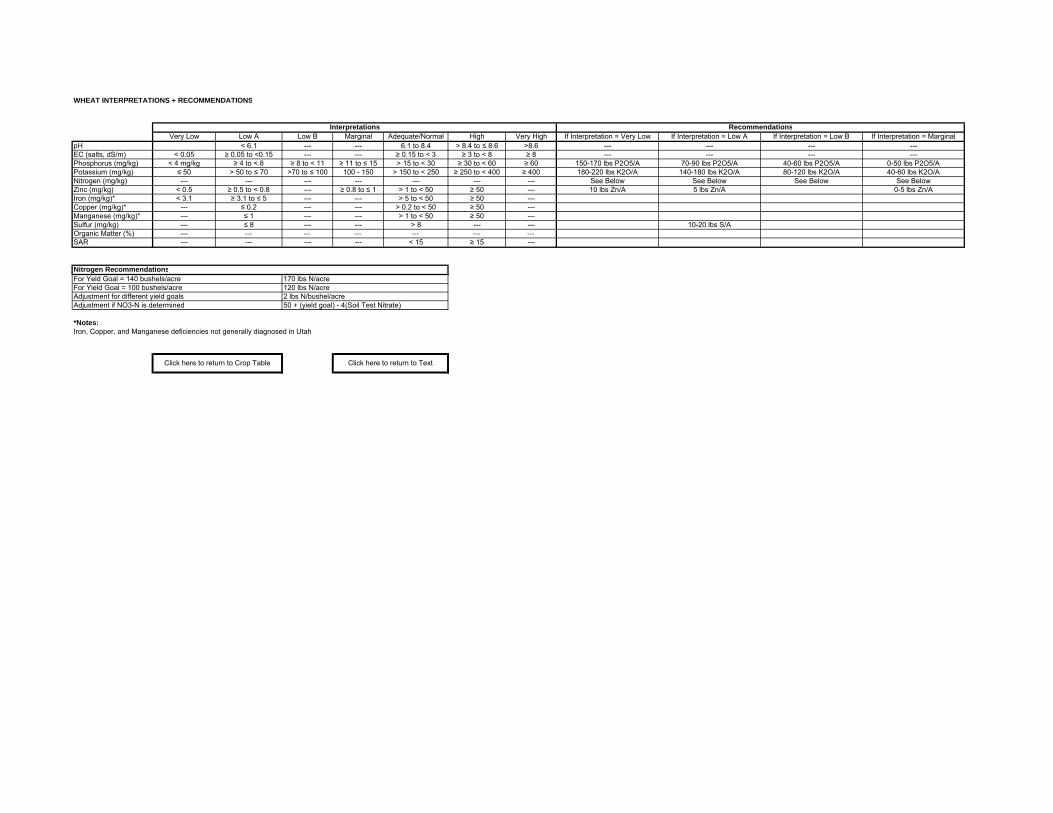
WHEAT INTERPRETATIONS + RECOMMENDATIONS
Very Low Low A Low B Marginal Adequate/Normal High Very High If Interpretation = Very Low If Interpretation = Low A If Interpretation = Low B If Interpretation = MarginalpH < 6.1 --- --- 6.1 to 8.4 > 8.4 to ≤ 8.6 >8.6 --- --- --- ---EC (salts, dS/m) < 0.05 ≥ 0.05 to <0.15 --- --- ≥ 0.15 to < 3 ≥ 3 to < 8 ≥ 8 --- --- --- ---Phosphorus (mg/kg) < 4 mg/kg ≥ 4 to < 8 ≥ 8 to < 11 ≥ 11 to ≤ 15 > 15 to < 30 ≥ 30 to < 60 ≥ 60 150-170 lbs P2O5/A 70-90 lbs P2O5/A 40-60 lbs P2O5/A 0-50 lbs P2O5/APotassium (mg/kg) ≤ 50 > 50 to ≤ 70 >70 to ≤ 100 100 - 150 > 150 to < 250 ≥ 250 to < 400 ≥ 400 180-220 lbs K2O/A 140-180 lbs K2O/A 80-120 lbs K2O/A 40-60 lbs K2O/ANitrogen (mg/kg) --- --- --- --- --- --- --- See Below See Below See Below See BelowZinc (mg/kg) < 0.5 ≥ 0.5 to < 0.8 --- ≥ 0.8 to ≤ 1 > 1 to < 50 ≥ 50 --- 10 lbs Zn/A 5 lbs Zn/A 0-5 lbs Zn/AIron (mg/kg)* < 3.1 ≥ 3.1 to ≤ 5 --- --- > 5 to < 50 ≥ 50 ---Copper (mg/kg)* --- ≤ 0.2 --- --- > 0.2 to < 50 ≥ 50 ---Manganese (mg/kg)* --- ≤ 1 --- --- > 1 to < 50 ≥ 50 ---Sulfur (mg/kg) --- ≤ 8 --- --- > 8 --- --- 10-20 lbs S/AOrganic Matter (%) --- --- --- --- --- --- ---SAR --- --- --- --- < 15 ≥ 15 ---
Nitrogen RecommendationsFor Yeld Goal = 140 bushels/acre 170 lbs N/acreFor Yield Goal = 100 bushels/acre 120 lbs N/acreAdjustment for different yield goals 2 lbs N/bushel/acreAdjustment if NO3-N is determined 50 + (yield goal) - 4(Soil Test Nitrate)
*Notes:Iron, Copper, and Manganese deficiencies not generally diagnosed in Utah
RecommendationsInterpretations
Click here to return to Crop Table Click here to return to Text