Embed Size (px)
Citation preview
Understanding variations Outcomes for people diagnosed with cancer and implications for service provision
Macmillan Cancer Support, registered charity in England and Wales (261017), Scotland (SC039907) and the Isle of Man (604). MAC15208
Background & IntroductionIn England and Wales, half of people diagnosed with cancer are expected to live at least 10 years, compared with a quarter in the early 1970s1. In the UK, prevalence is predicted to increase to four million by 20302. The aim of this project is to explore variation in outcomes by cancer site in order to inform models for service provision for different cancer populations.
Materials & MethodsData on the prevalence, incidence and survival in the UK are reviewed alongside clinically led assumptions about needs and outcomes to categorise people with different cancer sites.
Where official statistics exist we use these to categorise and quantify the cancer types. Where official statistics are not available we draw on the wider literature to provide estimates. There is little historical data split by stage so prevalence by stage is crudely described from estimated total prevalence and stage at diagnosis. Therefore, we have created three categories of data according to quality.
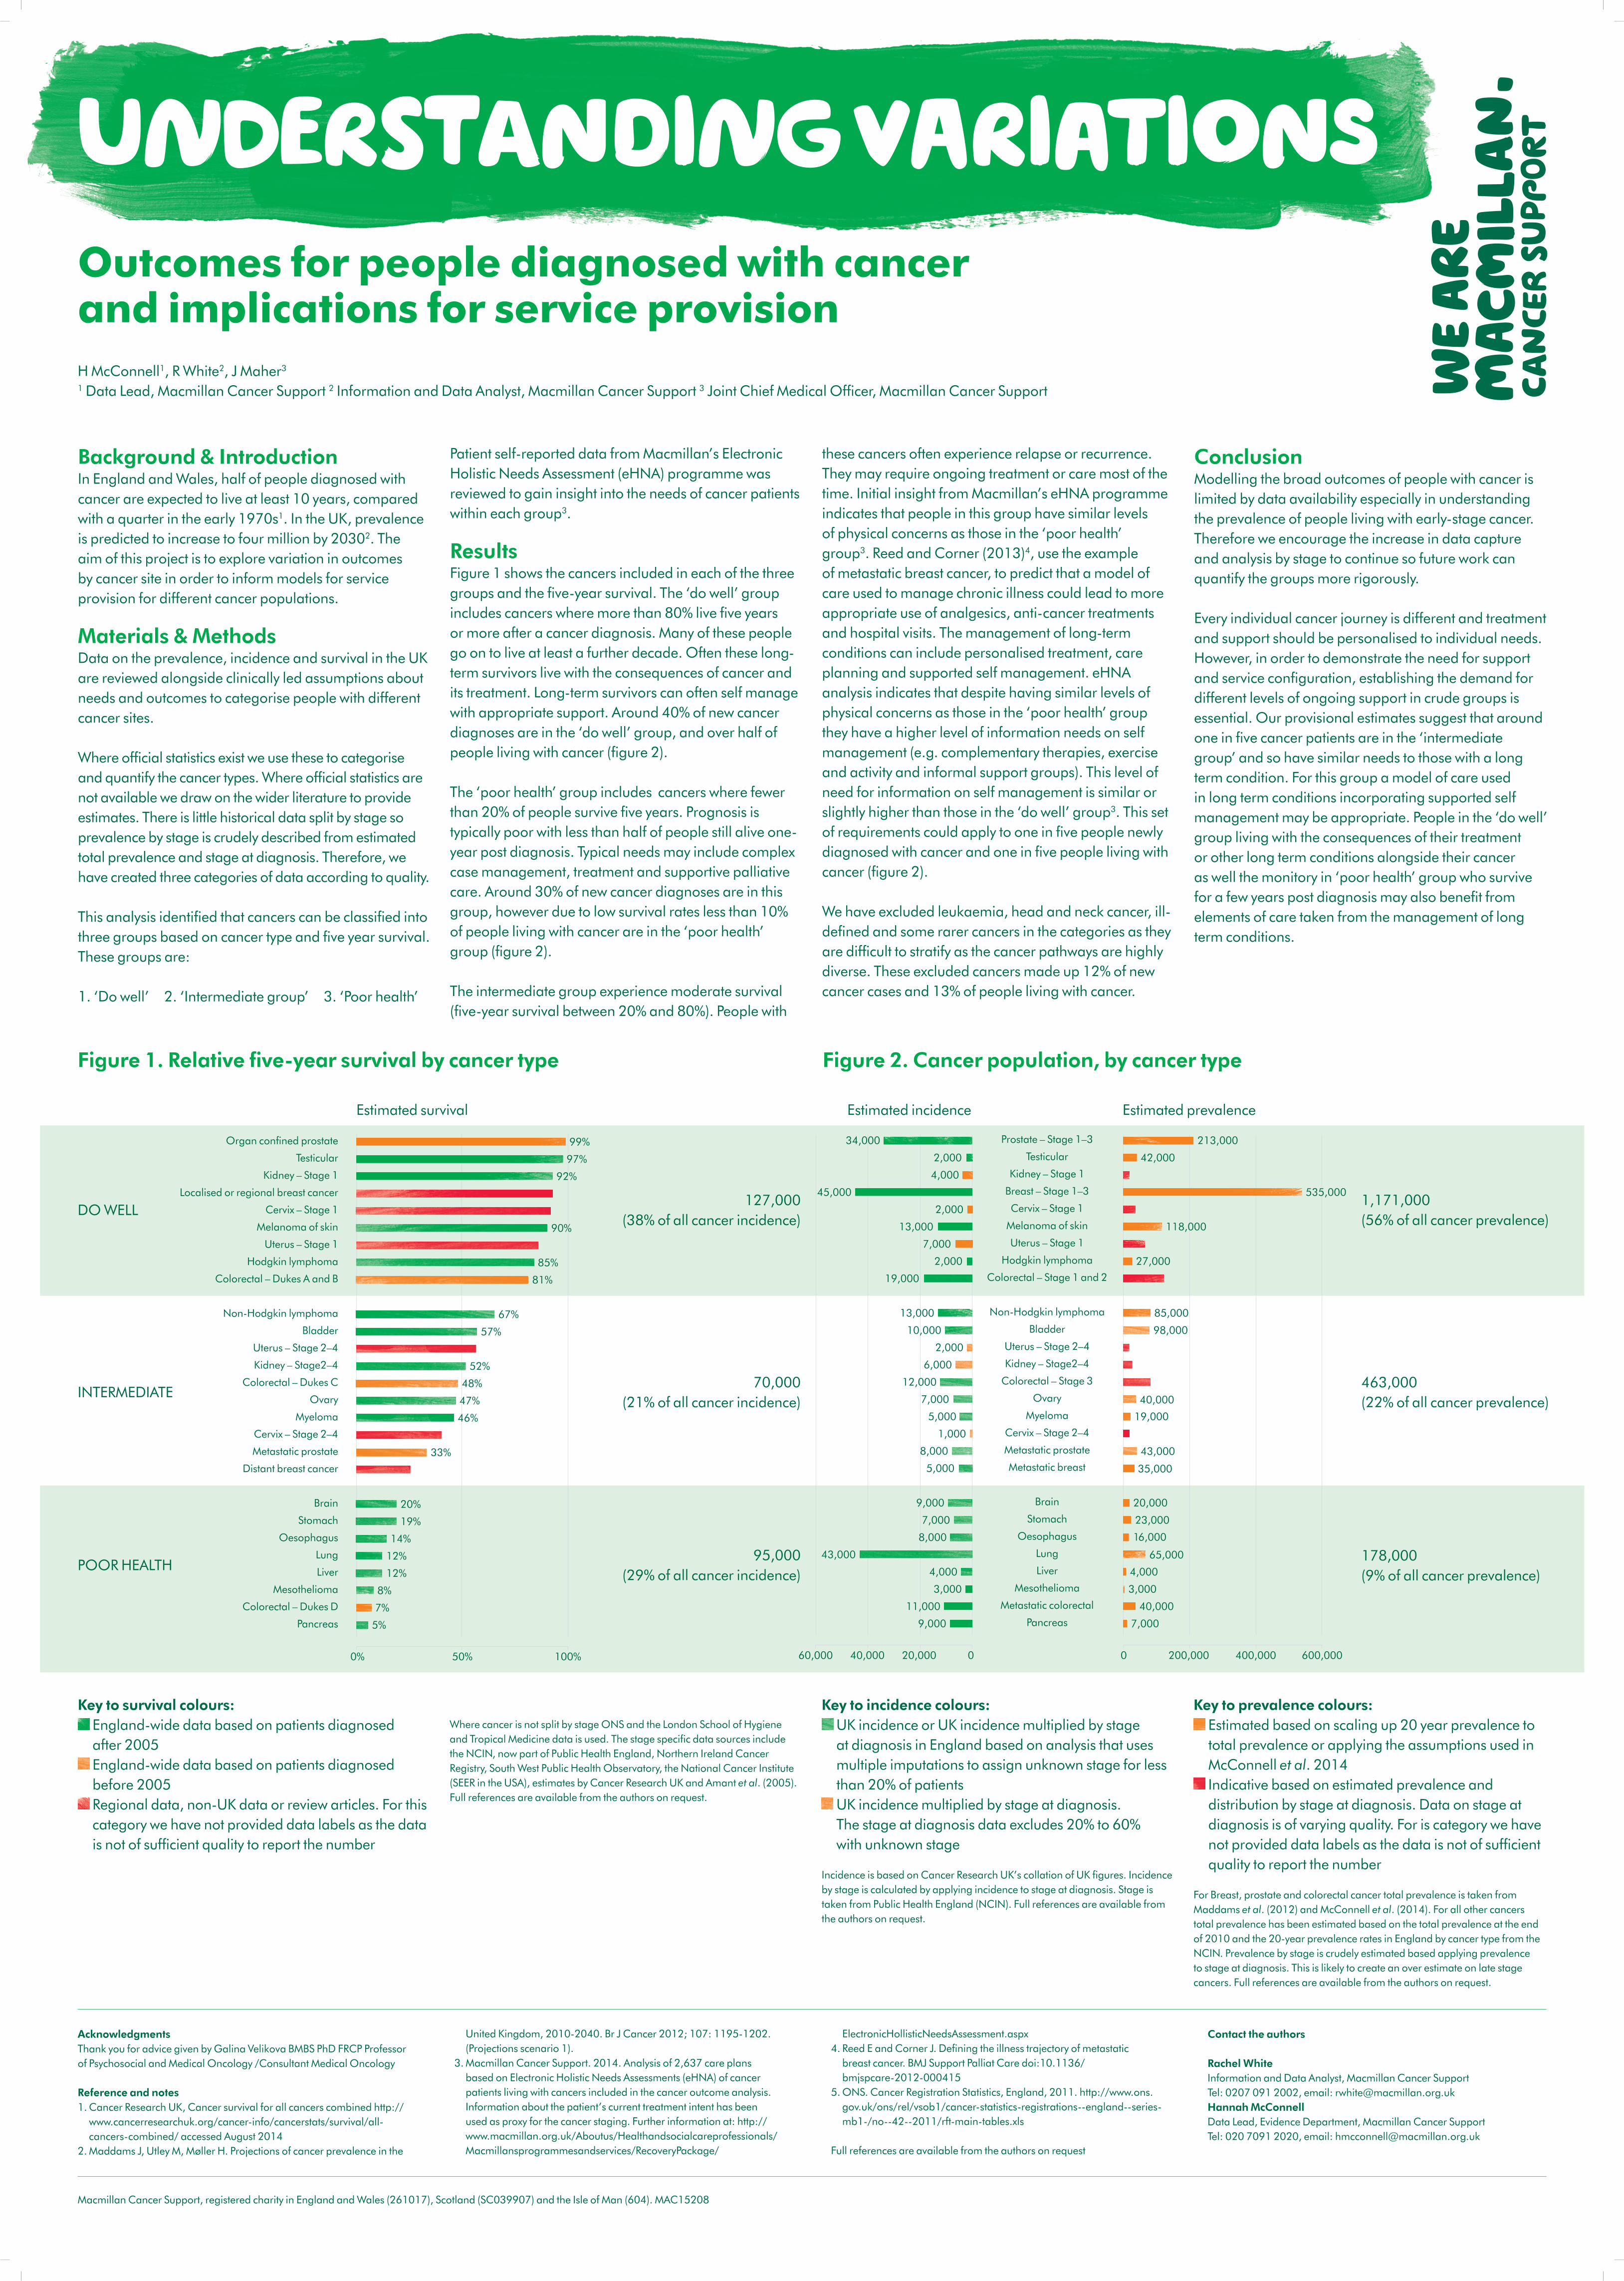
This analysis identified that cancers can be classified into three groups based on cancer type and five year survival. These groups are:
1. ‘Do well’ 2. ‘Intermediate group’ 3. ‘Poor health’
Patient self-reported data from Macmillan’s Electronic Holistic Needs Assessment (eHNA) programme was reviewed to gain insight into the needs of cancer patients within each group3.
ResultsFigure 1 shows the cancers included in each of the three groups and the five-year survival. The ‘do well’ group includes cancers where more than 80% live five years or more after a cancer diagnosis. Many of these people go on to live at least a further decade. Often these long-term survivors live with the consequences of cancer and its treatment. Long-term survivors can often self manage with appropriate support. Around 40% of new cancer diagnoses are in the ‘do well’ group, and over half of people living with cancer (figure 2).
The ‘poor health’ group includes cancers where fewer than 20% of people survive five years. Prognosis is typically poor with less than half of people still alive one-year post diagnosis. Typical needs may include complex case management, treatment and supportive palliative care. Around 30% of new cancer diagnoses are in this group, however due to low survival rates less than 10% of people living with cancer are in the ‘poor health’ group (figure 2).
The intermediate group experience moderate survival (five-year survival between 20% and 80%). People with
these cancers often experience relapse or recurrence. They may require ongoing treatment or care most of the time. Initial insight from Macmillan’s eHNA programme indicates that people in this group have similar levels of physical concerns as those in the ‘poor health’ group3. Reed and Corner (2013)4, use the example of metastatic breast cancer, to predict that a model of care used to manage chronic illness could lead to more appropriate use of analgesics, anti-cancer treatments and hospital visits. The management of long-term conditions can include personalised treatment, care planning and supported self management. eHNA analysis indicates that despite having similar levels of physical concerns as those in the ‘poor health’ group they have a higher level of information needs on self management (e.g. complementary therapies, exercise and activity and informal support groups). This level of need for information on self management is similar or slightly higher than those in the ‘do well’ group3. This set of requirements could apply to one in five people newly diagnosed with cancer and one in five people living with cancer (figure 2).
We have excluded leukaemia, head and neck cancer, ill-defined and some rarer cancers in the categories as they are difficult to stratify as the cancer pathways are highly diverse. These excluded cancers made up 12% of new cancer cases and 13% of people living with cancer.
ConclusionModelling the broad outcomes of people with cancer is limited by data availability especially in understanding the prevalence of people living with early-stage cancer. Therefore we encourage the increase in data capture and analysis by stage to continue so future work can quantify the groups more rigorously.
Every individual cancer journey is different and treatment and support should be personalised to individual needs. However, in order to demonstrate the need for support and service configuration, establishing the demand for different levels of ongoing support in crude groups is essential. Our provisional estimates suggest that around one in five cancer patients are in the ‘intermediate group’ and so have similar needs to those with a long term condition. For this group a model of care used in long term conditions incorporating supported self management may be appropriate. People in the ‘do well’ group living with the consequences of their treatment or other long term conditions alongside their cancer as well the monitory in ‘poor health’ group who survive for a few years post diagnosis may also benefit from elements of care taken from the management of long term conditions.
Key to survival colours: England-wide data based on patients diagnosed after 2005 England-wide data based on patients diagnosed before 2005 Regional data, non-UK data or review articles. For this category we have not provided data labels as the data is not of sufficient quality to report the number
Where cancer is not split by stage ONS and the London School of Hygiene and Tropical Medicine data is used. The stage specific data sources include the NCIN, now part of Public Health England, Northern Ireland Cancer Registry, South West Public Health Observatory, the National Cancer Institute (SEER in the USA), estimates by Cancer Research UK and Amant et al. (2005). Full references are available from the authors on request.
Key to incidence colours: UK incidence or UK incidence multiplied by stage at diagnosis in England based on analysis that uses multiple imputations to assign unknown stage for less than 20% of patients UK incidence multiplied by stage at diagnosis. The stage at diagnosis data excludes 20% to 60% with unknown stage
Incidence is based on Cancer Research UK’s collation of UK figures. Incidence by stage is calculated by applying incidence to stage at diagnosis. Stage is taken from Public Health England (NCIN). Full references are available from the authors on request.
Key to prevalence colours: Estimated based on scaling up 20 year prevalence to total prevalence or applying the assumptions used in McConnell et al. 2014 Indicative based on estimated prevalence and distribution by stage at diagnosis. Data on stage at diagnosis is of varying quality. For is category we have not provided data labels as the data is not of sufficient quality to report the number
For Breast, prostate and colorectal cancer total prevalence is taken from Maddams et al. (2012) and McConnell et al. (2014). For all other cancers total prevalence has been estimated based on the total prevalence at the end of 2010 and the 20-year prevalence rates in England by cancer type from the NCIN. Prevalence by stage is crudely estimated based applying prevalence to stage at diagnosis. This is likely to create an over estimate on late stage cancers. Full references are available from the authors on request.
H McConnell1, R White2, J Maher3
1 Data Lead, Macmillan Cancer Support 2 Information and Data Analyst, Macmillan Cancer Support 3 Joint Chief Medical Officer, Macmillan Cancer Support
AcknowledgmentsThank you for advice given by Galina Velikova BMBS PhD FRCP Professor of Psychosocial and Medical Oncology /Consultant Medical Oncology
Reference and notes1. Cancer Research UK, Cancer survival for all cancers combined http://
www.cancerresearchuk.org/cancer-info/cancerstats/survival/all-cancers-combined/ accessed August 2014
2. Maddams J, Utley M, Møller H. Projections of cancer prevalence in the
United Kingdom, 2010-2040. Br J Cancer 2012; 107: 1195-1202. (Projections scenario 1).
3. Macmillan Cancer Support. 2014. Analysis of 2,637 care plans based on Electronic Holistic Needs Assessments (eHNA) of cancer patients living with cancers included in the cancer outcome analysis. Information about the patient’s current treatment intent has been used as proxy for the cancer staging. Further information at: http://www.macmillan.org.uk/Aboutus/Healthandsocialcareprofessionals/Macmillansprogrammesandservices/RecoveryPackage/
ElectronicHollisticNeedsAssessment.aspx 4. Reed E and Corner J. Defining the illness trajectory of metastatic
breast cancer. BMJ Support Palliat Care doi:10.1136/bmjspcare-2012-000415
5. ONS. Cancer Registration Statistics, England, 2011. http://www.ons.gov.uk/ons/rel/vsob1/cancer-statistics-registrations--england--series-mb1-/no--42--2011/rft-main-tables.xls
Full references are available from the authors on request
Contact the authors
Rachel WhiteInformation and Data Analyst, Macmillan Cancer Support Tel: 0207 091 2002, email: [email protected] McConnellData Lead, Evidence Department, Macmillan Cancer SupportTel: 020 7091 2020, email: [email protected]
Figure 1. Relative five-year survival by cancer type
Estimated survival
DO WELL
INTERMEDIATE
POOR HEALTH
70,000 (21% of all cancer incidence)
95,000 (29% of all cancer incidence)
127,000 (38% of all cancer incidence)
463,000 (22% of all cancer prevalence)
178,000 (9% of all cancer prevalence)
0 200,000 400,000 600,000
Prostate – Stage 1–3
Testicular
Kidney – Stage 1
Breast – Stage 1–3
Cervix – Stage 1
Melanoma of skin
Uterus – Stage 1
Hodgkin lymphoma
Colorectal – Stage 1 and 2
Non-Hodgkin lymphoma
Bladder
Uterus – Stage 2–4
Kidney – Stage2–4
Colorectal – Stage 3
Ovary
Myeloma
Cervix – Stage 2–4
Metastatic prostate
Metastatic breast
Brain
Stomach
Oesophagus
Lung
Liver
Mesothelioma
Metastatic colorectal
Pancreas
34,000 213,000
42,000
535,000
118,000
27,000
85,000
98,000
40,000
19,000
43,000
35,000
20,000
23,000
16,000
65,000
4,000
3,000
40,000
7,000
2,000
4,000
45,000
2,000
13,000
7,000
2,000
19,000
13,000
10,000
2,000
6,000
12,000
7,000
5,000
1,000
8,000
5,000
9,000
7,000
8,000
43,000
4,000
3,000
11,000
9,000
1,171,000 (56% of all cancer prevalence)
60,000 40,000 20,000 0
Figure 2. Cancer population, by cancer type
Estimated incidence Estimated prevalence
Organ confined prostate
Testicular
Kidney – Stage 1
Localised or regional breast cancer
Cervix – Stage 1
Melanoma of skin
Uterus – Stage 1
Hodgkin lymphoma
Colorectal – Dukes A and B
Non-Hodgkin lymphoma
Bladder
Uterus – Stage 2–4
Kidney – Stage2–4
Colorectal – Dukes C
Ovary
Myeloma
Cervix – Stage 2–4
Metastatic prostate
Distant breast cancer
Brain
Stomach
Oesophagus
Lung
Liver
Mesothelioma
Colorectal – Dukes D
Pancreas
99%
97%
92%
90%
85%
81%
67%
57%
52%
48%
47%
46%
33%
20%
19%
14%
12%
12%
8%
7%
5%
0% 50% 100%