Embed Size (px)
Citation preview

Understanding Trends in Wind Turbine Prices Over the Past Decade Mark Bolinger and Ryan Wiser Lawrence Berkeley National Laboratory
Environmental Energy Technologies Division
October 2011
Download from http://eetd.lbl.gov/ea/emp
The work described in this report was funded by the U.S. Department of Energy’s Wind & Water Power Program, within the Office of Energy Efficiency and Renewable Energy, under Contract No. DE-AC02-05CH11231.
ERNEST ORLANDO LAWRENCE
BERKELEY NATIONAL LABORATORY
LBNL-5119E
Disclaimer
This document was prepared as an account of work sponsored by the United States Government. While this document is believed to contain correct information, neither the United States Government nor any agency thereof, nor The Regents of the University of California, nor any of their employees, makes any warranty, express or implied, or assumes any legal responsibility for the accuracy, completeness, or usefulness of any information, apparatus, product, or process disclosed, or represents that its use would not infringe privately owned rights. Reference herein to any specific commercial product, process, or service by its trade name, trademark, manufacturer, or otherwise, does not necessarily constitute or imply its endorsement, recommendation, or favoring by the United States Government or any agency thereof, or The Regents of the University of California. The views and opinions of authors expressed herein do not necessarily state or reflect those of the United States Government or any agency thereof, or The Regents of the University of California.
Ernest Orlando Lawrence Berkeley National Laboratory is an equal opportunity employer.
Acknowledgments The work described in this report was funded by the U.S. Department of Energy’s Wind & Water Power Program, within the Office of Energy Efficiency and Renewable Energy, under Contract No. DE-AC02-05CH11231. The authors thank Patrick Gilman (U.S. DOE) for his support of this work, Zack Subin (UC Berkeley/LBNL) for embarking on the initial analysis that formed the basis for this report, Eric Lantz (NREL) for guidance on the use of NREL’s turbine cost and scaling model, and Naïm Darghouth (LBNL) for compiling data on wind turbine imports. The authors would also like to thank the following individuals for reviewing earlier drafts of this manuscript: Patrick Gilman (U.S. DOE), Philip Greenacre (Imperial College Centre for Environmental Policy, ICEPT & UKERC), Cathy Jabara (U.S. International Trade Commission), Eric Lantz (NREL), David Milborrow (renewable energy consultant), Zack Subin (University of California at Berkeley and LBNL), and several anonymous reviewers. Of course, any remaining errors or omissions are the sole responsibility of the authors.

Table of Contents Executive Summary ......................................................................................................................... i 1. Introduction ................................................................................................................................ 1 2. Wind Turbine Price Trends in the United States ....................................................................... 4 3. Wind Turbine Price Drivers ....................................................................................................... 6
3.1 Labor Costs .......................................................................................................................... 7 3.2 Warranty Provisions............................................................................................................. 8 3.3 Turbine Manufacturer Profitability .................................................................................... 10 3.4 Increasing Turbine Size and Energy Capture .................................................................... 12 3.5 Raw Materials Prices ......................................................................................................... 15 3.6 Energy Prices ..................................................................................................................... 18 3.7 Foreign Exchange Rates .................................................................................................... 23
4. Aggregate Impact of Turbine Price Drivers ............................................................................. 27 5. Looking Ahead......................................................................................................................... 29 References ..................................................................................................................................... 31 Appendix A – Commodity Price Time Series Data ...................................................................... 35
Raw Materials Price Data ......................................................................................................... 35 Energy Price Data ..................................................................................................................... 36
Appendix B – Tables 6 and 7 from Vestas LCA of 1.65 MW V82 Turbine (Vestas 2006b) ....... 37 Appendix C – Exchange Rate Pass-Through ................................................................................ 38
i
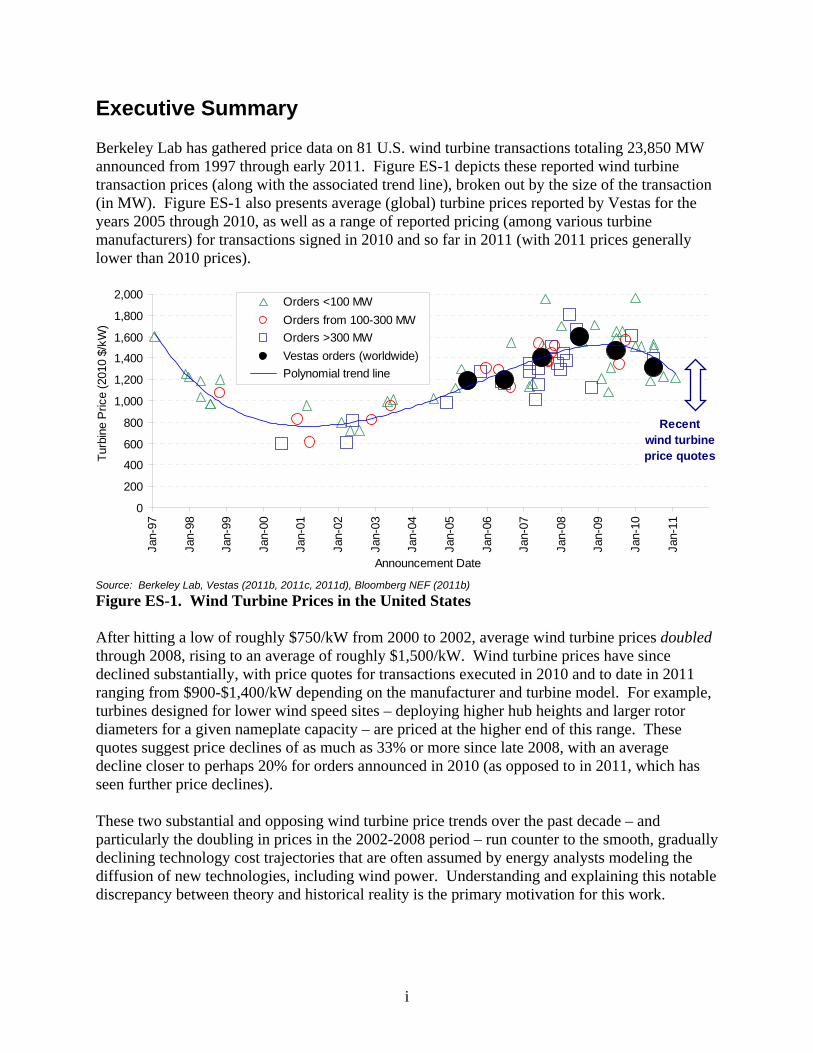
Executive Summary Berkeley Lab has gathered price data on 81 U.S. wind turbine transactions totaling 23,850 MW announced from 1997 through early 2011. Figure ES-1 depicts these reported wind turbine transaction prices (along with the associated trend line), broken out by the size of the transaction (in MW). Figure ES-1 also presents average (global) turbine prices reported by Vestas for the years 2005 through 2010, as well as a range of reported pricing (among various turbine manufacturers) for transactions signed in 2010 and so far in 2011 (with 2011 prices generally lower than 2010 prices).
Source: Berkeley Lab, Vestas (2011b, 2011c, 2011d), Bloomberg NEF (2011b)
Figure ES-1. Wind Turbine Prices in the United States After hitting a low of roughly $750/kW from 2000 to 2002, average wind turbine prices doubled through 2008, rising to an average of roughly $1,500/kW. Wind turbine prices have since declined substantially, with price quotes for transactions executed in 2010 and to date in 2011 ranging from $900-$1,400/kW depending on the manufacturer and turbine model. For example, turbines designed for lower wind speed sites – deploying higher hub heights and larger rotor diameters for a given nameplate capacity – are priced at the higher end of this range. These quotes suggest price declines of as much as 33% or more since late 2008, with an average decline closer to perhaps 20% for orders announced in 2010 (as opposed to in 2011, which has seen further price declines). These two substantial and opposing wind turbine price trends over the past decade – and particularly the doubling in prices in the 2002-2008 period – run counter to the smooth, gradually declining technology cost trajectories that are often assumed by energy analysts modeling the diffusion of new technologies, including wind power. Understanding and explaining this notable discrepancy between theory and historical reality is the primary motivation for this work.
0
200
400
600
800
1,000
1,200
1,400
1,600
1,800
2,000
Jan-
97
Jan-
98
Jan-
99
Jan-
00
Jan-
01
Jan-
02
Jan-
03
Jan-
04
Jan-
05
Jan-
06
Jan-
07
Jan-
08
Jan-
09
Jan-
10
Jan-
11
Announcement Date
Orders <100 MW
Orders from 100-300 MW
Orders >300 MW
Vestas orders (worldwide)
Polynomial trend line
Tur
bine
Pric
e (2
010
$/kW
)
Recentwind turbineprice quotes

ii
Taking a bottom-up approach, this report examines seven primary drivers of wind turbine prices in the United States, with the goal of estimating the degree to which each contributed to the doubling in turbine prices from 2002 through 2008, as well as the subsequent decline in prices through 2010 (our analysis does not extend into 2011 because several of these drivers are best gauged on a full-year basis due to seasonality issues). The first four of these drivers can be considered, at least to some degree, endogenous influences – i.e., those that are largely within the control of the wind industry – and include changes in:
1) Labor costs, which have historically risen during times of tight turbine supply; 2) Warranty provisions, which reflect technology performance and reliability, and are most
often capitalized in turbine prices; 3) Turbine manufacturer profitability, which can impact turbine prices independently of
costs; and 4) Turbine design, which for the purpose of this analysis is principally manifested through
increased turbine size.
The other three drivers analyzed in this study can be considered exogenous influences, in that they can impact wind turbine costs but fall mostly outside of the direct control of the wind industry. These exogenous drivers include changes in:
5) Raw materials prices, which affect the cost of inputs to the manufacturing process; 6) Energy prices, which impact the cost of manufacturing and transporting turbines; and 7) Foreign exchange rates, which can impact the dollar amount paid for turbines and
components imported into the United States.
The individual impacts of each of these seven drivers of wind turbine prices are summarized in Table ES-1. To focus attention on the overall trends, the table presents cumulative impacts over the two periods of major turbine price movements in the past decade – i.e., the doubling in turbine prices from 2002-2008, and the subsequent decline in prices through 2010.
Table ES-1. Cumulative Impact During Period of Turbine Price Increase (2002-08) and Decrease (2009-10) (2010 $/kW)
2002-2008 2009-2010 Endogenous Drivers +376 -37
Labor Costs +91 +12 Warranty Provisions +42 -20 Profit Margins +59 -78 Turbine Scaling +184 +50
Exogenous Drivers +219 -53 Materials Prices +71 -31
Steel +65 -29 Iron +7 -2 Copper +9 +1 Aluminum +2 -1 Fiberglass -11 0
Energy Prices +12 -7 Diesel +10 -4 Coal 0 0 Natural Gas +2 -3
Currency Movements +136 -15
Total Impact +595 -89

iii
Figure ES-2, meanwhile, shows yearly impacts, but of all seven drivers combined rather than individually. The aggregate impact (blue line with circle markers) is plotted against the empirical turbine price trend line from Figure ES-1 (red line with star markers).
Figure ES-2. Yearly Impact of All Seven Drivers Combined vs. Empirical Price Curve
In aggregate, these seven drivers explain nearly $600/kW of the ~$750/kW increase in average turbine prices observed from 2002-2008, and nearly $90/kW of the ~$195/kW decrease in 2009 and 2010 (Table ES-1). From 2003 through 2010, the bottom-up analysis of these seven drivers explains between 68% and 89% (depending on the year) of the cumulative empirical price movements (Figure ES-2).
Nonetheless, Figure ES-2 shows a growing gap between modeled and empirical turbine prices starting in 2005 and increasing through 2007, at which point the gap remains more or less constant until eventually narrowing in 2010. Some portion of this wedge could potentially be explained by: Likely increasing labor costs and profitability among component suppliers beginning
around 2005; as noted earlier and discussed further in Section 3.3, we quantified these two drivers for turbine manufacturers, but not for their component suppliers;
Higher exchange rate pass-through than the 50% assumed here (see Appendix C for more discussion of exchange rate pass-through);
Turbine design and engineering improvements beyond the scaling effects analyzed in Section 3.4; and
Methodological issues, such as the necessary reliance on certain data from Vestas when the market was supplied by multiple manufacturers (and especially GE Wind) over this period.
Finally, it is clear from this analysis that there is no single, dominant factor that drove turbine prices higher from 2002-08, or that has yielded lower prices since that time. Turbine up-scaling is, by a significant margin, the largest single driver, although the estimated cost impact associated with up-scaling can be seen as a reasonable expense given the performance improvements garnered by larger turbines. Currency movements are also found to have played a sizable – though somewhat uncertain – role, as have changes in labor costs and material prices. Changes in manufacturer profit margins, warranty provisions, and energy prices are found to have played a less-significant, but non-negligible role.
0
200
400
600
800
1,000
1,200
1,400
1,600
2001 2002 2003 2004 2005 2006 2007 2008 2009 2010
20
10
$/k
W
Empirical polynomial trend line (from Figure 2)
Bottom-up analysis (all 7 drivers combined)

1
1. Introduction A considerable literature has developed using learning curve theory to explore how increases in cumulative wind power capacity (and other factors) have historically driven down wind energy costs (for a brief survey of the peer-reviewed literature, see Wiser et al. 2011a). The principal parameter calculated by these studies is the learning rate: for every doubling in cumulative production or installation, the learning rate specifies the associated percentage reduction in costs. Learning rates based on historical data are then often used to forecast future cost developments. As an example, Wiser and Bolinger (2011) calculate a learning rate of 14.4% for the installed cost of wind power projects in the United States during the period between 1982 and 2004, meaning that for each doubling in cumulative installed wind capacity worldwide over this period, installed wind project costs in the U.S. fell by 14.4% on average. These historical cost reductions, in concert with governmental policies and other drivers, helped to fuel rapid growth in the industry, both domestically and abroad, starting around the turn of the century (Figure 1). In fact, although wind power technology has been commercially available for decades, more than 90% of all wind power capacity both in the US and worldwide has been installed in just the last 10 years. Over this period, global installed wind power capacity more-than-doubled in the four years from 2002 through 2005, and then again in the three years from 2006 through 2008; it is currently on track to double yet again by late 2011.
Figure 1. US and Global Installed Wind Power Capacity: 1981-2010 Consistent with standard learning curve theory, the most-recent doubling expected by late 2011 has, in fact, been accompanied by significant cost reductions: as demonstrated later in Section 2, wind turbine prices in the U.S. have fallen somewhere on the order of 20%-33% on average since 2008. By some accounts, these turbine price declines, in combination with improvements in turbine design and performance, will result in a lower cost of wind electricity among projects currently being built than has ever before been possible (Wiser et al. 2011b). It is important to recognize, however, that the substantial turbine price declines since 2008 started from elevated levels that, themselves, were not consistent with a simple understanding of standard learning curve theory. Rather than the nearly 30% decline in wind project costs that learning curve theory would have expected from 2002 through 2008 as a result of the two doublings in global installed capacity over this period, reported wind project costs in the U.S. actually increased by more than 50% percent over this period, due primarily to a doubling in
0
5
10
15
20
25
30
35
40
1981
1982
1983
1984
1985
1986
1987
1988
1989
1990
1991
1992
1993
1994
1995
1996
1997
1998
1999
2000
2001
2002
2003
2004
2005
2006
2007
2008
2009
2010
0
25
50
75
100
125
150
175
200
Annual World Capacity (left scale)
Cumulative World Capacity (right scale)
Cu
mu
lativ
e C
ap
aci
ty (
GW
)
An
nua
l Ca
pa
city
(G
W)
0123456789
1011
1981
1982
1983
1984
1985
1986
1987
1988
1989
1990
1991
1992
1993
1994
1995
1996
1997
1998
1999
2000
2001
2002
2003
2004
2005
2006
2007
2008
2009
2010
048121620242832364044
Annual US Capacity (left scale)
Cumulative US Capacity (right scale)
Cu
mu
lativ
e C
ap
aci
ty (
GW
)
An
nu
al C
ap
aci
ty (
GW
)

2
wind turbine prices. This doubling in wind turbine prices through 2008, and the subsequent decline since then, mark a substantial divergence from the simple application of learning curves to cumulative wind power installations. This divergence has important implications for the wind industry, policymakers, research and development (R&D) program managers, and energy analysts. With the wind industry only recently becoming a serious contributor to the power sector in the U.S. and globally, it must take care that unexpected cost inflation does not price wind out of the market, leading to demand destruction. Policymakers who count on wind to provide a growing share of the world’s electricity needs – and who enact policies aimed to achieve that goal – want reassurances that wind can meet this challenge in a cost-effective manner (and that wind will eventually be able to wean itself off of direct public policy support altogether). R&D managers need to understand past cost trends in order to target future research most effectively. Finally, energy analysts who have heretofore placed some faith in the simple application of learning curves to project future technology costs must potentially reevaluate their beliefs and develop a more nuanced understanding of the drivers of wind (and other forms of) power costs. Common to all four sets of stakeholders is a growing need to understand what specific factors – if not learning effects – have been driving recent wind power cost trends, and in particular the doubling in wind turbine prices from 2002 through 2008. This article seeks to contribute to such an understanding, with a specific focus on the cost of wind turbines deployed onshore in the United States. In doing so, it builds on the work of other studies that have begun to develop a deeper understanding of historical renewable energy cost drivers beyond simple, traditional concepts of learning (see, e.g., Nemet 2006; Papineau 2006, Ferioli et al. 2009, Yu et al. 2011), as well as those that have examined in some detail other causal influences to wind power costs, both on- and offshore (e.g., Bolinger and Wiser 2009, Milborrow 2008, Berry 2009, Blanco 2009, Greenacre et al. 2010, Carbon Trust 2008, Willow & Valpy 2011, BWEA & Garrad Hassan 2009, Ernst & Young 2009, Dinica 2011).1 To set the stage, Section 2 documents the increase in onshore wind turbine prices from 2002 through 2008 and the subsequent decline through 2010 using empirical data from the United States, as well as data provided by Vestas – the second-largest wind turbine supplier in the US market over this period. Section 3 examines seven different drivers that have been implicated to varying degrees in the run-up in wind turbine prices through 2008. The first four are, to a degree, endogenous influences that should be influenced by technology learning, and include labor costs, warranty provisions, turbine manufacturer profitability, and turbine design (namely, an increase in turbine nameplate capacity, hub height, and rotor diameter – all of which enable greater energy capture). The other three drivers are, to a greater extent, exogenous influences that fall outside of the scope of traditional learning curve theory, and include changes in raw materials prices, energy prices, and foreign exchange rates. Based on the analysis in Section 3, Section 4 presents the approximate degree to which each of these seven drivers, both individually and in aggregate, is found to have contributed to the overall movement in wind turbine prices over this period. Section 5 concludes by drawing insights from the analysis, and using them to look ahead to 2011 and beyond.
1 Related literature has also sought to explore the historical cost drivers for coal (e.g., McNerney et al. 2011) and nuclear (e.g., Koomey and Hultman 2007).
3
Before proceeding, we emphasize that this article focuses solely on wind turbine prices, rather than on the total installed cost of wind projects (which also includes balance of plant costs) or on the levelized cost of wind generation (which is further affected by financing terms, operating and maintenance expenses, and the amount of electricity generated). Wind turbine costs generally account for roughly 60%-70% of total installed project costs, and a slightly lower percentage of the levelized cost of wind generation (due to the latter also reflecting O&M and financing costs). Though it is ultimately the levelized cost of generation that is the most important of these three cost metrics, understanding trends in wind turbine pricing is a critical element to understanding trends in the levelized cost of generation.

4
2. Wind Turbine Price Trends in the United States Berkeley Lab has gathered price data on 81 U.S. wind turbine transactions totaling 23,850 MW announced from 1997 through early 2011. Because of limitations in the data sources – most of which are press releases and news reports – the precise content of many of the individual turbine transactions is not known, though most transactions likely include only the turbines and towers delivered to the project site, as well as limited warranty and service agreements. Balance of plant (“BOP”) construction, including foundation construction and turbine erection, is most often handled separately by engineering, procurement, and construction (“EPC”) contractors (Bloomberg NEF 2011a, Fowler 2008).2 Nevertheless, because of this uncertainty and the fact that our data sources are diverse, emphasis should be placed on overall trends in the data, rather than on individual data points. Figure 2 depicts these reported wind turbine transaction prices (along with the associated trend line), broken out by the size of the transaction (in MW). Because visibility surrounding wind turbine transactions has declined in recent years,3 Figure 2 also presents a range of reported pricing for transactions signed in 2010 and so far in 2011, sourced from Bloomberg NEF (2011b) as well as wind industry contacts. Finally, serving only as a quality check on our post-2004 transaction sample, Figure 2 includes average turbine prices reported by Vestas for the years 2005 through 2010 (Vestas 2011b, 2011c, 2011d) and converted into 2010 U.S. dollars.4
2 For example, Vestas categorizes its turbine orders as “supply only” (which includes only delivery and commissioning), “supply-and-installation” (which also includes turbine erection), or “EPC/Turnkey” (which also includes all other BOP and civil construction). Globally, half of all turbine orders placed with Vestas in 2010 were of the “supply-only” variety (Vestas 2011b), while in the U.S., the vast majority of Vestas turbine orders are reportedly for “supply-only” (Villadsen 2011). Data on the market share of EPC contractors from Bloomberg NEF (2011a) suggest that other wind turbine manufacturers are in a similar position – i.e., turbine erection and other BOP work most often falls outside of the turbine supply agreement. 3 For example, the sample includes just 10 transactions summing to 907 MW announced in 2010 and early 2011 – i.e., just 14% of the 6,280 MW of new turbine orders reported over this period by AWEA (2011). In addition to less transparency surrounding new orders, there have also been fewer orders overall in recent years, partly a function of reduced demand for wind turbines since the financial crisis of 2008/2009. Prior to the crisis, and heading into the peak of the wind turbine market (in terms of demand and pricing), many of the larger U.S. wind project developers entered into multi-year “frame agreements” with turbine manufacturers as a way to secure their anticipated turbine needs for the foreseeable future at a known price. In the wake of the financial crisis, demand for wind power in the U.S. diminished, leaving many developers holding more turbines than they could reasonably deploy, and therefore reducing demand for new turbine orders. 4 The prices reported by Vestas are derived from order intake (in billion Euros) divided by MW ordered, and represent “averages for all markets, all contract types, all project sizes and all products.” As such, unlike the other data points in Figure 2, the Vestas averages are not exclusively U.S.-specific, likely include a higher prevalence of “supply-and-install” and “EPC/Turnkey” contracts, and also presumably include some offshore wind turbines. That said, the fact that the Vestas prices match up quite well with the polynomial trend line from the Berkeley Lab turbine transaction sample suggests that these factors may not unduly influence the averages (e.g., offshore wind still accounts for a relatively small portion of Vestas’ turbine sales). Regardless, the Vestas prices are only included here as a benchmarking exercise – i.e., to confirm the trends revealed through our empirical transaction sample – and are not used in any of the later analysis (although given that much of the later analysis relies on other types of data from Vestas, it is comforting to see the general agreement between the Vestas reported turbine prices and the empirical turbine prices used in the analysis).

5
Source: Berkeley Lab, Vestas (2011b, 2011c, 2011d), Bloomberg NEF (2011b)
Figure 2. Wind Turbine Prices in the United States After hitting a low of roughly $750/kW from 2000 to 2002, average wind turbine prices doubled through 2008, rising to an average of roughly $1,500/kW. Wind turbine prices have since declined substantially, with price quotes for transactions executed in 2010 and to date in 2011 ranging from $900-$1,400/kW. These figures suggest price declines of as much as 33% or more since late 2008, with an average decline closer to perhaps 20% for orders announced in 2010 (as opposed to in 2011). As of July 2011, BNEF (2011c) was reporting U.S. transactions averaging $1,100/kW, though actual prices are highly dependent on the selected turbine design, with technology designed for lower wind speed sites (i.e., deploying higher hub heights and larger rotor diameters) coming in at higher pricing points. Though other generation technologies experienced similar cost trends over this period,5 these large swings in wind turbine prices merit an explanation. Moreover, the fact that the cumulative global installed capacity of wind power doubled twice during the period of rising prices suggests that we must look somewhere other than traditional learning curve theory for this explanation.
5 It is important to recognize that the wind power industry was not alone in seeing upward pressure on project costs in the years prior to the global financial crisis – other types of power plants experienced similar increases in capital costs. In September 2007, for example, the Edison Foundation published a report showing increases in the installed cost of both natural gas and coal power plants that rival that seen in the wind industry, with cost drivers overlapping those that are highlighted for wind in the present study (Chupka and Basheda 2007). Similarly, the IHS CERA Power Capital Cost Index (“PCCI”) of coal, gas, solar, and wind power plants indicates that the average cost of these power plants increased by 90% from 2000 through 2008 (IHS CERA 2011), and have since declined by roughly 10% (though the index has recently begun to creep higher once again). Cost increases for conventional power plants are also covered in Winters (2008).
0
200
400
600
800
1,000
1,200
1,400
1,600
1,800
2,000
Jan-
97
Jan-
98
Jan-
99
Jan-
00
Jan-
01
Jan-
02
Jan-
03
Jan-
04
Jan-
05
Jan-
06
Jan-
07
Jan-
08
Jan-
09
Jan-
10
Jan-
11
Announcement Date
Orders <100 MW
Orders from 100-300 MW
Orders >300 MW
Vestas orders (worldwide)
Polynomial trend line
Tur
bine
Pric
e (2
010
$/kW
)
Recentwind turbineprice quotes

6
3. Wind Turbine Price Drivers Taking a bottom-up approach, this section examines seven potential drivers of wind turbine prices in the United States, with the goal of estimating the degree to which each contributed to the increase in turbine prices from 2002 through 2008, as well as the subsequent decline in prices through 2010; the continued turbine price reductions experienced in the first half of 2011 are addressed to only a limited extent, in Section 5.6 The first four of these drivers can be considered, to at least some degree, endogenous influences that should benefit from learning: these include labor costs (which are impacted by labor rates and quantities, the latter of which is endogenous), warranty provisions (which reflect technology performance and reliability), turbine manufacturer profitability (which tends to decline as industries grow and mature), and turbine design (for the purpose of this analysis, principally manifested through increased turbine size). The other three drivers analyzed in this study can be considered largely exogenous in that they can impact wind turbine costs but are not readily affected by learning in the wind industry, and include changes in the commodity price of raw materials and energy inputs to manufacturing processes, as well as movements in foreign exchange rates. Though the distinction between endogenous and exogenous influences is by no means absolute, and a number of the drivers analyzed here have elements of both,7 it is nevertheless helpful in at least loosely understanding the relative importance of different categories of influences. It should also be noted that the seven specific drivers analyzed here do not fully explain the wind turbine price trends that have been empirically observed; other possible drivers are identified in the pages that follow, though available data do not allow a complete analysis of those additional drivers. The next three sections (3.1-3.3) – on labor costs, warranty provisions, and turbine manufacturer profitability – draw heavily from the financial reports of one of the largest wind turbine manufacturers in the world – Vestas. Though it is not the intent of this report to focus exclusively on Vestas turbines or reach conclusions that are applicable only to Vestas, relying on Vestas’ financial data nevertheless is both necessary and logical for reasons explained in the text box on page 7.
6 To clarify, the period of interest to this analysis is 2002-2010. In order to capture changes that took place in 2002, however, we must also rely on data from 2001. As such, 2001 data are reported in some cases throughout the document. 7 As one example, the price of commodities (raw materials and energy) could be considered somewhat endogenous in that strong demand among wind turbine manufacturers for certain commodities could conceivably increase the price of those commodities. Although recent media attention has focused on just such a demand-driven increase in the price of "rare earth” metals used in a number of “green” technologies, permanent magnet generators (one such technology utilizing rare earths) were not widely deployed in the U.S. wind turbine fleet during the 2002-2010 period of interest to this study. The remaining materials used to manufacture wind turbines are all relatively plentiful, and the wind industry was likely not large enough on its own during the period of interest to impact prices in a meaningful way. In fact, Laxson et al. (2006) find that even under high wind power penetration levels (e.g., with wind power able to meet 20% of total U.S. electricity demand), materials constraints are not likely to be a major issue for wind turbine manufacturers.
7
3.1 Labor Costs Learning effects should theoretically drive down labor costs. As more and more technology is manufactured and deployed, manufacturers should become more efficient at utilizing – or even in some cases eliminating (e.g., through automation) – labor. When the pace of deployment is so rapid that it strains the supply of available labor, however, short-term cost increases are possible. Such was the case with the dramatic growth in installed wind power capacity over the past decade. As wind turbine and component manufacturers scrambled to address the scarcity of turbine supply, labor costs rose, leading to upward pressure on wind turbine prices. Figure 3 shows Vestas’ staff costs back to 2001, along with the cumulative change since then, expressed in 2010 $/kW (delivered).8 As shown, Vestas’ reported labor costs increased by 8 In converting to 2010 dollars, we first inflate the reported nominal Euros for all years to 2010 Euros using a Euro-area GDP deflator. Next, we convert the 2010 Euro amounts for all years into 2010 USD using the average 2010
Reliance on Vestas’ Financial Reporting During the period of interest to this study – 2002 through 2010 – GE (45%), Vestas (15%), Siemens (12%), and Mitsubishi (8%) together accounted for nearly 80% of all newly installed wind power capacity in the US. All four of these companies are publicly traded and are therefore required to disclose financial data, but only one of them – Vestas – is a “pure-play” wind turbine manufacturer. The other three are heavy industrial conglomerates and do not disaggregate financial reporting for their wind turbine divisions in sufficient detail to be of use to this study. Gamesa (7%) and Suzlon (6%) together captured another 13% of the market over this period and are more wind-focused than the three large conglomerates, but nevertheless still have some financial reporting complexities related to subsidiaries (e.g., Gamesa’s aeronautics and solar divisions in earlier years; Suzlon’s investments in another turbine manufacturer – REpower – as well as Hansen transmission), and otherwise do not, in some cases, report relevant data back to 2001. In other words, among the six turbine manufactures that together accounted for 92% of all capacity installed in the U.S. from 2002-2010, only Vestas files financial reports that contain directly applicable and complete (notwithstanding recent accounting changes at Vestas, discussed in the text box on page 10) historical data on several drivers of interest to this study: labor costs, warranty provisions, and profitability. Although we rely principally on Vestas for financial data by necessity, there are nevertheless several reasons to think that trends revealed through Vestas’ filings can serve as a suitable proxy for the entire US market over this period – at least to the degree of precision required for this high-level analysis. First, Vestas ranked second with 15% market share over this period (though admittedly far behind GE at 45%), which makes it a more representative choice than, for example, Gamesa or Suzlon; Vestas was also the largest manufacturer globally over this entire period, ensuring a degree of temporal stability in the resulting financial reports. Second, though turbine design variations existed among manufacturers over this period, the most widely deployed turbines were relatively homogenous, at least among the top U.S. turbine suppliers (e.g., Siemens is only now beginning to deploy direct-drive technology), which suggests that variations in cost structures as a result of fundamental design differences should be relatively modest. Third, because we are principally interested in changes in costs over time, rather than the absolute value of those costs, any differences in the underlying cost structure among manufacturers is less important than it might otherwise be. Fourth, the U.S. wind turbine market can be presumed to be competitive – e.g., witness how closely Vestas’ reported average pricing matches the empirical price data presented earlier in Figure 2 – and competitive pressures should narrow the degree of variation in financial parameters impacting turbine suppliers over this period. Although these four factors provide some comfort that Vestas can, indeed, serve as a suitable proxy for the entire U.S. market over the period of interest, in the limited cases where it is possible, we also present non-Vestas data to provide support for the trends revealed in Vestas’ financial reports. Finally, though not directly linked, the use of Vestas financial data also provides some continuity with the analyses of raw materials and energy costs presented later, which use data on Vestas turbines gleaned from several recent life-cycle analyses.

8
$142/kW through 2009, with a subsequent $39/kW decline in 2010. Though Vestas is understood to have historically had higher staff costs than some other turbine manufacturers (Efiong and Crispin 2007), the temporal changes in staff costs reported by Vestas are consistent with some other manufacturers. For example, though not shown in the figure, Suzlon’s annual financial reports show a similar increase in labor costs since 2003 (available data from Suzlon do not go back any further): a $115/kW increase through 2009, with a $15/kW decline in 2010.
Source: Vestas annual reports for 2001-2010
Figure 3. Vestas Staff Costs Not included here is an analysis of labor costs faced by component suppliers, for reasons discussed later in the turbine manufacturer profitability section (Section 3.3). However, if trends among component suppliers mirror those of the major turbine suppliers for which data could be obtained (Vestas and Suzlon), then the impact of labor costs on the overall turbine pricing trends presented in Section 2 would be even greater than estimated above. 3.2 Warranty Provisions In most cases, turbine prices include the expected cost (properly discounted) of standard warranty terms. In some cases, the expected cost of any extended warranties or service contracts entered into at the time of turbine sale may also be capitalized into the turbine price. In either instance, the amount set aside by turbine manufacturers to pay for future warranty obligations will depend in large part on how reliable a turbine is perceived to be, which in turn will reflect USD/EUR exchange rate. In other words, we convert all years from EUR to USD using a single exchange rate, and as such we do not capture the impact of movements in the exchange rate over time on labor costs. This is by design, since exchange rate impacts are calculated separately later, in Section 3.7. Finally, we use MW delivered rather than MW produced and shipped for two reasons: (1) most importantly, Vestas did not publish data on MW produced and shipped prior to 2005; and (2) as described in the text box on page 10, Vestas has recently shifted its accounting to focus more on deliveries than shipments. That said, we do acknowledge that “MW produced and shipped” is likely a more appropriate denominator than “MW delivered” for measuring per-unit labor costs, given that the production and shipment of turbines is more closely linked (temporally) with the utilization of Vestas labor (i.e., particularly for supply-only contracts, presumably relatively little Vestas labor is utilized once a turbine has shipped, yet the interim between shipment and delivery could be fairly lengthy, due to shipping time and construction delays).
0
50
100
150
200
250
300
2001
2002
2003
2004
2005
2006
2007
2008
2009
2010
2010
$/k
W
Vestas Staff Costs
Cumulative Change
9
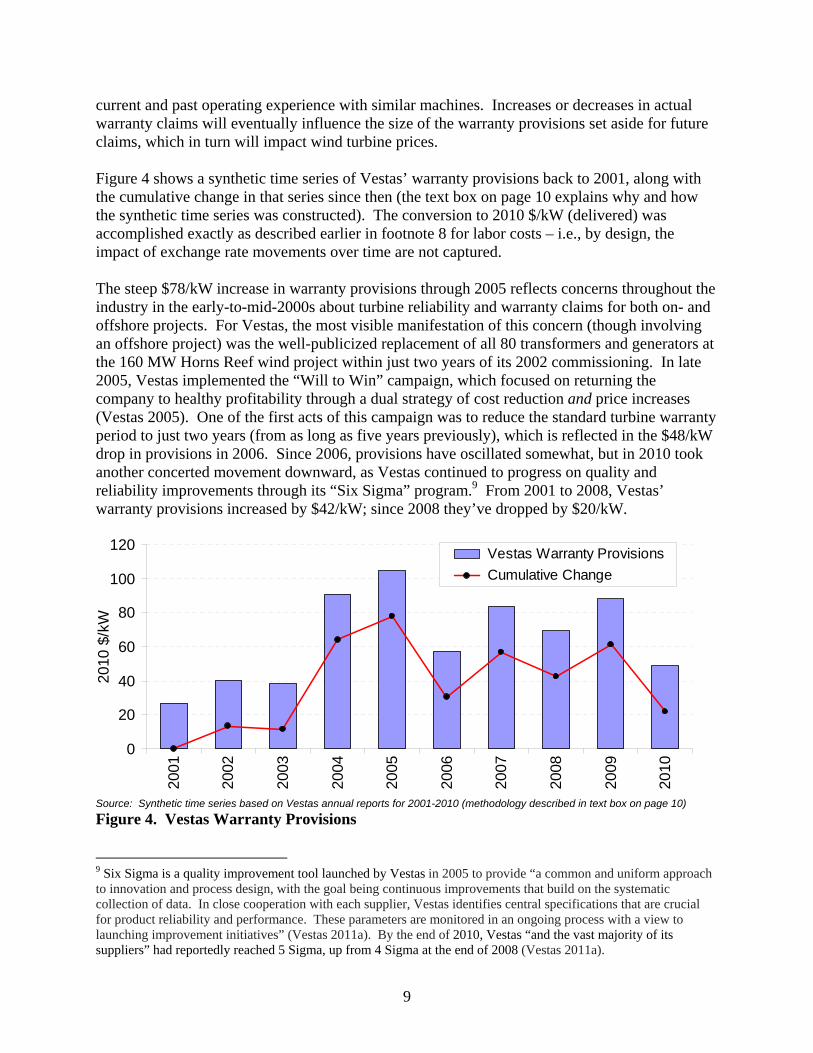
current and past operating experience with similar machines. Increases or decreases in actual warranty claims will eventually influence the size of the warranty provisions set aside for future claims, which in turn will impact wind turbine prices. Figure 4 shows a synthetic time series of Vestas’ warranty provisions back to 2001, along with the cumulative change in that series since then (the text box on page 10 explains why and how the synthetic time series was constructed). The conversion to 2010 $/kW (delivered) was accomplished exactly as described earlier in footnote 8 for labor costs – i.e., by design, the impact of exchange rate movements over time are not captured. The steep $78/kW increase in warranty provisions through 2005 reflects concerns throughout the industry in the early-to-mid-2000s about turbine reliability and warranty claims for both on- and offshore projects. For Vestas, the most visible manifestation of this concern (though involving an offshore project) was the well-publicized replacement of all 80 transformers and generators at the 160 MW Horns Reef wind project within just two years of its 2002 commissioning. In late 2005, Vestas implemented the “Will to Win” campaign, which focused on returning the company to healthy profitability through a dual strategy of cost reduction and price increases (Vestas 2005). One of the first acts of this campaign was to reduce the standard turbine warranty period to just two years (from as long as five years previously), which is reflected in the $48/kW drop in provisions in 2006. Since 2006, provisions have oscillated somewhat, but in 2010 took another concerted movement downward, as Vestas continued to progress on quality and reliability improvements through its “Six Sigma” program.9 From 2001 to 2008, Vestas’ warranty provisions increased by $42/kW; since 2008 they’ve dropped by $20/kW.
Source: Synthetic time series based on Vestas annual reports for 2001-2010 (methodology described in text box on page 10)
Figure 4. Vestas Warranty Provisions 9 Six Sigma is a quality improvement tool launched by Vestas in 2005 to provide “a common and uniform approach to innovation and process design, with the goal being continuous improvements that build on the systematic collection of data. In close cooperation with each supplier, Vestas identifies central specifications that are crucial for product reliability and performance. These parameters are monitored in an ongoing process with a view to launching improvement initiatives” (Vestas 2011a). By the end of 2010, Vestas “and the vast majority of its suppliers” had reportedly reached 5 Sigma, up from 4 Sigma at the end of 2008 (Vestas 2011a).
0
20
40
60
80
100
120
2001
2002
2003
2004
2005
2006
2007
2008
2009
2010
2010
$/k
W
Vestas Warranty Provisions
Cumulative Change
10
Though not shown in Figure 4, Gamesa’s annual financial reports show a similar increase in warranty provisions (though for the entire company – not just Gamesa’s wind division) since 2001: a $32/kW increase through 2008, followed by a $9/kW decline since then. In addition, the unexpected increase in warranty expenditures in the mid-2000s, and the resultant increase in warranty provisions (at least through 2007), is further confirmed industry-wide by Efiong and Crispin (2007), who report warranty expenditures increasing from 3.5% of sales in 2004 to 4.75% in 2007.
3.3 Turbine Manufacturer Profitability Wind turbine manufacturers must be profitable to remain in business. In the face of rising costs, profitability can only be maintained by raising turbine prices commensurately – these cost-related price increases are quantified in other sections of this report that focus on labor, warranty, raw materials, and energy costs (and, more subtly, foreign exchange rate movements). In contrast, this section focuses on changes in profitability itself (i.e., independent of costs). For example, the “seller’s market” for wind turbines that developed starting in 2005 provided an opportunity for wind turbine manufacturers to increase their profitability by raising prices above
Accounting Changes at Vestas With its 2010 annual report, Vestas implemented a significant accounting change that impacts how revenues (which are closely linked to earnings and profitability, analyzed in Section 3.3) and warranty provisions (analyzed in Section 3.2) are accounted for. A review of these changes is warranted. Revenues: Vestas previously accounted for revenue from its “supply and installation” contracts (which comprised 40% of new global orders in 2010) on a “percentage of completion” basis, which meant that significant revenue was realized at the time a turbine order shipped (i.e., a significant portion of Vestas’ obligation under such contracts was fulfilled at the time of shipment). Under the new accounting procedures, revenue from such contracts is realized only upon delivery of the project to the customer (i.e., upon the transfer of risk and benefits to the customer). This change has the impact of deferring revenue until a later date. Revenue recognition from “supply-only” and “EPC/Turnkey” contracts has not changed: the former has always occurred at the time of delivery, while the latter will continue to occur on a “percentage of completion” basis. Warranty Provisions: In addition to offering standard warranties for its turbines, Vestas has also in recent years marketed long-term service contracts that cover routine maintenance and expected repairs over terms as long as 10 years. Although these service contracts include warranty-like obligations, Vestas previously accounted for such obligations in real time – i.e., in the year in which they actually became expenses. With the accounting change, Vestas now accounts for expected future repairs under service contracts by setting aside warranty provisions up front, in the year in which the service contract is signed. For example, if Vestas expects to replace a gearbox in year 7 of a 10-year service contract, previously the cost of that gearbox replacement would have been realized in year 7 (i.e., when it actually occurred), whereas now Vestas sets aside sufficient provisions in year 1 to pay for the expected eventual replacement. This change also has the effect of boosting future profitability at the expense of current profitability. With these accounting changes, Vestas re-stated its income statement going back only five years (to 2006). Our analysis of warranty provisions and profit margins (labor costs were not affected by these accounting changes), however, extends further back in time – i.e., ideally back to 2001. To solve this mis-match, an indexing approach was used to create a synthetic time series that reflects the accounting change from 2006-2010 yet also provides the history we need over the entire period. The index starts with the old (pre-restatement) numbers from 2001 through 2006; in 2007 and all later years, that year’s annual change in the new (restated) numbers is added to the previous year’s index value to continue the time series. The result is a “synthetic” time series that, necessarily, will not exactly match Vestas’ most-recent annual report, but that nonetheless effectively captures temporal trends in both warranty provisions and manufacturer profitability.
11
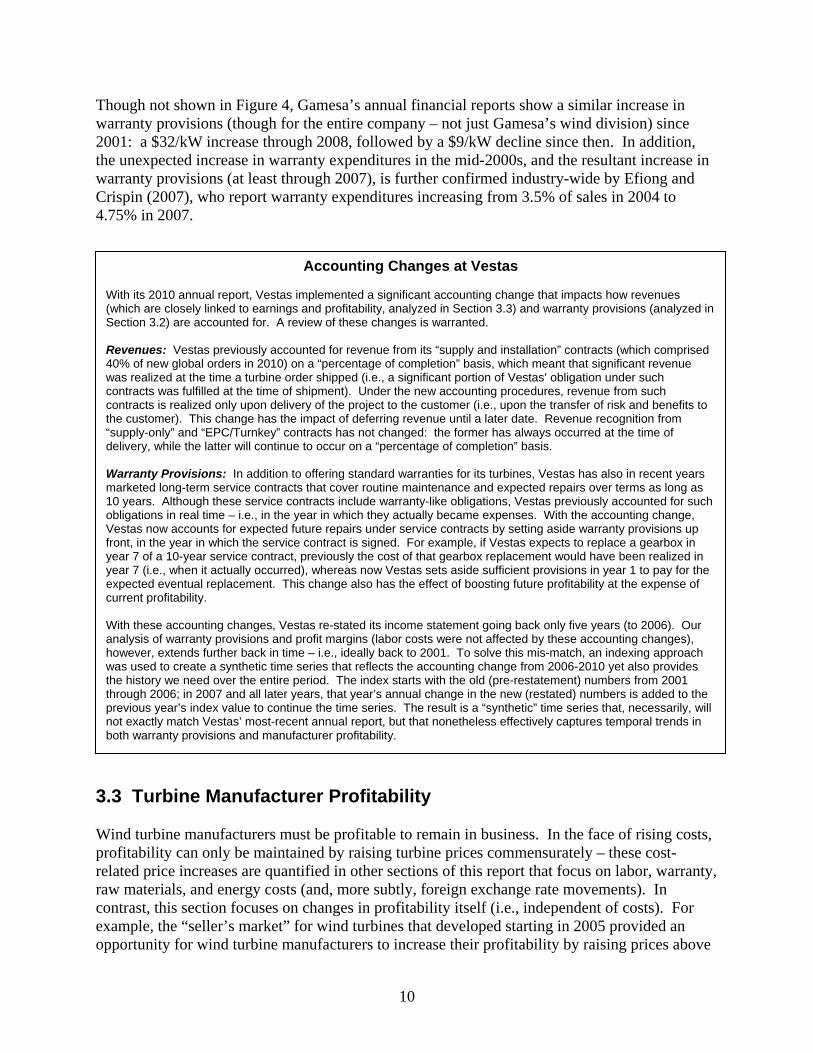
and beyond the amount required to cover rising costs. Conversely, the dwindling number of and intense competition for new orders since the global financial crisis of 2008/2009 has led to price reductions, partially achieved through lower profit margins. This section estimates changes in wind turbine prices attributable to changes in turbine manufacturer profitability. Figure 5 shows a synthetic time series of Vestas’ operating profit (i.e., earnings before interest and taxes, or “EBIT”) back to 2001, along with the cumulative change in that series since then (the text box on page 10 explains why and how the synthetic time series was constructed). The conversion to 2010 $/kW (delivered) was accomplished as described earlier in footnote 8 for labor costs – i.e., by design, exchange rate movements over time are not captured, since they are analyzed separately in Section 3.7. After its per-kW profit margin steadily declined from 2001 through 2005, Vestas’ “Will to Win” campaign, launched in late 2005, focused on returning the company to healthy profitability through a strategy of cost reduction and price increases (Vestas 2005). Perhaps as a result, Vestas’ profits rose sharply in 2006, and then again in 2008, before falling in the wake of the global financial crisis and resulting softness in turbine sales. In aggregate since 2001, Vestas’ operating profit rose $59/kW through 2008, and then fell by $78/kW through 2010. The overall average increase in turbine manufacturer profitability from the widely-understood-to-be depressed levels of the early 2000s (Milborrow 2008) until 2008 is confirmed industry-wide by Efiong and Crispin (2007), who show EBIT margins of -8% in 2004 increasing to 2% in 2005 and then to 6-7% in 2006-2007; Bloomberg NEF (2009), meanwhile, reports lower profit margins after the financial crisis at the end of 2008.
Source: Synthetic time series based on Vestas annual reports for 2001-2010 (methodology described in text box on page 10)
Figure 5. Vestas Profitability Of course, no wind turbine manufacturer is 100% vertically integrated; all manufacturers buy varying amounts of parts and components from specialized suppliers. As such, it is not just the profitability of Vestas (or any other wind turbine manufacturer) that influences wind turbine prices; the profitability (and labor costs, discussed earlier) of turbine component suppliers will also have an impact. Quantifying component supplier profitability (and labor costs) is
-150
-100
-50
0
50
100
150
2001
2002
2003
2004
2005
2006
2007
2008
2009
2010
2010
$/k
W
Vestas Operating Profit (EBIT)
Cumulative Change
12
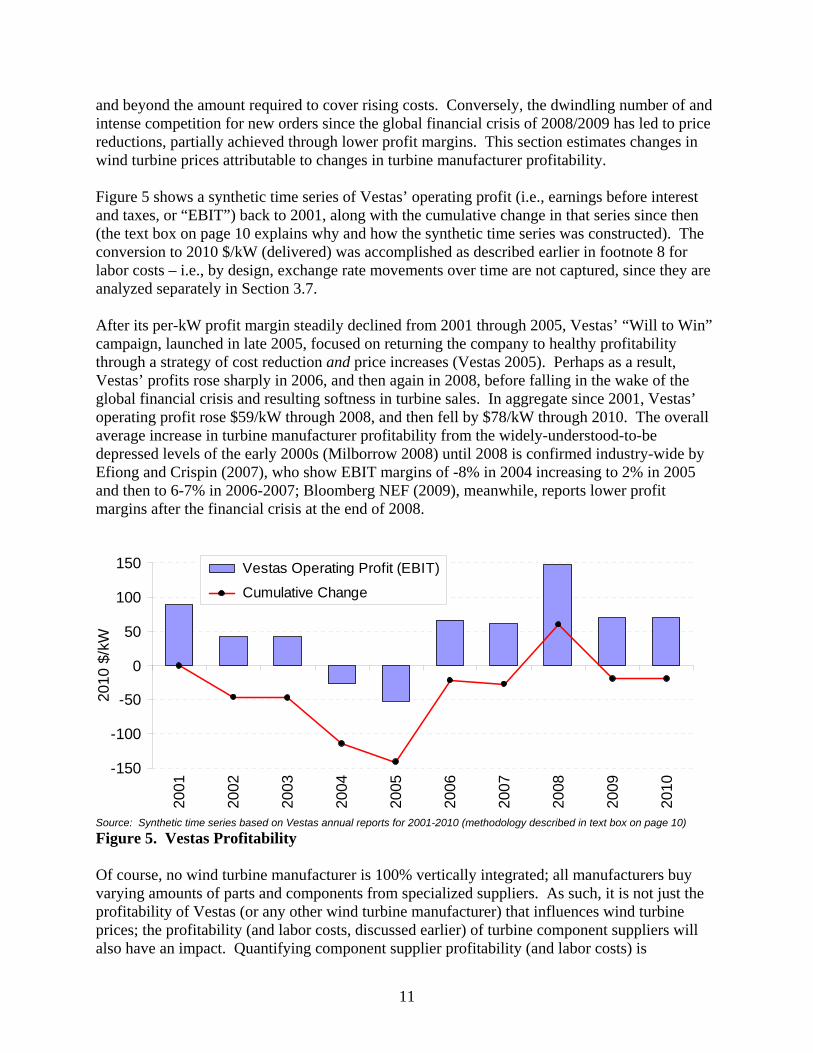
challenging, however, because many component suppliers are not publicly traded (which limits the type of financial information they are required to disclose), and those that are often manufacture many other goods besides wind turbine parts (making it difficult to isolate wind-related impacts). Even if a representative data sample were available, it is not clear how one would go about quantifying impacts on a $/kW basis.10 For these reasons, our analysis does not include the impact of component supplier profitability (and labor costs), while acknowledging that such impacts do exist and have likely exacerbated the trends presented above for Vestas. Bloomberg NEF (2009), for example, reports that in the wake of the financial crisis, that both turbine and component manufacturers have experienced lower EBIT margins. 3.4 Increasing Turbine Size and Energy Capture The average nameplate capacity of wind turbines installed in the U.S. doubled over the period of interest, from just under 0.9 MW in 2001/2002 to nearly 1.8 MW in 2010 (Figure 6). Along with this doubling in capacity, the average turbine hub height and rotor diameter also increased: hub height by one-third (from just under 60 meters to 80 meters) and rotor diameter by nearly two-thirds (from just over 50 meters to nearly 85 meters). Because mass scales more rapidly than height or length – e.g., taller towers are not only taller, but also need to be wider and thicker (and therefore heavier) to support the extra height – the rapid growth in turbine size has also impacted wind turbine prices on a $/kW basis. The fact that the capital cost of turbines can increase with size is widely understood (e.g., Dinica 2011, EWEA 2009), but the advantages in terms of lower balance of plant costs and higher levels of energy production typically outweigh those turbine price increases.
Source: Berkeley Lab Database
Figure 6. Average Turbine Capacity, Hub Height, and Rotor Diameter
10 For example, knowing the number and length of blades delivered by a blade manufacturer does not automatically dictate how much nameplate capacity those blades support, since some could be installed on 1.8 MW turbines, others on 2.0 MW turbines, and still others on 3.0 MW turbines (e.g., Vestas offers V90 turbines – i.e., turbines with a 90 meter rotor diameter – rated at all three of these nameplate capacities).
0.0
0.2
0.4
0.6
0.8
1.0
1.2
1.4
1.6
1.8
2001 2002 2003 2004 2005 2006 2007 2008 2009 2010
1,895 467 1,219 351 1,591 1,515 3,190 5,004 5,733 2,855
1,690 MW 412 MW 1,668 MW 409 MW 2,370 MW 2,440 MW 5,249 MW 8,348 MW 9,993 MW 5,113 MW
Nam
epla
te C
apac
ity (
MW
)
0
10
20
30
40
50
60
70
80
90
Hub
Hei
ght
and
Rot
or D
iam
eter
(M
eter
s)
Average Turbine Capacity (left scale)
Average Hub Height (right scale)
Average Rotor Diameter (right scale)
COD:
Turbines:
Capacity:
13
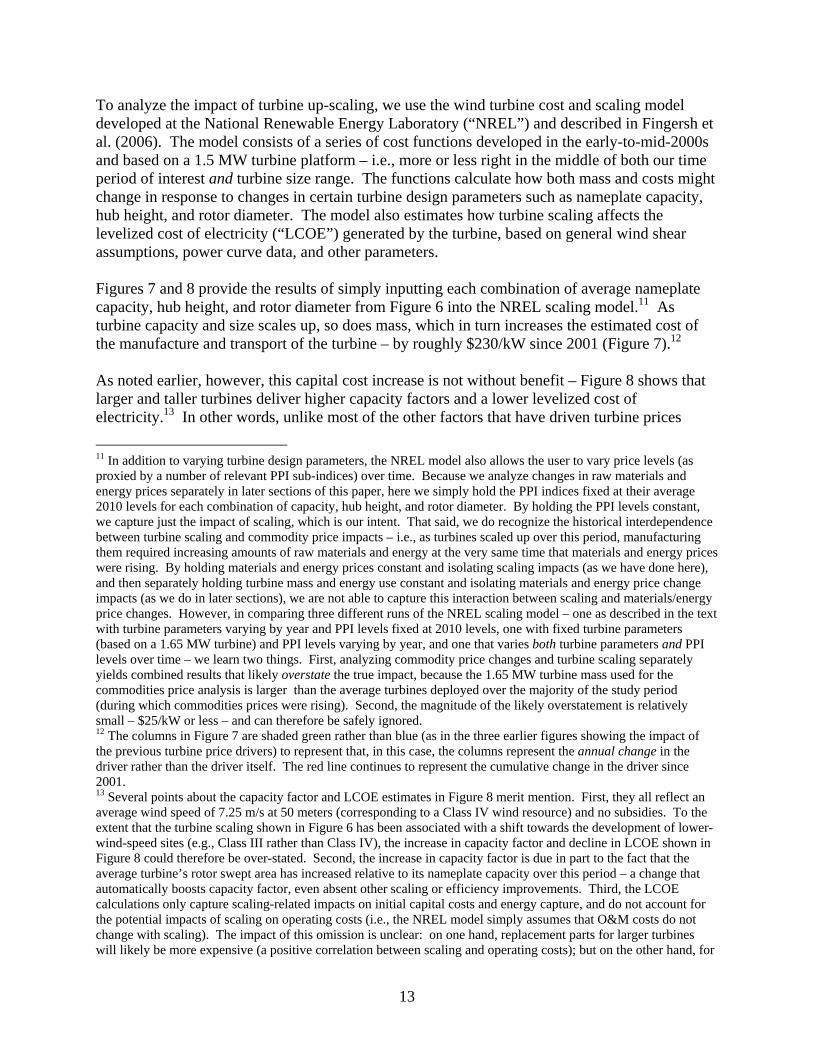
To analyze the impact of turbine up-scaling, we use the wind turbine cost and scaling model developed at the National Renewable Energy Laboratory (“NREL”) and described in Fingersh et al. (2006). The model consists of a series of cost functions developed in the early-to-mid-2000s and based on a 1.5 MW turbine platform – i.e., more or less right in the middle of both our time period of interest and turbine size range. The functions calculate how both mass and costs might change in response to changes in certain turbine design parameters such as nameplate capacity, hub height, and rotor diameter. The model also estimates how turbine scaling affects the levelized cost of electricity (“LCOE”) generated by the turbine, based on general wind shear assumptions, power curve data, and other parameters. Figures 7 and 8 provide the results of simply inputting each combination of average nameplate capacity, hub height, and rotor diameter from Figure 6 into the NREL scaling model.11 As turbine capacity and size scales up, so does mass, which in turn increases the estimated cost of the manufacture and transport of the turbine – by roughly $230/kW since 2001 (Figure 7).12 As noted earlier, however, this capital cost increase is not without benefit – Figure 8 shows that larger and taller turbines deliver higher capacity factors and a lower levelized cost of electricity.13 In other words, unlike most of the other factors that have driven turbine prices
11 In addition to varying turbine design parameters, the NREL model also allows the user to vary price levels (as proxied by a number of relevant PPI sub-indices) over time. Because we analyze changes in raw materials and energy prices separately in later sections of this paper, here we simply hold the PPI indices fixed at their average 2010 levels for each combination of capacity, hub height, and rotor diameter. By holding the PPI levels constant, we capture just the impact of scaling, which is our intent. That said, we do recognize the historical interdependence between turbine scaling and commodity price impacts – i.e., as turbines scaled up over this period, manufacturing them required increasing amounts of raw materials and energy at the very same time that materials and energy prices were rising. By holding materials and energy prices constant and isolating scaling impacts (as we have done here), and then separately holding turbine mass and energy use constant and isolating materials and energy price change impacts (as we do in later sections), we are not able to capture this interaction between scaling and materials/energy price changes. However, in comparing three different runs of the NREL scaling model – one as described in the text with turbine parameters varying by year and PPI levels fixed at 2010 levels, one with fixed turbine parameters (based on a 1.65 MW turbine) and PPI levels varying by year, and one that varies both turbine parameters and PPI levels over time – we learn two things. First, analyzing commodity price changes and turbine scaling separately yields combined results that likely overstate the true impact, because the 1.65 MW turbine mass used for the commodities price analysis is larger than the average turbines deployed over the majority of the study period (during which commodities prices were rising). Second, the magnitude of the likely overstatement is relatively small – $25/kW or less – and can therefore be safely ignored. 12 The columns in Figure 7 are shaded green rather than blue (as in the three earlier figures showing the impact of the previous turbine price drivers) to represent that, in this case, the columns represent the annual change in the driver rather than the driver itself. The red line continues to represent the cumulative change in the driver since 2001. 13 Several points about the capacity factor and LCOE estimates in Figure 8 merit mention. First, they all reflect an average wind speed of 7.25 m/s at 50 meters (corresponding to a Class IV wind resource) and no subsidies. To the extent that the turbine scaling shown in Figure 6 has been associated with a shift towards the development of lower-wind-speed sites (e.g., Class III rather than Class IV), the increase in capacity factor and decline in LCOE shown in Figure 8 could therefore be over-stated. Second, the increase in capacity factor is due in part to the fact that the average turbine’s rotor swept area has increased relative to its nameplate capacity over this period – a change that automatically boosts capacity factor, even absent other scaling or efficiency improvements. Third, the LCOE calculations only capture scaling-related impacts on initial capital costs and energy capture, and do not account for the potential impacts of scaling on operating costs (i.e., the NREL model simply assumes that O&M costs do not change with scaling). The impact of this omission is unclear: on one hand, replacement parts for larger turbines will likely be more expensive (a positive correlation between scaling and operating costs); but on the other hand, for

14
higher over the period of interest, turbine up-scaling is the result of a conscious decision to design larger and more powerful turbines that can capture more of the wind’s energy and convert it to electricity at lower costs. In this case, the benefit (lower LCOE) outweighs the incremental cost (higher $/kW turbine price) of scaling.
Figure 7. Impact of Scaling on Turbine Costs (Annual and Cumulative)
Figure 8. Results from NREL Turbine Scaling Model: Capacity Factor and LCOE This analysis suggests that turbine scaling has increased turbine pricing over the 2002 through 2010 period, but with the benefit of increased energy capture and lower LCOE. Two caveats, however, suggest that turbine design parameters are not fully captured in the analysis presented here. First, the NREL cost model relies on standard relationships between component size,
a given amount of capacity there will be fewer parts to replace, fewer turbines to climb, etc. (a negative correlation between turbine scaling and operating costs).
($50)
$0
$50
$100
$150
$200
$2502
00
1
20
02
20
03
20
04
20
05
20
06
20
07
20
08
20
09
20
10
20
10
$/k
W
Annual Change in Turbine Cost Due to Scaling
Cumulative Change
0%
5%
10%
15%
20%
25%
30%
35%
40%
2001 2002 2003 2004 2005 2006 2007 2008 2009 2010
0.89 MW 0.88 MW 1.37 MW 1.17 MW 1.49 MW 1.61 MW 1.65 MW 1.67 MW 1.74 MW 1.79 MW
58.2 m 62.7 m 67.6 m 65.3 m 75.3 m 76.1 m 78.2 m 78.5 m 78.9 m 79.8 m
53.1 m 52.7 m 68.2 m 63.2 m 74.8 m 77.8 m 79.0 m 79.3 m 81.6 m 84.3 m
Ca
pa
city
Fa
cto
r
0
10
20
30
40
50
60
70
80
LC
OE
(2
01
0 $
/MW
h)
Capacity Factor (left scale)
Levelized Cost of Energy (right scale)
COD:
Capacity:
HH:
RD:
15
weight, and other design parameters; to the extent that design innovation has fallen outside the bounds of these standard relationships, actual scaling-related cost influences may have differed from what is presented above. Second, the analysis above was focused exclusively on turbine scaling, but turbines today also have features and capabilities that exceed those that were available in the early 2000s (e.g., sophisticated control systems, grid-friendly features, etc.). These additional design and engineering improvements – many of which were likely implemented to boost reliability in the face of the rising warranty claims/provisions shown earlier in Section 3.2 – impose an additional cost (and benefit) that is not captured by our focus on scaling alone.
3.5 Raw Materials Prices In addition to the four somewhat-endogenous influences on wind turbine prices explored in the previous sections, there are also three exogenous influences that, although they can be managed to an extent, are nevertheless largely out of the direct control of the wind power industry. These include changes in raw materials prices, energy prices, and foreign exchange rates – each of which will be analyzed in turn in the next three sections (3.5-3.7). Wind turbines are material-intensive. Each individual tower, perhaps extending eighty meters or higher, may require several hundred metric tonnes of steel. Significant amounts of fiberglass and resin are required for the blades and nacelle. Iron, copper, and aluminum are also commonly used for various elements of the drive train and generator. Sustained movements in the price of any of these raw materials could explain part of the increase and subsequent decrease in turbine prices over the past decade, just as similar trends impact the cost of other forms of power generation equipment (e.g., Chupka and Basheda 2007). Using somewhat different approaches and data sources, previous efforts to estimate these impacts on wind energy include Greenacre et al. (2010) and Milborrow (2008). Table 1 provides a breakdown, by mass and percentage of total mass, of the five major materials used to manufacture four different wind turbine models – three from Vestas and one from Gamesa – which span a significant range of nameplate capacity (from 1.65 MW to 3.0 MW), rotor diameter (from 80 to 112 meters), and tower height (from 67 to 84 meters). The data are compiled from life-cycle analyses (“LCAs”) of wind power projects using these four turbine types. Although these LCAs often provide more detail than reported here, Table 1 consolidates closely related materials (e.g., different types of steel) into single categories where logical, while ignoring other minor (at least in terms of mass) materials whose costs are difficult to track (e.g., electronics). In all cases, materials used in the foundations of these turbines (e.g., steel rebar and concrete) are excluded from Table 1, since the empirical turbine prices shown earlier in Figure 2 are generally assumed to not include foundation costs, which, again, most often fall under BOP or EPC contracts and are not covered in the present study.

16
Table 1. Condensed Bill of Materials for Four Different Turbines Turbine make/model: Vestas V82 Gamesa G8X Vestas V80 Vestas V112 Nameplate capacity: 1.65 MW 2.0 MW 2.0 MW 3.0 MW
Tower height: 78 meters 67 meters 78 meters 84 meters Rotor diameter: 82 meters 80 meters 80 meters 112 meters
Mass (kg per kW)Steel 96.3 82.3 104.7 81.7
Fiberglass/Resin/Plastic 18.2 11.1 12.3 16.3 Iron/Cast Iron 17.8 16.3 10.3 21.9
Copper 1.8 1.8 1.4 1.6 Aluminum 1.9 0.0 0.8 1.1
Total 135.9 111.4 129.6 122.7
% of Total Turbine MassSteel 70% 74% 81% 66%
Fiberglass/Resin/Plastic 13% 10% 9% 13% Iron/Cast Iron 13% 15% 8% 18%
Copper 1% 2% 1% 1% Aluminum 1% 0% 1% 1%
Total 98.3% 100.0% 99.9% 99.0% Source: Vestas 2006b, Martínez et al. 2009, Elsam 2004, D’Souza et al. 2011
The bottom of Table 1, which presents the mass of each of the five materials categories expressed as a percentage of total turbine mass, reveals two important findings that enable us to simplify the present analysis. First, the fact that these five materials account for more than 98% of the total mass of each of these four turbines suggests that focusing the analysis on just these five materials, rather than on the more-detailed breakdown of materials that can be found in some LCAs, is sufficient.14 Second, the fact that the distribution of mass among these five materials is relatively consistent across the four different turbine models suggests that the analysis will yield similar results regardless of which turbine is analyzed. As a result, for reasons explained in the text box on page 17, the analysis of raw materials (and later energy) prices focuses exclusively on the Vestas V82 1.65 MW turbine (i.e., the first data column of Table 1). Figure 9 shows the cumulative percentage change in prices (in real 2010 dollar terms) since December 2001 for each of the five materials listed in Table 1 (details on how the individual time series price data for each material were sourced and constructed can be found in Appendix A). With the exception of fiberglass/resin, the prices for all other materials shown in Figure 9 have escalated at rates faster than the general rate of inflation over this period. Specifically, the four metals experienced massive price increases that uniformly peaked in mid-2008, before plunging sharply through the end of that year as a result of the global financial crisis. Notably, metals prices have since moved higher once again.
14 The handful of raw materials broken out in some LCAs but not listed in Table 1, and that will be excluded from the analysis on the basis of contributing very little mass, do not account for a disproportionate amount of overall turbine costs. Although the value-added from manufacturing these materials into turbine components may result in relatively expensive components (e.g., electronics), the underlying materials themselves are all relatively common and not disproportionately expensive, which suggests that the present analysis of raw materials prices will not be overly biased by excluding them.

17
Figure 9. Cumulative Price Change in Raw Materials Since December 2001
Choice of Vestas V82 1.65 MW LCA As shown earlier in Figure 6, the average turbine size installed in the U.S. increased from roughly 0.9 MW in 2001 to 1.8 MW in 2010. This average turbine size range suggests that the Vestas V82, rated at 1.65 MW, is a more appropriate choice for analysis than any of the other three turbines featured in Table 1, each of which are larger 2 or 3 MW turbines. Because it falls within the average size range of turbines installed during this period, the 1.65 MW turbine minimizes distortions that could originate from analyzing the impact of commodity price changes independently from the impact of turbine scaling (when in reality, the two are somewhat interdependent – this issue is described more fully in footnote 11). The choice of the Vestas 1.65 MW turbine is bolstered by further analysis of the data behind the average turbine sizes reported in Figure 6. These data reveal that Vestas installed 1,780 turbines rated at 1.65 MW in the U.S. between 1999 and 2010, while NEG Micon – which later merged with Vestas – installed another 60 such turbines in 2003 and 2004. In other words, not only does the 1.65 MW turbine more closely match the average turbine size over the period of interest, but Vestas has also installed a substantial number of 1.65 MW turbines in the U.S. (more than it has any other size turbine), distributed over the entire period of interest. In contrast, through the end of 2010, Vestas had installed only twenty-two 2 MW turbine in the U.S. (all in 2009), and 323 turbines rated at 3 MW (the bulk of which were installed after 2007, and all of which are the V90 model, rather than the V112 shown in Table 1). Meanwhile, nearly 1,200 Gamesa 2 MW turbines have been installed in the U.S. through 2010, but only since 2005 (i.e., part way into the analysis period of 2002-2010). Apart from size and distribution considerations, there is another reason to favor the Vestas 1.65 MW turbine for this analysis. The Vestas 1.65 MW LCA provides one of the most useful breakdowns of energy consumption during the manufacturing and transport phases. Most other LCAs aggregate energy consumption across different life-cycle phases (e.g., manufacture, transport, operation, disposal) in such a way that it is difficult or impossible to focus on just the manufacturing and transport phases – i.e., the two phases that impact turbine prices. The cost of energy consumption is analyzed separately in Section 3.6. Based on these considerations, the analysis of raw materials (and later energy) prices focuses exclusively on the Vestas V82 1.65 MW turbine. Once again, though, the distributional uniformity across turbines in Table 1 indicates that results would not vary significantly if any of the other three turbines were instead chosen.
-50%
0%
50%
100%
150%
200%
250%
300%
350%
400%
450%
2002 2003 2004 2005 2006 2007 2008 2009 2010 2011
Steel (70% of mass)
Iron (13% of mass)
Fiberglass (13% of mass)
Copper (1% of mass)
Aluminum (1% of mass)
Rea
l Pric
e C
hang
e in
Mat
eria
ls
18
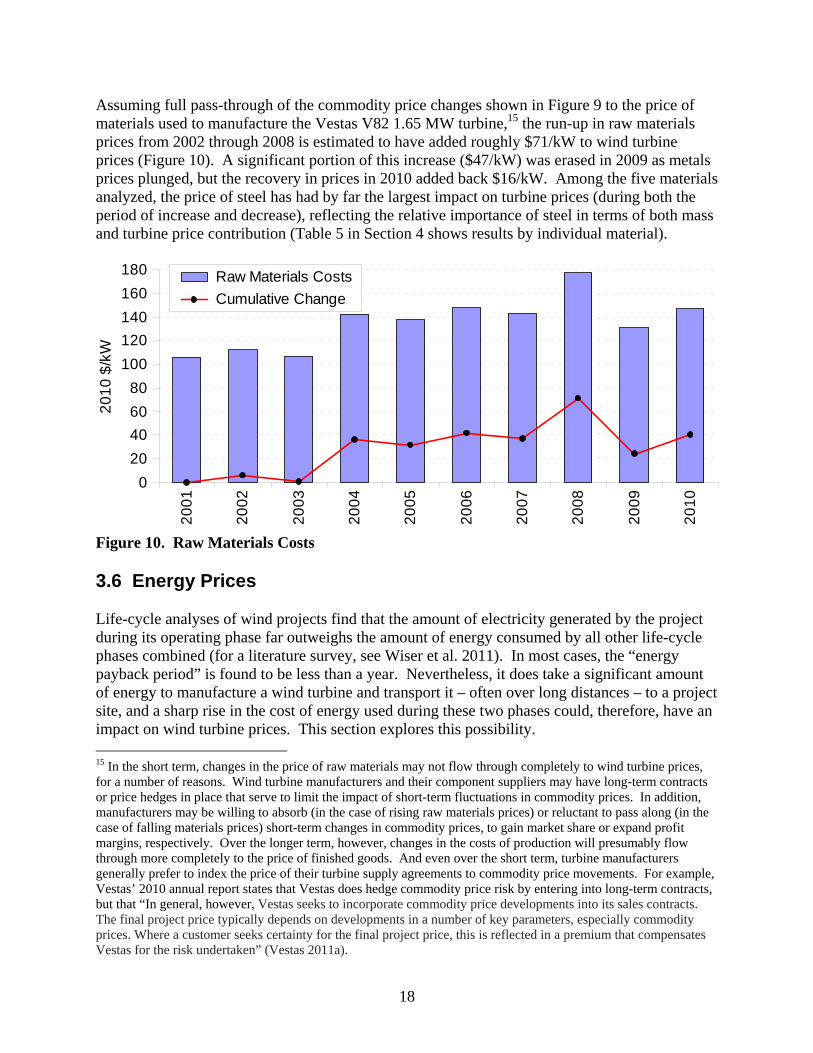
Assuming full pass-through of the commodity price changes shown in Figure 9 to the price of materials used to manufacture the Vestas V82 1.65 MW turbine,15 the run-up in raw materials prices from 2002 through 2008 is estimated to have added roughly $71/kW to wind turbine prices (Figure 10). A significant portion of this increase ($47/kW) was erased in 2009 as metals prices plunged, but the recovery in prices in 2010 added back $16/kW. Among the five materials analyzed, the price of steel has had by far the largest impact on turbine prices (during both the period of increase and decrease), reflecting the relative importance of steel in terms of both mass and turbine price contribution (Table 5 in Section 4 shows results by individual material).
Figure 10. Raw Materials Costs 3.6 Energy Prices Life-cycle analyses of wind projects find that the amount of electricity generated by the project during its operating phase far outweighs the amount of energy consumed by all other life-cycle phases combined (for a literature survey, see Wiser et al. 2011). In most cases, the “energy payback period” is found to be less than a year. Nevertheless, it does take a significant amount of energy to manufacture a wind turbine and transport it – often over long distances – to a project site, and a sharp rise in the cost of energy used during these two phases could, therefore, have an impact on wind turbine prices. This section explores this possibility. 15 In the short term, changes in the price of raw materials may not flow through completely to wind turbine prices, for a number of reasons. Wind turbine manufacturers and their component suppliers may have long-term contracts or price hedges in place that serve to limit the impact of short-term fluctuations in commodity prices. In addition, manufacturers may be willing to absorb (in the case of rising raw materials prices) or reluctant to pass along (in the case of falling materials prices) short-term changes in commodity prices, to gain market share or expand profit margins, respectively. Over the longer term, however, changes in the costs of production will presumably flow through more completely to the price of finished goods. And even over the short term, turbine manufacturers generally prefer to index the price of their turbine supply agreements to commodity price movements. For example, Vestas’ 2010 annual report states that Vestas does hedge commodity price risk by entering into long-term contracts, but that “In general, however, Vestas seeks to incorporate commodity price developments into its sales contracts. The final project price typically depends on developments in a number of key parameters, especially commodity prices. Where a customer seeks certainty for the final project price, this is reflected in a premium that compensates Vestas for the risk undertaken” (Vestas 2011a).
0
20
40
60
80
100
120
140
160
180
20
01
20
02
20
03
20
04
20
05
20
06
20
07
20
08
20
09
20
10
20
10
$/k
W
Raw Materials Costs
Cumulative Change

19
As it was in the previous section, Vestas’ LCA of its V82 1.65 MW turbine (Vestas 2006b) is also the principal source used here for the amount of energy consumed during the manufacture and transport of a wind turbine. Considerable effort was required, however, to overcome two limitations in what is presented in the LCA. First, assumptions were required to narrow the scope from the amount of energy consumed over all four life-cycle stages (manufacturing, transport, operation, and disposal) to just those two stages that impact turbine prices – i.e., manufacturing and transport.16 Second, external sources of data were needed to help strip out the energy “embodied” in the materials themselves, as the cost of this embodied energy is already reflected in the price of the raw materials – changes in which were analyzed separately in the previous section (Section 3.5). Table 7 of Vestas (2006b) shows the consumption of a variety of primary energy sources – including hard coal, lignite (soft coal), crude oil, natural gas, uranium, and a variety of renewable fuels (biomass, wind, hydro, solar, geothermal) – over the life of a V82 wind turbine, but does not break out energy consumption by life-cycle stage. Table 6 of Vestas (2006b) does provide such a breakout, but only for the fossil fuels (for reference, Tables 6 and 7 of Vestas (2006b) are reproduced here in Appendix B). If one assumes, however, that all of the nuclear and renewable fuels listed in Table 7 (of Vestas 2006b) are consumed during the manufacturing stage,17 then one can use the numbers provided in that table for these resources, while using fossil fuel consumption from just the “Production” and “Transport” columns of Table 6 (of Vestas 2006b). Adding all of these together suggests that the amount of primary energy consumed during just the manufacturing and transport stages of the turbine’s life cycle comes to 9.36 GJ/kW in total (Table 2).18
16 Even after these adjustments are made, the resulting numbers will still not be entirely appropriate for our purposes, because the reported energy consumption data for the transport phase also includes turbine erection and interconnection – both of which are assumed to fall outside of the scope of most turbine supply agreements in the U.S. As such, the energy consumption data used in this section likely overstates the impact of energy price changes on wind turbine prices. 17 Presumably very little nuclear or renewable power is used during the transport and operations stages of the life cycle. Though some may be used during the disposal stage, it is perhaps just as likely – based on the fossil fuel numbers from Table 6 (of Vestas 2006b) – that nuclear and renewable resource consumption during the disposal stage is negative, reflecting a recovery of some of the energy used to manufacture the turbine originally due to materials recycling. On balance, therefore, the most logical course of action is to simply attribute all of the nuclear and renewable power to the production stage. Even if this attribution is not entirely correct, any error only affects 11% of total energy consumption, thereby minimizing its overall impact. 18 Although the boundaries of the various life-cycle stages can vary by LCA (e.g., some include turbine erection within the transport phase, while others do not), thereby limiting the usefulness of comparisons, several other Vestas LCAs reviewed for this study find similar energy consumption among the first two life-cycle phases (manufacture and transport). For example, the LCA of the Vestas V90 3.0 MW turbine (Vestas 2006a) found 9.44 GJ/kW, while the more recent LCA of the Vestas V112 3.0 MW (D’Souza et al. 2011) found 10.5 GJ/kW.

20
Table 2. Primary Energy Consumed by Production and Transport of Vestas 1.65 MW Turbine
GJ / kW % ContributionCrude oil* 2.635 28%Hard coal* 3.808 41%Lignite* 0.170 2%Natural gas* 1.750 19%Uranium 0.428 5%Biomass 0.201 2%Wind 0.008 0%Hydro 0.348 4%Solar 0.007 0%Geothermal 0.002 0%
Total 9.357 100%*Fossil fuels are a combination of “Production” and “Transport” columns from Table 6 of Vestas (2006b), converted to MJ/kWh using conversion factors in Table 7 of Vestas (2006b). All other fuels are pulled directly from Table 7 of Vestas (2006b).
One more transformation is then required for the present analysis. Like most life-cycle analyses, the Vestas V82 LCA tracks the amount of primary energy consumed by the turbine over its lifetime. Primary energy is the most basic and comprehensive expression of energy needs, and includes not only the energy consumed during the manufacturing process (for example), but also the energy embodied in the manufacturing inputs themselves (e.g., the energy required to convert iron ore into usable steel). Although this focus on primary energy is appropriate for calculating the turbine’s lifetime energy payback (i.e., one of the goals of most LCAs), it is problematic for the present purposes, in that the materials prices analyzed in the previous section already include the cost of the embodied energy used to produce them. To avoid double-counting, embodied energy must therefore be removed from total primary energy consumption. Table 3. Primary Energy Embodied in Materials Used to Build a Wind Turbine
Vestas 1.65 MW
Primary Energy Consumption
kg/kW MJ/kg GJ/kW Steel* 112.7 25.65** 2.890 Concrete 487.9 3.68 1.795 Fiberglass/Resin 18.2 45.7*** 0.831 Iron/Cast Iron 17.8 36.3 0.645 Copper 1.8 78.2 0.137 Aluminum 1.9 39.15** 0.074
Total 640.1 6.372 *Includes steel used in turbine foundation; hence, this mass does not match that shown earlier in Table 1, which excluded foundations. **The primary energy content of steel and aluminum represent the average of the minimum and maximum values provided by Schleisner (2000). *** Schleisner (2000) does not include fiberglass, so the energy content provided for “Plastic (polyester and epoxy)” is used instead.
Table 1 of Schleisner (2000) provides an estimate of the amount of primary energy required to produce, transport, and manufacture a single kilogram of a variety of materials, including most of the materials used to build a wind turbine. Specifically, all materials listed in Table 1 of the previous section – with the exception of fiberglass/resin, for which “plastic (polyester and epoxy)” is substituted – are included in Schleisner (2000). Multiplying the mass of the five materials listed in Table 1 of the previous section – plus concrete19 – by the primary embodied
19 Because the wind turbine prices shown in Figure 2 earlier are generally assumed to not include the cost of foundations, concrete was excluded when analyzing raw materials costs in the previous section. LCA data on energy consumption during the transport phase, however, includes the energy required to construct a foundation, as
21
energy content from Schleisner (2000) yields the values shown above in Table 3. In total, the materials used to produce a wind turbine are thereby estimated to contain roughly 6.372 GJ/kW of embodied energy, with steel and concrete together containing nearly 75% of the total. Subtracting the amount of primary energy embodied in wind turbine materials (6.37 GJ/kW) from the total amount of primary energy consumed during the manufacturing and transport phases (9.36 GJ/kW) leaves just the amount of energy required to manufacture and transport the turbine itself: 2.99 GJ/kW. In other words, the energy consumption that is of relevance to this study is about one-third of the total primary energy required to manufacture and transport a wind turbine; the remainder is energy embodied in the materials themselves.20 Table 2 above lists the estimated percentage contribution of the various energy sources that, at least in the Vestas 1.65 MW LCA, supply the primary energy consumed by the manufacture, transport, and installation of a wind turbine. These proportions cannot be directly used in our analysis, however, because they include the energy embodied in materials. Assuming that a disproportionate amount of the embodied energy derived in Table 3 comes from coal (Schleisner 2000), we make a simplifying assumption that 60% of primary energy consumption (after subtracting out embodied energy) comes from the three fossil fuels (split evenly between them, and with oil taking the form of diesel fuel), with the remaining 40% coming from largely stable-priced energy sources (e.g., nuclear and renewables) – i.e., we assume that only 60% of energy consumption is subject to fuel price risk. Though approximate, these round proportions are broadly consistent with the Vestas 1.65 MW LCA (once coal-heavy embodied energy is stripped out), as well as the more-recent Vestas V112 LCA (D’Souza et al. 2011). Detailed “end-use” energy consumption data reported in the “Sustainability” section of Vestas’ web site also broadly support this apportionment. Figure 11 shows the cumulative percentage change in prices (in real 2010 dollar terms) since December 2001 for each of the three variable-priced energy sources (details on how the individual time series price data for each energy source were sourced and constructed can be
well as the energy embodied in the concrete and steel that comprise the foundation. As such, it is appropriate to include concrete when calculating embodied energy (for this same reason, the mass of steel shown in Table 3 is larger than that shown earlier in Table 1 – the difference is the rebar used in the foundation). 20 One can arrive at a similar estimate coming from a different direction through a back-of-the-envelope calculation pieced together from various sources. A figure on page 53 of Vestas (2010a) suggests that Vestas factories are responsible for 9% of total primary energy consumption during the life cycle of a Vestas wind turbine, with another 8% attributed to transport and installation and the remaining 83% attributed to raw materials and Vestas’ suppliers (unfortunately, this 83% is not broken down between raw materials and suppliers). In combination, Figures 5, 15, and 16 from D’Souza et al. (2011) suggest a similar, though slightly lower, share for Vestas factories – 7.4% of total primary energy consumption. Meanwhile, two different sources (Efiong and Crispin 2007, Aubrey 2007) suggest that Gamesa is roughly 50% vertically integrated – i.e., it makes roughly as many turbine components in-house as it outsources to its suppliers – and one of these sources ranks Vestas (7 out of 10) slightly lower than Gamesa (8 out of 10) on degree of vertical integration (Efiong and Crispin 2007). Thus, if we assume that Vestas factories account for 7.4% of total primary energy consumption (per D’Souza et al. 2011), that Vestas’ suppliers account for at least another 7.4% (based on the degree of vertical integration at Vestas being slightly less than Gamesa’s 50%, and assuming that the insourcing/outsourcing of turbine components correlates well with related energy consumption), and that transport accounts for an additional 6% (per D’Souza et al. 2011, and close to the 8% reported in Vestas 2010a), then the manufacturing and transport stages together are responsible for at least 21% of total primary energy consumption, or 2.32 GJ/kW based on energy consumption data reported in D’Souza et al. (2011). This outcome is similar in magnitude to the 2.99 GJ/kW arrived at in the text by subtracting embodied energy from LCA data.

22
found in Appendix A). All three fossil fuels have escalated at rates faster than the general rate of inflation over this period. Diesel fuel and natural gas prices experienced the largest increases through mid-2008, followed by a sharp reversal through early 2009 for diesel (but rising since then), and still continuing for natural gas (at least in the U.S., where increasing shale gas production has boosted supply). In comparison, the rise in coal prices has been slower and steadier.
Figure 11. Cumulative Price Change in Energy Resources Since December 2001
Despite a near-doubling in aggregate fossil energy prices from December 2001 through June 2008, the contribution of energy costs to the run-up in turbine prices over this same period appears to have been relatively modest, at roughly $12/kW (Figure 12). Moreover, with the sharp decline in energy prices since June 2008, more than half of this contribution – $7/kW – has been erased.
Figure 12. Energy Input Costs
-50%
0%
50%
100%
150%
200%
250%
2002 2003 2004 2005 2006 2007 2008 2009 2010 2011
Natural Gas (20% of consumption)
Coal (20% of consumption)
Diesel (20% of consumption)
Rea
l Pric
e C
hang
e in
Ene
rgy
-10
0
10
20
30
40
50
60
20
01
20
02
20
03
20
04
20
05
20
06
20
07
20
08
20
09
20
10
20
10
$/k
W
Energy Input Costs
Cumulative Change

23
3.7 Foreign Exchange Rates Historically, a substantial fraction of the wind turbines installed in the U.S. have been imported, either in part or in full, from other countries. As a result, the strength of the U.S. dollar (“USD”) relative to the home currencies of turbine-exporting countries has impacted the USD-denominated price of wind turbines over time. All else equal, the USD-denominated price of wind turbines will increase as the USD loses value, and will fall as the USD strengthens. With the USD suffering from an extended period of weakness during the years of interest to this study, exchange rate impacts could explain a significant amount of the run-up in wind turbine prices in the U.S. over this period. Although modern wind power technology can trace many of its roots back to turbines built and installed in California in the late 1970s and early 1980s, U.S. wind turbine manufacturing largely stagnated – along with the U.S. market for turbines – once California state and federal incentives were eliminated in the mid-1980s. It wasn’t until the turn of the century that demand for wind power in the U.S. began to pick up again (Figure 1), and by that time, several European turbine manufacturers – who, after the collapse of the California market in the late-1980s, had been supplying growing markets in northern Europe throughout the 1990s – dominated the global wind turbine market, along with newly emerging competition from a number of Asian countries, most notably Japan and India. Although the U.S. never fully conceded wind turbine manufacturing to overseas companies – e.g., since buying Enron Wind’s assets in 2002,21 U.S.-based GE Wind has become a leading supplier of wind turbines worldwide – it is nevertheless the case that the U.S. has been and remains one of the world’s largest importers of wind turbines. This picture, however, has begun to change in recent years. In addition to GE Wind, new U.S.-based wind turbine manufacturers – including Clipper Windpower – have more recently entered the market, primarily supplying U.S. projects. Foreign-based turbine manufacturers have also been investing in the U.S.: by the end of 2010, nine of the eleven wind turbine manufacturers with the largest share of the U.S. market in 2010 had one or more manufacturing facilities operating in the U.S. Finally, both domestic and foreign component manufacturers have also increasingly invested in U.S.-based manufacturing facilities (Wiser and Bolinger 2011). As a result of this activity, the proportion of wind turbines and components that are imported into the United States has declined significantly in recent years. Based on trade data from the U.S. Department of Commerce, Wiser and Bolinger (2011) estimate that the fraction of installed wind turbine equipment costs imported into the U.S. fell from about 65% in 2005-2006 to 58% in 2007-2008, and then further to 40% in 2009-2010 (Figure 13). This most recent empirical estimate – which suggests roughly 60% local content in the US on average – is generally consistent with, or even conservative relative to, similar estimates released by individual wind turbine manufacturers: Gamesa claims to offer 60% local content in the US (Gamesa 2011), Acciona 77% (Waggoner 2011), and Vestas 80-90% (Vestas 2011a).
21 Enron Wind, in turn, had bought both Zond (American) and Tacke (German) in 1997. Zond, in turn, had purchased variable-speed technology from Kenetech (formerly known as U.S. Windpower) in 1996 during bankruptcy proceedings.

24
Source: Wiser and Bolinger (2011)
Figure 13. Estimated Wind Turbine Equipment Imports as a Fraction of Total Turbine Cost Even though it has subsided in recent years as the import fraction has declined and the degree of local content has increased, the risk of adverse exchange rate movements inflating the cost of wind turbines imported into the U.S. has been very real throughout the period of interest to this study (i.e., 2002 – 2010). Table 4 lists those countries that have accounted for the largest estimated share of wind turbine equipment imported into the U.S. over time,22 and thereby make up the bulk of foreign currency exposure. Figure 14 shows that from the start of 2002 through the first half of 2008, the USD had lost at least 15% of its value relative to all but one of these currencies (the Mexican Peso). Of particular note, given the high concentration of wind turbine imports from Europe, USD weakness has been especially pronounced relative to European currencies: from the start of 2002 through mid-2008, the USD lost 40% of its value against the Euro (as well as the Danish Kroner, which has moved in lock-step with the Euro).
22 The numbers in Table 4 capture only the imports related to the Harmonized Tariff Schedules for “wind-powered generating sets” and “towers and lattice masts,” and assume that 100% of the former and 95% of the latter are attributable to wind turbines. Though other wind turbine components are also imported into the United States, wind-specific Harmonized Tariff Schedules are not available for those imports, making it difficult to discern from which countries they originated using U.S. Department of Commerce data.
0
5
10
15
20
25
2005-2006 2007-2008 2009-2010
Impo
rts
as F
ract
ion
of T
urbi
ne C
ost
(%)
Bill
ion
US
$201
0
Total Turbine Equipment Cost (Calendar Year)
Value of Selected Imports (Customs value, 4 month lag, Sept - Aug)
Estimated Import Fraction
80%
60%
40%
20%
0%
100%
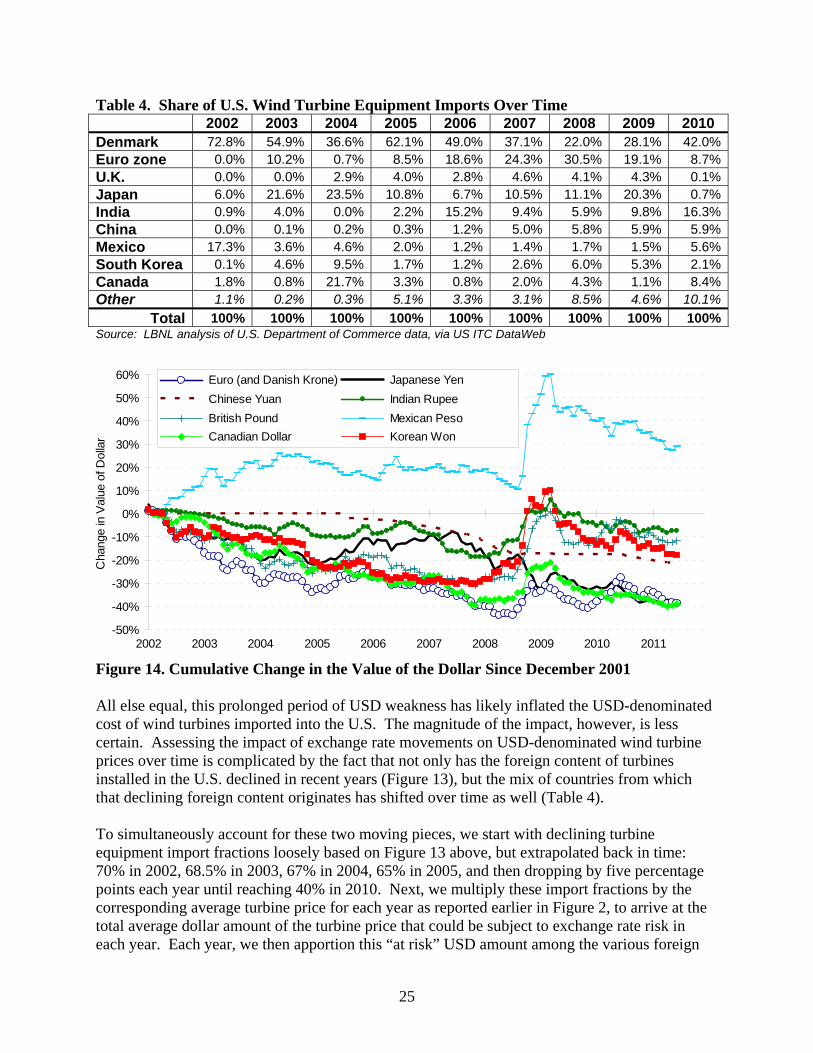
25
Table 4. Share of U.S. Wind Turbine Equipment Imports Over Time 2002 2003 2004 2005 2006 2007 2008 2009 2010
Denmark 72.8% 54.9% 36.6% 62.1% 49.0% 37.1% 22.0% 28.1% 42.0%Euro zone 0.0% 10.2% 0.7% 8.5% 18.6% 24.3% 30.5% 19.1% 8.7%U.K. 0.0% 0.0% 2.9% 4.0% 2.8% 4.6% 4.1% 4.3% 0.1%Japan 6.0% 21.6% 23.5% 10.8% 6.7% 10.5% 11.1% 20.3% 0.7%India 0.9% 4.0% 0.0% 2.2% 15.2% 9.4% 5.9% 9.8% 16.3%China 0.0% 0.1% 0.2% 0.3% 1.2% 5.0% 5.8% 5.9% 5.9%Mexico 17.3% 3.6% 4.6% 2.0% 1.2% 1.4% 1.7% 1.5% 5.6%South Korea 0.1% 4.6% 9.5% 1.7% 1.2% 2.6% 6.0% 5.3% 2.1%Canada 1.8% 0.8% 21.7% 3.3% 0.8% 2.0% 4.3% 1.1% 8.4%Other 1.1% 0.2% 0.3% 5.1% 3.3% 3.1% 8.5% 4.6% 10.1%
Total 100% 100% 100% 100% 100% 100% 100% 100% 100%Source: LBNL analysis of U.S. Department of Commerce data, via US ITC DataWeb
Figure 14. Cumulative Change in the Value of the Dollar Since December 2001 All else equal, this prolonged period of USD weakness has likely inflated the USD-denominated cost of wind turbines imported into the U.S. The magnitude of the impact, however, is less certain. Assessing the impact of exchange rate movements on USD-denominated wind turbine prices over time is complicated by the fact that not only has the foreign content of turbines installed in the U.S. declined in recent years (Figure 13), but the mix of countries from which that declining foreign content originates has shifted over time as well (Table 4). To simultaneously account for these two moving pieces, we start with declining turbine equipment import fractions loosely based on Figure 13 above, but extrapolated back in time: 70% in 2002, 68.5% in 2003, 67% in 2004, 65% in 2005, and then dropping by five percentage points each year until reaching 40% in 2010. Next, we multiply these import fractions by the corresponding average turbine price for each year as reported earlier in Figure 2, to arrive at the total average dollar amount of the turbine price that could be subject to exchange rate risk in each year. Each year, we then apportion this “at risk” USD amount among the various foreign
-50%
-40%
-30%
-20%
-10%
0%
10%
20%
30%
40%
50%
60%
2002 2003 2004 2005 2006 2007 2008 2009 2010 2011
Euro (and Danish Krone) Japanese Yen
Chinese Yuan Indian Rupee
British Pound Mexican Peso
Canadian Dollar Korean Won
Cha
nge
in V
alue
of D
olla
r
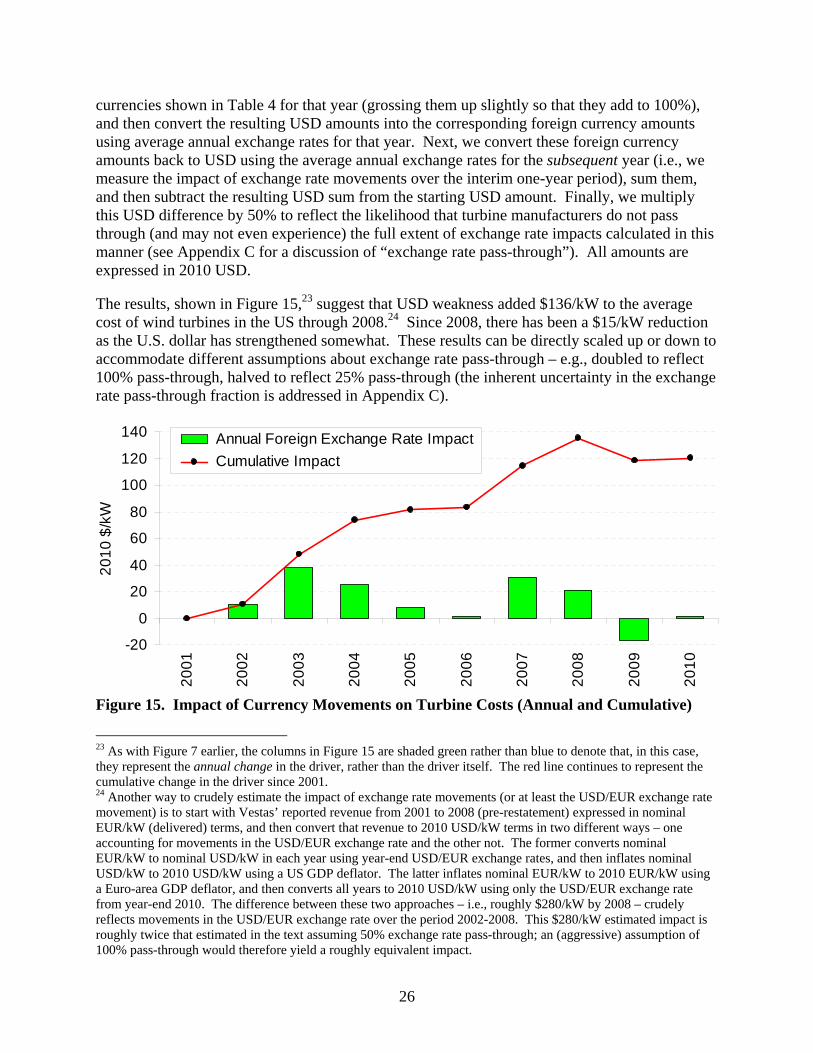
26
currencies shown in Table 4 for that year (grossing them up slightly so that they add to 100%), and then convert the resulting USD amounts into the corresponding foreign currency amounts using average annual exchange rates for that year. Next, we convert these foreign currency amounts back to USD using the average annual exchange rates for the subsequent year (i.e., we measure the impact of exchange rate movements over the interim one-year period), sum them, and then subtract the resulting USD sum from the starting USD amount. Finally, we multiply this USD difference by 50% to reflect the likelihood that turbine manufacturers do not pass through (and may not even experience) the full extent of exchange rate impacts calculated in this manner (see Appendix C for a discussion of “exchange rate pass-through”). All amounts are expressed in 2010 USD. The results, shown in Figure 15,23 suggest that USD weakness added $136/kW to the average cost of wind turbines in the US through 2008.24 Since 2008, there has been a $15/kW reduction as the U.S. dollar has strengthened somewhat. These results can be directly scaled up or down to accommodate different assumptions about exchange rate pass-through – e.g., doubled to reflect 100% pass-through, halved to reflect 25% pass-through (the inherent uncertainty in the exchange rate pass-through fraction is addressed in Appendix C).
Figure 15. Impact of Currency Movements on Turbine Costs (Annual and Cumulative)
23 As with Figure 7 earlier, the columns in Figure 15 are shaded green rather than blue to denote that, in this case, they represent the annual change in the driver, rather than the driver itself. The red line continues to represent the cumulative change in the driver since 2001. 24 Another way to crudely estimate the impact of exchange rate movements (or at least the USD/EUR exchange rate movement) is to start with Vestas’ reported revenue from 2001 to 2008 (pre-restatement) expressed in nominal EUR/kW (delivered) terms, and then convert that revenue to 2010 USD/kW terms in two different ways – one accounting for movements in the USD/EUR exchange rate and the other not. The former converts nominal EUR/kW to nominal USD/kW in each year using year-end USD/EUR exchange rates, and then inflates nominal USD/kW to 2010 USD/kW using a US GDP deflator. The latter inflates nominal EUR/kW to 2010 EUR/kW using a Euro-area GDP deflator, and then converts all years to 2010 USD/kW using only the USD/EUR exchange rate from year-end 2010. The difference between these two approaches – i.e., roughly $280/kW by 2008 – crudely reflects movements in the USD/EUR exchange rate over the period 2002-2008. This $280/kW estimated impact is roughly twice that estimated in the text assuming 50% exchange rate pass-through; an (aggressive) assumption of 100% pass-through would therefore yield a roughly equivalent impact.
-20
0
20
40
60
80
100
120
140
20
01
20
02
20
03
20
04
20
05
20
06
20
07
20
08
20
09
20
10
20
10
$/k
W
Annual Foreign Exchange Rate Impact
Cumulative Impact

27
4. Aggregate Impact of Turbine Price Drivers The individual impacts of each of the seven drivers of wind turbine prices examined in Sections 3.1 through 3.7 are summarized in Table 5. To focus attention on the overall trends, the table presents cumulative impacts over the two periods of major turbine price movements in the past decade – i.e., the doubling in turbine prices from 2002-2008, and the subsequent softening in prices through 2010. Figure 13, meanwhile, shows yearly impacts, but of all seven drivers combined rather than individually; this aggregate impact (blue line with circle markers) is plotted against the empirical turbine price curve shown earlier in Figure 2 (red line with star markers).
Table 5. Cumulative Impact During Period of Turbine Price Increase (2002-08) and Decrease (2009-10) (2010 $/kW)
2002-2008 2009-2010 Endogenous Drivers +376 -37
Labor Costs +91 +12 Warranty Provisions +42 -20 Profit Margins +59 -78 Turbine Scaling +184 +50
Exogenous Drivers +219 -53 Materials Prices +71 -31
Steel +65 -29 Iron +7 -2 Copper +9 +1 Aluminum +2 -1 Fiberglass -11 0
Energy Prices +12 -7 Diesel +10 -4 Coal 0 0 Natural Gas +2 -3
Currency Movements +136 -15
Total Impact +595 -89
Figure 13. Yearly Impact of All Seven Drivers Combined vs. Empirical Price Curve
0
200
400
600
800
1,000
1,200
1,400
1,600
2001 2002 2003 2004 2005 2006 2007 2008 2009 2010
20
10
$/k
W
Empirical polynomial trend line (from Figure 2)
Bottom-up analysis (all 7 drivers combined)
28
In aggregate, these seven drivers explain nearly $600/kW of the ~$750/kW increase in average turbine prices observed from 2002-2008, and nearly $90/kW of the ~$195/kW decrease in 2009 and 2010 (Table 5, Figure 13). From 2003 through 2010, the bottom-up analysis of these seven drivers explains between 68% and 89% (depending on the year) of the cumulative empirical price movements (Figure 13).25 Though by no means perfect, this track record improves upon several earlier efforts (Carbon Trust 2008, Greenacre et al. 2010) that have typically failed to quantify more than 60% of observed turbine price increases. Nonetheless, Figure 13 shows a growing gap between modeled and empirical turbine prices starting in 2005 and increasing through 2007, at which point the gap remains more or less constant until eventually narrowing in 2010. Some portion of this wedge could potentially be explained by our omission of what were likely increasing labor costs and profitability among component suppliers beginning around 2005 (discussed in Section 3.3). The magnitude of the gap – maxing out at $140/kW – is not out of line with changes in turbine manufacturer labor costs and profitability, which rose by a combined $150/kW through 2008 (see Table 5). Alternatively, or in addition, some portion of the gap could reflect higher exchange-rate pass-through than the 50% assumed here, or turbine design and engineering improvements beyond the scaling effects that were analyzed earlier. Finally, some of the discrepancy may simply be due to methodological issues, such as the necessary reliance on Vestas data in this analysis, when the market was supplied by multiple turbine vendors over this period, and especially by GE Wind. Ignoring these other potential influences not captured here, Table 5 shows that the four partially endogenous drivers (+$376/kW) still account for more of the turbine price increase from 2002-08 than do the three partially exogenous drivers (+$219/kW). This result suggests that, even absent the considerable exogenous shocks, endogenous price drivers still would have confounded the traditional, simple application of learning curve theory by pushing turbine prices higher even as global wind power installations doubled twice over this period. It is, however, important to note that roughly half of the endogenous impact (+$184/kW) is attributable to turbine up-scaling, for which there is a direct payback in terms of a lower cost of electricity. In other words, from an LCOE perspective, the considerable capital cost impact from turbine up-scaling is not troubling, suggesting that learning effects for wind power should, arguably, be measured through LCOE rather than the more traditionally used turbine prices (or installed project costs). Finally, it is clear from this analysis that there is no single, dominant factor that drove turbine prices higher from 2002-08, or that has yielded lower prices since that time. Turbine up-scaling is, by a significant margin, the largest single driver, although as noted above, the estimated price impact associated with up-scaling can be seen as a reasonable expense given the performance improvements garnered by larger turbines. Currency movements are also found to have played a sizable – though somewhat uncertain – role, as did changes in labor costs and material prices. Changes in manufacturer profit margins, warranty provisions, and energy prices are found to play a less significant, but non-negligible role.
25 If one assumes 80% exchange-rate pass-through (rather than 50%), the explanatory power rises to a range of 77%-102%. An assumption of more than 80% exchange-rate pass-through on products exported to the U.S. would appear to be aggressive, however, given that commodities prices – most of which are already traded in USD, and are therefore not subject to exchange rate risk – make up roughly 15% of the cost of a wind turbine.

29
5. Looking Ahead The analysis described in Section 3, with results summarized and discussed in Section 4, extends through 2010. At the time of writing, however, 2011 is already more than half passed, begging the question of how turbine prices have moved so far in 2011 and how the drivers highlighted in this paper have been impacting those prices. Vestas (2011d) reports that Vestas’ average (nominal) price on new orders worldwide during the first half of 2011 was 967 EUR/kW, down 2.5% from 992 EUR/kW in 2010. Bloomberg NEF (2011c) suggests a steeper decline, as the price of turbines within its sample that were contracted in the first half of 2011 for delivery (worldwide) in the coming twelve months fell to 940 EUR/kW, a 7% decline from 2010 levels of around 1,000 EUR/kW. Bloomberg NEF (2011c) goes on to note that the U.S. is a lower cost market than most of Europe, with average pricing pegged at $1,100/kW (i.e., consistent with the 2011 turbine price range presented earlier in Figure 2). Declining labor costs and warranty provisions appear to be enabling some portion of the decline (Vestas 2011d), while ongoing compression of profit margins among turbine manufacturers and component suppliers may be another contributor (Bloomberg NEF 2011c, Hauser 2011, Weiss and Schneeweiss 2011). And, with a presumed continued up-scaling in turbine size in 2011 compared to 2010, the reported price declines have occurred in concert with larger turbines with presumably enhanced performance. At the same time, however, all three exogenous drivers examined in this report – changes in raw materials prices, energy prices, and foreign exchange rates – were pressuring turbine prices higher as of mid-year (Figures 9, 10, and 12 – which show real changes in materials prices, energy prices, and foreign exchange rates, respectively – all extend through June 2011). In addition, as of mid-September 2011, some market participants were noting that turbine prices in the U.S. had begun to move somewhat higher as a result of the rush to have wind turbines under contract before the end of the year in order to qualify for the Section 1603 Treasury cash grant.26 Thus, it is not yet clear whether the turbine price reductions seen during the first half of 2011 in comparison to 2010 will persist through the second half of the year, or how the full-year 2011 numbers will compare to 2010. The apparent late-year rush induced by the pending expiration of the Section 1603 grant program does, however, highlight another turbine price driver – though of an indirect nature – not yet explicitly discussed in this report: policy risk. The short-term, start-and-stop policy support for wind power that has existed in the U.S. since the production tax credit (“PTC”) first expired in mid-1999 created inefficiencies, artificial demand shocks, and sub-optimal investment through at least 2005 (Wiser et al. 2007). In part as a result, in 2005 when the PTC was for the first time extended for two years in advance of expiration, the resulting surge in demand led to major
26 The Section 1603 grant was originally enacted as part of the American Recovery and Reinvestment Act of 2009, and provides a 30% cash grant in lieu of either the Section 48 investment tax credit (“ITC”) or the Section 45 production tax credit (“PTC”). In order to qualify for the grant, wind projects must be “under construction” by the end of 2011, and must achieve commercial operations by the end of 2012. Based on “safe harbor” guidelines issued by the U.S. Treasury, one way in which projects can qualify as being “under construction” is to incur more than 5% of eligible project costs by the end of 2011. In many cases, developers have been complying with the 5% safe harbor by contracting for turbines in 2011 with the intent to either take title to or delivery of a sufficient portion of those turbines in order to meet the 5% threshold by the end of the year.

30
supply bottlenecks, higher labor costs, and rising profit margins – all of which (together with the other endogenous and exogenous cost pressures examined in this report) pushed turbine prices higher. By the time the industry eventually caught up to demand through increased investments in manufacturing and supply chain infrastructure, the global financial crisis of 2008/2009 had wrought significant demand destruction, leaving newly built manufacturing plants operating well below capacity in some cases (Bloomberg NEF 2011c). The Section 1603 program, with its offering of a 30% cash grant in lieu of the PTC, helped to restore demand to a degree, but is now – along with the PTC –also nearing expiration, with no clear guidance as to what, if anything, might replace it. Having ramped up manufacturing capacity in local markets in order to meet demand while also minimizing transport costs and mitigating the risk of adverse exchange rate movements, the industry is now more robust than it was in 2005, which should enable it to focus more on driving the cost of wind energy lower, regardless of the policy environment. Even still, whether the cost of wind energy continues down the long-term downward-sloping cost curve from which it departed in 2002 – but with which it has recently re-engaged – may ultimately depend on what types of policy support are put in place post-2012. Long-term, stable policy support – even if it includes a scheduled ramp down over time to progressively wean the industry off of public support – should enable the industry to capitalize on the investments that it has already made while also planning for the future. A continuation of short-term, stop-and-go policy support, on the other hand, may lead to further rounds of artificial and inefficient demand shocks, with consequent impacts on wind turbine and wind energy pricing.
31
References American Wind Energy Association (AWEA). 2011. U.S. Wind Industry Annual Market Report:
Year Ending 2010. Washington, D.C.: American Wind Energy Association. Aubrey, Crispin. 2007. “Supply Chain: The race to meet demand.” Wind Directions,
January/February 2007, pp. 27-34. Berry, D. 2009. “Innovation and the price of wind energy in the US.” Energy Policy, Volume 37,
Issue 11, November 2009, pp. 4493-4499. Blanco, María Isabel. 2009. “The Economics of Wind Energy.” Renewable and Sustainable
Energy Reviews, vol. 13, pp. 1372-1382. Bloomberg New Energy Finance (“Bloomberg NEF”). 2011a. US wind energy services;
increased competition in an expanding market. January 4, 2011 Bloomberg New Energy Finance (“Bloomberg NEF”). 2011b. North America Wind Market
Outlook: Q1 2011. February 23, 2011. Bloomberg New Energy Finance (“Bloomberg NEF”). 2011c. Wind Turbine Price Index, Issue
V. July 27, 2011. Bloomberg New Energy Finance (“Bloomberg NEF”). 2009. Q3 Wind Market Outlook.
September 30, 2009. Bolinger, Mark and Ryan Wiser. 2009. “Wind Power Price Trends in the United States:
Struggling to Remain Competitive in the Face of Strong Growth.” Energy Policy. Vol 37, Issue 3, March 2009, pp. 1061-1071.
BWEA & Garrad Hassan. 2009. Charting the Right Course: Scenarios for offshore capital costs
for the next five years. BWEA, London. Carbon Trust. 2008. Offshore wind power: big challenge, big opportunity. Carbon Trust,
London. Chupka, Marc W., Gregory Basheda. 2007. Rising Utility Construction Costs: Sources and
Impacts. Prepared by The Brattle Group for The Edison Foundation. Dinica, Valentina. 2011. “Renewable electricity production costs – A framework to assist policy-
makers’ decisions on price support.” Energy Policy, Volume 39, Issue 7, July 2011, pp. 4153-4167.
D’Souza, N., E. Gbegbaje-Das, P. Shonfield. 2011. Life Cycle Assessment of Electricity
Production from a V112 Turbine Wind Plant. Prepared for Vestas by PE North West Europe ApS. February 2011.
32
Efiong, Asari and Andrew Crispin. 2007. Wind Turbine Manufacturers; Here Comes Pricing
Power. Merrill Lynch Industry Overview, August 10, 2007. Elsam Engineering A/S. 2004. Life Cycle Assessment of offshore and onshore sited wind farms.
Document number 200128, translated by Vestas Wind Systems A/S, October 20, 2004. Ernst & Young. 2009. Cost of and financial support for offshore wind. Report prepared for the
Department of Energy and Climate Change, April 2009. DECC, London. European Wind Energy Association (EWEA). 2009. Wind Energy, the Facts. Brussels, Belgium:
European Wind Energy Association. Ferioli, F., Schoots, K. & Van der Zwaan, B.C.C. 2009. “Use and limitations of learning curves
for energy technology policy: A component-learning hypothesis.” Energy Policy, Volume 37, Issue 7, July 2009, pp. 2525-2535.
Fingersh, L., M. Hand, A. Laxson. 2006. Wind Turbine Design Cost and Scaling Model.
NREL/TP-500-40566. Golden, Colo.: National Renewable Energy Laboratory. Fowler, Andrew. 2008. “Trends in Wind Power Prices, B.O.P., and Turbine Costs.”
WINDPOWER 2008. Houston, Texas, June 2, 2008. Gamesa. 2011. Sustainability Report 2010. Greenacre, Philip, Robert Gross, Phil Heptonstall. 2010. Great Expectations: The cost of
offshore wind in UK waters – understanding the past and projecting the future. A report produced by the Technology and Policy Assessment Function of the UK Energy Research Centre.
Hauser, Christine. 2011. “G.E. Profits Are in Line With Analysts’ Outlook.” New York Times,
October 21, 2011. IHS CERA. 2011. “Power Plant Construction Costs: Cost Pressures Returning.” Latest report of
the Power Capital Cost Index (PCCI), July 6, 2011. Jabara, Cathy L. 2009. How Do Exchange Rates Affect Import Prices? Recent Economic
Literature and Data Analysis. United States International Trade Commission, Office of Industries, Publication ID-21, Revised October 2009.
Koomey, J., N.E. Hultman. 2007. “A reactor-level analysis of busbar costs for US nuclear plants,
1970–2005.” Energy Policy, Volume 35, Issue 11, November 2007, Pages 5630-5642. Laxson, A., M. Hand, N. Blair. 2006. High Wind Penetration Impact on U.S. Wind
Manufacturing Capacity and Critical Resources. NREL/TP-500-40482. Golden, Colo.: National Renewable Energy Laboratory.

33
Martínez, E., F. Sanz, S. Pellegrini, E. Jiménez, J. Blanco. 2009. “Life Cycle Assessment of a
Multi-MegaWatt Wind Turbine.” Renewable Energy, vol. 34, pp. 667-673. McNerney, J., J.D. Farmer, J.E. Trancik. 2011. “Historical costs of coal-fired electricity and
implications for the future.” Energy Policy, Volume 39, Issue 6, June 2011, Pages 3042-3054.
Milborrow, David. 2008. “Dissecting Wind Turbine Costs.” WindStats Newsletter, vol. 21, no. 4,
pp. 3-5. Schleisner, Lotte. 2000. “Life cycle assessment of a wind farm and related externalities.”
Renewable Energy, vol. 20, pp. 279-288. TPI Composites, Inc. 2003. Cost Study for Large Wind Turbine Blades: WindPACT Blade
System Design Studies. SAND2003-1428. Albuquerque, New Mexico: Sandia National Laboratories.
U.S. International Trade Commission (USITC). 2009. Interactive Tariff and Trade Dataweb
(Dataweb). http://dataweb.usitc.gov Vestas Wind Systems A/S. 2006a. Life cycle assessment of offshore and onshore sited wind
power plants based on Vestas V90-3.0 MW turbines. June 21, 2006. Vestas Wind Systems A/S. 2006b. Life cycle assessment of electricity delivered from an onshore
power plant based on Vestas V82-1.65 MW turbines. December 29, 2006. Vestas. 2011a. Annual report 2010. Vestas. 2011b. Full year 2010 and guidance for 2011: Operating in a market in recovery.
Presentation accompanying the Vestas Annual report 2010. Vestas. 2011c. Shareholder information: 1/2011. Vestas. 2011d. Interim financial report, first half year 2011. Company announcement No.
37/2011, August 17, 2011. Vestas. 2010a. Annual report 2009. Vestas. 2010b. New accounting polices for supply-and-installation projects and their effect on
2006-2011. Company announcement No. 44/2010, November 22, 2010. Vestas. 2010c. Implementation of IFRIC 15: Re-state accounts, Translation of guidance for
2010. November 22, 2010.
34
Vestas. 2005. Strategic plan of action 2005-2008. Stock exchange announcement No. 16/2005, May 26, 2005.
Villadsen, Lars. 2011. Personal communication with Lars Villadsen, Senior Specialist, Investor
Relations, Vestas. July 2011. Waggoner, Tom. 2011. “Riding the Wind: Domesticating the Supply Chain – One Part at a
Time.” Presentation at WINDPOWER 2011, Anaheim, California, May 25, 2011. Weiss, Richard and Zoe Schneeweiss. 2011. “Siemens Wind-Power Unit Aims to Return to
Margin Exceeding 10%.” Bloomberg, September 29, 2011. Willow, Christopher, Bruce Valpy. 2011. Offshore Wind: Forecasts of future costs and benefits.
Report prepared by BVG Associates for RenewableUK. Wiser, Ryan, and Mark Bolinger. 2011. 2010 Wind Technologies Market Report. LBNL-4820E.
Berkeley, Calif.: Lawrence Berkeley National Laboratory. Wiser, R., Z. Yang, M. Hand, O. Hohmeyer, D. Infield, P. H. Jensen, V. Nikolaev, M. O’Malley,
G. Sinden, A. Zervos. 2011a. “Wind Energy.” In IPCC Special Report on Renewable Energy Sources and Climate Change Mitigation [O. Edenhofer, R. Pichs‐Madruga, Y. Sokona, K. Seyboth, P. Matschoss, S. Kadner, T. Zwickel, P. Eickemeier, G. Hansen, S. Schlömer, C. von Stechow (eds)], Cambridge University Press, Cambridge, United Kingdom and New York, NY, USA.
Wiser, R., E. Lantz, M. Bolinger, M. Hand. 2011b (forthcoming). Recent Developments in the
Levelized Cost of Energy from U.S. Wind Power Projects. Berkeley, Calif.: Lawrence Berkeley National Laboratory.
Wiser, R., M. Bolinger, G. Barbose. 2007. “Using the Federal Production Tax Credit to Build a
Durable Market for Wind Power in the United States” The Electricity Journal. Vol 20, Issue 9, November 2007, pp. 77-88.

35
Appendix A – Commodity Price Time Series Data All of the raw materials and energy prices used in this report are priced and traded (in some cases globally) in USD terms. As such, from a U.S. perspective, these commodities prices are not subject to exchange rate risk, and no exchange rate conversions are required prior to analysis. Raw Materials Price Data To enable an assessment of the impact of changes in materials prices on wind turbine prices, this section describes the derivation of the monthly time series of prices for the five materials listed in Table 1 of the main text. Based upon the trends in turbine prices shown earlier in Figure 2, the period of interest for this analysis stretches from the present (i.e., mid-2011) back to the apparent low in turbine prices reached around December 2001. Steel: We derived a time series of monthly steel prices going back to December 2001 using
a combination of price and index data from two independent London-based market analysts and data providers. MEPS (International) Ltd. provides limited historical price (and index) data for a North American Composite Carbon Steel Price, while the CRU Group provides a lengthier history of index (but not price) data for its North American Steel Price Index.27 As such, our approach was to use the MEPS price for the most recent month available (June 2011), and use the monthly CRU price index to inflate or deflate the June 2011 MEPS price going back through December 2001. During a 4-year period of overlap (July 2007-June 2011), the actual MEPS price data and the derived CRU-index-based price estimates are quite consistent with one another.
Fiberglass/Resin/Plastic: Fiberglass and resin prices were derived from Tables 2.8 and 2.9 of TPI Composites, Inc. (2003), and were assumed to be current as of April 2003. These costs were inflated/deflated over the full period of interest using applicable PPI sub-indices from the Bureau of Labor Statistics.28 The resulting two time series were combined into a single, material-weighted time series assuming a mix of 60% fiberglass and 40% resin (TPI Composites, Inc. 2003).29 Plastics are assumed to be closely related to fiberglass and priced the same.
Iron/Cast Iron: The analysis uses historical pig iron prices obtained from
steelonthenet.com, as pig iron is a pre-cursor to cast iron (and steel). Not surprisingly, movement in pig iron prices closely reflects movements in CRU’s “Metallics” index (which encompasses scrap iron, pig iron, direct reduced iron, and hot briquetted iron).
27 MEPS price data are available at http://www.meps.co.uk/allproducts%20steel%20price.htm; CRU index data are available at http://www.cruonline.crugroup.com/SteelFerroalloys/CRUSteelPrices/CRUspi/tabid/143/Default.aspx. 28 For fiberglass, we used the PPI Industry Data Series ID PCU3272123272128 (“Glass fiber mat, textile-type, made by establishments producing glass”), and for resin, we used the PPI Industry Data Series ID PCU3255203255204 (“Synthetic resin & rubber adhesives, incl all types of bonding & laminating adhesives”). 29 The reason for combining fiberglass and resin prices into a single time series is that some LCAs provide mass data for both materials, while others (including the Vestas 1.65 MW LCA) simply list a single mass for “fiberglass,” which presumably includes both the fiberglass as well as the resin used to bind it. Still others use the word “plastic” when seeming to refer to fiberglass (possibly a translation problem).

36
Copper and Aluminum: Historical monthly cash settlement prices for both primary
aluminum and copper come from the London Metal Exchange (“LME”), one of the world’s premier metals markets.
Each of these five material price time series is converted to $/kg using standard conversion factors, and normalized to 2010 dollars using the quarterly GDP price deflator published by the United States Department of Commerce’s Bureau of Economic Analysis. Energy Price Data Monthly time series of fossil fuel prices come from the Energy Information Administration (EIA). We assume that the majority of oil consumption comes in the form of diesel fuel (for transportation), and therefore use the EIA’s monthly price estimate for all types of highway diesel fuel. For natural gas, we used the EIA’s average monthly industrial price. Finally, coal prices come from Table 4.1 of the EIA’s Electric Power Monthly publication, and represent the average cost of coal fuel across all power generation sectors. For the 40% of energy consumption supplied by fixed-price resources, we simply assume a fixed cost over time (fixed in real terms, escalating at the rate of inflation in nominal terms) of $100/MWh. It is perhaps worth noting that none of the three fossil fuels analyzed are traded in a global market (although price movements in various markets around the world are likely highly correlated), and the time series used here are U.S.-specific prices. Though fossil fuel prices may have been somewhat different in Europe or Asia (where many wind turbines and components were manufactured over the period of interest), it is also the case that foreign turbine manufacturers were steadily increasing their U.S. manufacturing capabilities – and therefore exposure to U.S. energy prices – over this period. In addition, GE Wind – by far the market leader in the U.S. over this period – presumably manufactures most of its turbine components in the U.S., and is therefore paying U.S. energy prices. As such, the use of U.S.-specific energy prices should not impose undue bias
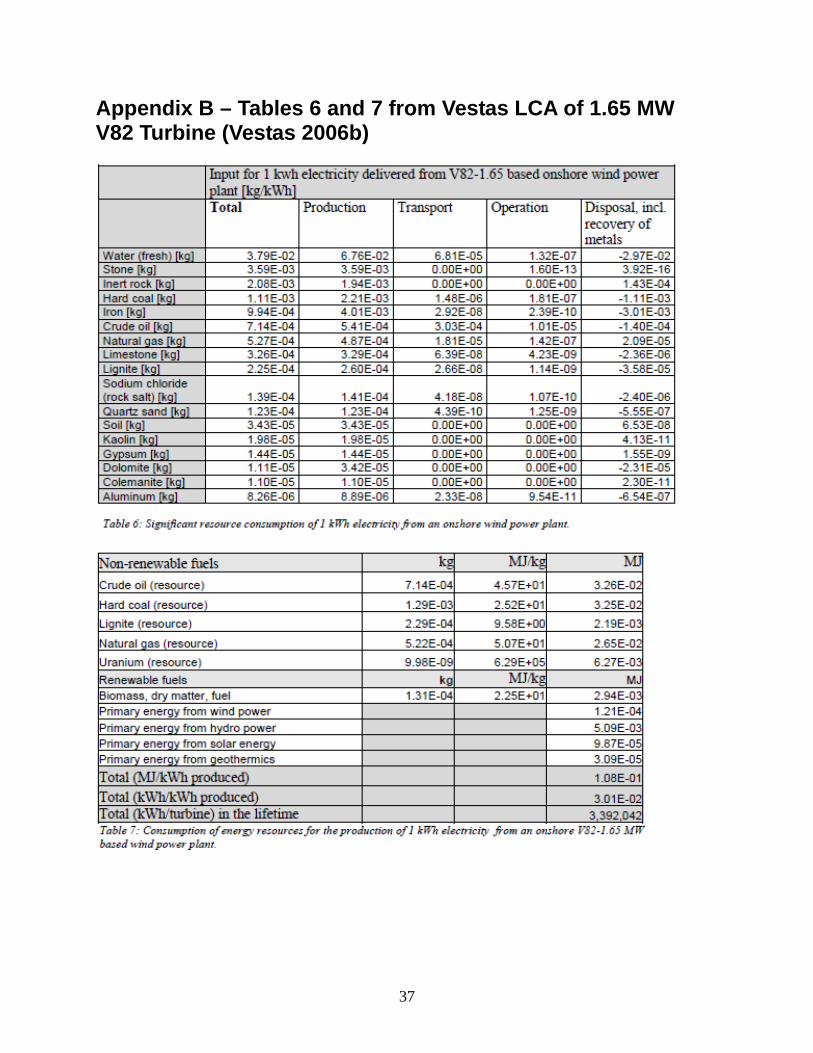
37
Appendix B – Tables 6 and 7 from Vestas LCA of 1.65 MW V82 Turbine (Vestas 2006b)
38
Appendix C – Exchange Rate Pass-Through All else equal, the prolonged period of USD weakness since 2002 has likely inflated the USD-denominated cost of wind turbines imported into the U.S. The magnitude of the impact, however, is less certain. Though not focused on wind turbines, Jabara (2009) notes that the impact of exchange rate movements on the price of finished goods ultimately depends on the exporting firms’ price-setting behavior: whether they (1) price to market (i.e., adjust their price to reflect changing conditions in the export market); (2) set their prices in the local currency of the importer (or some third-party benchmark currency, such as the USD); (3) engage in cross-border production (i.e., importing various components – some that might be priced in third-party benchmark currencies, such as the USD – from certain countries, and exporting finished goods to other countries); or (4) some combination of all three. Any of these practices, or combination of practices, could result in less than full pass-through of exchange rate movements. For example, to remain competitive, an exporting firm that is trying to build or maintain market share might “price to market” by absorbing exchange-rate-related cost increases into its (reduced) profit margin. Although some turbine manufacturers may have selectively employed this strategy for a few years in the early 2000s,30 ultimately a sustained strategy of pricing to market requires finished goods to be sufficiently differentiated such that manufacturers can earn sizeable profit margins – i.e., sizeable enough to be partially sacrificed at times without placing the company at risk (Jabara 2009). Wind turbines do not really fit this mold. Although project developers and financiers will often distinguish between so-called “Tier 1” and “Tier 2” wind turbine manufacturers, there is simply not much variation among wind turbines built by different manufacturers, particularly those that reside within the same tier. As a result, price sensitivity is high, and turbine manufacturer profit margins generally are not (e.g., see Section 3.3 of the main text). This combination – along with rising profit margins from 2005 through 2008 – suggests that although pricing to market (i.e., low pass-through of exchange rate movements) may have been employed early in the study period, any such strategy has likely been largely abandoned in more recent years in favor of rebuilding profitability – and localizing production.31 Jabara (2009) goes on to note that “The higher the product differentiation and the lower the price sensitivity, exporters will prefer to export in their own currency.” Given the relatively low product differentiation and high price sensitivity surrounding wind turbines, one might therefore expect foreign wind turbines imported into the US to be priced primarily in USD, especially later in the 2001-2010 timeframe – i.e., what Jabara (2009) refers to as “local currency pricing.” And this does seem to be the case: indications from one large wind developer in the U.S. are that –
30 For example, after five years of steadily declining profit margins – perhaps in part due to “pricing to market” –Vestas launched its “Will to Win” campaign in late 2005 with the goal of returning the company to healthy profitability through a variety of measures, including price increases (Vestas 2005). Coming at a time when demand for wind turbines began to outpace supply, this price increase was sustainable up until the global financial crisis of 2008/2009 dramatically changed the balance of supply and demand. 31 For example, Vestas’ 2010 annual report states that “In combination with a higher degree of sourcing from countries whose currencies are not linked to the EUR, the [manufacturing] investments in the USA and China ensure an improved currency mix between income and expenses, making Vestas less sensitive to fluctuations in currencies such as the USD relative to EUR.” In other words, given that Vestas cannot afford to hold the line on exchange-rate-related cost increases, but will be rendered significantly less competitive if it passes them through, localizing production in large markets to minimize exchange rate risk makes good business sense.
39
with a few exceptions – most turbine supply agreements involving turbines destined for the U.S. market are indeed priced in USD (or are at least mostly priced in USD). On its own, this fact provides little indication of how exchange rate impacts are allocated – i.e., even though a turbine is priced in USD, a turbine manufacturer could still simply raise the USD price to reflect an adverse exchange rate movement. Jabara (2009) relates, however, that exporters who price their goods in the local currency of the importer have, in general, been found to be much less likely (than those who price in their own currency) to pass through the full extent of adverse exchange rate movements. It is also important to recognize that although Vestas, for example, is based in Denmark, it is sourcing materials and components from many other countries (some of which fall outside the Euro zone), and is also manufacturing finished goods in other countries (again, some of which fall outside of the Euro zone). Furthermore, some of the commodities and other materials that Vestas must purchase in order to manufacture wind turbines may already be priced in USD, due to its status as an international reserve currency. This globalization of the manufacturing process, which Jabara (2009) refers to as “cross-border production,” could also limit the extent of exchange rate pass-through, as a given movement in the USD/EUR exchange rate simply may not impact the cost of finished goods on a one-to-one basis. Although not focused on wind turbines, Jabara (2009) finds – both from her own analysis as well as a review of other studies – very low exchange rate pass-through to the U.S. on average. In fact, exporters seem to be favoring the U.S. in this regard: average pass-through rates to the U.S. are below 0.50 (i.e., less than 50% of exchange rate movements are passed through to U.S. import prices), compared to higher levels in other countries. A high degree of local currency pricing (i.e., more than 90% of U.S. imports are priced in USD) may contribute to this favoritism (Jabara 2009). Extrapolating Jabara’s results to wind turbines is somewhat problematic. On one hand, the fact that most turbine supply agreements are priced in USD (i.e., local currency pricing) would seem to argue for a relatively low pass-through of 0.5 or less (i.e., consistent with the overall situation in the U.S.). On the other hand, the fact that the profit margins of many wind turbine manufacturers generally rose in recent years (at least through 2008) suggests that they are not necessarily sacrificing profit by absorbing adverse exchange rate impacts.32 Lacking better guidance, our analysis assumes a middle-of-the-road exchange rate pass-through of 0.50; readers interested in examining either higher or lower pass-through can easily scale our results up or down (e.g., for 100% pass-through, simply double our $/kW estimates; for 25% pass-through, cut them in half). Finally, some mention of currency hedging and how it relates to the foregoing discussion is warranted. In its 2010 Annual Report, Vestas notes that “The business activities of Vestas involve exchange rate risks linked to the purchase and sale of goods and services outside the euro zone. Vestas pursues a policy of hedging exchange rate risks as soon as a commitment in foreign currency is agreed. However, this applies only to net exposure in each individual currency” (Vestas 2011a). It goes on to state that exchange rate risks associated with long-term
32 Of course, it is certainly a possibility that, despite their growth, profit margins are still depressed below where they would have been absent adverse exchange rate movements.

40
investments in overseas operations or subsidiaries are not hedged. In other words, Vestas – presumably along with other turbine manufacturers – does hedge short-term exchange rate risks that arise from contractual obligations, but this practice only locks in rates for contracts that have already been executed. Contracts that are still under negotiation, or that will be negotiated some time in the future, will remain subject to price fluctuations stemming from exchange rate movements until such contracts are finalized. Only once a contract has been executed can exchange rate risk be mitigated through hedging. Since the analysis in this report pertains to the impact of exchange rate risk on the price of new contracts signed over the course of a decade, short-term hedging practices are not particularly relevant to this discussion.