Embed Size (px)
Citation preview

HAL Id: hal-01650259https://hal.inria.fr/hal-01650259
Submitted on 28 Nov 2017
HAL is a multi-disciplinary open accessarchive for the deposit and dissemination of sci-entific research documents, whether they are pub-lished or not. The documents may come fromteaching and research institutions in France orabroad, or from public or private research centers.
L’archive ouverte pluridisciplinaire HAL, estdestinée au dépôt et à la diffusion de documentsscientifiques de niveau recherche, publiés ou non,émanant des établissements d’enseignement et derecherche français ou étrangers, des laboratoirespublics ou privés.
Understanding the Use of The Vistorian:Complementing Logs with Context Mini-Questionnaires
Vanessa Serrano Molinero, Benjamin Bach, Catherine Plaisant, NicoleDufournaud, Jean-Daniel Fekete
To cite this version:Vanessa Serrano Molinero, Benjamin Bach, Catherine Plaisant, Nicole Dufournaud, Jean-DanielFekete. Understanding the Use of The Vistorian: Complementing Logs with Context Mini-Questionnaires. Visualization for the Digital Humanities, Oct 2017, Phoenix, United States. �hal-01650259�
Understanding the Use of The Vistorian:Complementing Logs with Context Mini-Questionnaires
Vanessa Serrano Molinero*
IQS School of Management, SpainBenjamin Bach†
Univ. of Edinburgh, UKCatherine Plaisant‡
Univ. of Maryland, USANicole Dufournaud§
EHESS, France
Jean-Daniel Fekete¶
Inria, France
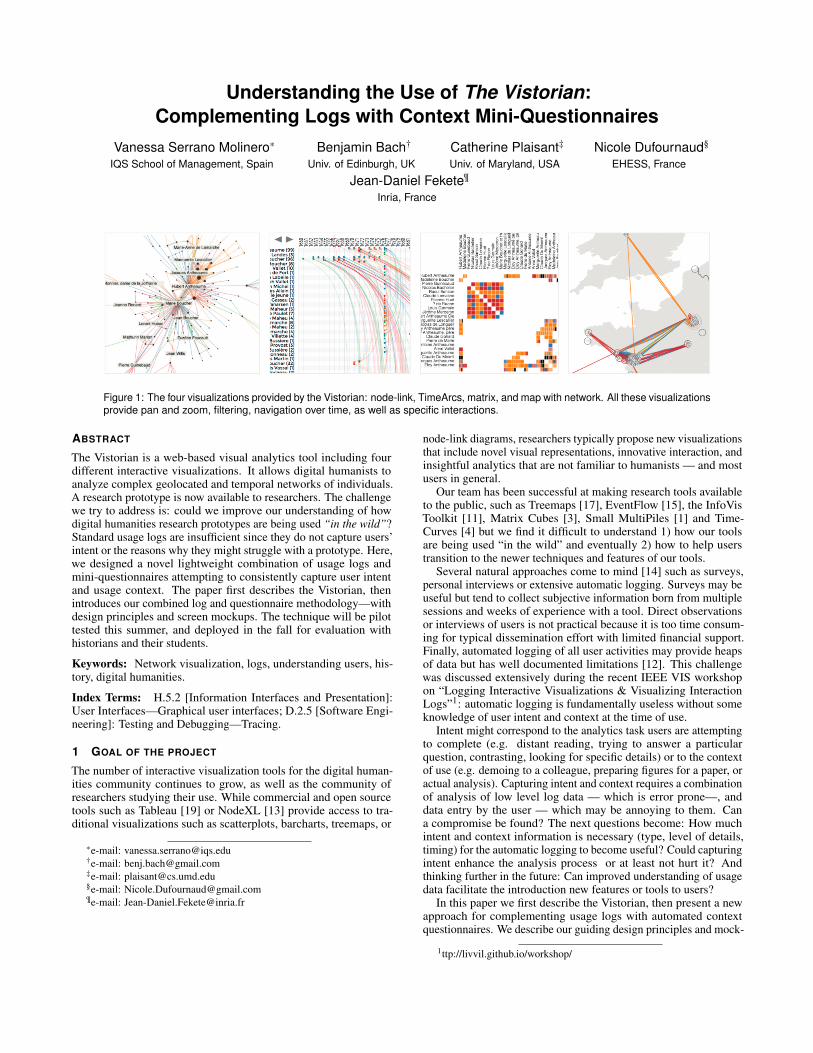
Figure 1: The four visualizations provided by the Vistorian: node-link, TimeArcs, matrix, and map with network. All these visualizationsprovide pan and zoom, filtering, navigation over time, as well as specific interactions.
ABSTRACT
The Vistorian is a web-based visual analytics tool including fourdifferent interactive visualizations. It allows digital humanists toanalyze complex geolocated and temporal networks of individuals.A research prototype is now available to researchers. The challengewe try to address is: could we improve our understanding of howdigital humanities research prototypes are being used “in the wild”?Standard usage logs are insufficient since they do not capture users’intent or the reasons why they might struggle with a prototype. Here,we designed a novel lightweight combination of usage logs andmini-questionnaires attempting to consistently capture user intentand usage context. The paper first describes the Vistorian, thenintroduces our combined log and questionnaire methodology—withdesign principles and screen mockups. The technique will be pilottested this summer, and deployed in the fall for evaluation withhistorians and their students.
Keywords: Network visualization, logs, understanding users, his-tory, digital humanities.
Index Terms: H.5.2 [Information Interfaces and Presentation]:User Interfaces—Graphical user interfaces; D.2.5 [Software Engi-neering]: Testing and Debugging—Tracing.
1 GOAL OF THE PROJECT
The number of interactive visualization tools for the digital human-ities community continues to grow, as well as the community ofresearchers studying their use. While commercial and open sourcetools such as Tableau [19] or NodeXL [13] provide access to tra-ditional visualizations such as scatterplots, barcharts, treemaps, or
*e-mail: [email protected]†e-mail: [email protected]‡e-mail: [email protected]§e-mail: [email protected]¶e-mail: [email protected]
node-link diagrams, researchers typically propose new visualizationsthat include novel visual representations, innovative interaction, andinsightful analytics that are not familiar to humanists — and mostusers in general.
Our team has been successful at making research tools availableto the public, such as Treemaps [17], EventFlow [15], the InfoVisToolkit [11], Matrix Cubes [3], Small MultiPiles [1] and Time-Curves [4] but we find it difficult to understand 1) how our toolsare being used “in the wild” and eventually 2) how to help userstransition to the newer techniques and features of our tools.
Several natural approaches come to mind [14] such as surveys,personal interviews or extensive automatic logging. Surveys may beuseful but tend to collect subjective information born from multiplesessions and weeks of experience with a tool. Direct observationsor interviews of users is not practical because it is too time consum-ing for typical dissemination effort with limited financial support.Finally, automated logging of all user activities may provide heapsof data but has well documented limitations [12]. This challengewas discussed extensively during the recent IEEE VIS workshopon “Logging Interactive Visualizations & Visualizing InteractionLogs”1: automatic logging is fundamentally useless without someknowledge of user intent and context at the time of use.
Intent might correspond to the analytics task users are attemptingto complete (e.g. distant reading, trying to answer a particularquestion, contrasting, looking for specific details) or to the contextof use (e.g. demoing to a colleague, preparing figures for a paper, oractual analysis). Capturing intent and context requires a combinationof analysis of low level log data — which is error prone—, anddata entry by the user — which may be annoying to them. Cana compromise be found? The next questions become: How muchintent and context information is necessary (type, level of details,timing) for the automatic logging to become useful? Could capturingintent enhance the analysis process or at least not hurt it? Andthinking further in the future: Can improved understanding of usagedata facilitate the introduction new features or tools to users?
In this paper we first describe the Vistorian, then present a newapproach for complementing usage logs with automated contextquestionnaires. We describe our guiding design principles and mock-
1ttp://livvil.github.io/workshop/

Figure 2: Data table (linktable) in the Vistorian, with table headersassigning network semantics to columns.
ups of the interface. The technique will be pilot tested and iterativelyrefined this summer, and deployed in the fall. Our hope is to showthat this lightweight technique is well adapted to monitoring andunderstanding the use of new tools in the historian community, andthe digital humanities community in general.
2 THE VISTORIAN
The Vistorian (http://vistorian.net) allows professional his-torians and students to analyze complex geolocated and multivariatenetworks of individuals varying over time [2]. Fig. 1 shows thefour current visualizations with a social network: node-link diagram,time arcs [8], adjacency matrix, and a map with the links overlaid.The latter allows visualizing networks where entities are geolocatede.g. networks made of correspondence letters between actors mov-ing in space, such as the Republic of Letters [7]. Link colors couldindicate a type of letter, or more generally relation types (e.g. family,work, finance).
Network analysis and visualization have recently become popularamong historians. Other visualizations than node-link diagrams arenot yet part of their standard method, and visualizations are typicallyused to illustrate findings rather than to explore data. The Vistorianaims to provide a set of network visualization techniques standardin information visualization but not available in present tools suchas Gephi [5].
To match its particular audience—domain scientists with little orno experience in computing—the Vistorian is based on four designprinciples: simplicity, privacy, openness and extensibility: inter-face and data handling has been kept as simple as possible withno requirement to write code or perform complex specification op-erations. Though the Vistorian is an online platform, it functionswithout server in the back-end, except for the file server hostingthe pages. Instead, user’s data is stored in the persistent local stor-age of the browser, remaining private on the user’s machine. Onlywhen clearing the browser cache, data gets deleted. Finally, theVistorian is open source (https://github.com/networkcube/networkcube) and integrated into the networkcube project [2]. Theunderlying architecture allows fast prototyping and integration ofnovel visualizations in D3 and WebGL which are then available toeveryone using the the Vistorian online.
2.1 Using the VistorianTo use the Vistorian, historians provide one or two tables: a node-table containing information about the network nodes (e.g., name,location, type) and/or a link-table (source, target, type, times-tamp, etc.). Tables are uploaded as csv files and manually as-signed network semantics (e.g. source node, target node, linkweight, Fig. 2). If the data contains geographic locations—names ofcities, places, and countries—the Vistorian searches a geonames ser-vice (currently https://nominatim.openstreetmap.org) andretrieves the places’ coordinates according to a best-match strategy.
Figure 3: Multiple views in the Vistorian (from left to right): legend,node-link, matrix.
Users can also correct geographical coordinates by specifying longi-tude/latitude directly in the data table, or by helping the geonameservice by regularizing place names (e.g. Brest, France).
After assigning semantics to columns, a menu list (Fig. 2, left)shows the individual visualizations and combined view configura-tions available. Clicking on one of the icons opens a new tab in thebrowser with that visualization plus a legend. For example, Fig. 3shows a split view with a node-link and a matrix visualization forthe same network. Hovering over the elements in one visualizationhighlights elements in the respective other view; moving the time-slider (the gray bar above the visualizations) filter the time. It can besynchronized across the views if desired. Elements can be filtered,and different colors can be applied from the legend. Interactionsrelated to these filtering and coloring are automatically propagatedto all Vistorian views currently open in the browser, i.e. across alltabs and windows.
As each view in the Vistorian runs in its own tab or windowusers can open the visualizations they require for a specific task,eventually making use of multiple screens and large displays, whilemaintaining full brushing-and-linking functionality.
2.2 Usage Scenario
A typical usage scenario with the Vistorian involves the followingsteps: loading data (linktable, nodetable or both), assigning a se-mantic to appropriate columns, and opening visualizations. Then,exploration can be conducted from one or several visualizations.For example, Fig. 4 shows the non-standard “Time Arcs” visualiza-tion [8] used to explore the social network of a merchant in France inthe 17th century [10], extracted from legal acts preserved by Frencharchives. According to standard prejudice, women were not active incommerce at that time, or maybe trading locally and at a short scale.The visualization reveals exactly the contrary: the network changedsubstantially year after year, according to the kind of trade MarieBoucher conducts. The registers where these trades are recordedmention boats full of wheat traded with the Netherlands, and armingand sending ships to the Caribbeans. The TimeArcs visualizationis more appropriate than a node-link diagram filtered by time (asshown in Fig. 5) since it reveals the whole activity evolution in onechart, up to the decreasing activity towards the end of her life.
This example illustrates the value of of the Vistorian to assessthe evolution of the activity of a person. However, it has requiredmany trials and errors for our historian collaborator to learn theVistorian and its visualizations, and understand which visualiza-tion is appropriate for which question. We want to understand themain challenges historians face when learning the Vistorian andin what terms they express their questions: We are hopeful thatlogs and context mini-questionnaire will provide us a better level ofunderstanding.

Figure 4: The evolution of the social network of Marie Boucher (bottom line), a merchant in the 17th Century in France, visualized using the TimeArcs technique [8]. The links are colored according to the type of relations as shown in the legend and filtering boxes on the left pane.
Figure 5: Exploring temporal periods of the network by defining rangeson the time-slider.
3 COMPLEMENTING LOGS WITH CONTEXT MINI-QUESTIONNAIRES
We will now describe how we intent to understand how the Visto-rian is used “in the wild” using a combination of logs and mini-questionnaires triggered by the use of the tool.
The design of the usage logs is fairly standard in informationvisualization, as we collect events generated by user activities. Weused a two pronged approach. Some members of our team listedwhat could be collected easily (e.g. buttons pressed and optionschosen), while others listed high level concepts we wanted to beable to capture (e.g. detecting different work sessions from the sameuser) and questions we had (e.g. are users using the matrix for smalldatasets too? Do they make use the time-zoom to animate overtime at all? Rarely? A lot?). Additional events were captured orgenerated from low-level ones to match our needs. We designed ahierarchy of events to organize low level events so we could laterexport the data into an event analytic tool such as EventFlow [15].Some of the events captured correspond to when mini-questionnairesare answered, or when they remain unanswered after a certain delay.
3.1 LoggingOur logging infrastructure relies on two components: a trace li-brary and a web server recording traces and serving accesses tothe traces. We have been using this infrastructure for severalyears and it is available open source at https://github.com/INRIA/intertrace. The trace library most main function is:traceEvent(category, action, label, value).
The parameters are transmitted to the server to be recorded withtwo additional information: a session identifier and a time-stamp
(absolute time with millisecond accuracy). The category classifiesthe event purpose (e.g. sent by the tracer itself, or from the browser’sbehavior, a widget, a lower-level interaction, etc.), the action is thename of the function traced (e.g. color-node), the label is optionaland can provide details about the action (e.g. the identifier of thenode), and the value can provide additional information (e.g. thenew color assigned to the node).
In the case of the Vistorian, the trace is only sent when users havegiven their permission to be logged, and the session identifier is madeof a unique identifier (UUID) concatenated with the identifier of thevisualized network. Therefore, we can monitor the activity of usersworking on specific datasets. The session identifier is created onceand saved as a cookie to identify sessions over multiple connectionsover days or months. We explicitly ask users who agree to participatefor their session identifiers and keep them safely separately from thetrace database.
3.2 Mini-QuestionnairesTo capture user intent and usage context we designed mini-questionnaires used the following principles:
Provide incentive to answer. This may be the most important prin-ciple: there should be some type of direct benefit to the userfor providing intent and context to the research team. In thecase of the Vistorian we linked the mini questionnaires with anew feature that emails users a screenshot of the application.In the future, as an even higher incentive, we plan to includestate information so users could go back to the correspondingscreen.
Use safe and flexible recording method. From prior experiencewith the release of digital humanities research prototypes inthe wild [6, 9, 16] we have learned that 1) users only use proto-types or save comments if they are entirely confident that theirwork will not be lost, and 2) they are also worried about sav-ing research materials on unknown servers or in the hands ofuntrusted individuals. For that reason we decided to use emailas a communication mechanism. It is familiar, its mechanismand limitations are understood, and all parties receiving theinformation are clearly identified (and customizable).

Figure 6: Mockup of the Mini-Questionnaire to capture context infor-mation, for use in the Vistorian. The mini-questionnaire is taggedto the “mail me a screenshot” function, providing incentive. A singlequestion is added with a small number of options, and in most casesit can be answered in a single action (one double click). If the answeris [Analyze data] then part 2 (Fig. 7) is displayed.
Use short questionnaires. Digital Humanities users (like mostusers) are busy doing their work, do not want to be botheredby lengthy questionnaires, and do not want to be interruptedoften. Therefore the proposed questionnaires are very shorts(about 10 buttons maximum for questions and options seemeda good 1st number.)
Provide one-click shortcuts. Even if the questionnaires are short,shortcuts reduce user burden.
Allow users to skip the questionnaire. Users should be allowedto skip when too busy.
Complement the event log but remain independent While theinformation from the questionnaires relates to the detailedactivity recorded in the logs it should remain usable on itsown. Conversely, the log should not rely on users answering aquestionnaire.
Two new buttons were added to each screen of the Visto-rian interface: [Mail me a screenshot] and [Report end ofactivity]. The basic mini-questionnaire is displayed when usersask for a screenshot (Fig. 6). The single question of the basic ques-tionnaire is designed to allow us to separate the valuable log data(i.e. the period of analysis) from all the many other types of usethat occur with research software (i.e. testing, bug reporting, de-mos, training). When users actually answer “analyze data” a secondmini-questionnaire is provided (Fig. 7). In this early phase of theresearch we will rely on open ended comments to gather informationon analysis activities. This will later be replaced by more specificquestions based on coded open ended comments.
A simpler variant of the questionnaire (without the screenshotoptions) is displayed when users click on the [Report end ofactivity] or after a period of inactivity has been detected.
Following a Multidimensional In-depth Long-term Case Studiesmethodology [18] we ask users of the Vistorian who agree to partic-ipate in our case study to be first interviewed for us to understand
1 2 3 4 5 6 7 8 9 10
Figure 7: Mockup of the second part of the Mini-Questionnaire.
their goals. They are asked to sign an approved user consent formexplaining that logs, screenshots and their comments will only besent to us (but that they can change their mind later on and stopparticipating); that all the log data remains anonymous and we willtreat their email comments or screenshots as confidential unless theygive express consent for specific material (to be used later on, e.g.in a publication). We will also inform them that they will be giventhe choice to be named/thanked explicitly in our publications—ornot if they want to remain anonymous.
4 DISCUSSION AND CONCLUSION
We hope that this novel hybrid method with logs, mini mini-questionnaires and screenshots will allow us to better understand thequestions historians are trying to address, the difficulties they face;and to determine the best ways to explain new visualizations to themappropriately for different contexts and data. Logging alone cannotprovide us this information and interviews cannot realistically beconducted with enough users.
In turn we hope that it will help facilitate the adoption of advancedvisualization tools by historians who have complex questions anddata but are not trained to manage this data and use visualizations asexploration tools.
In this paper we described the Vistorian, a tool developed for his-torians to analyze complex network data, and a lightweight approachto complement automatic usage logging with min-questionnaires.While this work with historians is in its early stages we believe it mayalso useful for the evaluation of other digital humanities projects,and potentially any visual analytics projects. We hope this methodmay in turn increase the likelihood of successful dissemination ofnovel visualization techniques.
ACKNOWLEDGMENTS
We thank Inria and the Labex Digicosme for providing support forCatherine Plaisant’s invited researcher position during the summerof 2017.

REFERENCES
[1] B. Bach, N. Henry-Riche, T. Dwyer, T. Madhyastha, J.-D. Fekete, andT. Grabowski. Small MultiPiles: Piling Time to Explore TemporalPatterns in Dynamic Networks. In Computer Graphics Forum, vol. 34,pp. 31–40. Wiley Online Library, 2015. doi: 10.1111/cgf.12615
[2] B. Bach, N. Henry Riche, R. Fernandez, E. Giannisakis, B. Lee, andJ.-D. Fekete. NetworkCube: Bringing Dynamic Network Visualiza-tions to Domain Scientists. Posters of the Conference on InformationVisualization (InfoVis), Oct. 2015. Poster.
[3] B. Bach, E. Pietriga, and J.-D. Fekete. Visualizing Dynamic Networkswith Matrix Cubes. In Proceedings of the SIGCHI Conference onHuman Factors in Computing Systems, CHI ’14, pp. 877–886. ACM,New York, NY, USA, 2014. doi: 10.1145/2556288.2557010
[4] B. Bach, C. Shi, N. Heulot, T. Madhyastha, T. Grabowski, and P. Drag-icevic. Time curves: Folding time to visualize patterns of temporalevolution in data. IEEE transactions on visualization and computergraphics, 22(1):559–568, 2016. doi: 10.1109/TVCG.2015.2467851
[5] M. Bastian, S. Heymann, and M. Jacomy. Gephi: An open sourcesoftware for exploring and manipulating networks, 2009.
[6] N. Boukhelifa, M. Bryant, N. Bulatovic, I. Cukic, J.-D. Fekete,M. Knezevic, J. Lehmann, D. Stuart, and C. Thiel. The CENDARIInfrastructure. J. Comput. Cult. Herit., 2017. to appear.
[7] G. Ceserani. Interactive Visualizations for British Architects on theGrand Tour in eighteenth-century Italy. Stanford Digital Repository,2015.
[8] T. N. Dang, N. Pendar, and A. G. Forbes. TimeArcs: VisualizingFluctuations in Dynamic Networks. Computer Graphics Forum, 2016.doi: 10.1111/cgf.12882
[9] A. Don, E. Zheleva, M. Gregory, S. Tarkan, L. Auvil, T. Clement,B. Shneiderman, and C. Plaisant. Discovering interesting usage pat-terns in text collections: Integrating text mining with visualization.In Proceedings of the Sixteenth ACM Conference on Conference onInformation and Knowledge Management, CIKM ’07, pp. 213–222.ACM, New York, NY, USA, 2007. doi: 10.1145/1321440.1321473
[10] N. Dufournaud, B. Michon, B. Bach, and P. Cristofoli. L’analyse desreseaux, une aide a penser: reflexions sur les strategies economiqueet sociale de Marie Boucher, marchande a Nantes au XVIIe siecle.In D. Picco, ed., Femmes et reseaux dans les societes modernes etcontemporaines. Realites et representations. PU Bordeaux, Bordeaux,to appear.
[11] J.-D. Fekete. The InfoVis Toolkit. In I. Press, ed., Proceedings of theIEEE Symposium on Information Visualization, pp. 167–174. IEEEComputer Society, Austin, TX, United States, Oct. 2004. doi: 10.1109/INFOVIS.2004.64
[12] C. Grimes, D. Tang, and D. Russell. Query logs alone are not enough.In WWW 2007 Workshop on Query Log Analysis: Social and Techno-logical Changes, 2007.
[13] D. Hansen, B. Shneiderman, and M. A. Smith. Analyzing social medianetworks with NodeXL: Insights from a connected world. MorganKaufmann, 2010.
[14] H. Lam, E. Bertini, P. Isenberg, C. Plaisant, and S. Carpendale. Em-pirical Studies in Information Visualization: Seven Scenarios. IEEETransactions on Visualization and Computer Graphics, 18(9):1520–1536, 2012. doi: 10.1109/TVCG.2011.279
[15] M. Monroe, R. Lan, H. Lee, C. Plaisant, and B. Shneiderman. Temporalevent sequence simplification. IEEE Transactions on Visualization andComputer Graphics, 19(12):2227–2236, Dec. 2013. doi: 10.1109/TVCG.2013.200
[16] C. Plaisant, J. Rose, B. Yu, L. Auvil, M. G. Kirschenbaum, M. N.Smith, T. Clement, and G. Lord. Exploring erotics in emily dickinson’scorrespondence with text mining and visual interfaces. In Proceedingsof the 6th ACM/IEEE-CS Joint Conference on Digital Libraries, JCDL’06, pp. 141–150. ACM, New York, NY, USA, 2006. doi: 10.1145/1141753.1141781
[17] B. Shneiderman. Tree visualization with tree-maps: 2-d space-fillingapproach. ACM Trans. Graph., 11(1):92–99, Jan. 1992. doi: 10.1145/102377.115768
[18] B. Shneiderman and C. Plaisant. Strategies for evaluating informationvisualization tools: Multi-dimensional in-depth long-term case studies.In Proceedings of the 2006 AVI Workshop on BEyond Time and Er-rors: Novel Evaluation Methods for Information Visualization, BELIV’06, pp. 1–7. ACM, New York, NY, USA, 2006. doi: 10.1145/1168149.1168158
[19] C. Stolte, D. Tang, and P. Hanrahan. Polaris: A system for query,analysis, and visualization of multidimensional databases. Commun.ACM, 51(11):75–84, Nov. 2008. doi: 10.1145/1400214.1400234