Embed Size (px)
Citation preview

1 © 2016 Ipsos.
1
Understanding the Usage & Perceptions of Genetics & Genomics in the Australian Beef & Sheep SectorsJONATHAN DODDResearch Director
DANIEL PEETERS Researcher
NICHOLL OBLITAS-COSTAResearcher
AUGUST 2016
2 © 2016 Ipsos.
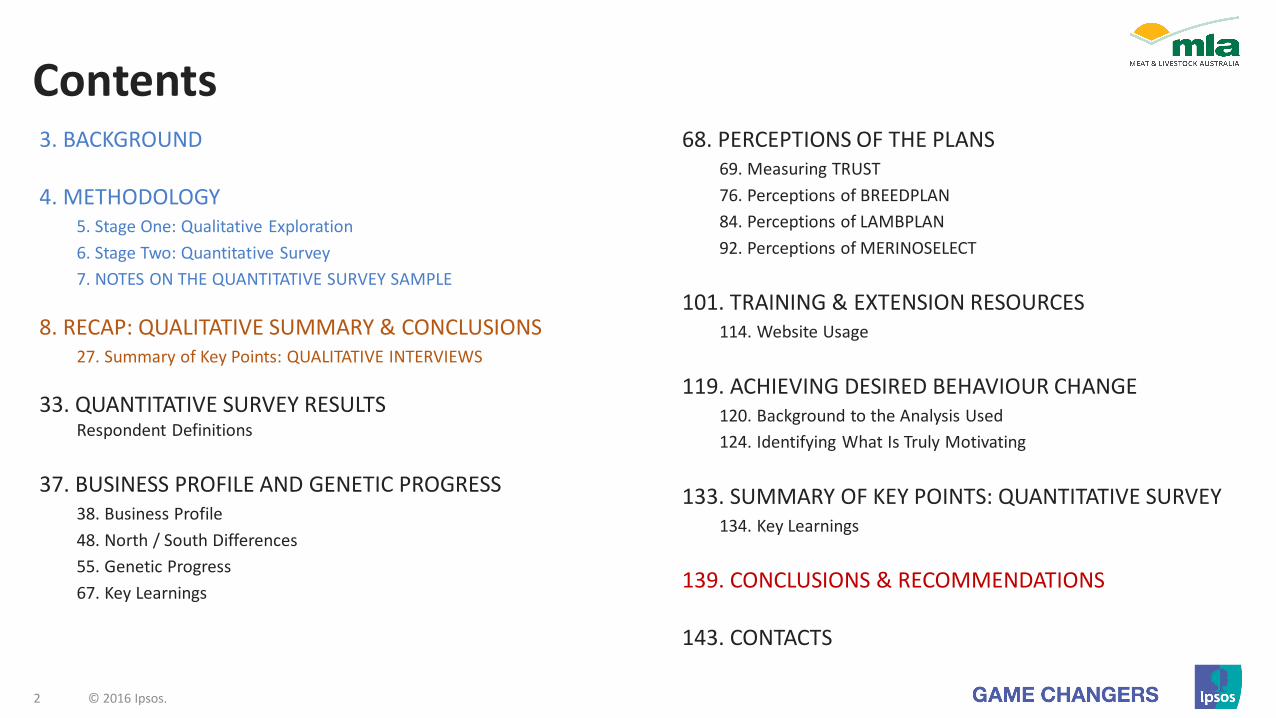
Contents3. BACKGROUND
4. METHODOLOGY5. Stage One: Qualitative Exploration
6. Stage Two: Quantitative Survey
7. NOTES ON THE QUANTITATIVE SURVEY SAMPLE
8. RECAP: QUALITATIVE SUMMARY & CONCLUSIONS27. Summary of Key Points: QUALITATIVE INTERVIEWS
33. QUANTITATIVE SURVEY RESULTSRespondent Definitions
37. BUSINESS PROFILE AND GENETIC PROGRESS38. Business Profile
48. North / South Differences
55. Genetic Progress
67. Key Learnings
68. PERCEPTIONS OF THE PLANS69. Measuring TRUST
76. Perceptions of BREEDPLAN
84. Perceptions of LAMBPLAN
92. Perceptions of MERINOSELECT
101. TRAINING & EXTENSION RESOURCES114. Website Usage
119. ACHIEVING DESIRED BEHAVIOUR CHANGE120. Background to the Analysis Used
124. Identifying What Is Truly Motivating
133. SUMMARY OF KEY POINTS: QUANTITATIVE SURVEY 134. Key Learnings
139. CONCLUSIONS & RECOMMENDATIONS
143. CONTACTS

3 © 2016 Ipsos.
BACKGROUND
MLA is a key investor in a variety of services and tools designed to improve the genetic quality of Australia’s red meat and wool industries. Three key investments are BREEDPLAN, MERINOSELECT and LAMBPLAN; usage of which can be regarded as a bellwether of MLA’s performance in extending skills throughout the industry.
However, there is a significant under-utilisation of these genetic technologies designed to assist livestock Producers in Australia to be more productive and profitable.
Therefore MLA has invested in this market research in order to inform and guide related initiatives planned to improve uptake. Overall, this research involves exploring, identifying and measuring barriers and drivers to the adoption of genetic tools and technologies to drive best-practice adoption in Australian beef and sheep meat industries.
Specific objectives are to:
Explore and identify decision-making tools Producers use when making genetic selections in their herd and / or flock and how they are using them;
Establish what motivates Producers to use genetic tools;
Establish the barriers to using genetic tools;
Explore what would encourage / make Non-Users adopt great usage of genetic technologies in their business;
Measure the incidence of cited motivators and barriers.

4 © 2016 Ipsos.
Important note
For concise reporting we have generally referred to the collective of genetic evaluation activities (BREEDPLAN – ABRI; LAMBPLAN, MERINOSELECT – MLA; and researchers AGBU, Sheep CRC) as “MLA”.
In the qualitative interviews this was not highlighted to respondents from the start as it was important to learn who the farmers believed was behind these activities, but they were always told the ‘correct’ answer by the end of their interviews.
In the quantitative survey the same applied – while they were told the research was for MLA at the outset, their perceptions as to the organisations running the activities was a key question, and again they were told the ‘correct’ answer by the end of their interviews.

5 © 2016 Ipsos.
STAGE ONE: QUALITATIVE EXPLORATION
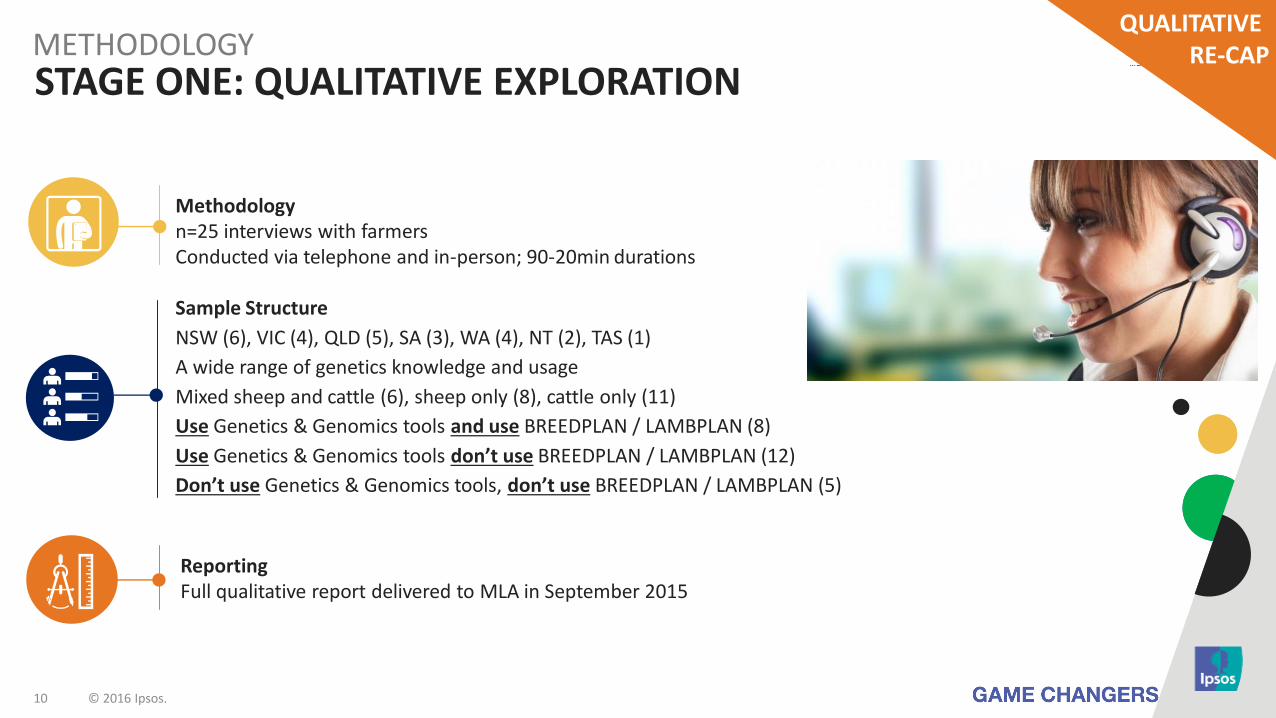
Methodologyn=25 interviews with farmers Conducted via telephone and in-person; 90-20min durations
Sample Structure
NSW (6), VIC (4), QLD (5), SA (3), WA (4), NT (2), TAS (1)
A wide range of genetics knowledge and usage
Mixed sheep and cattle (6), sheep only (8), cattle only (11)
Use Genetics & Genomics tools and use BREEDPLAN / LAMBPLAN (8)
Use Genetics & Genomics tools don’t use BREEDPLAN / LAMBPLAN (12)
Don’t use Genetics & Genomics tools, don’t use BREEDPLAN / LAMBPLAN (5)
METHODOLOGY
ReportingFull qualitative report delivered to MLA in September 2015

6 © 2016 Ipsos.
STAGE TWO: QUANTITATIVE SURVEYMETHODOLOGY
Fieldwork Dates & Method09/11/2015 – 15/11/2015Telephone interview
Sample ProviderSample provided by MLA and Breed Societies
Sample SizeTotal number of Producers (n=2,001)
Respondent ProfileCattle and sheep Producers responsible for making key breeding decisions across Australia.
Quotas used to ensure breeds were covered in proportion of stock numbers (not farm numbers).
Sample (as categorized post-interviewing; see overleaf)1,031 Cattle Producers (572 Studs; 459 Commercial; 759 BREEDPLAN Users and 272 Non-Users)
794 Sheep Producers (211 Studs; 364 Commercial; 169 LAMBPLAN Users, 119 MERINOSELECT Users)
MeasuresInterview duration: 21.6minsMargin of error (total sample): 2.19%
Response rates by state (successful / ref+success)• NSW 79%• QLD 86%• SA 67%
• TAS 67%• VIC 82%• WA 75%

7 © 2016 Ipsos.
STAGE TWO: NOTES ON THE QUANTITATIVE SURVEY SAMPLE (1)METHODOLOGY
Most of this report focuses on the differences between Users and Non-Users.
For the purposes of efficient interviewing, respondents self-identified:
• The main purpose of their operations (e.g. stud / seedstock or commercial; sheep or cattle);
• Whether they used BREEDPLAN (for cattle producers), LAMBPLAN or MERINOSELECT (for sheep).Usage not restricted to formally-signed-up PLAN members but also Commercial producers who informally used PLAN measures when making breeding or purchasing decisions.
However, in ‘real life’, Producers often have multiple farming interests, can use multiple PLANs, or have used PLANs in the past.
This means that ‘non-users’ can sometimes say they have used user-only tools, or use tools that would be expected of different Producer types.
This simply reflects the widely varied nature of farming in the ‘real world’ and does not indicate inaccuracies in the research results.

8 © 2016 Ipsos.
STAGE TWO: NOTES ON THE QUANTITATIVE SURVEY SAMPLE (2)METHODOLOGY
The variables discussed on the previous page also meant that the databases used for sampling were not always good indicators of respondents’ ‘main operations’, as indicated by the red numbers in the table below.
Therefore Ipsos and MLA collaborated to re-allocate respondents to their correct categories, with a particular focus on correctly categorizing sheep producers using neither LAMBPLAN nor MERINOSELECT into their correct status as non-users of either LAMBPLAN or MERINOSELECT (but not both). This was done by examining their main breed and their ratio of income from meat vs wool.
This means that there were some respondents whose responses were removed for some questions (because said questions were not suited to their re-allocated category) and/or not represented within the sub-sample for a given question as they may not have been asked it in the original interview due to their original category.
RE-ALLOCATED USER SEGMENTS
DATABASE CATEGORIES
TotalSheep Database
MS userSheep Database
LP userBREEDPLAN
Member ListingMLA
MembersMS-Seedstock User 81 81 0 2 21MS-Seedstock Non-User 13 0 0 0 13MS-Commercial User 38 0 0 0 38MS-Commercial Non-User 230 0 0 1 230LP-Seedstock User 95 0 95 3 18LP-Seedstock Non-User 22 4 0 2 17LP-Commercial User 74 1 0 1 74LP-Commercial Non-User 241 0 0 1 241BP-Seedstock User 544 1 4 544 80BP-Seedstock Non-User 28 0 0 15 15
BP-Commercial User 215 0 1 23 215
BP-Commercial Non-User 244 0 0 2 244
RECAP:QUALITATIVE SUMMARY & CONCLUSIONS
© 2015 Ipsos.9
10 © 2016 Ipsos.
STAGE ONE: QUALITATIVE EXPLORATION
Methodologyn=25 interviews with farmers Conducted via telephone and in-person; 90-20min durations
Sample Structure
NSW (6), VIC (4), QLD (5), SA (3), WA (4), NT (2), TAS (1)
A wide range of genetics knowledge and usage
Mixed sheep and cattle (6), sheep only (8), cattle only (11)
Use Genetics & Genomics tools and use BREEDPLAN / LAMBPLAN (8)
Use Genetics & Genomics tools don’t use BREEDPLAN / LAMBPLAN (12)
Don’t use Genetics & Genomics tools, don’t use BREEDPLAN / LAMBPLAN (5)
METHODOLOGY
ReportingFull qualitative report delivered to MLA in September 2015
QUALITATIVE RE-CAP
11 © 2016 Ipsos.
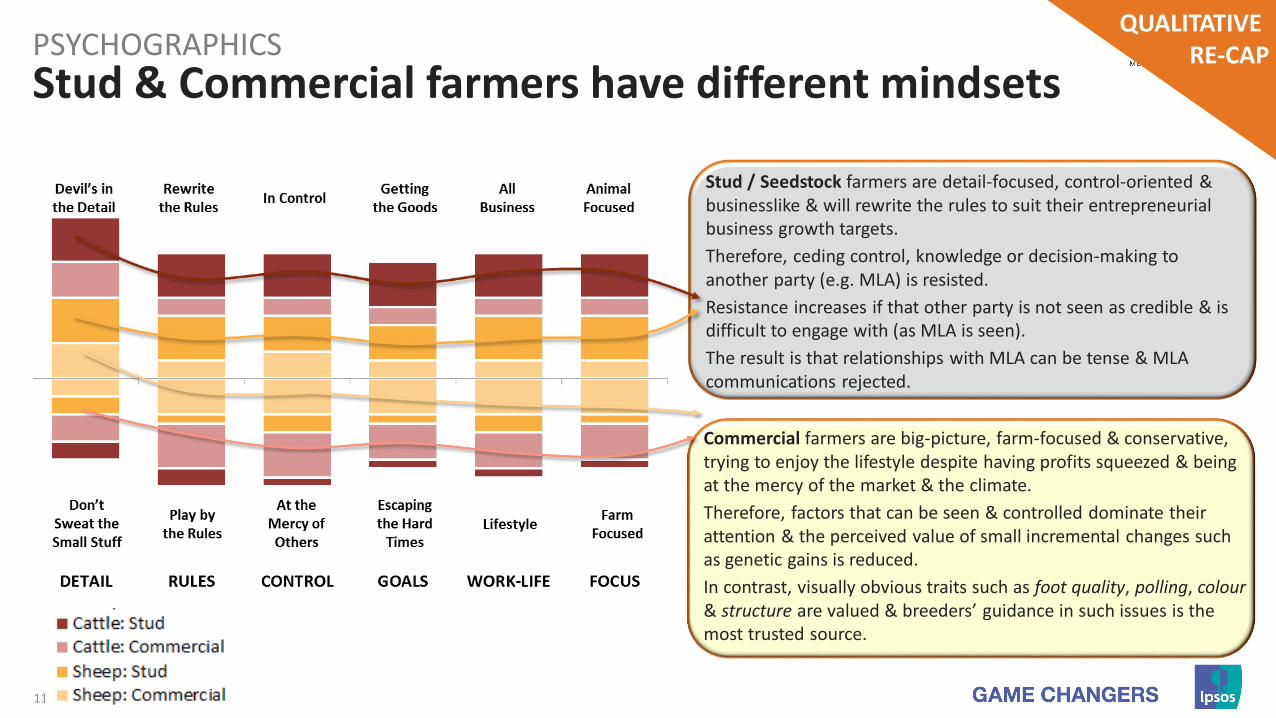
PSYCHOGRAPHICS
Stud & Commercial farmers have different mindsets
Stud / Seedstock farmers are detail-focused, control-oriented & businesslike & will rewrite the rules to suit their entrepreneurial business growth targets.
Therefore, ceding control, knowledge or decision-making to another party (e.g. MLA) is resisted.
Resistance increases if that other party is not seen as credible & is difficult to engage with (as MLA is seen).
The result is that relationships with MLA can be tense & MLA communications rejected.
Commercial farmers are big-picture, farm-focused & conservative, trying to enjoy the lifestyle despite having profits squeezed & being at the mercy of the market & the climate.
Therefore, factors that can be seen & controlled dominate their attention & the perceived value of small incremental changes such as genetic gains is reduced.
In contrast, visually obvious traits such as foot quality, polling, colour& structure are valued & breeders’ guidance in such issues is the most trusted source.
QUALITATIVE RE-CAP
12 © 2016 Ipsos.
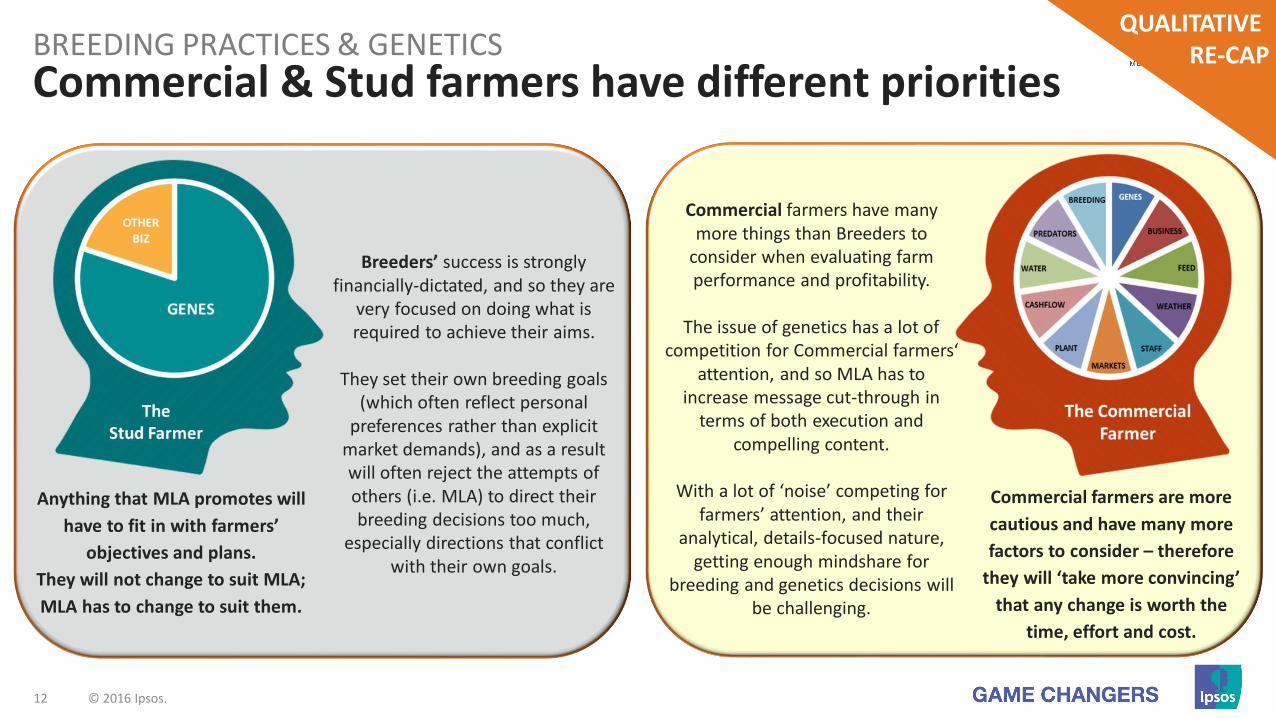
Commercial & Stud farmers have different prioritiesBREEDING PRACTICES & GENETICS
Breeders’ success is strongly financially-dictated, and so they are
very focused on doing what is required to achieve their aims.
They set their own breeding goals (which often reflect personal
preferences rather than explicit market demands), and as a result will often reject the attempts of others (i.e. MLA) to direct their breeding decisions too much,
especially directions that conflict with their own goals.
Anything that MLA promotes will
have to fit in with farmers’
objectives and plans.
They will not change to suit MLA;
MLA has to change to suit them.
Commercial farmers are more
cautious and have many more
factors to consider – therefore
they will ‘take more convincing’
that any change is worth the
time, effort and cost.
Commercial farmers have many more things than Breeders to
consider when evaluating farm performance and profitability.
The issue of genetics has a lot of competition for Commercial farmers‘
attention, and so MLA has to increase message cut-through in
terms of both execution and compelling content.
With a lot of ‘noise’ competing for farmers’ attention, and their
analytical, details-focused nature, getting enough mindshare for
breeding and genetics decisions will be challenging.
QUALITATIVE RE-CAP
13 © 2016 Ipsos.
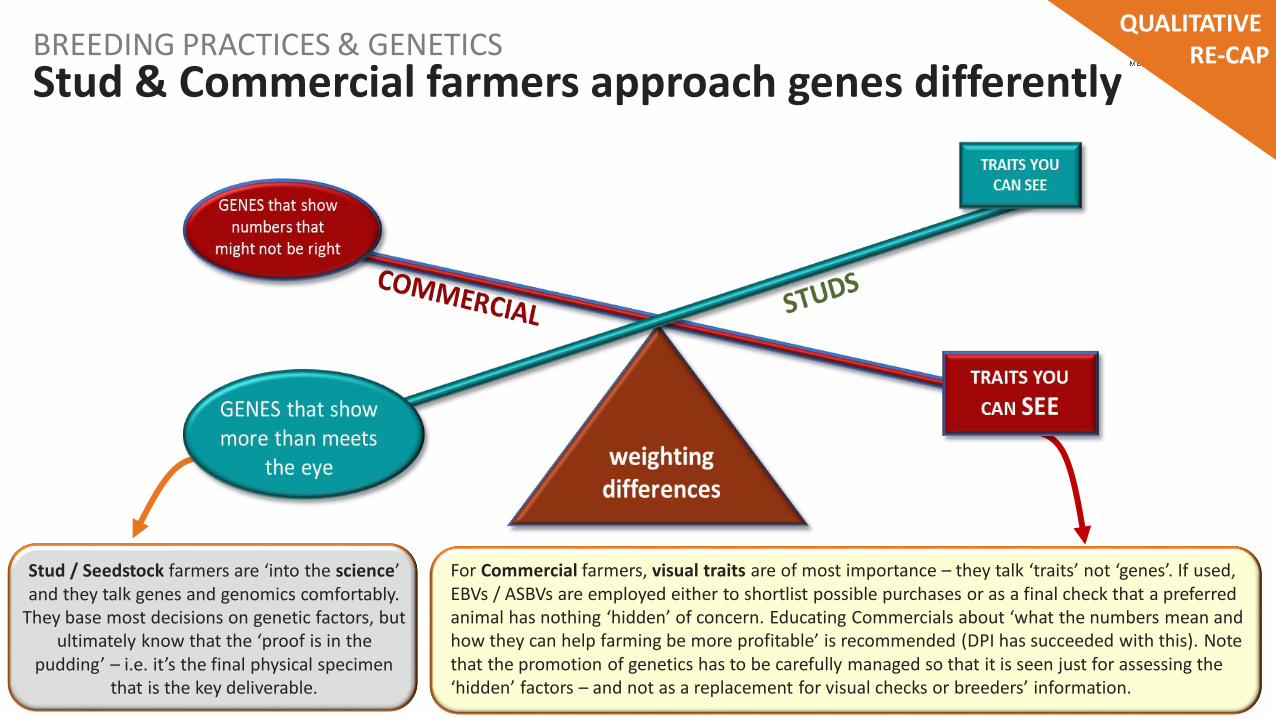
Stud & Commercial farmers approach genes differentlyBREEDING PRACTICES & GENETICS
Stud / Seedstock farmers are ‘into the science’ and they talk genes and genomics comfortably.
They base most decisions on genetic factors, but ultimately know that the ‘proof is in the
pudding’ – i.e. it’s the final physical specimen that is the key deliverable.
For Commercial farmers, visual traits are of most importance – they talk ‘traits’ not ‘genes’. If used, EBVs / ASBVs are employed either to shortlist possible purchases or as a final check that a preferred animal has nothing ‘hidden’ of concern. Educating Commercials about ‘what the numbers mean and how they can help farming be more profitable’ is recommended (DPI has succeeded with this). Note that the promotion of genetics has to be carefully managed so that it is seen just for assessing the ‘hidden’ factors – and not as a replacement for visual checks or breeders’ information.
QUALITATIVE RE-CAP
14 © 2016 Ipsos.
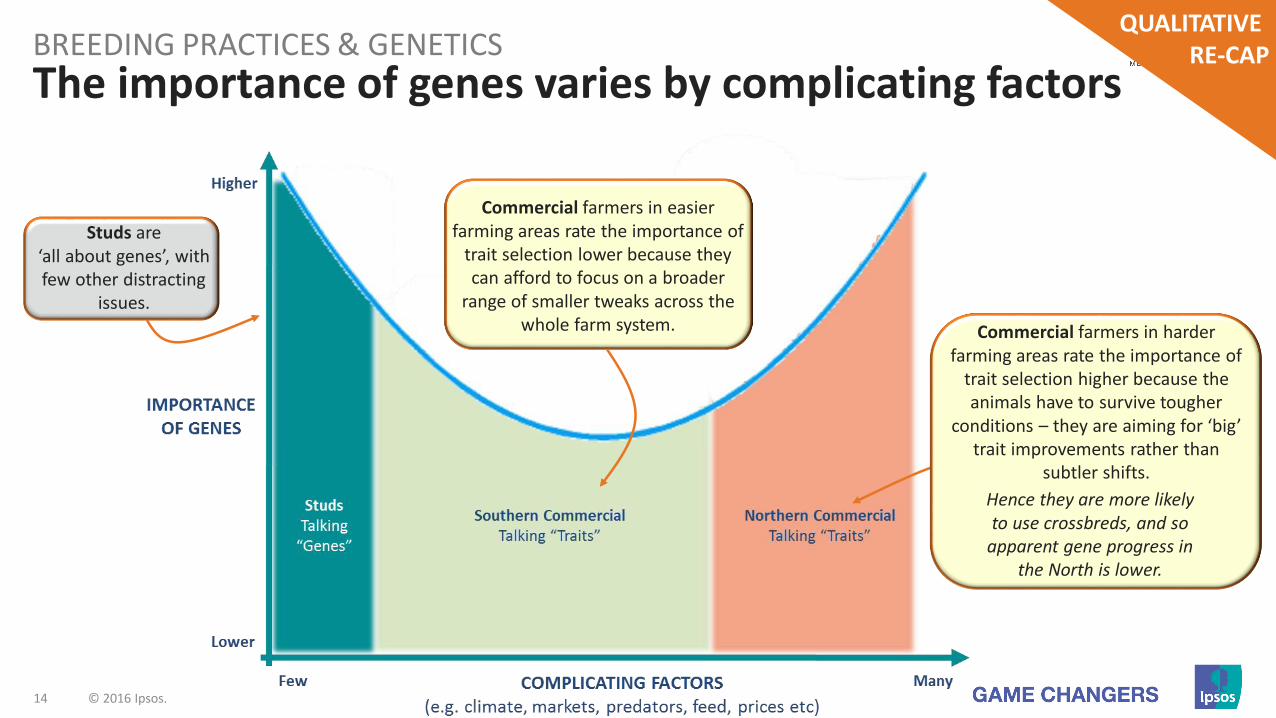
The importance of genes varies by complicating factorsBREEDING PRACTICES & GENETICS
Commercial farmers in harder farming areas rate the importance of
trait selection higher because the animals have to survive tougher
conditions – they are aiming for ‘big’ trait improvements rather than
subtler shifts.
Hence they are more likely to use crossbreds, and so
apparent gene progress in the North is lower.
Studs are ‘all about genes’, with few other distracting
issues.
Commercial farmers in easier farming areas rate the importance of
trait selection lower because they can afford to focus on a broader
range of smaller tweaks across the whole farm system.
QUALITATIVE RE-CAP

15 © 2016 Ipsos.
MainlyCommercial
MainlyStuds
As farmers learn about genetic management, they go through a honeymoon phase & appear to become less favourable towards BREEDPLAN / LAMBPLAN & MLA
BREEDPLAN & LAMBPLAN
KNOWLEDGE ABOUT EBVS / ASBVS / BREEDPLAN / LAMBPLAN / MLA
Low High
Low
High
TRUST & FAITH INEBVS / ASBVS /
BREEDPLAN /LAMBPLAN & MLA
North
SouthVariations depending on Studs’ knowledge and expectations
Once Commercial farmers start to learn about the value of genetic-based selection they appreciate it
more, especially those in harsher climates.
‘Honeymoonphase’
But there seems to comea point when so much is
learnt that the limitations and problems of BREEDPLAN
/ LAMBPLAN and MLA reduce faith in the systems.
These are usually Studs.
QUALITATIVE RE-CAP

16 © 2016 Ipsos.
BREEDPLAN & LAMBPLAN – Big Picture (i)BREEDPLAN & LAMBPLAN
There is little perceived need to learn
more about how genes-based breeding
‘works’ – what they focus on is getting
new bloodlines and the stud / ram /
dam / ewe combinations. When EBV / ASBV changes are made to fine-tune the system, the result is distrust.
Therefore, such changes need considerable amounts of communication / consultation, focusing
on how such changes are part of ongoing incremental improvements and fine-tuning – ‘making
something good even better’, rather than ‘fixing something that’s broken’.
c
The trend towards ‘versatile’ animals and cross-breeds
reduces the usefulness of BREEDPLAN / LAMBPLAN, which
are seen by some as indicative of MLA being behind the
times.
Being challenging, critical people, any
messages to them from MLA will
undergo a lot of scrutiny and, in some
cases, cynical scepticism.
These farmers have their own genetic-tracking and trait-management
systems and those of MLA are seen as less applicable, too blunt and
suffering from a questionable quality of inputted data.
The opaque ‘black-box’ nature of the back-end exacerbates distrust.
Breed societies
can be a good
gateway into
BREEDPLAN /
LAMBPLAN or a
political hornets
nest.
QUALITATIVE RE-CAP

17 © 2016 Ipsos.
BREEDPLAN & LAMBPLAN – Big Picture (ii)BREEDPLAN & LAMBPLAN
Due to a low profile and a poor image, MLA is not the natural go-to source
for information, and should consider ‘inviting’ farmers to participate,
rather than expecting them to ‘if they knew what was good for them’.
The interface, processes and
systems behind BREEDPLAN /
LAMBPLAN need to be
significantly improved and
made more transparent.
These farmers will not be drawn away
from their in-house systems, so MLA has
to be sure to promote BREEDPLAN /
LAMBPLAN as systems which will
enhance and add to their own – not as
replacements.
More evidence is
needed so that the
industry trusts that
the data are accurate
and genuine.
More work needs to
be done to find ways
of entering data more
easily and more
accurately.
At best, MLA can
be regarded as good
people who suffer
from being too
academic and out of
touch.
At worst, MLA can be
regarded as overly
politicised and self-
serving.
Although most know
that MLA has a wide
range of sometimes
valued functions,
BREEDPLAN /
LAMBPLAN have such
a high profile and
questionable value
that they taint most
perceptions of MLA.
QUALITATIVE RE-CAP
18 © 2016 Ipsos.
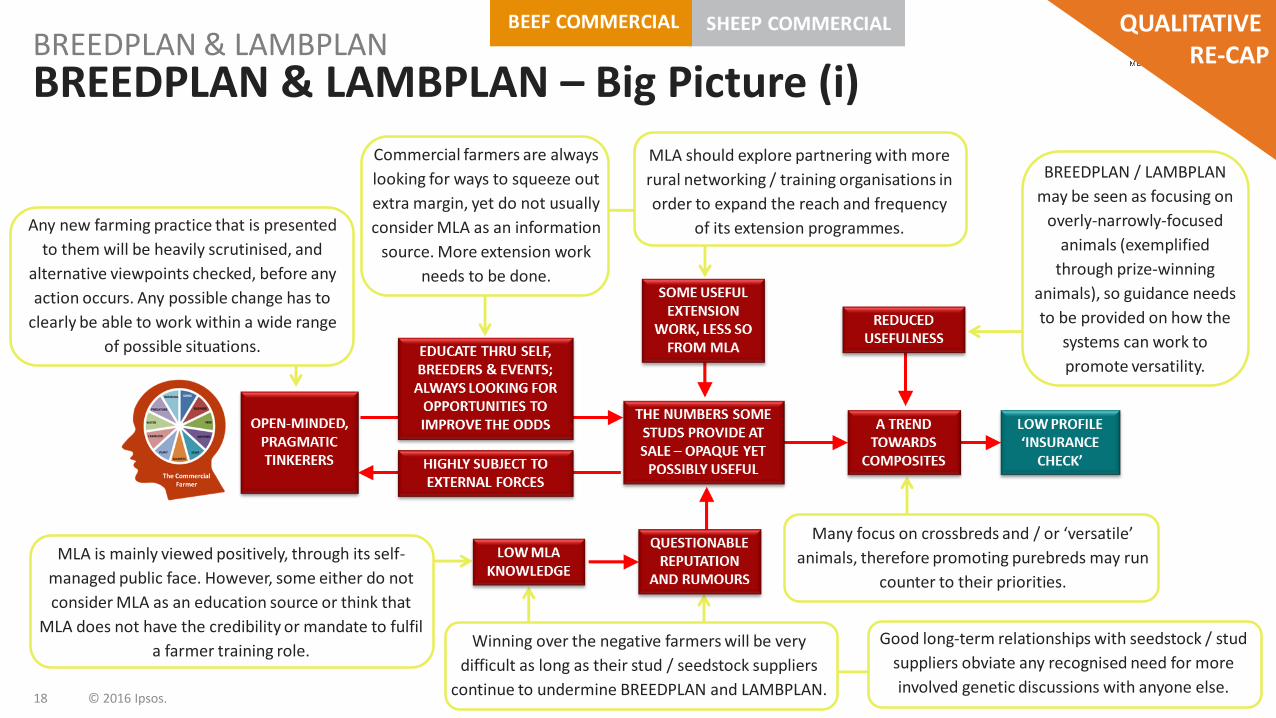
BREEDPLAN & LAMBPLAN – Big Picture (i)BREEDPLAN & LAMBPLAN
Any new farming practice that is presented
to them will be heavily scrutinised, and
alternative viewpoints checked, before any
action occurs. Any possible change has to
clearly be able to work within a wide range
of possible situations.
MLA is mainly viewed positively, through its self-
managed public face. However, some either do not
consider MLA as an education source or think that
MLA does not have the credibility or mandate to fulfil
a farmer training role.
MLA should explore partnering with more
rural networking / training organisations in
order to expand the reach and frequency
of its extension programmes.
BREEDPLAN / LAMBPLAN
may be seen as focusing on
overly-narrowly-focused
animals (exemplified
through prize-winning
animals), so guidance needs
to be provided on how the
systems can work to
promote versatility.
Winning over the negative farmers will be very
difficult as long as their stud / seedstock suppliers
continue to undermine BREEDPLAN and LAMBPLAN.
Commercial farmers are always
looking for ways to squeeze out
extra margin, yet do not usually
consider MLA as an information
source. More extension work
needs to be done.
Many focus on crossbreds and / or ‘versatile’
animals, therefore promoting purebreds may run
counter to their priorities.
Good long-term relationships with seedstock / stud
suppliers obviate any recognised need for more
involved genetic discussions with anyone else.
QUALITATIVE RE-CAP
19 © 2016 Ipsos.
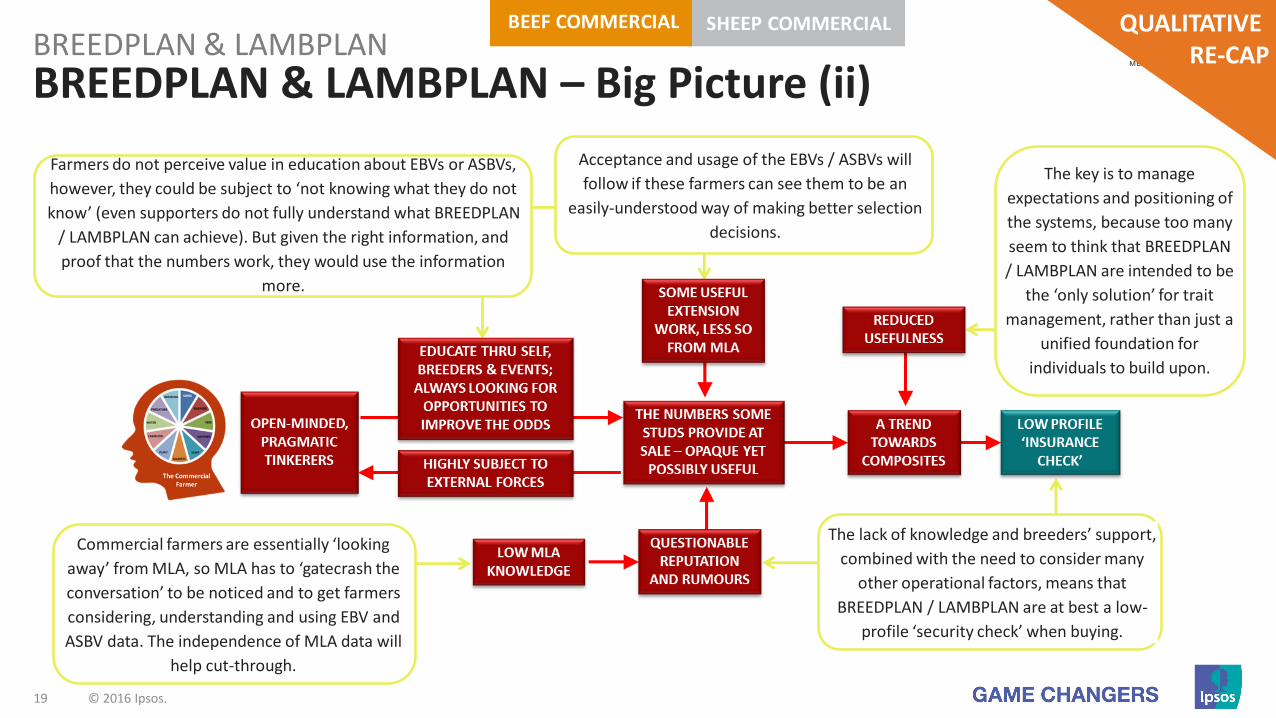
BREEDPLAN & LAMBPLAN – Big Picture (ii)BREEDPLAN & LAMBPLAN
The lack of knowledge and breeders’ support,
combined with the need to consider many
other operational factors, means that
BREEDPLAN / LAMBPLAN are at best a low-
profile ‘security check’ when buying.
Commercial farmers are essentially ‘looking
away’ from MLA, so MLA has to ‘gatecrash the
conversation’ to be noticed and to get farmers
considering, understanding and using EBV and
ASBV data. The independence of MLA data will
help cut-through.
Farmers do not perceive value in education about EBVs or ASBVs,
however, they could be subject to ‘not knowing what they do not
know’ (even supporters do not fully understand what BREEDPLAN
/ LAMBPLAN can achieve). But given the right information, and
proof that the numbers work, they would use the information
more.
Acceptance and usage of the EBVs / ASBVs will
follow if these farmers can see them to be an
easily-understood way of making better selection
decisions.
The key is to manage
expectations and positioning of
the systems, because too many
seem to think that BREEDPLAN
/ LAMBPLAN are intended to be
the ‘only solution’ for trait
management, rather than just a
unified foundation for
individuals to build upon.
QUALITATIVE RE-CAP
20 © 2016 Ipsos.
Reviewing the Promised InsightsCONCLUSIONS & RECOMMENDATIONS
Studs / Seedstock:
• Astute, financially-oriented self-managing
confident entrepreneurs.
• Genes-savvy, detail-focused & questioning.
• Animal- & sales-focused.
• Capable, self-driven, challenging.
Commercial farmers:
• Pragmatic, reactive, big-picture oriented.
• Careful, conservative, thoughtful.
• Detail-focused, working on the whole farm
system not just smaller elements.
• Capable when required.
• Hungry for knowledge that is locally &
operationally relevant.
QUALITATIVE RE-CAP
21 © 2016 Ipsos.
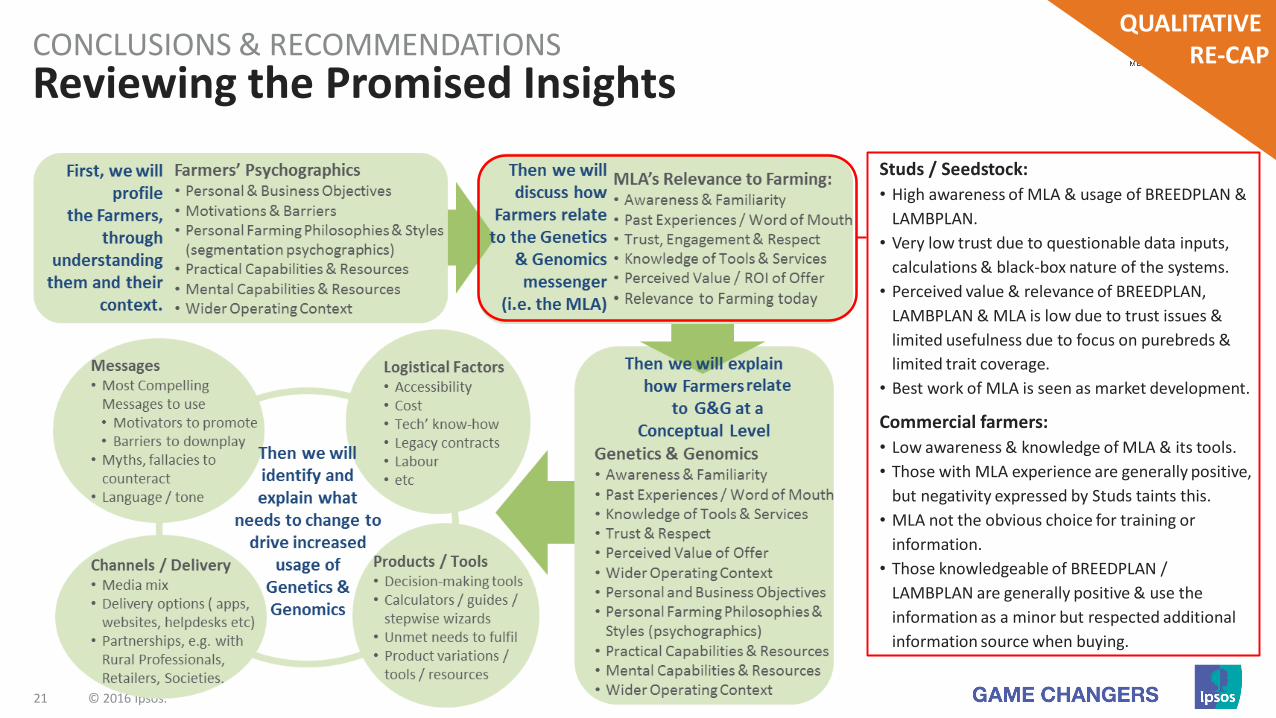
Reviewing the Promised InsightsCONCLUSIONS & RECOMMENDATIONS
Studs / Seedstock:
• High awareness of MLA & usage of BREEDPLAN &
LAMBPLAN.
• Very low trust due to questionable data inputs,
calculations & black-box nature of the systems.
• Perceived value & relevance of BREEDPLAN,
LAMBPLAN & MLA is low due to trust issues &
limited usefulness due to focus on purebreds &
limited trait coverage.
• Best work of MLA is seen as market development.
Commercial farmers:
• Low awareness & knowledge of MLA & its tools.
• Those with MLA experience are generally positive,
but negativity expressed by Studs taints this.
• MLA not the obvious choice for training or
information.
• Those knowledgeable of BREEDPLAN /
LAMBPLAN are generally positive & use the
information as a minor but respected additional
information source when buying.
QUALITATIVE RE-CAP
22 © 2016 Ipsos.
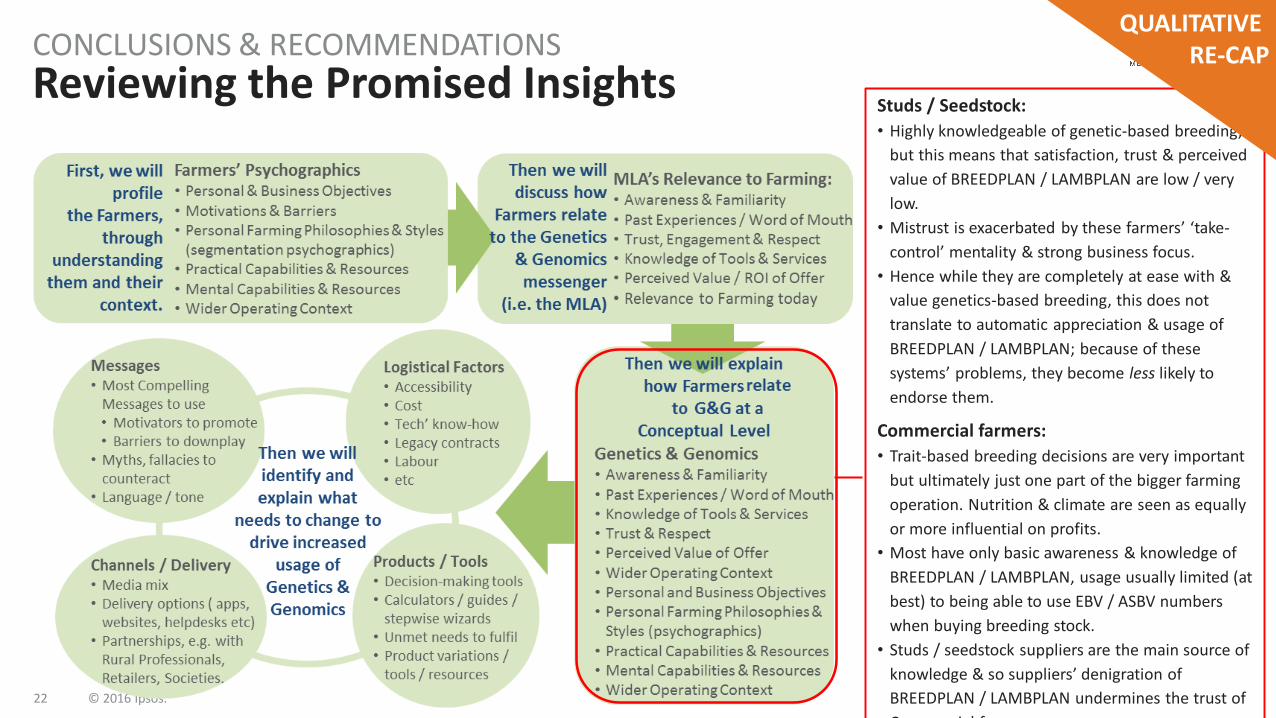
Reviewing the Promised InsightsCONCLUSIONS & RECOMMENDATIONS
Studs / Seedstock:
• Highly knowledgeable of genetic-based breeding,
but this means that satisfaction, trust & perceived
value of BREEDPLAN / LAMBPLAN are low / very
low.
• Mistrust is exacerbated by these farmers’ ‘take-
control’ mentality & strong business focus.
• Hence while they are completely at ease with &
value genetics-based breeding, this does not
translate to automatic appreciation & usage of
BREEDPLAN / LAMBPLAN; because of these
systems’ problems, they become less likely to
endorse them.
Commercial farmers:
• Trait-based breeding decisions are very important
but ultimately just one part of the bigger farming
operation. Nutrition & climate are seen as equally
or more influential on profits.
• Most have only basic awareness & knowledge of
BREEDPLAN / LAMBPLAN, usage usually limited (at
best) to being able to use EBV / ASBV numbers
when buying breeding stock.
• Studs / seedstock suppliers are the main source of
knowledge & so suppliers’ denigration of
BREEDPLAN / LAMBPLAN undermines the trust of
Commercial farmers.
QUALITATIVE RE-CAP
23 © 2016 Ipsos.
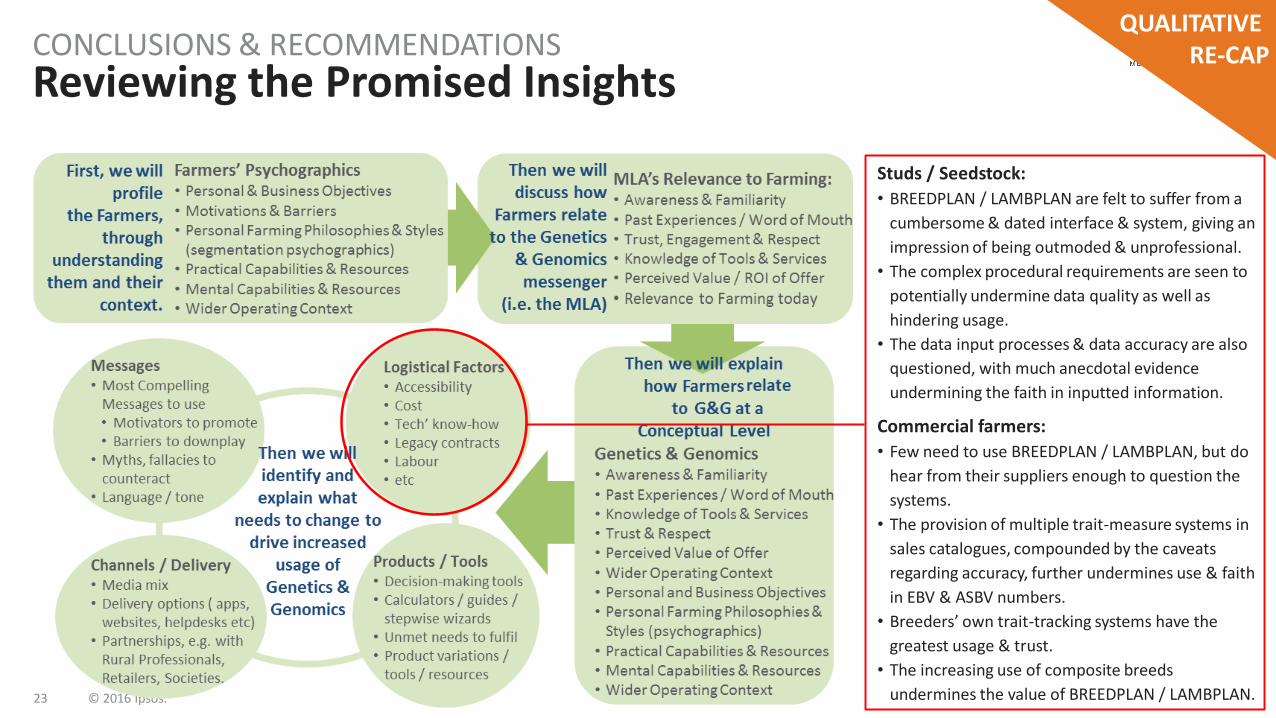
Reviewing the Promised InsightsCONCLUSIONS & RECOMMENDATIONS
Studs / Seedstock:
• BREEDPLAN / LAMBPLAN are felt to suffer from a
cumbersome & dated interface & system, giving an
impression of being outmoded & unprofessional.
• The complex procedural requirements are seen to
potentially undermine data quality as well as
hindering usage.
• The data input processes & data accuracy are also
questioned, with much anecdotal evidence
undermining the faith in inputted information.
Commercial farmers:
• Few need to use BREEDPLAN / LAMBPLAN, but do
hear from their suppliers enough to question the
systems.
• The provision of multiple trait-measure systems in
sales catalogues, compounded by the caveats
regarding accuracy, further undermines use & faith
in EBV & ASBV numbers.
• Breeders’ own trait-tracking systems have the
greatest usage & trust.
• The increasing use of composite breeds
undermines the value of BREEDPLAN / LAMBPLAN.
QUALITATIVE RE-CAP
24 © 2016 Ipsos.
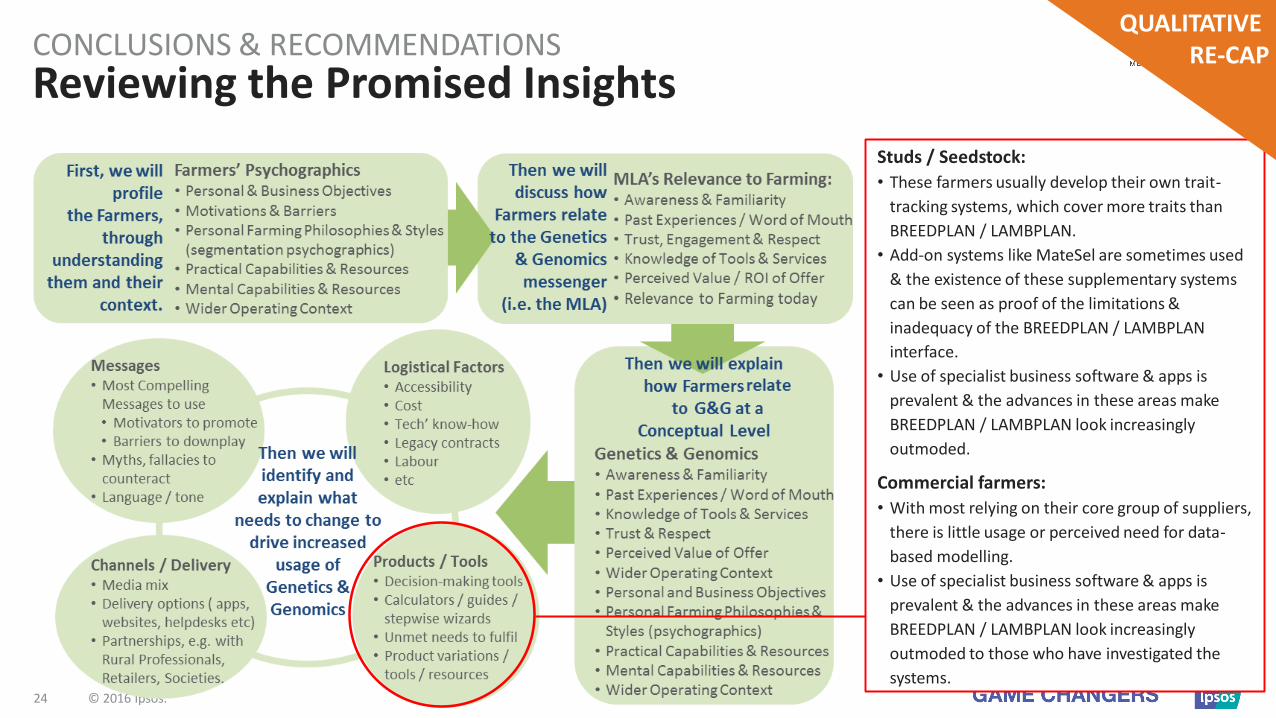
Reviewing the Promised InsightsCONCLUSIONS & RECOMMENDATIONS
Studs / Seedstock:
• These farmers usually develop their own trait-
tracking systems, which cover more traits than
BREEDPLAN / LAMBPLAN.
• Add-on systems like MateSel are sometimes used
& the existence of these supplementary systems
can be seen as proof of the limitations &
inadequacy of the BREEDPLAN / LAMBPLAN
interface.
• Use of specialist business software & apps is
prevalent & the advances in these areas make
BREEDPLAN / LAMBPLAN look increasingly
outmoded.
Commercial farmers:
• With most relying on their core group of suppliers,
there is little usage or perceived need for data-
based modelling.
• Use of specialist business software & apps is
prevalent & the advances in these areas make
BREEDPLAN / LAMBPLAN look increasingly
outmoded to those who have investigated the
systems.
QUALITATIVE RE-CAP
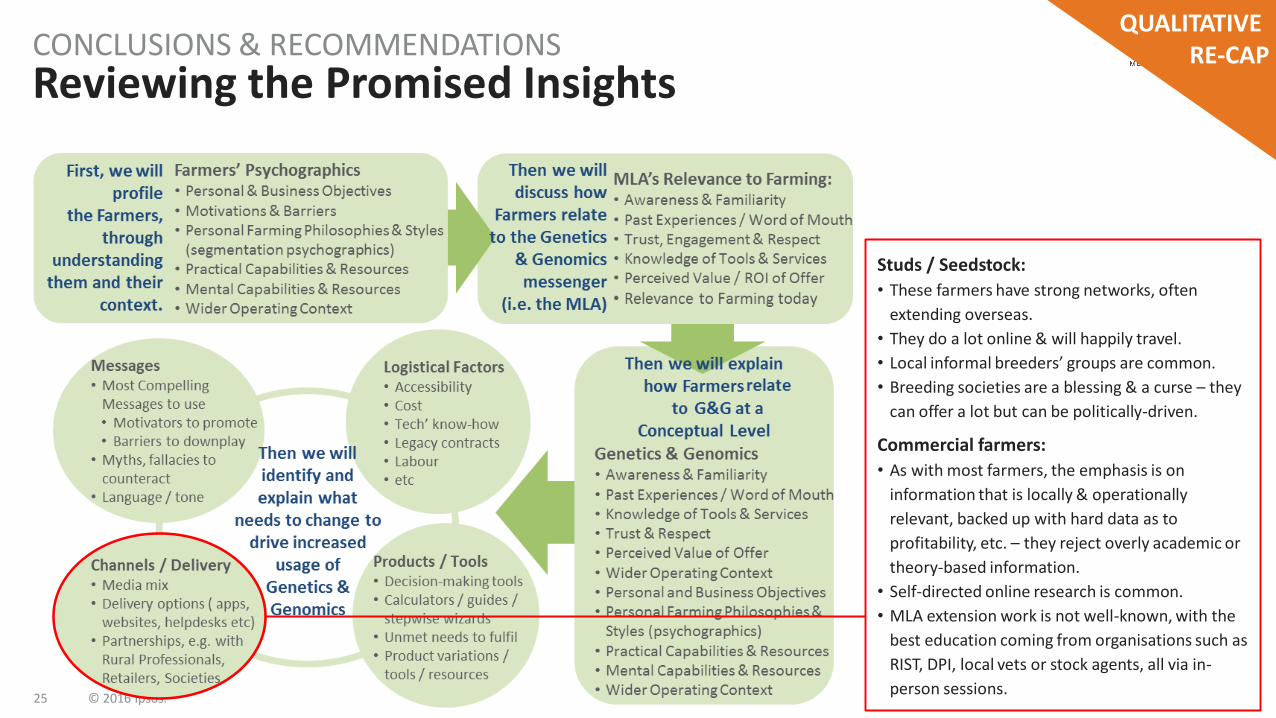
25 © 2016 Ipsos.
Reviewing the Promised InsightsCONCLUSIONS & RECOMMENDATIONS
Studs / Seedstock:
• These farmers have strong networks, often
extending overseas.
• They do a lot online & will happily travel.
• Local informal breeders’ groups are common.
• Breeding societies are a blessing & a curse – they
can offer a lot but can be politically-driven.
Commercial farmers:
• As with most farmers, the emphasis is on
information that is locally & operationally
relevant, backed up with hard data as to
profitability, etc. – they reject overly academic or
theory-based information.
• Self-directed online research is common.
• MLA extension work is not well-known, with the
best education coming from organisations such as
RIST, DPI, local vets or stock agents, all via in-
person sessions.
QUALITATIVE RE-CAP
26 © 2016 Ipsos.
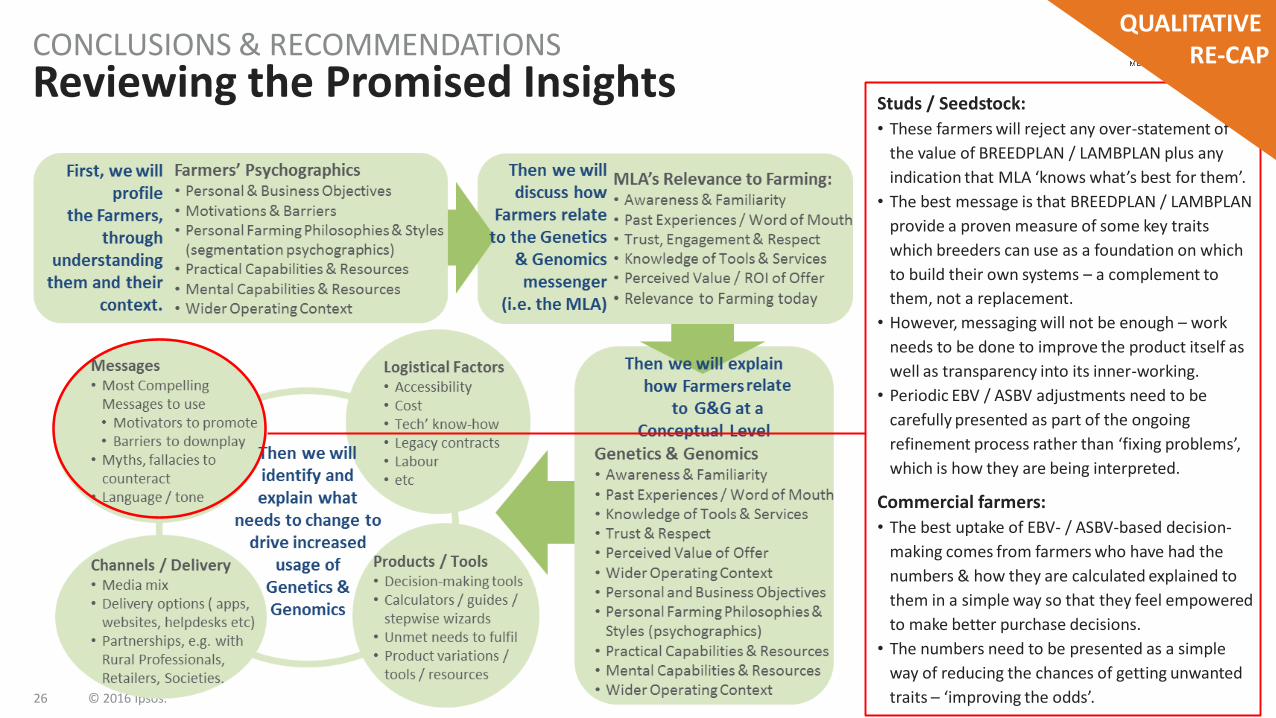
Reviewing the Promised InsightsCONCLUSIONS & RECOMMENDATIONS
Studs / Seedstock:
• These farmers will reject any over-statement of
the value of BREEDPLAN / LAMBPLAN plus any
indication that MLA ‘knows what’s best for them’.
• The best message is that BREEDPLAN / LAMBPLAN
provide a proven measure of some key traits
which breeders can use as a foundation on which
to build their own systems – a complement to
them, not a replacement.
• However, messaging will not be enough – work
needs to be done to improve the product itself as
well as transparency into its inner-working.
• Periodic EBV / ASBV adjustments need to be
carefully presented as part of the ongoing
refinement process rather than ‘fixing problems’,
which is how they are being interpreted.
Commercial farmers:
• The best uptake of EBV- / ASBV-based decision-
making comes from farmers who have had the
numbers & how they are calculated explained to
them in a simple way so that they feel empowered
to make better purchase decisions.
• The numbers need to be presented as a simple
way of reducing the chances of getting unwanted
traits – ‘improving the odds’.
QUALITATIVE RE-CAP
Summary of Key Points:QUALITATIVE INTERVIEWS

28 © 2016 Ipsos.
Stud & Commercial farmers have different mindsets & priorities; Studs value genes a lot; Commercial see genes as just one part of a complex mix
SUMMARY OF KEY QUALITATIVE RESULTS
Studs / Seedstock:
• Astute, financially-oriented self-managing entrepreneurs.
• Genes-savvy, detail-focused and questioning.
• Animal- and sales-focused.
• Capable, self-driven, challenging.
• Appreciate genetic measures as a supplementary tool and insurance.
Commercial farmers:
• Pragmatic, reactive, big-picture oriented.
• Careful, conservative, thoughtful.
• Detail-focused, working on the whole farm system not just smaller elements.
• Hungry for relevant knowledge.
• Focus on traits they can see.
Anything that MLA promotes will have to
fit in with farmers’ objectives and plans.
They will not change to suit MLA; MLA has
to change to suit them.
Commercial farmers are more cautious and
have many more factors to consider –
therefore they will ‘take more convincing’
that any change is worth the time, effort
and cost.
29 © 2016 Ipsos.
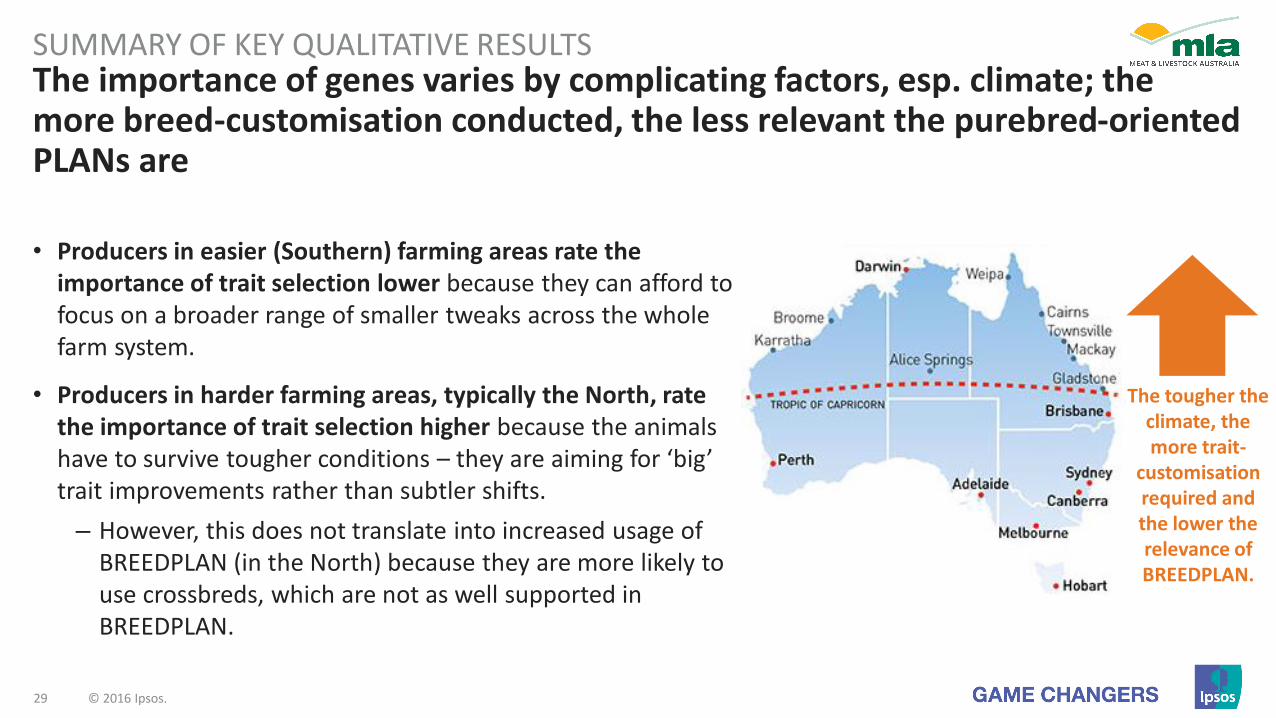
The importance of genes varies by complicating factors, esp. climate; the more breed-customisation conducted, the less relevant the purebred-oriented PLANs are
SUMMARY OF KEY QUALITATIVE RESULTS
• Producers in easier (Southern) farming areas rate the importance of trait selection lower because they can afford to focus on a broader range of smaller tweaks across the whole farm system.
• Producers in harder farming areas, typically the North, rate the importance of trait selection higher because the animals have to survive tougher conditions – they are aiming for ‘big’ trait improvements rather than subtler shifts.
– However, this does not translate into increased usage of BREEDPLAN (in the North) because they are more likely to use crossbreds, which are not as well supported in BREEDPLAN.
The tougher the climate, the more trait-
customisation required and the lower the relevance of BREEDPLAN.
30 © 2016 Ipsos.
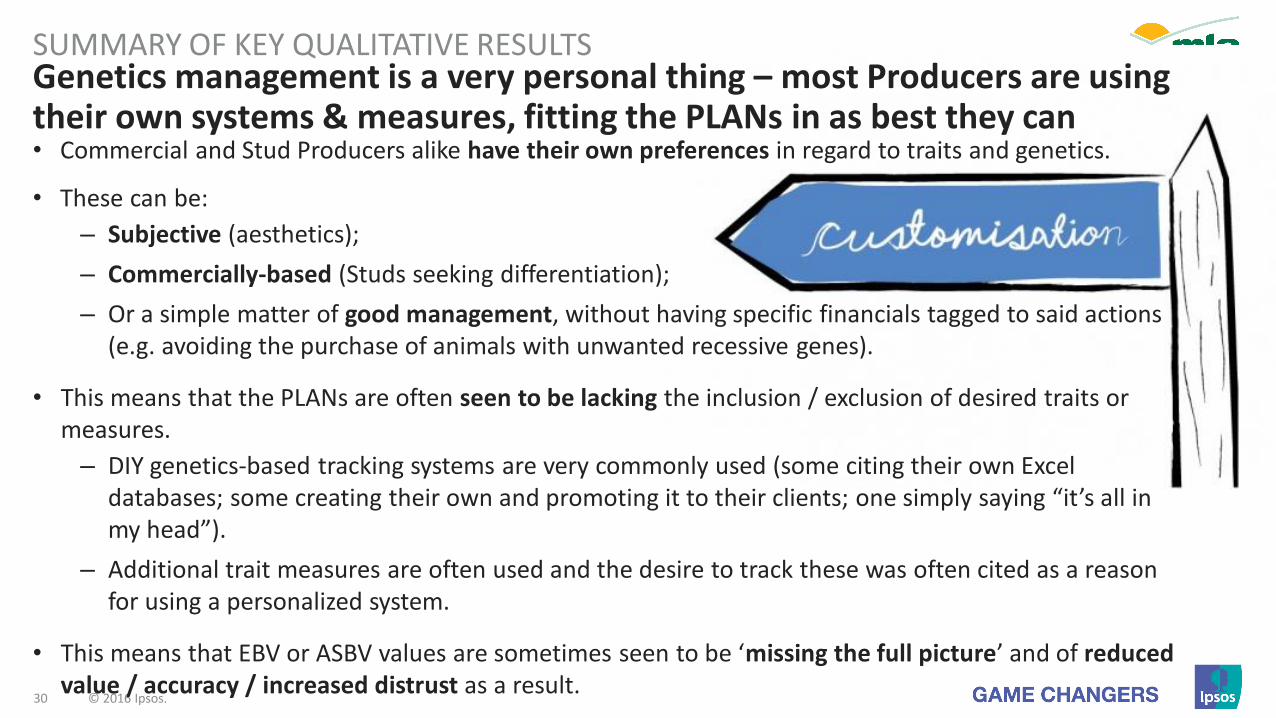
Genetics management is a very personal thing – most Producers are using their own systems & measures, fitting the PLANs in as best they can
SUMMARY OF KEY QUALITATIVE RESULTS
• Commercial and Stud Producers alike have their own preferences in regard to traits and genetics.
• These can be:
– Subjective (aesthetics);
– Commercially-based (Studs seeking differentiation);
– Or a simple matter of good management, without having specific financials tagged to said actions (e.g. avoiding the purchase of animals with unwanted recessive genes).
• This means that the PLANs are often seen to be lacking the inclusion / exclusion of desired traits or measures.
– DIY genetics-based tracking systems are very commonly used (some citing their own Excel databases; some creating their own and promoting it to their clients; one simply saying “it’s all in my head”).
– Additional trait measures are often used and the desire to track these was often cited as a reason for using a personalized system.
• This means that EBV or ASBV values are sometimes seen to be ‘missing the full picture’ and of reduced value / accuracy / increased distrust as a result.
31 © 2016 Ipsos.
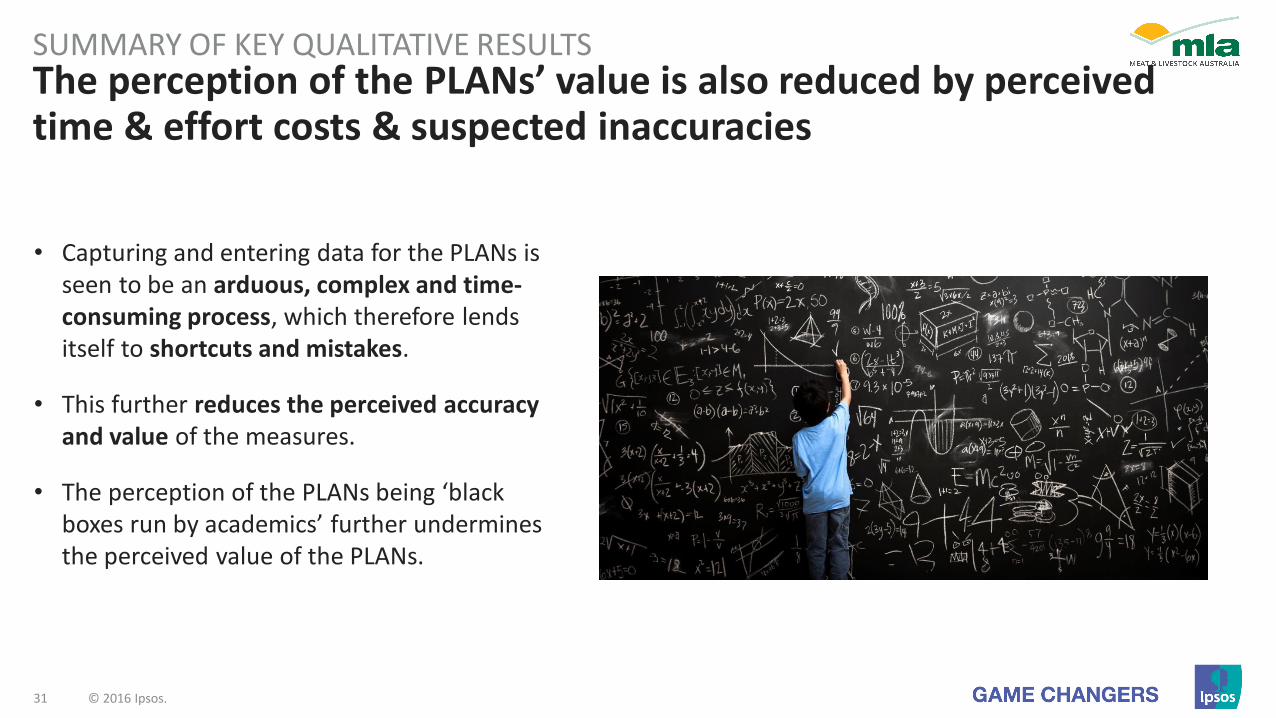
The perception of the PLANs’ value is also reduced by perceived time & effort costs & suspected inaccuracies
SUMMARY OF KEY QUALITATIVE RESULTS
• Capturing and entering data for the PLANs is seen to be an arduous, complex and time-consuming process, which therefore lends itself to shortcuts and mistakes.
• This further reduces the perceived accuracy and value of the measures.
• The perception of the PLANs being ‘black boxes run by academics’ further undermines the perceived value of the PLANs.

32 © 2016 Ipsos.
The PLANs are definitely approved & understood in principle but underperform in ‘the real world’
SUMMARY OF KEY QUALITATIVE RESULTS
Producers have their own personal trait preferences & recording systems.
Producers are very busy & have a lot of time-consuming & complex factors contributing to their business performance.
BREEDPLAN, MERINOSELECT & LAMBPLAN are all understood & approved in principle; seen as useful additional tools.
But actual usefulness & usage are reduced by:
Pre-existing DIY tracking & measurement systems.
Producers’ desire to breed for traits not covered by the PLANs.
Producers’ perception that exclusion of valued traits undervalues their stock & reduces effectiveness of PLANs for breeding decisions.
Producers’ perception that PLAN data-capture system lends itself to inaccuracies.
Producers’ perception that genetics gains come too slow & may not be worth the time & effort required compared to other more tangible & immediate on-farms gains that can be made instead.

QUANTITATIVE SURVEY RESULTS
© 2016 Ipsos.33

34 © 2016 Ipsos.
STAGE TWO: QUANTITATIVE SURVEYMETHODOLOGY
Fieldwork Dates & Method09/11/2015 – 15/11/2015Telephone interview
Sample ProviderSample provided by MLA and Breed Societies
Sample SizeTotal number of Producers (n=2,001)
Respondent ProfileCattle and sheep Producers responsible for making key breeding decisions across Australia.
Quotas used to ensure breeds were covered in proportion of stock numbers (not farm numbers).
Sample (as categorized post-interviewing)1,031 Cattle Producers (572 Studs; 459 Commercial; 759 BREEDPLAN Users and 272 Non-Users)
794 Sheep Producers (211 Studs; 364 Commercial; 169 LAMBPLAN Users, 119 MERINOSELECT Users)
MeasuresInterview duration: 21.6minsMargin of error (total sample): 2.19%
Most Producers farm more than one breed and many run both Stud / Seedstock
and Commercial operations. Therefore, because this
research had to focus only on their ‘main’ operations,
respondents’ cited usage and experience may appear at odds with their category.
Response rates by state (successful / ref+success)• NSW 79%• QLD 86%• SA 67%
• TAS 67%• VIC 82%• WA 75%
35 © 2016 Ipsos.
STAGE TWO: NOTES ON THE QUANTITATIVE SURVEY SAMPLE (1)METHODOLOGY
Most of this report focuses on the differences between Users and Non-Users.
For the purposes of efficient interviewing, respondents self-identified:
• The main purpose of their operations (e.g. stud / seedstock or commercial; sheep or cattle);
• Whether they used BREEDPLAN (for cattle producers), LAMBPLAN or MERINOSELECT (for sheep).Usage not restricted to formally-signed-up PLAN members but also Commercial producers who informally used PLAN measures when making breeding or purchasing decisions.
However, in ‘real life’, Producers often have multiple farming interests, can use multiple PLANs, or have used PLANs in the past.
This means that ‘non-users’ can sometimes say they have used user-only tools, or use tools that would be expected of different Producer types.
This simply reflects the widely varied nature of farming in the ‘real world’ and does not indicate inaccuracies in the research results.
36 © 2016 Ipsos.
STAGE TWO: NOTES ON THE QUANTITATIVE SURVEY SAMPLE (2)METHODOLOGY
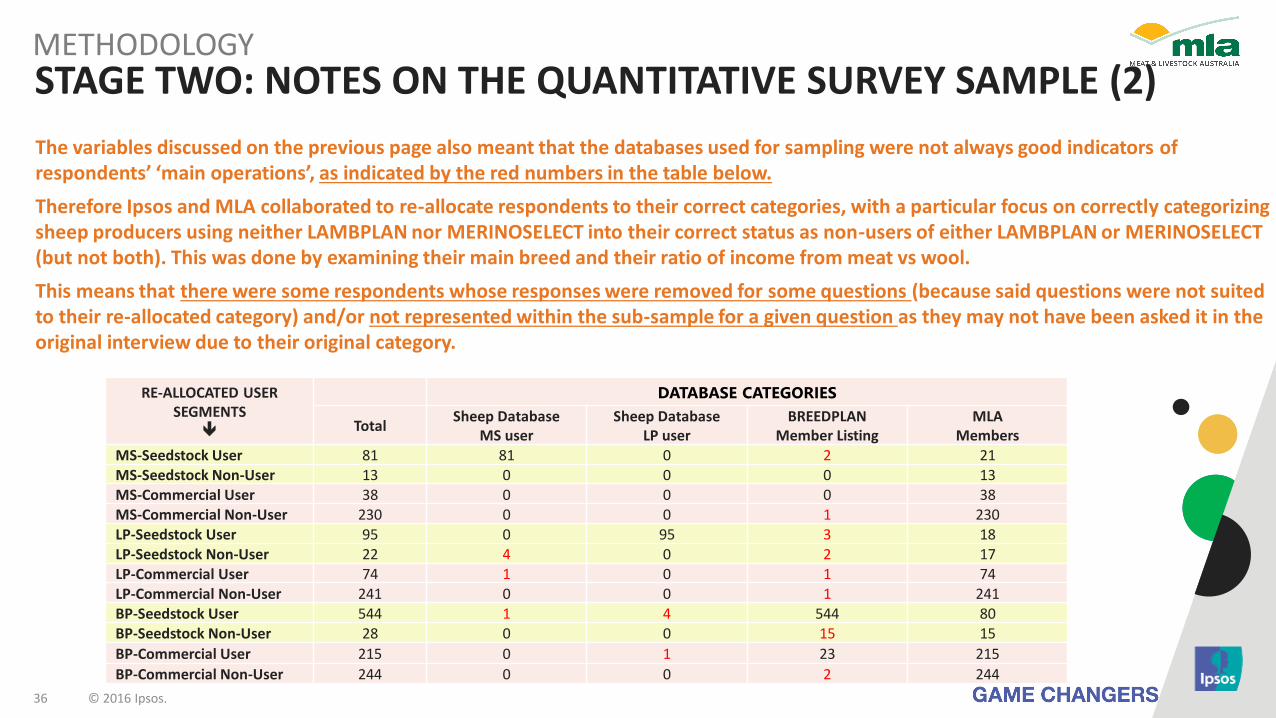
The variables discussed on the previous page also meant that the databases used for sampling were not always good indicators of respondents’ ‘main operations’, as indicated by the red numbers in the table below.
Therefore Ipsos and MLA collaborated to re-allocate respondents to their correct categories, with a particular focus on correctly categorizing sheep producers using neither LAMBPLAN nor MERINOSELECT into their correct status as non-users of either LAMBPLAN or MERINOSELECT (but not both). This was done by examining their main breed and their ratio of income from meat vs wool.
This means that there were some respondents whose responses were removed for some questions (because said questions were not suited to their re-allocated category) and/or not represented within the sub-sample for a given question as they may not have been asked it in the original interview due to their original category.
RE-ALLOCATED USER SEGMENTS
DATABASE CATEGORIES
TotalSheep Database
MS userSheep Database
LP userBREEDPLAN
Member ListingMLA
MembersMS-Seedstock User 81 81 0 2 21MS-Seedstock Non-User 13 0 0 0 13MS-Commercial User 38 0 0 0 38MS-Commercial Non-User 230 0 0 1 230LP-Seedstock User 95 0 95 3 18LP-Seedstock Non-User 22 4 0 2 17LP-Commercial User 74 1 0 1 74LP-Commercial Non-User 241 0 0 1 241BP-Seedstock User 544 1 4 544 80BP-Seedstock Non-User 28 0 0 15 15
BP-Commercial User 215 0 1 23 215
BP-Commercial Non-User 244 0 0 2 244
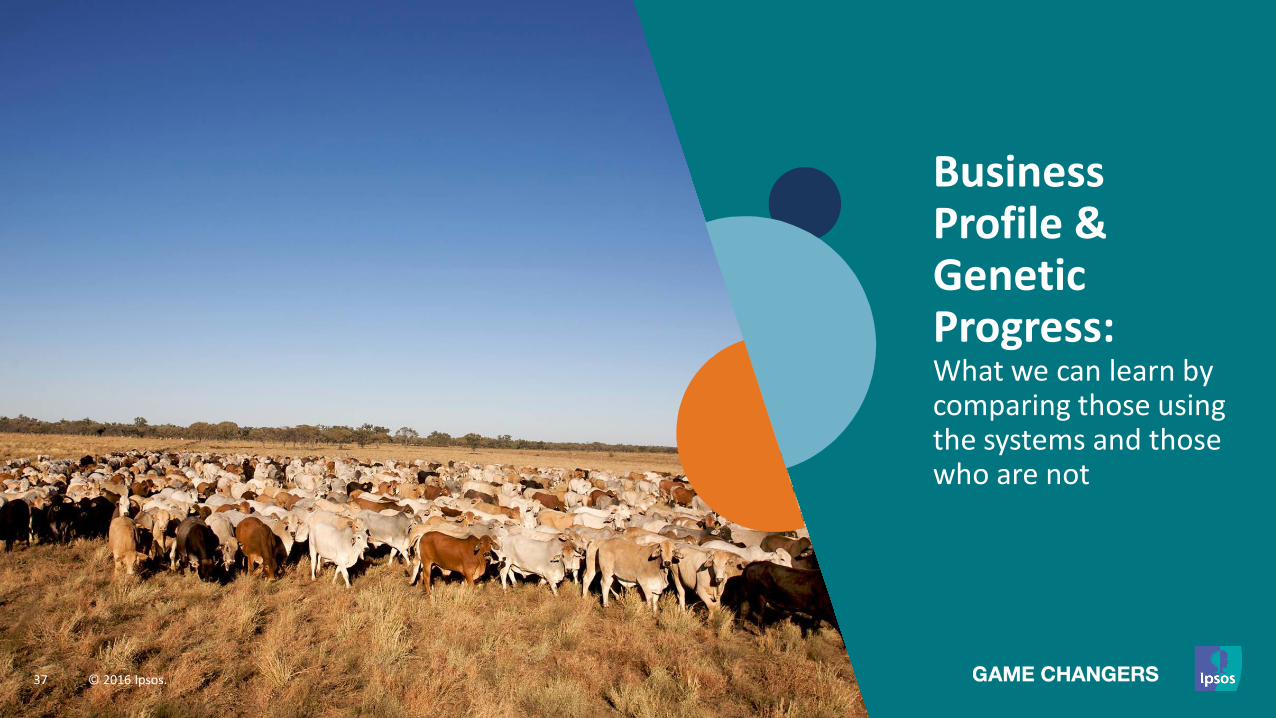
Business Profile & Genetic Progress:What we can learn by comparing those using the systems and those who are not
37 © 2016 Ipsos.
Business Profile
38 © 2016 Ipsos.
39 © 2016 Ipsos.
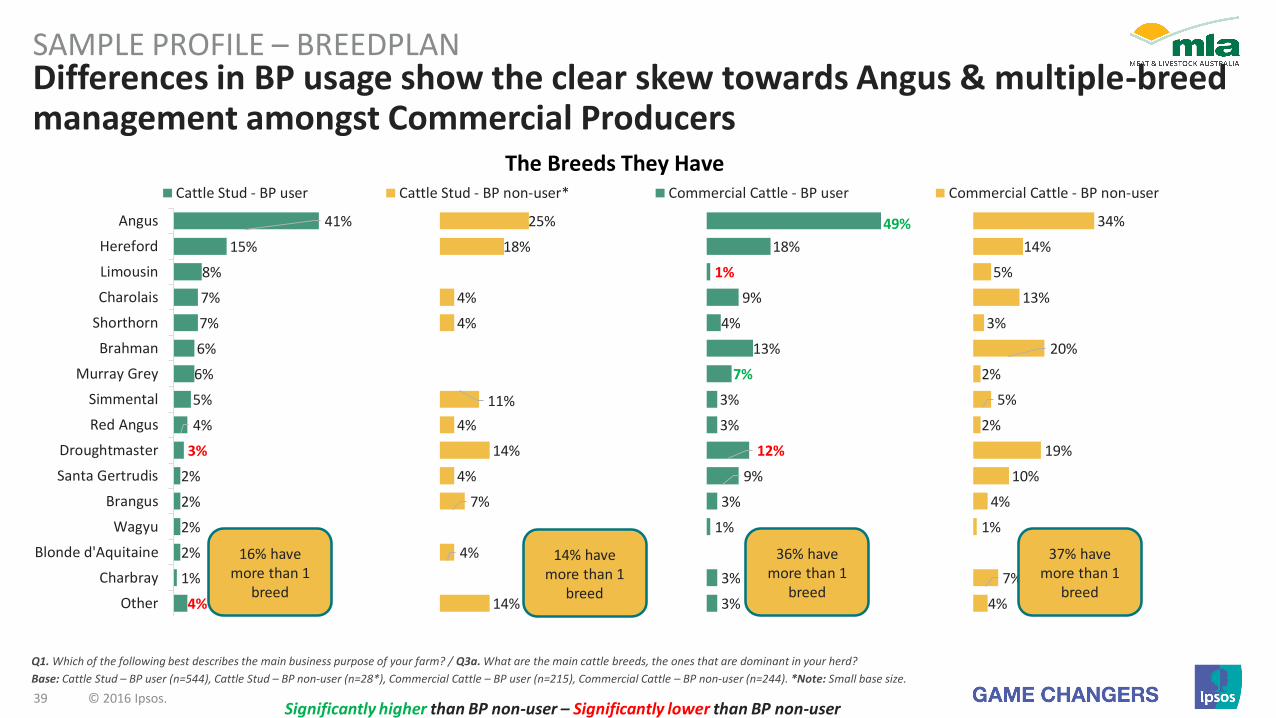
Differences in BP usage show the clear skew towards Angus & multiple-breed management amongst Commercial Producers
SAMPLE PROFILE – BREEDPLAN
Q1. Which of the following best describes the main business purpose of your farm? / Q3a. What are the main cattle breeds, the ones that are dominant in your herd?
Base: Cattle Stud – BP user (n=544), Cattle Stud – BP non-user (n=28*), Commercial Cattle – BP user (n=215), Commercial Cattle – BP non-user (n=244). *Note: Small base size.
41%
15%
8%
7%
7%
6%
6%
5%
4%
3%
2%
2%
2%
2%
1%
4%
25%
18%
4%
4%
11%
4%
14%
4%
7%
4%
14%
49%
18%
1%
9%
4%
13%
7%
3%
3%
12%
9%
3%
1%
3%
3%
34%
14%
5%
13%
3%
20%
2%
5%
2%
19%
10%
4%
1%
7%
4%
Angus
Hereford
Limousin
Charolais
Shorthorn
Brahman
Murray Grey
Simmental
Red Angus
Droughtmaster
Santa Gertrudis
Brangus
Wagyu
Blonde d'Aquitaine
Charbray
Other
Cattle Stud - BP user dummy Cattle Stud - BP non-user* dummy2 Commercial Cattle - BP user Column3 Commercial Cattle - BP non-user dummy4
The Breeds They Have
Significantly higher than BP non-user – Significantly lower than BP non-user
16% have more than 1
breed
14% have more than 1
breed
36% have more than 1
breed
37% have more than 1
breed

40 © 2016 Ipsos.
Differences in LP usage show a clearskew towards White Suffolk amongst Studs, Merino amongst Commercial
SAMPLE PROFILE – LAMBPLAN
Q1. Which of the following best describes the main business purpose of your farm? / Q3a. What are the main breeds, the ones that are dominant in your flock?
Base: Sheep Stud – LP user (n=95), Sheep Stud – LP non-user (n=22*), Commercial Sheep – LP user (n=74), Commercial Sheep – LP non-user (n=241). *Note: Small base size.
34%
24%
14%
7%
7%
4%
4%
1%
1%
25%
14%
9%
9%
9%
14%
5%
55%
18%
7%
8%
9%
3%
8%
58%
1%
35%
7%
7%
12%
11%
3%
2%
2%
1%
52%
31%
White Suffolk
Pol Dorset
Dorper
Border Leicester
Suffolk
Corriedale
Texel
Coopworth
Southdown
Merino
Pollworth
Other
Sheep Stud - LP user dummy Sheep Stud - LP non-user* dummy2 Commercial Sheep - LP user Column3 Commercial Sheep - LP non-user dummy4
The Breeds They Have
Significantly higher than LP non-user – Significantly lower than LP non-user
Commercial Producers are more likely to cross-breed.As expected, Commercial Producers who cross-breed are significantly less likely to be a part of Sheep Genetics National Evaluation Service (although they can still be ‘Users’ of the data when making breeding and purchasing decisions).
34% have Merino along
with other breeds
23% have Merino along
with other breeds
24% have more than 1
breed
14% have more than 1
breed
41% have more than 1
breed
28% have more than 1
breed
Due to oversight any Dohne mentions were recorded in the ‘other’ breed category.

41 © 2016 Ipsos.
The majority of MS Users have only one breedSAMPLE PROFILE – MERINOSELECT
Q1. Which of the following best describes the main business purpose of your farm? / Q4a. What are the main sheep breeds, the ones that are dominant in your flock?
Base: Sheep Stud – MS user (n=81), Sheep Stud – MS non-user (n=13*), Commercial Sheep – MS user (n=38), Commercial Sheep – MS non-user (n=230). *Note: Small base size.
100%
5%
5%
2%
2%
1%
100%
8%
8%
100%
3%
3%
3%
3%
3%
100%
4%
4%
3%
1%
1%
1%
Merino
White Suffolk
Other
Border Leicester
Pol Dorset
Dorper
Southdown
Suffolk
Sheep Stud - MS user dummy Sheep Stud - MS non-user* dummy2 Commercial Sheep - MS user Column3 Commercial Sheep - MS non-user dummy4
The Breeds They Have
Significantly higher than MS non-user – Significantly lower than MS non-user
12% have more than 1
breed
15% have more than 1
breed
13% have more than 1
breed
12% have more than 1
breed
Due to oversight any Dohne mentions were recorded in the
‘other’ breed category.
42 © 2016 Ipsos.
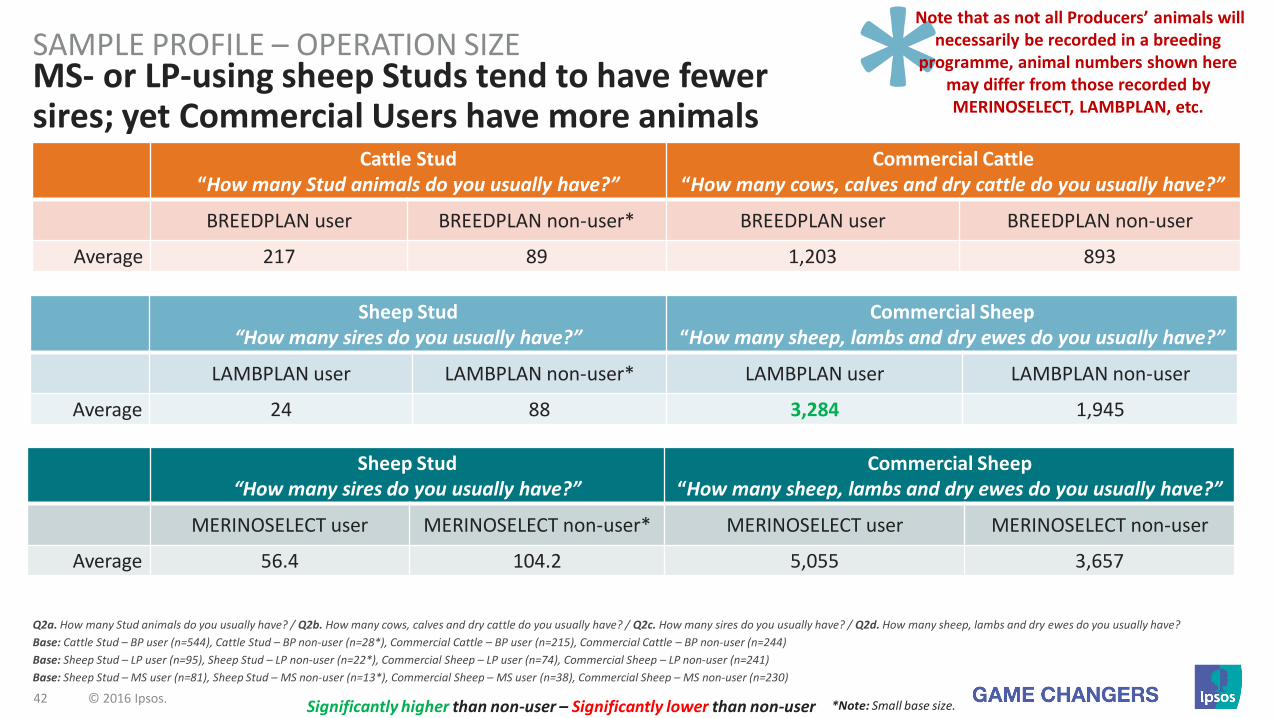
MS- or LP-using sheep Studs tend to have fewer sires; yet Commercial Users have more animals
SAMPLE PROFILE – OPERATION SIZE
Q2a. How many Stud animals do you usually have? / Q2b. How many cows, calves and dry cattle do you usually have? / Q2c. How many sires do you usually have? / Q2d. How many sheep, lambs and dry ewes do you usually have?
Base: Cattle Stud – BP user (n=544), Cattle Stud – BP non-user (n=28*), Commercial Cattle – BP user (n=215), Commercial Cattle – BP non-user (n=244)
Base: Sheep Stud – LP user (n=95), Sheep Stud – LP non-user (n=22*), Commercial Sheep – LP user (n=74), Commercial Sheep – LP non-user (n=241)
Base: Sheep Stud – MS user (n=81), Sheep Stud – MS non-user (n=13*), Commercial Sheep – MS user (n=38), Commercial Sheep – MS non-user (n=230)
Sheep Stud“How many sires do you usually have?”
Commercial Sheep“How many sheep, lambs and dry ewes do you usually have?”
LAMBPLAN user LAMBPLAN non-user* LAMBPLAN user LAMBPLAN non-user
Average 24 88 3,284 1,945
Cattle Stud“How many Stud animals do you usually have?”
Commercial Cattle“How many cows, calves and dry cattle do you usually have?”
BREEDPLAN user BREEDPLAN non-user* BREEDPLAN user BREEDPLAN non-user
Average 217 89 1,203 893
Sheep Stud“How many sires do you usually have?”
Commercial Sheep“How many sheep, lambs and dry ewes do you usually have?”
MERINOSELECT user MERINOSELECT non-user* MERINOSELECT user MERINOSELECT non-user
Average 56.4 104.2 5,055 3,657
Note that as not all Producers’ animals will necessarily be recorded in a breeding
programme, animal numbers shown here may differ from those recorded by MERINOSELECT, LAMBPLAN, etc.
Significantly higher than non-user – Significantly lower than non-user *Note: Small base size.

43 © 2016 Ipsos.
SAMPLE PROFILE – BREEDING SOFTWARE USAGE
Software Cattle Stud Commercial Cattle
BP user
*BP non-user
BP user
BP non-user
Excel / Microsoft
17% 21% 17% 10%
Herd-master
13% 7% 2% 0%
Stockbook 11% 11% 3% 1%
Kool software
1% 0% 0% 0%
Other 51% 54% 67% 75%
Unsure 11% 11% 13% 16%
Software Sheep Stud Commercial Sheep
LP user
*LP non-user
LP user
LP non-user
PedigreeWizard /
Master48% 0% 1% 0%
Stockbook 9% 5% 1% 0%
Excel / Microsoft
8% 18% 16% 8%
Kool software
3% 0% 3% 0%
Other 31% 73% 69% 84%
Unsure 5% 5% 11% 10%
Software Sheep Stud Commercial Sheep
MS user
*MS non-user
MS user
MS non-user
Stockbook 22% 0% 5% 0%
Pedigree Wizard /
Master19% 0% 0% 0%
Excel / Microsoft
14% 31% 13% 9%
Kool software
10% 0% 3% 0%
BreedElite 6% 0% 0% 0%
Other 33% 46% 68% 80%
Unsure 4% 23% 13% 13%Note that this question was not
asked in reference to specific animals, so a sheep and cattle
Producer who uses more than one software system could have cited
more than one (hence a small number of sheep Producers citing
BreedElite).
Note that ‘usage’ could also refer to the source of data used. E.g. a Commercial Sheep
Producer could feel they use Pedigree Master if their Stud / Seedstock supplier uses it to help with breeding decisions.
There is a huge variation in animal management software being used; many still use informal DIY options, some use multiple systems
Q1. Which of the following best describes the main business purpose of your farm? / Q11. Which, if any, data management software do you use for your animal management? Base: Cattle Stud – BP user (n=544), Cattle Stud – BP non-user (n=28*), Commercial Cattle – BP user (n=215), Commercial Cattle – BP non-user (n=244)Base: Sheep Stud – LP user (n=95), Sheep Stud – LP non-user (n=22*), Commercial Sheep – LP user (n=74), Commercial Sheep – LP non-user (n=241)
Base: Sheep Stud – MS user (n=81), Sheep Stud – MS non-user (n=13*), Commercial Sheep – MS user (n=38), Commercial Sheep – MS non-user (n=230)
*Note: Small base size. Significantly higher than non-user – Significantly lower than non-user

44 © 2016 Ipsos.
PLAN Users are more likely to be breed society / SG members, but it is not a guaranteed link; breed society members will therefore be joining for reasons other than access to BP
SAMPLE PROFILE – MEMBERSHIPS / USAGE
Q8. Are you a member or user of a breed society / Sheep Genetics National Breeding Evaluation Service?
Base: Cattle Stud – BP user (n=544), Cattle Stud – BP non-user (n=28*), Commercial Cattle – BP user (n=215), Commercial Cattle – BP non-user (n=244)
Base: Sheep Stud – LP user (n=95), Sheep Stud – LP non-user (n=22*), Commercial Sheep – LP user (n=74), Commercial Sheep – LP non-user (n=241)
Base: Sheep Stud – MS user (n=81), Sheep Stud – MS non-user (n=13*), Commercial Sheep – MS user (n=38), Commercial Sheep – MS non-user (n=230)
Cattle Stud Commercial Cattle
BP user BP non-user* BP user BP non-user
Member 98% 79% 37% 10%
Non-Member/ Unsure
2% 21% 63% 90%
Sheep Stud Commercial Sheep
LP user LP non-user* LP user LP non-user
Member 90% 18% 16% 1%
Non-Member / Unsure
10% 82% 84% 99%
Sheep Stud Commercial Sheep
MS user MS non-user* MS user MS non-user
Member 96% 0% 32% 3%
Non-Member / Unsure
4% 100% 68% 96%
Note that sheep Producers were asked if they were a member or a
user of the Sheep Genetics service, hence some Commercial Producers
will have answered ‘yes’.Some Commercial users may also
have sideline Stud businesses.
Significantly higher than non-user – Significantly lower than non-user*Note: Small base size.
45 © 2016 Ipsos.
0%
10%
20%
30%
40%
Under 5yrs 5-10yrs 11-20yrs 21-30yrs 31-40yrs Over 41yrs
Cattle Stud - BP user Cattle Stud - BP non-user*
Commercial Cattle - BP user Commercial Cattle - BP non-user
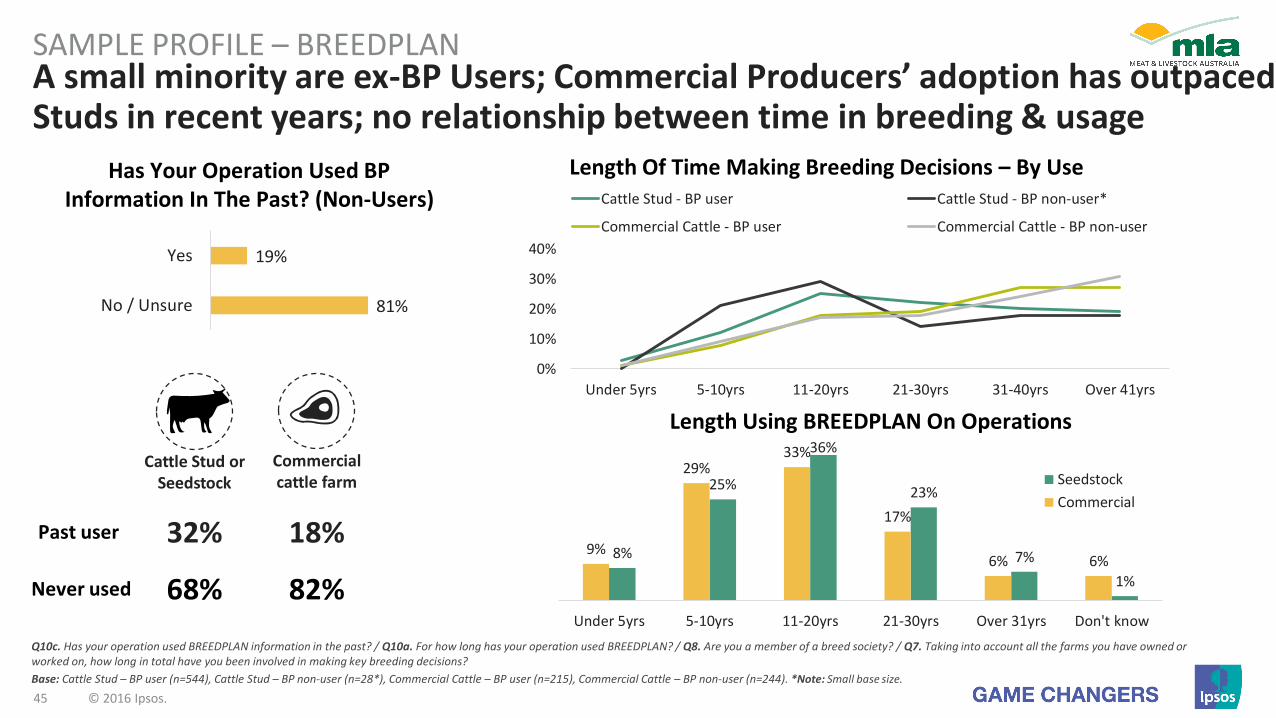
A small minority are ex-BP Users; Commercial Producers’ adoption has outpaced Studs in recent years; no relationship between time in breeding & usage
SAMPLE PROFILE – BREEDPLAN
Q10c. Has your operation used BREEDPLAN information in the past? / Q10a. For how long has your operation used BREEDPLAN? / Q8. Are you a member of a breed society? / Q7. Taking into account all the farms you have owned or worked on, how long in total have you been involved in making key breeding decisions?
Base: Cattle Stud – BP user (n=544), Cattle Stud – BP non-user (n=28*), Commercial Cattle – BP user (n=215), Commercial Cattle – BP non-user (n=244). *Note: Small base size.
Length Using BREEDPLAN On Operations
Has Your Operation Used BP Information In The Past? (Non-Users)
19%
81%
Yes
No / Unsure
Past user 18%
Never used 68% 82%
Cattle Stud or Seedstock
Commercial cattle farm
32%
Length Of Time Making Breeding Decisions – By Use
1%
7%
23%
36%
25%
8%6%6%
17%
33%29%
9%
Don't knowOver 31yrs21-30yrs11-20yrs5-10yrsUnder 5yrs
Seedstock
Commercial
46 © 2016 Ipsos.
0%
10%
20%
30%
40%
Under 5yrs 5-10yrs 11-20yrs 21-30yrs 31-40yrs Over 41yrs
Sheep Stud - LP user Sheep Stud - LP non-user*
Commercial Sheep - LP user Commercial Sheep - LP non-user
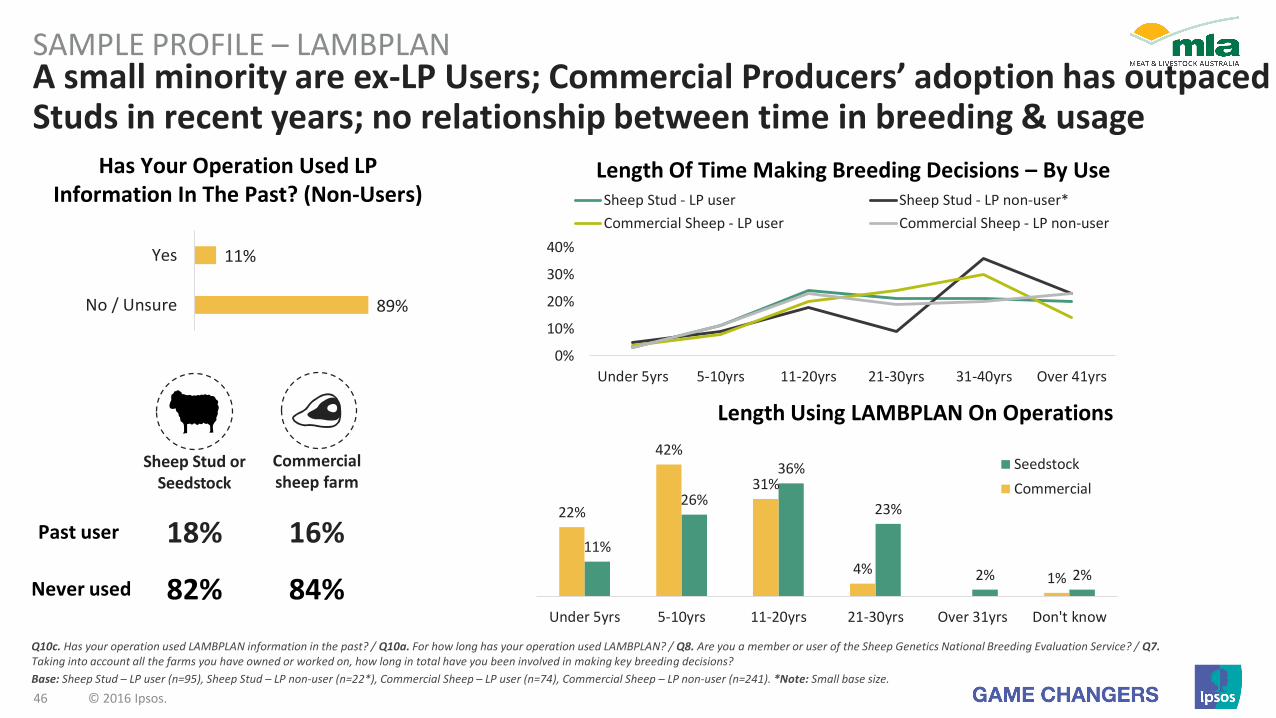
A small minority are ex-LP Users; Commercial Producers’ adoption has outpaced Studs in recent years; no relationship between time in breeding & usage
SAMPLE PROFILE – LAMBPLAN
Q10c. Has your operation used LAMBPLAN information in the past? / Q10a. For how long has your operation used LAMBPLAN? / Q8. Are you a member or user of the Sheep Genetics National Breeding Evaluation Service? / Q7. Taking into account all the farms you have owned or worked on, how long in total have you been involved in making key breeding decisions?
Base: Sheep Stud – LP user (n=95), Sheep Stud – LP non-user (n=22*), Commercial Sheep – LP user (n=74), Commercial Sheep – LP non-user (n=241). *Note: Small base size.
Length Using LAMBPLAN On Operations
Has Your Operation Used LP Information In The Past? (Non-Users)
11%
89%
Yes
No / Unsure
Past user 16%
Never used 82% 84%
18%
Sheep Stud or Seedstock
Commercial sheep farm
2%2%
23%
36%
26%
11%
1%4%
31%
42%
22%
Don't knowOver 31yrs21-30yrs11-20yrs5-10yrsUnder 5yrs
Seedstock
Commercial
Length Of Time Making Breeding Decisions – By Use
47 © 2016 Ipsos.
0%
10%
20%
30%
40%
Under 5yrs 5-10yrs 11-20yrs 21-30yrs 31-40yrs Over 41yrs
Sheep Stud - MS user Sheep Stud - MS non-user*
Commercial Sheep - MS user Commercial Sheep - MS non-user
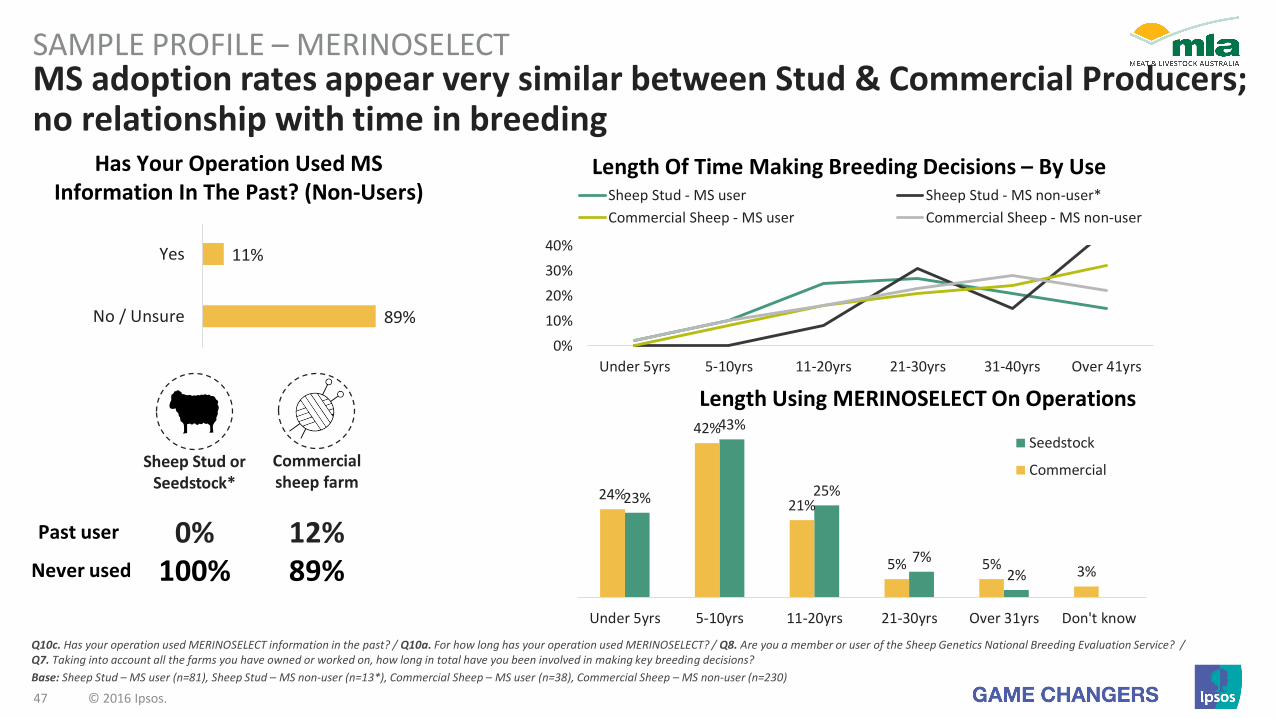
SAMPLE PROFILE – MERINOSELECT
Q10c. Has your operation used MERINOSELECT information in the past? / Q10a. For how long has your operation used MERINOSELECT? / Q8. Are you a member or user of the Sheep Genetics National Breeding Evaluation Service? / Q7. Taking into account all the farms you have owned or worked on, how long in total have you been involved in making key breeding decisions?
Base: Sheep Stud – MS user (n=81), Sheep Stud – MS non-user (n=13*), Commercial Sheep – MS user (n=38), Commercial Sheep – MS non-user (n=230)
Length Using MERINOSELECT On Operations
Has Your Operation Used MS Information In The Past? (Non-Users)
11%
89%
Yes
No / Unsure
Past user 12%Never used 100% 89%
Sheep Stud or Seedstock*
Commercial sheep farm
0%
MS adoption rates appear very similar between Stud & Commercial Producers; no relationship with time in breeding
2%7%
25%
43%
23%
3%5%5%
21%
42%
24%
Don't knowOver 31yrs21-30yrs11-20yrs5-10yrsUnder 5yrs
Seedstock
Commercial
Length Of Time Making Breeding Decisions – By Use
RegionalDifferences
48 © 2016 Ipsos.
49 © 2016 Ipsos.
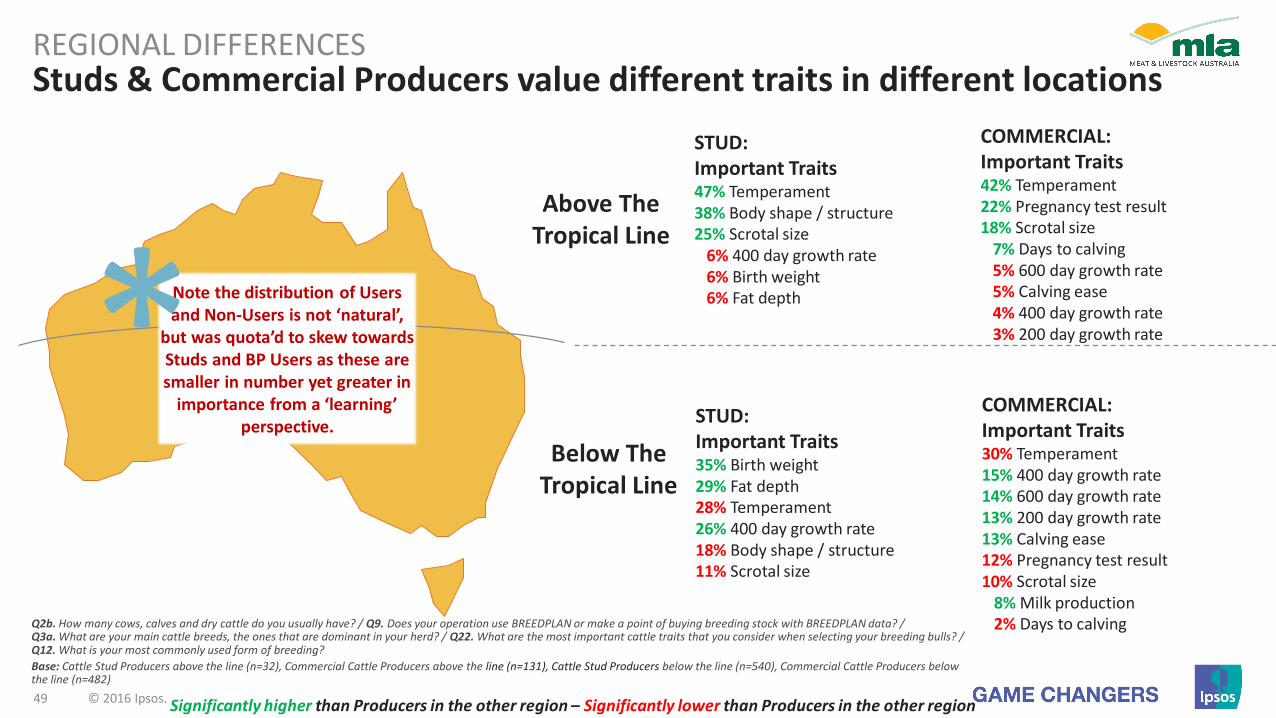
Studs & Commercial Producers value different traits in different locationsREGIONAL DIFFERENCES
Q2b. How many cows, calves and dry cattle do you usually have? / Q9. Does your operation use BREEDPLAN or make a point of buying breeding stock with BREEDPLAN data? /Q3a. What are your main cattle breeds, the ones that are dominant in your herd? / Q22. What are the most important cattle traits that you consider when selecting your breeding bulls? / Q12. What is your most commonly used form of breeding?
Base: Cattle Stud Producers above the line (n=32), Commercial Cattle Producers above the line (n=131), Cattle Stud Producers below the line (n=540), Commercial Cattle Producers below the line (n=482)
Significantly higher than Producers in the other region – Significantly lower than Producers in the other region
COMMERCIAL:Important Traits30% Temperament15% 400 day growth rate14% 600 day growth rate13% 200 day growth rate13% Calving ease12% Pregnancy test result10% Scrotal size
8% Milk production2% Days to calving
COMMERCIAL:Important Traits42% Temperament22% Pregnancy test result18% Scrotal size
7% Days to calving5% 600 day growth rate5% Calving ease4% 400 day growth rate3% 200 day growth rate
STUD:Important Traits35% Birth weight29% Fat depth28% Temperament26% 400 day growth rate18% Body shape / structure11% Scrotal size
STUD:Important Traits47% Temperament38% Body shape / structure25% Scrotal size
6% 400 day growth rate6% Birth weight6% Fat depthNote the distribution of Users
and Non-Users is not ‘natural’, but was quota’d to skew towards Studs and BP Users as these are smaller in number yet greater in
importance from a ‘learning’ perspective.
Above The Tropical Line
Below The Tropical Line

50 © 2016 Ipsos.
There are clear North / South differences in Studs’ breeding methods / traitsREGIONAL DIFFERENCES
Q3a. What are your main cattle breeds, the ones that are dominant in your herd? / Q22. What are the most important cattle traits that you consider when selecting your breeding bulls? / Q12. What is your most commonly used form of breeding?
Base: Cattle Stud Producers above the line (n=32), Cattle Stud Producers below the line (n=540)
Main Breeds42% Angus3% Droughtmaster3% Brahman
Important Traits35% Birth weight29% Fat depth28% Temperament26% 400 day growth rate18% Body shape / structure11% Scrotal size
Main Breeds56% Brahman16% Droughtmaster
3% Angus
Most Common Breeding Method61% Putting a bull into the herd36% AI
Important Traits47% Temperament38% Body shape / structure25% Scrotal size
6% 400 day growth rate6% Birth weight6% Fat depth
Most Common Breeding Method84% Putting a bull into the herd
9% AI
Above The Tropical Line
Below The Tropical Line
Note the distribution of Users and Non-Users is not ‘natural’,
but was quota’d to skew towards Studs and BP Users as these are smaller in number yet greater in
importance from a ‘learning’ perspective.
Significantly higher than Producers in the other region – Significantly lower than Producers in the other region

51 © 2016 Ipsos.
There are clear differences in the traits tracked between the North & South Studs
REGIONAL DIFFERENCES
Q14. What types of measurements do you use to keep track of your genetics gains or progress towards your breeding objectives? / Q23. What, if any, traits would you like to see added to BREEDPLAN? / Q24. What performance data do you regularly record from your cattle? / Q25. And which of that data do you routinely report back to BREEDPLAN?
Base: Cattle Stud Producers above the line (n=32), Cattle Stud Producers below the line (n=540)
BP Usage
Above the line: 94%
Below the line: 95%
Measurements Used To Keep Track Of Genetic Gains
Significant Differences Above The Line Below The Line
Birth weight 9% 27%
Nett physical factors 62% 43%
Scrotal size 38% 9%
Nett Gestation / weaning / fertility factors 47% 23%
Feedback from buyers 12% 3%
Performance Data Recorded From Cattle
Significant Differences Above The Line Below The Line
Temperament 12% 0%
Significant Differences Above The Line Below The Line
Birth weight 19% 57%
Pregnancy test result 25% 6%
Eye muscle area 6% 28%
Fat depth 6% 30%
Traits You Would Like To See Added To BP
Significant Differences Above The Line Below The Line
Birth weight 21% 54%
Eye muscle area 3% 27%
Fat depth 3% 28%
Performance Data Reported Back To BP
Note the distribution of Users and Non-Users is not ‘natural’, but was quota’d
to skew towards Studs and BP Users as these are smaller in number yet
greater in importance from a ‘learning’ perspective.
Significantly higher than Producers in the other region – Significantly lower than Producers in the other region
52 © 2016 Ipsos.
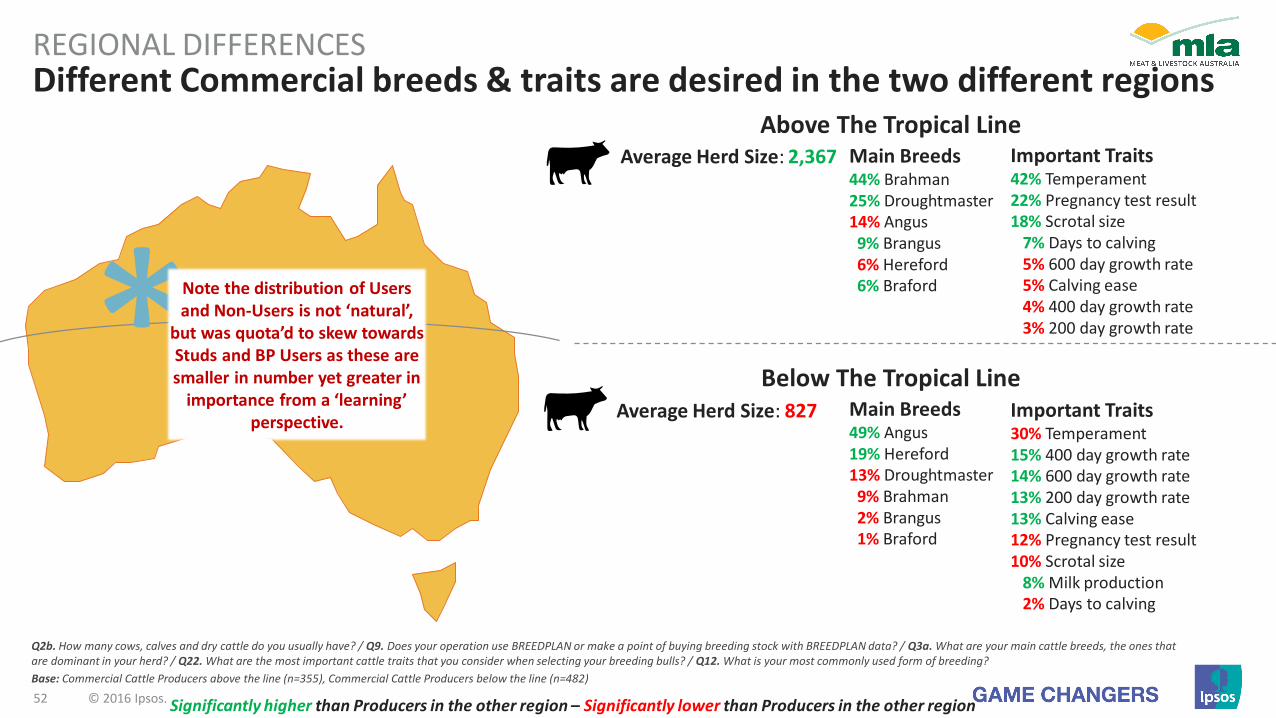
Different Commercial breeds & traits are desired in the two different regionsREGIONAL DIFFERENCES
Q2b. How many cows, calves and dry cattle do you usually have? / Q9. Does your operation use BREEDPLAN or make a point of buying breeding stock with BREEDPLAN data? / Q3a. What are your main cattle breeds, the ones that are dominant in your herd? / Q22. What are the most important cattle traits that you consider when selecting your breeding bulls? / Q12. What is your most commonly used form of breeding?
Base: Commercial Cattle Producers above the line (n=355), Commercial Cattle Producers below the line (n=482)
Above The Tropical Line
Below The Tropical Line
Average Herd Size: 2,367
Average Herd Size: 827 Main Breeds49% Angus19% Hereford13% Droughtmaster9% Brahman2% Brangus1% Braford
Main Breeds44% Brahman25% Droughtmaster14% Angus9% Brangus6% Hereford6% Braford
Important Traits30% Temperament15% 400 day growth rate14% 600 day growth rate13% 200 day growth rate13% Calving ease12% Pregnancy test result10% Scrotal size
8% Milk production2% Days to calving
Important Traits42% Temperament22% Pregnancy test result18% Scrotal size
7% Days to calving5% 600 day growth rate5% Calving ease4% 400 day growth rate3% 200 day growth rate
Significantly higher than Producers in the other region – Significantly lower than Producers in the other region
Note the distribution of Users and Non-Users is not ‘natural’,
but was quota’d to skew towards Studs and BP Users as these are smaller in number yet greater in
importance from a ‘learning’ perspective.
53 © 2016 Ipsos.
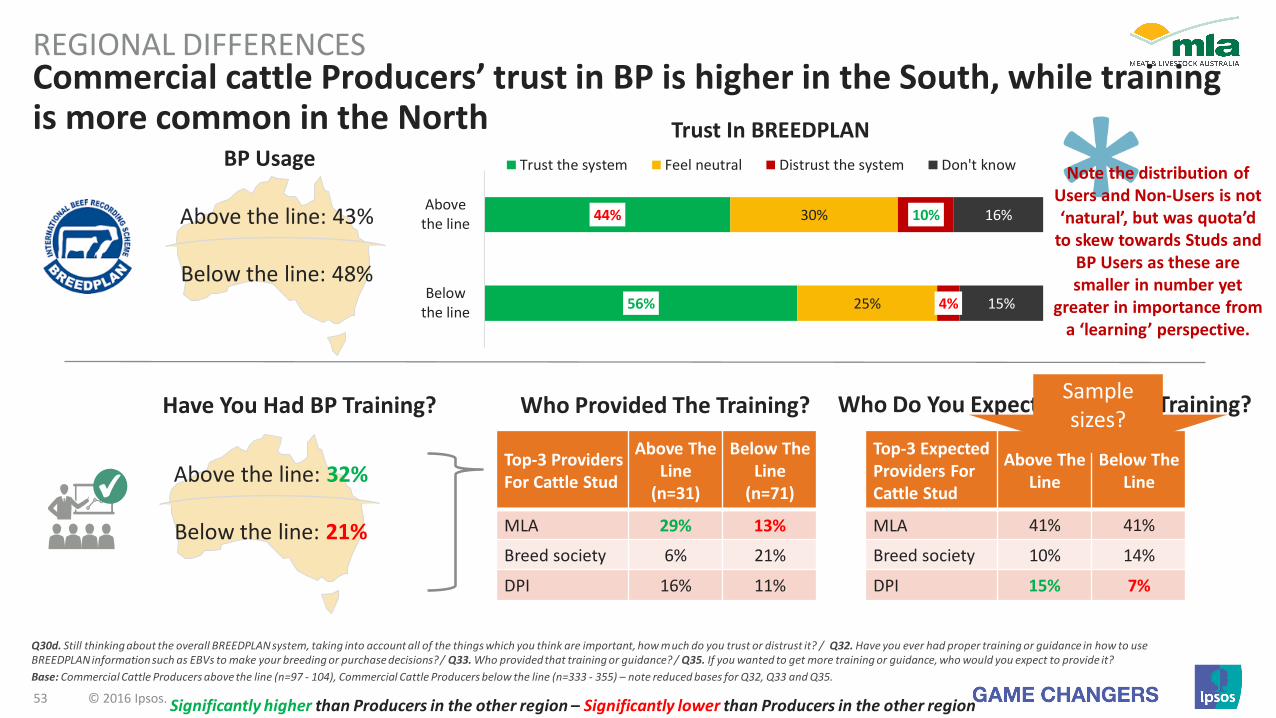
Commercial cattle Producers’ trust in BP is higher in the South, while training is more common in the North
REGIONAL DIFFERENCES
Q30d. Still thinking about the overall BREEDPLAN system, taking into account all of the things which you think are important, how much do you trust or distrust it? / Q32. Have you ever had proper training or guidance in how to use BREEDPLAN information such as EBVs to make your breeding or purchase decisions? / Q33. Who provided that training or guidance? / Q35. If you wanted to get more training or guidance, who would you expect to provide it?
Base: Commercial Cattle Producers above the line (n=97 - 104), Commercial Cattle Producers below the line (n=333 - 355) – note reduced bases for Q32, Q33 and Q35.
44%
56%
30%
25%
10%
4%
16%
15%
Abovethe line
Belowthe line
Trust the system Feel neutral Distrust the system Don't know
Trust In BREEDPLANBP Usage
Top-3 ProvidersFor Cattle Stud
Above The Line
(n=31)
Below The Line
(n=71)
MLA 29% 13%
Breed society 6% 21%
DPI 16% 11%
Have You Had BP Training?
Above the line: 32%
Below the line: 21%
Above the line: 43%
Below the line: 48%
Who Provided The Training? Who Do You Expect To Provide Training?
Top-3 Expected Providers For Cattle Stud
Above The Line
Below The Line
MLA 41% 41%
Breed society 10% 14%
DPI 15% 7%
Note the distribution of Users and Non-Users is not ‘natural’, but was quota’d
to skew towards Studs and BP Users as these are smaller in number yet
greater in importance from a ‘learning’ perspective.
Significantly higher than Producers in the other region – Significantly lower than Producers in the other region
Sample sizes?
54 © 2016 Ipsos.
Key Learnings: Business Profile
1. Clear and expected variation in breeds by PLAN usage and location.
2. Many Producers farm more than one breed and many run both Stud / Seedstock and Commercial operations. Therefore, because this research had to focus only on their ‘aim’ operations, respondents’ cited usage and experience may appear at odds with their category.
3. Predictable regional differences exist; Northern Producers use and trust BP less, have more composite breeds, and focus on different traits than those in the South.
4. A lot of software variance; many informal DIY tracking options used.
5. No relationship between Producers’ duration in breeding, operation size and system usage.
6. Breed society membership naturally higher amongst PLAN Users, but many Non-Users are also breed society members.
7. Around 11-19% are ex-Users.
REGIONAL DIFFERENCES
Genetic Progress
55 © 2016 Ipsos.
56 © 2016 Ipsos.
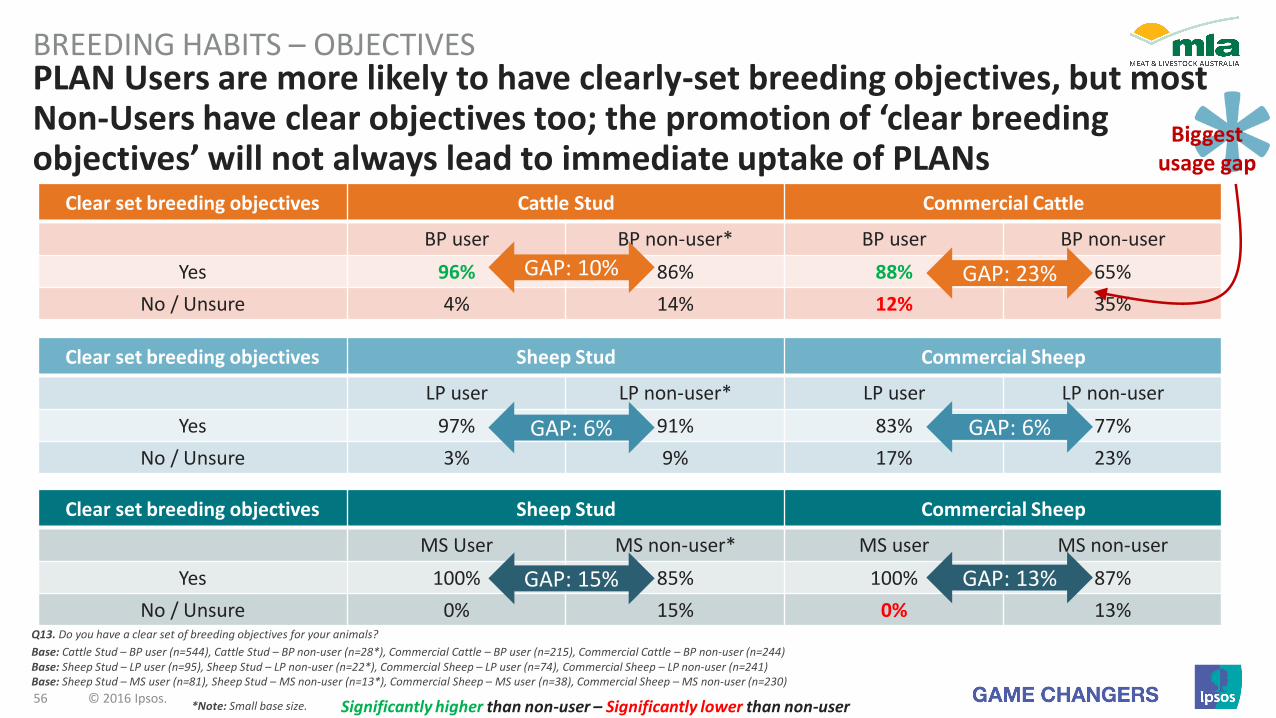
Clear set breeding objectives Sheep Stud Commercial Sheep
MS User MS non-user* MS user MS non-user
Yes 100% 85% 100% 87%
No / Unsure 0% 15% 0% 13%
PLAN Users are more likely to have clearly-set breeding objectives, but most Non-Users have clear objectives too; the promotion of ‘clear breeding objectives’ will not always lead to immediate uptake of PLANs
BREEDING HABITS – OBJECTIVES
Q13. Do you have a clear set of breeding objectives for your animals?
Base: Cattle Stud – BP user (n=544), Cattle Stud – BP non-user (n=28*), Commercial Cattle – BP user (n=215), Commercial Cattle – BP non-user (n=244)Base: Sheep Stud – LP user (n=95), Sheep Stud – LP non-user (n=22*), Commercial Sheep – LP user (n=74), Commercial Sheep – LP non-user (n=241)Base: Sheep Stud – MS user (n=81), Sheep Stud – MS non-user (n=13*), Commercial Sheep – MS user (n=38), Commercial Sheep – MS non-user (n=230)
Clear set breeding objectives Cattle Stud Commercial Cattle
BP user BP non-user* BP user BP non-user
Yes 96% 86% 88% 65%
No / Unsure 4% 14% 12% 35%
Clear set breeding objectives Sheep Stud Commercial Sheep
LP user LP non-user* LP user LP non-user
Yes 97% 91% 83% 77%
No / Unsure 3% 9% 17% 23%
Significantly higher than non-user – Significantly lower than non-user
GAP: 10% GAP: 23%
GAP: 6% GAP: 6%
GAP: 15% GAP: 13%
Biggest usage gap
*Note: Small base size.
57 © 2016 Ipsos.
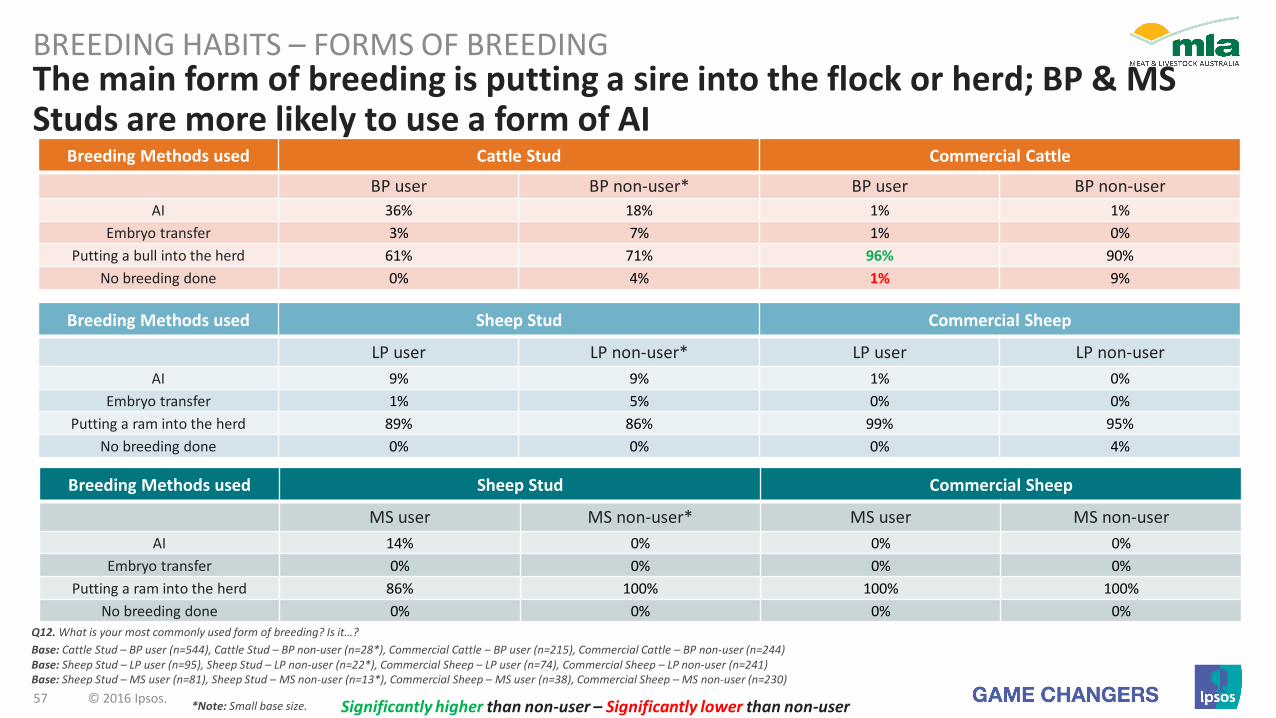
The main form of breeding is putting a sire into the flock or herd; BP & MS Studs are more likely to use a form of AI
BREEDING HABITS – FORMS OF BREEDING
Q12. What is your most commonly used form of breeding? Is it…?
Base: Cattle Stud – BP user (n=544), Cattle Stud – BP non-user (n=28*), Commercial Cattle – BP user (n=215), Commercial Cattle – BP non-user (n=244)Base: Sheep Stud – LP user (n=95), Sheep Stud – LP non-user (n=22*), Commercial Sheep – LP user (n=74), Commercial Sheep – LP non-user (n=241)Base: Sheep Stud – MS user (n=81), Sheep Stud – MS non-user (n=13*), Commercial Sheep – MS user (n=38), Commercial Sheep – MS non-user (n=230)
Breeding Methods used Cattle Stud Commercial Cattle
BP user BP non-user* BP user BP non-user
AI 36% 18% 1% 1%
Embryo transfer 3% 7% 1% 0%
Putting a bull into the herd 61% 71% 96% 90%
No breeding done 0% 4% 1% 9%
Breeding Methods used Sheep Stud Commercial Sheep
LP user LP non-user* LP user LP non-user
AI 9% 9% 1% 0%
Embryo transfer 1% 5% 0% 0%
Putting a ram into the herd 89% 86% 99% 95%
No breeding done 0% 0% 0% 4%
Breeding Methods used Sheep Stud Commercial Sheep
MS user MS non-user* MS user MS non-user
AI 14% 0% 0% 0%
Embryo transfer 0% 0% 0% 0%
Putting a ram into the herd 86% 100% 100% 100%
No breeding done 0% 0% 0% 0%
Significantly higher than non-user – Significantly lower than non-user*Note: Small base size.

58 © 2016 Ipsos.
60%7%
5%6%
24%5%
14%27%
3%7%
2%9%
2%3%
5%31%
16%19%
2%33%
1%17%
7%
23%1%
13%
5%16%
6%
6%
2%
17%8%
13%
37%
23%28%
43%4%4%4%
25%4%
7%29%
4%11%
18%
4%
21%21%
29%4%
61%7%
32%4%
69%27%
21%21%
19%15%15%
45%15%
13%12%11%11%
9%7%
24%11%
39%20%
38%17%
11%2%
*WEIGHT / GROWTH / AGE
Birth weight
200 - 250 day growth / weight
400 to 450 day growth / weight
Weight gain / growth rates
600 day growth / weight
Weight - body weight
*PHYSIQUE / TEMPERAMENT
Eye muscle area
Temperament / docility / flight time
Intramuscular fat - IMF
Body shape / structure
Scrotal size / circumference
Fat
Milk supply / udder development
*GESTATION / WEANING / FERTILITY
Fertility
*BREED / GENETICS / EBV
BREEDPLAN
*OTHER
Scanning / ultrasound
Visual assessment
*NONE / DK / NR
Weight-gain is the main measure of breeding progress across Commercial & Stud farms; BP Users employ a wider range of measures; Non-Users are more likely to use less specific visual & weight-gain assessments
BREEDING HABITS – OBJECTIVES / BREEDPLAN
Q14. What types of measurement do you use to keep track of your genetics gains or progress towards your breeding objectives?
Base: Cattle Stud – BP user (n=544), Cattle Stud – BP non-user (n=28*), Commercial Cattle – BP user (n=215), Commercial Cattle – BP non-user (n=244). *Note: Small base size.
Measurements Used To Keep Track Of Progress Towards ObjectivesCattle Stud - BP user Cattle Stud - BP non-user* Commercial Cattle - BP user Commercial Cattle - BP non-user
Significantly higher than BP non-user – Significantly lower than BP non-user

59 © 2016 Ipsos.
45%14%
23%23%
18%23%23%
45%5%
32%18%
9%18%
14%23%
5%45%
14%23%
5%
59%21%
18%18%
17%11%
7%3%
5%3%
58%31%
24%22%
9%19%
11%38%
22%33%
19%7%
3%
*WEIGHT / GROWTH / AGE
Weight gain / growth rates
Post weaning weight
Weaning weight
Birth weight
Weight - body weight
*WOOL / FLEECE / FIBRE
Fibre diameter of wool
*YIELD
Wool / fleece weight
*PHYSICAL FACTORS
Degree of muscling
Fat
Eye muscle area
Body shape / structure
*GESTATION / WEANING / FERTILITY
Fertility
*BREED / GENETICS / ASBV
LAMBPLAN
*OTHER
Scanning / ultrasound
Visual assessment
*NONE / DK / NR
Sheep Stud - LP user Sheep Stud - LP non-user* Commercial Sheep - LP user Commercial Sheep - LP non-user
27%10%
2%1%
9%9%
5%6%
4%11%
2%
6%12%
5%12%
38%2%
17%31%
47%28%
1%7%
5%8%
14%9%
15%12%
11%
4%8%
3%23%
8%19%
4%28%
3%9%9%
Weight-gain is the main measure of breeding progress across Commercial & Stud farms; LP Users have a wider range of measures; Non-Users are more likely to use visual assessments
BREEDING HABITS – OBJECTIVES / LAMBPLAN
Q14. What types of measurement do you use to keep track of your genetics gains or progress towards your breeding objectives?
Base: Sheep Stud – LP user (n=95), Sheep Stud – LP non-user (n=22*), Commercial Sheep – LP user (n=74), Commercial Sheep – LP non-user (n=241). *Note: Small base size.
Measurements Used To Keep Track Of Progress Towards Objectives
Significantly higher than LP non-user – Significantly lower than LP non-user

60 © 2016 Ipsos.
32%16%
13%71%
45%21%
11%53%
42%18%
5%8%
3%11%
3%24%
11%11%
8%24%
5%11%
0%
62%42%
10%57%
38%16%
10%53%52%52%
32%28%
16%12%
1%11%
4%31%
11%4%
27%10%
6%
*WEIGHT / GROWTH / AGE
Weight - body weight
Weight gain / growth rates
*WOOL / FLEECE / FIBRE
Fibre diameter of wool
Wool / fibre / fleece measurements
Staple - strength / length
*YIELD
Wool / fleece weight
*PHYSICAL FACTORS
Fat
Eye muscle area
Degree of muscling
Worms / WEC
Body shape / structure
*GESTATION / WEANING / FERTILITY
Fertility
*BREED / GENETICS / ASBV
MERINOSELECT / DPP index
Ram data
*OTHER
Scanning / ultrasound
Visual assessment
Cull - to meat works if not up to standard
*NONE / DK / NR
23%15%
54%54%
15%
23%15%15%
8%
15%
15%38%
23%15%15%
18%13%
2%54%
33%21%
5%25%
21%17%
1%
1%10%11%
4%7%
4%33%
17%2%
14%
Wool & fleece indicators are the main measure of breeding progress across Merino Commercial & Stud farms; MS Users employ a wider range of measures & place greater importance on yield
BREEDING HABITS – OBJECTIVES / MERINOSELECT
Q14. What types of measurement do you use to keep track of your genetics gains or progress towards your breeding objectives?
Base: Sheep Stud – MS user (n=81), Sheep Stud – MS non-user (n=13*), Commercial Sheep – MS user (n=38), Commercial Sheep – MS non-user (n=230). *Note: Small base size.
Measurements Used To Keep Track Of Progress Towards ObjectivesSheep Stud - MS user Sheep Stud - MS non-user* Commercial Sheep - MS user Commercial Sheep - MS non-user
Significantly higher than MS non-user – Significantly lower than MS non-user
61 © 2016 Ipsos.
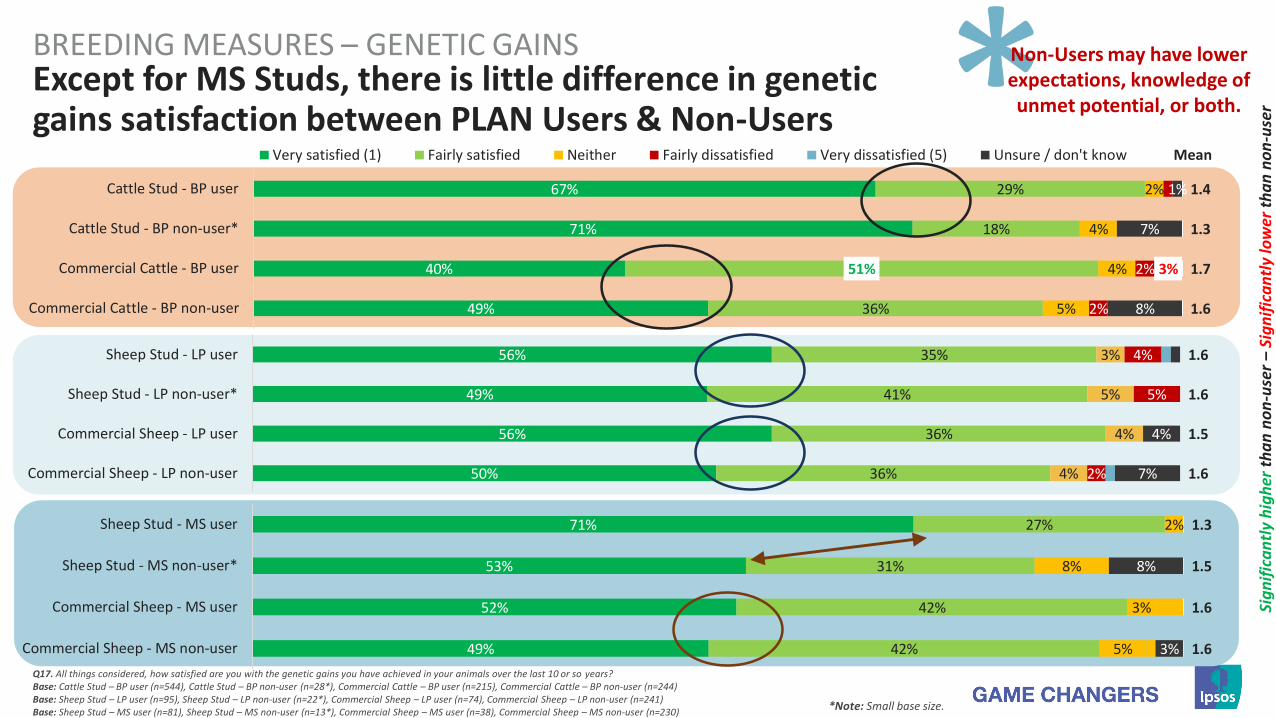
71%
53%
52%
49%
27%
31%
42%
42%
2%
8%
3%
5%
8%
3%
1.3
1.5
1.6
1.6
Sheep Stud - MS user
Sheep Stud - MS non-user*
Commercial Sheep - MS user
Commercial Sheep - MS non-user
BREEDING MEASURES – GENETIC GAINS
Q17. All things considered, how satisfied are you with the genetic gains you have achieved in your animals over the last 10 or so years?Base: Cattle Stud – BP user (n=544), Cattle Stud – BP non-user (n=28*), Commercial Cattle – BP user (n=215), Commercial Cattle – BP non-user (n=244)Base: Sheep Stud – LP user (n=95), Sheep Stud – LP non-user (n=22*), Commercial Sheep – LP user (n=74), Commercial Sheep – LP non-user (n=241)Base: Sheep Stud – MS user (n=81), Sheep Stud – MS non-user (n=13*), Commercial Sheep – MS user (n=38), Commercial Sheep – MS non-user (n=230)
56%
49%
56%
50%
35%
41%
36%
36%
3%
5%
4%
4%
4%
5%
2%
4%
7%
1.6
1.6
1.5
1.6
Sheep Stud - LP user
Sheep Stud - LP non-user*
Commercial Sheep - LP user
Commercial Sheep - LP non-user
67%
71%
40%
49%
29%
18%
51%
36%
2%
4%
4%
5%
2%
2%
1%
7%
3%
8%
1.4
1.3
1.7
1.6
Cattle Stud - BP user
Cattle Stud - BP non-user*
Commercial Cattle - BP user
Commercial Cattle - BP non-user
Very satisfied (1) Fairly satisfied Neither Fairly dissatisfied Very dissatisfied (5) Unsure / don't know Mean
Except for MS Studs, there is little difference in genetic gains satisfaction between PLAN Users & Non-Users
Non-Users may have lower expectations, knowledge of unmet potential, or both.
*Note: Small base size.
Sig
nif
ica
ntl
y h
igh
er t
ha
n n
on
-use
r –
Sig
nif
ica
ntl
y lo
wer
th
an
no
n-u
ser
62 © 2016 Ipsos.
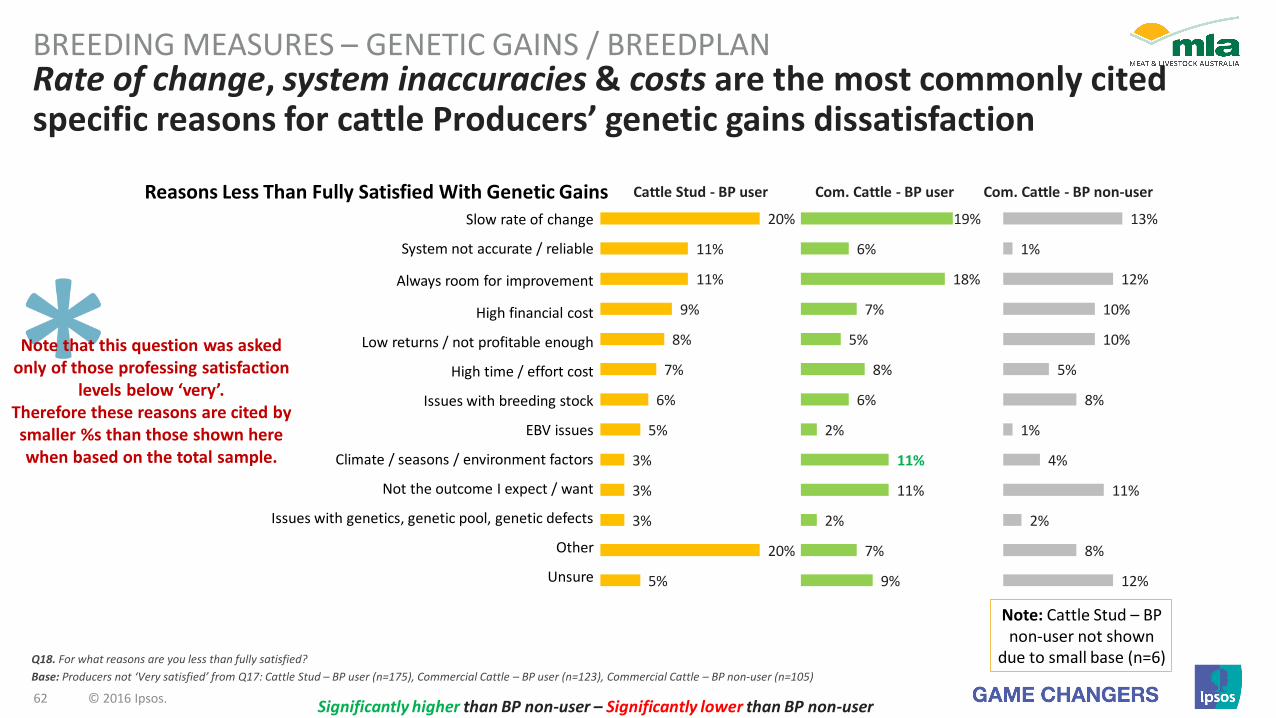
Reasons Less Than Fully Satisfied With Genetic Gains Cattle Stud - BP user Com. Cattle - BP user Com. Cattle - BP non-user
Slow rate of change
System not accurate / reliable
Always room for improvement
High financial cost
Low returns / not profitable enough
High time / effort cost
Issues with breeding stock
EBV issues
Climate / seasons / environment factors
Not the outcome I expect / want
Issues with genetics, genetic pool, genetic defects
Other
Unsure
20%
11%
11%
9%
8%
7%
6%
5%
3%
3%
3%
20%
5%
Rate of change, system inaccuracies & costs are the most commonly cited specific reasons for cattle Producers’ genetic gains dissatisfaction
BREEDING MEASURES – GENETIC GAINS / BREEDPLAN
Q18. For what reasons are you less than fully satisfied?
Base: Producers not ‘Very satisfied’ from Q17: Cattle Stud – BP user (n=175), Commercial Cattle – BP user (n=123), Commercial Cattle – BP non-user (n=105)
13%
1%
12%
10%
10%
5%
8%
1%
4%
11%
2%
8%
12%
19%
6%
18%
7%
5%
8%
6%
2%
11%
11%
2%
7%
9%
Note: Cattle Stud – BP non-user not shown
due to small base (n=6)
Note that this question was asked only of those professing satisfaction
levels below ‘very’.Therefore these reasons are cited by smaller %s than those shown here when based on the total sample.
Significantly higher than BP non-user – Significantly lower than BP non-user
63 © 2016 Ipsos.
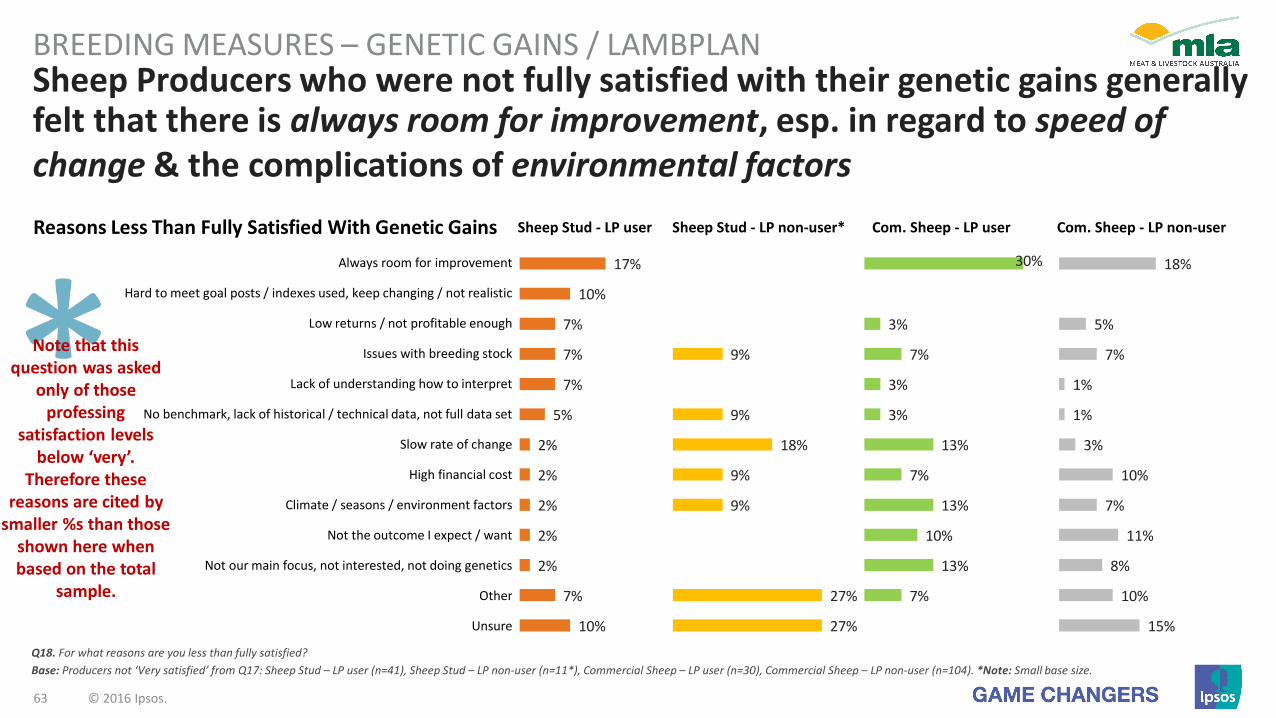
Sheep Producers who were not fully satisfied with their genetic gains generally felt that there is always room for improvement, esp. in regard to speed of change & the complications of environmental factors
BREEDING MEASURES – GENETIC GAINS / LAMBPLAN
Q18. For what reasons are you less than fully satisfied?
Base: Producers not ‘Very satisfied’ from Q17: Sheep Stud – LP user (n=41), Sheep Stud – LP non-user (n=11*), Commercial Sheep – LP user (n=30), Commercial Sheep – LP non-user (n=104). *Note: Small base size.
Reasons Less Than Fully Satisfied With Genetic Gains Sheep Stud - LP user Sheep Stud - LP non-user* Com. Sheep - LP user Com. Sheep - LP non-user
Always room for improvement
Hard to meet goal posts / indexes used, keep changing / not realistic
Low returns / not profitable enough
Issues with breeding stock
Lack of understanding how to interpret
No benchmark, lack of historical / technical data, not full data set
Slow rate of change
High financial cost
Climate / seasons / environment factors
Not the outcome I expect / want
Not our main focus, not interested, not doing genetics
Other
Unsure
17%
10%
7%
7%
7%
5%
2%
2%
2%
2%
2%
7%
10%
18%
5%
7%
1%
1%
3%
10%
7%
11%
8%
10%
15%
30%
3%
7%
3%
3%
13%
7%
13%
10%
13%
7%
9%
9%
18%
9%
9%
27%
27%
Note that this question was asked
only of those professing
satisfaction levels below ‘very’.
Therefore these reasons are cited by
smaller %s than those shown here when based on the total
sample.
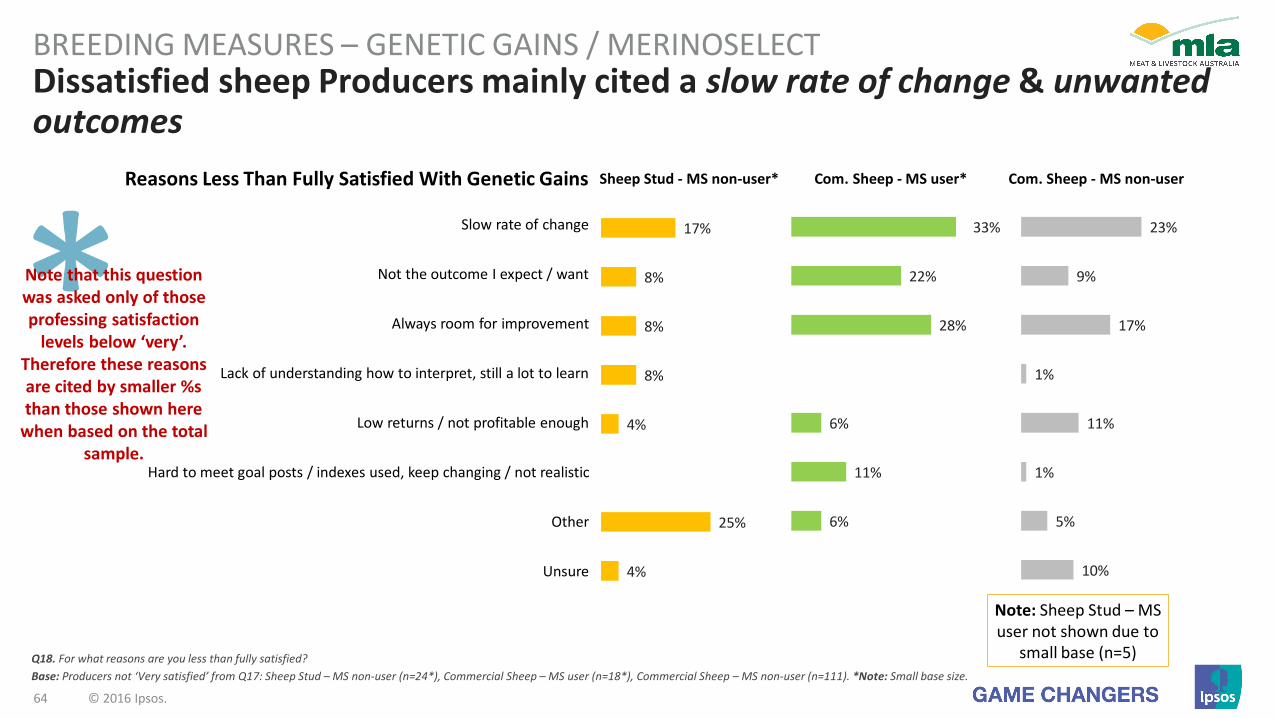
64 © 2016 Ipsos.
Reasons Less Than Fully Satisfied With Genetic Gains Sheep Stud - MS non-user* Com. Sheep - MS user* Com. Sheep - MS non-user
Slow rate of change
Not the outcome I expect / want
Always room for improvement
Lack of understanding how to interpret, still a lot to learn
Low returns / not profitable enough
Hard to meet goal posts / indexes used, keep changing / not realistic
Other
Unsure
17%
8%
8%
8%
4%
25%
4%
Dissatisfied sheep Producers mainly cited a slow rate of change & unwanted outcomes
BREEDING MEASURES – GENETIC GAINS / MERINOSELECT
Q18. For what reasons are you less than fully satisfied?
Base: Producers not ‘Very satisfied’ from Q17: Sheep Stud – MS non-user (n=24*), Commercial Sheep – MS user (n=18*), Commercial Sheep – MS non-user (n=111). *Note: Small base size.
23%
9%
17%
1%
11%
1%
5%
10%
33%
22%
28%
6%
11%
6%
Note: Sheep Stud – MS user not shown due to
small base (n=5)
Note that this question was asked only of those professing satisfaction
levels below ‘very’.Therefore these reasons are cited by smaller %s than those shown here
when based on the total sample.

65 © 2016 Ipsos.
73%
15%
55%
11%
22%
15%
37%
23%
8%
5%
9%
15%
10%
2%
7%
2%
47%
3%
40%
1.4
2.4
1.5
2.6
Sheep Stud - MS user
Sheep Stud - MS non-user*
Commercial Sheep - MS user
Commercial Sheep - MS non-user
57%
14%
43%
15%
29%
36%
39%
20%
7%
9%
5%
9%
5%
9%
8%
2%
5%
4%
5%
27%
8%
43%
1.7
2.4
2.5
Sheep Stud - LP user
Sheep Stud - LP non-user*
Commercial Sheep - LP user
Commercial Sheep - LP non-user
52%
11%
38%
11%
35%
14%
52%
23%
6%
11%
5%
12%
4%
7%
3%
7%
2%
18%
5%
1%
39%
2%
42%
1.7
3.1
1.7
2.5
Cattle Stud - BP user
Cattle Stud - BP non-user*
Commercial Cattle - BP user
Commercial Cattle - BP non-user
Very important (1) Fairly important Neither Fairly unimportant Very unimportant (5) Don't use them Mean
EBVs / ASBVs are significantly more important to PLAN UsersBREEDING MEASURES – EBVS / ASBVS
Q15. How important are EBVs for selecting your breeding bulls? How important are ASBVs for selecting your breeding rams?
Base: Cattle Stud – BP user (n=544), Cattle Stud – BP non-user (n=28*), Commercial Cattle – BP user (n=215), Commercial Cattle – BP non-user (n=244)
Base: Sheep Stud – LP user (n=95), Sheep Stud – LP non-user (n=22*), Commercial Sheep – LP user (n=74), Commercial Sheep – LP non-user (n=241)
Base: Sheep Stud – MS user (n=81), Sheep Stud – MS non-user (n=13*), Commercial Sheep – MS user (n=38), Commercial Sheep – MS non-user (n=230)
1.8
*Note: Small base size.
Sig
nif
ica
ntl
y h
igh
er t
ha
n n
on
-use
r –
Sig
nif
ica
ntl
y lo
wer
th
an
no
n-u
ser
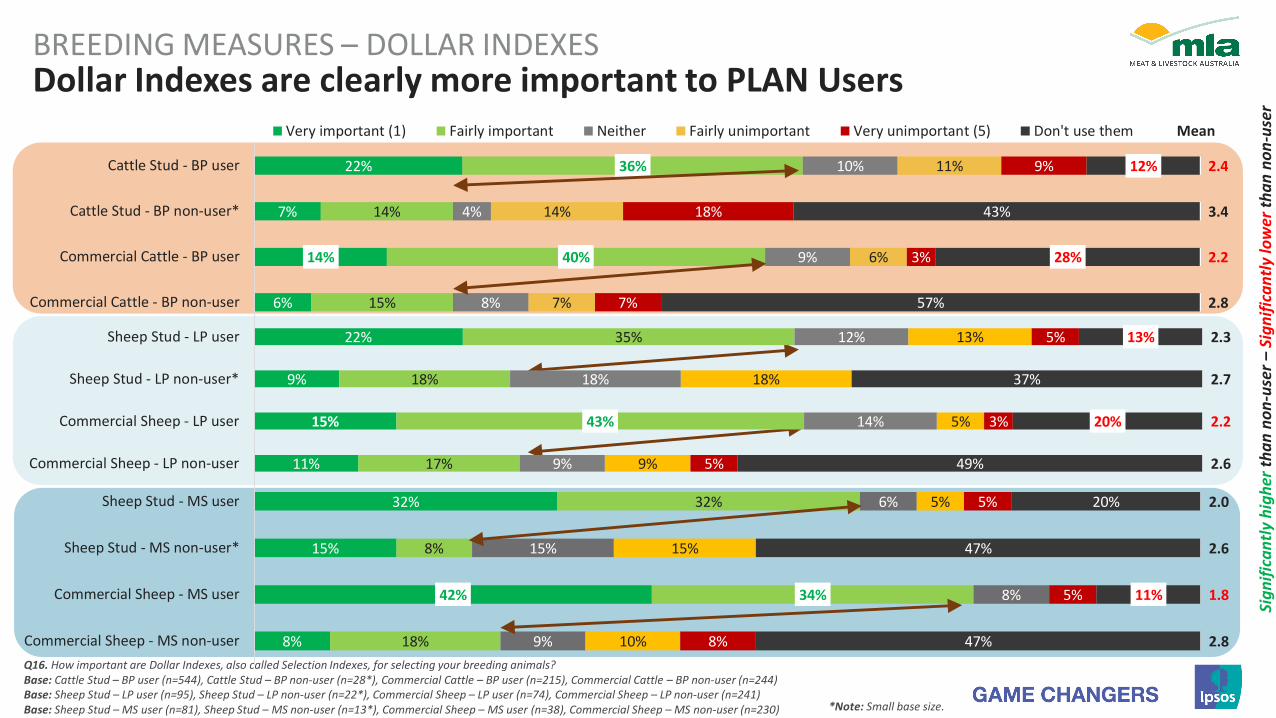
66 © 2016 Ipsos.
22%
7%
14%
6%
36%
14%
40%
15%
10%
4%
9%
8%
11%
14%
6%
7%
9%
18%
3%
7%
12%
43%
28%
57%
2.4
3.4
2.2
2.8
Cattle Stud - BP user
Cattle Stud - BP non-user*
Commercial Cattle - BP user
Commercial Cattle - BP non-user
Very important (1) Fairly important Neither Fairly unimportant Very unimportant (5) Don't use them Mean
Dollar Indexes are clearly more important to PLAN UsersBREEDING MEASURES – DOLLAR INDEXES
Q16. How important are Dollar Indexes, also called Selection Indexes, for selecting your breeding animals?Base: Cattle Stud – BP user (n=544), Cattle Stud – BP non-user (n=28*), Commercial Cattle – BP user (n=215), Commercial Cattle – BP non-user (n=244)Base: Sheep Stud – LP user (n=95), Sheep Stud – LP non-user (n=22*), Commercial Sheep – LP user (n=74), Commercial Sheep – LP non-user (n=241)Base: Sheep Stud – MS user (n=81), Sheep Stud – MS non-user (n=13*), Commercial Sheep – MS user (n=38), Commercial Sheep – MS non-user (n=230)
32%
15%
42%
8%
32%
8%
34%
18%
6%
15%
8%
9%
5%
15%
10%
5%
5%
8%
20%
47%
11%
47%
2.0
2.6
1.8
2.8
Sheep Stud - MS user
Sheep Stud - MS non-user*
Commercial Sheep - MS user
Commercial Sheep - MS non-user
Sig
nif
ica
ntl
y h
igh
er t
ha
n n
on
-use
r –
Sig
nif
ica
ntl
y lo
wer
th
an
no
n-u
ser
22%
9%
15%
11%
35%
18%
43%
17%
12%
18%
14%
9%
13%
18%
5%
9%
5%
3%
5%
13%
37%
20%
49%
2.3
2.7
2.2
2.6
Sheep Stud - LP user
Sheep Stud - LP non-user*
Commercial Sheep - LP user
Commercial Sheep - LP non-user
*Note: Small base size.
67 © 2016 Ipsos.
Key Learnings: Genetic Progress
1. PLAN Users are predictably more likely to have set breeding objectives but not exclusively so – the presence of set breeding objectives is not a predictor of PLAN usage, nor is the absence an indicator of dissatisfactorygenetic gains progress.
2. Those using PLANs use a wider range of metrics and are also more likely to track ‘hidden’ traits; Non-Users are more likely to rely on fewer, more basic assessments such as visuals and weight gain.
3. With the exception of MERINOSELECT Studs, satisfaction with genetic gains is not related to PLAN usage (remembering that satisfaction is related to investment as well as outcome). This means that dissatisfaction with genetics gains will have limited influence in promoting better genetics-based breeding.
4. PLAN Users value metrics like EBVs, ASBVs and Dollar Indexes much more than Non-Users. This indicates that Non-Users are not as desirous of these measures as current Users.
BUSINESS PROFILE & GENETIC PROGRESS

Perceptions of MERINOSELECT LAMBPLAN BREEDPLAN
68 © 2016 Ipsos.
Measuring TRUST
69 © 2016 Ipsos.

70 © 2016 Ipsos.
Trust
Favorability
Familiarity
Advocacy
Understanding types of TrustREPUTATION PYRAMID
Solid Trust: Under-performing Trust:Unfounded Trust: Blind Trust:
Trust
Favorability
Familiarity
Advocacy
Trust
Favorability
Familiarity
Advocacy
Trust
Favorability
Familiarity
Advocacy
Q30b. How much do you feel you know about the overall XYZ system as whole, taking into account all the ways you have learned about or had contact with it. Would you say that you know the XYZ system… / Q30c. Still thinking about the overall XYZ system, taking into account all of the things which you think are important, how favourable or unfavourable is your overall opinion or impression of it? / Q30d. Still thinking about the overall XYZ system, taking into account all of the things which you think are important, how much do you trust or distrust it? / Q30e. Which one of the following statements best reflects your overall opinion and perceptions of the XYZ system?
Note that Advocacy is not contingent on Usage, Trust, Favorability or Familiarity (people may see themselves as recommending something in certain circumstances); but when these factors are absent, the conviction and likelihood of such Advocacy are reduced.
Because the qualitative research uncovered an apparently large degree of distrust in the PLANs and MLA, the nature of the trust felt towards the PLANs was explored within the quantitative survey using the Ipsos model shown below:
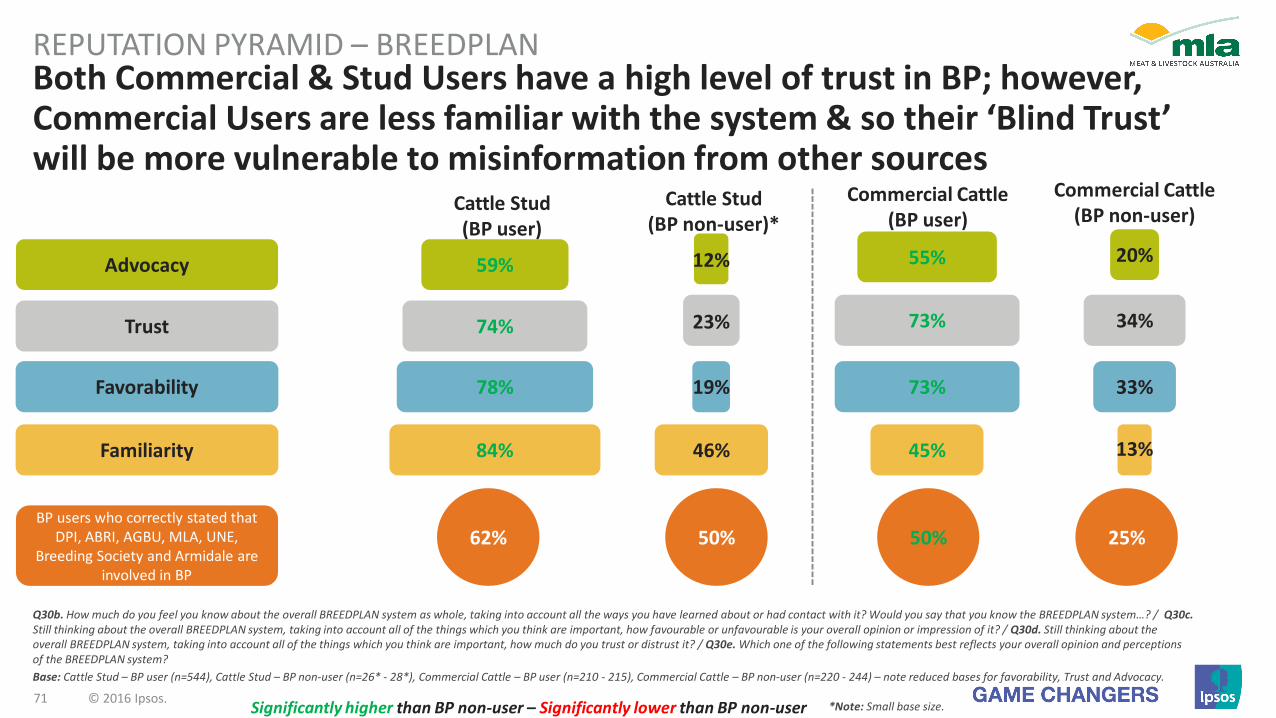
71 © 2016 Ipsos.
Both Commercial & Stud Users have a high level of trust in BP; however, Commercial Users are less familiar with the system & so their ‘Blind Trust’ will be more vulnerable to misinformation from other sources
REPUTATION PYRAMID – BREEDPLAN
74%
78%
84%
59%
Q30b. How much do you feel you know about the overall BREEDPLAN system as whole, taking into account all the ways you have learned about or had contact with it? Would you say that you know the BREEDPLAN system…? / Q30c. Still thinking about the overall BREEDPLAN system, taking into account all of the things which you think are important, how favourable or unfavourable is your overall opinion or impression of it? / Q30d. Still thinking about the overall BREEDPLAN system, taking into account all of the things which you think are important, how much do you trust or distrust it? / Q30e. Which one of the following statements best reflects your overall opinion and perceptions of the BREEDPLAN system?
Base: Cattle Stud – BP user (n=544), Cattle Stud – BP non-user (n=26* - 28*), Commercial Cattle – BP user (n=210 - 215), Commercial Cattle – BP non-user (n=220 - 244) – note reduced bases for favorability, Trust and Advocacy.
46%
73%
73%
45%
55%
34%
33%
62% 50% 50% 25%
Trust
Favorability
Familiarity
Advocacy
BP users who correctly stated that DPI, ABRI, AGBU, MLA, UNE,
Breeding Society and Armidale are involved in BP
Cattle Stud (BP user)
Cattle Stud (BP non-user)*
Commercial Cattle (BP user)
Commercial Cattle (BP non-user)
12%
23%
19%
20%
13%
Significantly higher than BP non-user – Significantly lower than BP non-user *Note: Small base size.

72 © 2016 Ipsos.
1
1.5
2
2.5
3
3.5
4
4.5
5
11.522.533.54
There is a small but positive relationship between BREEDPLAN Trust & Knowledge
BREEDPLAN TRUST – FAMILIARITY MATRIX
Q30b. How much do you feel you know about the overall BREEDPLAN system as whole, taking into account all the ways you have learned about or had contact with it. Would you say that you know the BREEDPLAN system…? / Q30d.Still thinking about the overall BREEDPLAN system, taking into account all of the things which you think are important, how much do you trust or distrust it?
Base: Total cattle Producers (n=1,057)
Familiarity (Knowledge) with BP
Tru
st in
BP
HIGH Familiarity
HIGH Trust
LOWTrust
LOW Familiarity
The relationship between knowledge and trust that was hypothesized in the qualitative stage (see right) was not supported when this larger, morediverse sample was used.

73 © 2016 Ipsos.
Both Commercial & Stud Users have high levels of trust in LAMBPLAN; however, Commercial Users are less familiar with the system & so their ‘Blind Trust’ will be more vulnerable to misinformation from other sources
REPUTATION PYRAMID – LAMBPLAN
Q30b. How much do you feel you know about the overall LAMBPLAN system as whole, taking into account all the ways you have learned about or had contact with it? Would you say that you know the LAMBPLAN system… ? / Q30c.Still thinking about the overall LAMBPLAN system, taking into account all of the things which you think are important, how favourable or unfavourable is your overall opinion or impression of it? / Q30d. Still thinking about the overall LAMBPLAN system, taking into account all of the things which you think are important, how much do you trust or distrust it? / Q30e. Which one of the following statements best reflects your overall opinion and perceptions of the LAMBPLAN system?
Base: Sheep Stud – LP user (n=95), Sheep Stud – LP non-user (n=21* - 22*), Commercial Sheep – LP user (n=74), Commercial Sheep – LP non-user (n=241 - 244) – note reduced bases for favorability, Trust and Advocacy.
Sheep Stud (LP user)
Sheep Stud (LP non-user)*
Advocacy 64% 65% 17%24%
Commercial Sheep (LP user)
Trust 81% 38% 80% 35%
favorability 83% 43% 81% 38%
Commercial Sheep (LP non-user)
Familiarity 80% 32% 51% 12%
LP users who correctly stated that AWI, MLA, Sheep Genetics and
UNE are involved in LP
75% 32% 51% 37%
Significantly higher than LP non-user – Significantly lower than LP non-user *Note: Small base size.

74 © 2016 Ipsos.
Both Commercial & Stud MS Users have high levels of trust in MERINOSELECT; however, Commercial Users are less familiar with the system & so their ‘Blind Trust’ will be more vulnerable to misinformation from other sources
REPUTATION PYRAMID – MERINOSELECT
90%
86%
98%
79%
Q30b. How much do you feel you know about the overall MERINOSELECT system as whole, taking into account all the ways you have learned about or had contact with it? Would you say that you know the MERINOSELECT system…? / Q30c. Still thinking about the overall MERINOSELECT system, taking into account all of the things which you think are important, how favourable or unfavourable is your overall opinion or impression of it? / Q30d. Still thinking about the overall MERINOSELECT system, taking into account all of the things which you think are important, how much do you trust or distrust it? / Q30e. Which one of the following statements best reflects your overall opinion and perceptions of the MERINOSELECT system?
Base: Sheep Stud – MS user (n=81), Sheep Stud – MS non-user (n=13*), Commercial Sheep – MS user (n=38), Commercial Sheep – MS non-user (n=210 - 230) – note reduced bases for favorability, Trust and Advocacy.
79%
84%
55%
76%
30%
30%
89% 31% 79% 39%
Trust
favorability
Familiarity
Advocacy
MS users who correctly stated that AWI, MLA, Sheep Genetics, UNE are
involved in MS
Sheep Stud (MS user)
Sheep Stud (MS non-user)*
Commercial Sheep (MS user)
Commercial Sheep (MS non-user)
15%
23%
23%
15% 13%
10%
*Note: Small base size.Significantly higher than MS non-user – Significantly lower than MS non-user
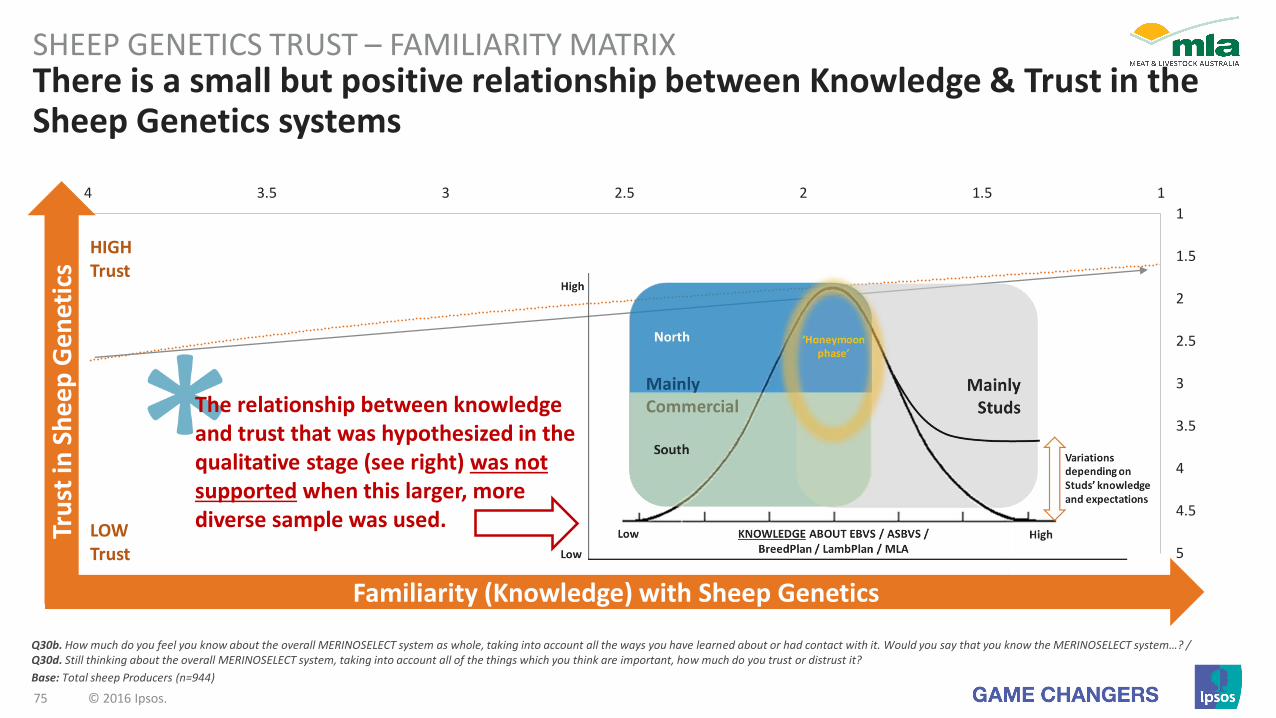
75 © 2016 Ipsos.
1
1.5
2
2.5
3
3.5
4
4.5
5
11.522.533.54
There is a small but positive relationship between Knowledge & Trust in the Sheep Genetics systems
SHEEP GENETICS TRUST – FAMILIARITY MATRIX
Q30b. How much do you feel you know about the overall MERINOSELECT system as whole, taking into account all the ways you have learned about or had contact with it. Would you say that you know the MERINOSELECT system…? / Q30d. Still thinking about the overall MERINOSELECT system, taking into account all of the things which you think are important, how much do you trust or distrust it?
Base: Total sheep Producers (n=944)
LOW FamiliarityHIGH Familiarity Familiarity (Knowledge) with Sheep Genetics
Tru
st in
Sh
ee
p G
en
etic
s
HIGH Trust
LOWTrust
The relationship between knowledge and trust that was hypothesized in the qualitative stage (see right) was not supported when this larger, morediverse sample was used.
Perceptions of BREEDPLAN
76 © 2016 Ipsos.
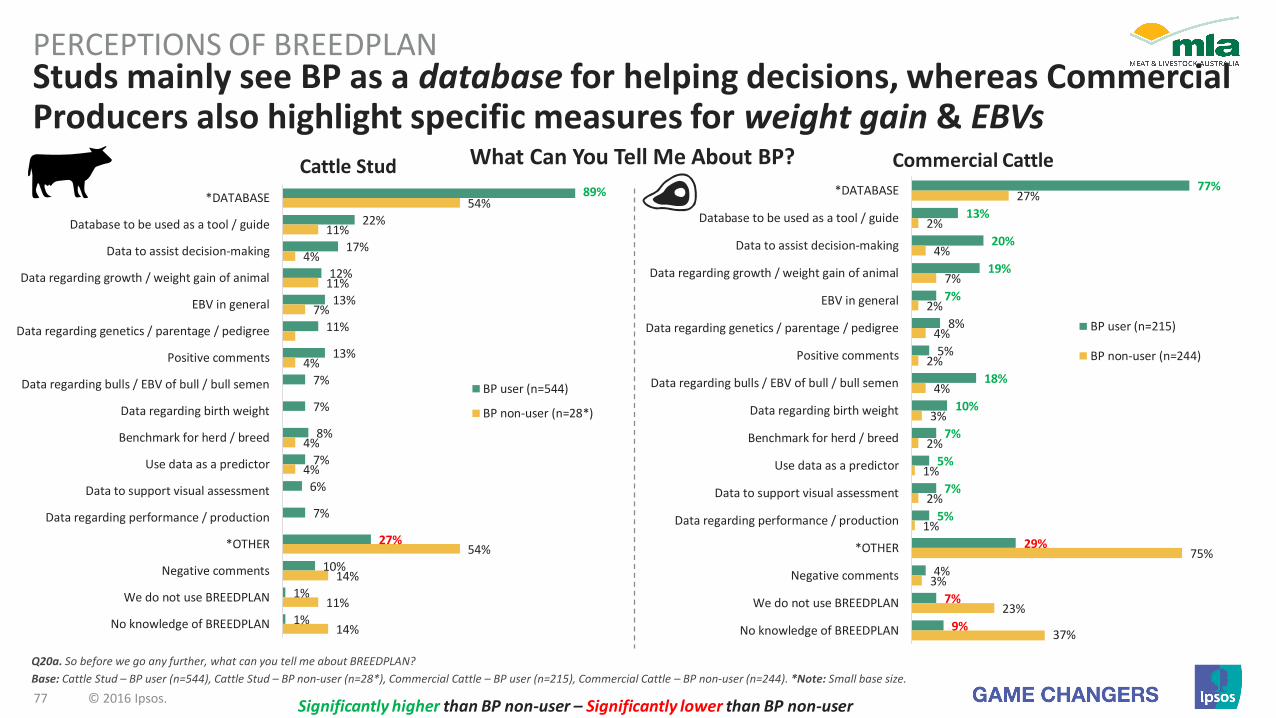
77 © 2016 Ipsos.
77%
13%
20%
19%
7%
8%
5%
18%
10%
7%
5%
7%
5%
29%
4%
7%
9%
27%
2%
4%
7%
2%
4%
2%
4%
3%
2%
1%
2%
1%
75%
3%
23%
37%
*DATABASE
Database to be used as a tool / guide
Data to assist decision-making
Data regarding growth / weight gain of animal
EBV in general
Data regarding genetics / parentage / pedigree
Positive comments
Data regarding bulls / EBV of bull / bull semen
Data regarding birth weight
Benchmark for herd / breed
Use data as a predictor
Data to support visual assessment
Data regarding performance / production
*OTHER
Negative comments
We do not use BREEDPLAN
No knowledge of BREEDPLAN
BP user (n=215)
BP non-user (n=244)
89%
22%
17%
12%
13%
11%
13%
7%
7%
8%
7%
6%
7%
27%
10%
1%
1%
54%
11%
4%
11%
7%
4%
4%
4%
54%
14%
11%
14%
*DATABASE
Database to be used as a tool / guide
Data to assist decision-making
Data regarding growth / weight gain of animal
EBV in general
Data regarding genetics / parentage / pedigree
Positive comments
Data regarding bulls / EBV of bull / bull semen
Data regarding birth weight
Benchmark for herd / breed
Use data as a predictor
Data to support visual assessment
Data regarding performance / production
*OTHER
Negative comments
We do not use BREEDPLAN
No knowledge of BREEDPLAN
BP user (n=544)
BP non-user (n=28*)
Studs mainly see BP as a database for helping decisions, whereas Commercial Producers also highlight specific measures for weight gain & EBVs
PERCEPTIONS OF BREEDPLAN
Q20a. So before we go any further, what can you tell me about BREEDPLAN?
Base: Cattle Stud – BP user (n=544), Cattle Stud – BP non-user (n=28*), Commercial Cattle – BP user (n=215), Commercial Cattle – BP non-user (n=244). *Note: Small base size.
Cattle Stud What Can You Tell Me About BP? Commercial Cattle
Significantly higher than BP non-user – Significantly lower than BP non-user

78 © 2016 Ipsos.
The majority of Producers view BP positively, with some reservationsPERCEPTIONS OF BREEDPLAN
Q20a. So before we go any further, what can you tell me about BREEDPLAN?
Base: Cattle Stud – BP user (n=544), Cattle Stud – BP non-user (n=28*), Commercial Cattle – BP user (n=215), Commercial Cattle – BP non-user (n=244). *Note: Small base size.
What Can You Tell Me About BP?
Cattle Stud – BP user
It’s a rough guide / size on the cows.
BREEDPLAN is a calculation of the
relative Commercial benefit of animal with
high EBV figures.
BREEDPLAN gives a better idea of where you are going
and where you want to go. As far as selling something it
serves a purpose. So there is guidance there.
Is not a major tool in my operation; I don’t feel it is a massive tool in the
industry; there is a big change to get away from it. Is there to keep data records; you can manipulate these
numbers; it’s not what people should buy cattle from. They market cattle
on these figures.
It’s an important tool that we contribute data to and we get estimated breeding values that help us
and our customers…
It’s just a matter of collecting data from birth weight calving scanning
eye muscle fat and performance.
Measure the animals’ weight at birth and compare with
animals in the herd, think it’s quite a good idea.
It’s about trying to prove the genetics and the weight gain.
It can be considered when you are purchasing bulls and females for crossbreeding or
breeding of any sort.
We would use semen as we use AI sometime; then we would look at the EBVs
because we are small operation; temperament is
important to us.
It’s an objective tool for improving genetic gain.
Cattle Stud – BP non-user* Commercial Cattle – BP user Commercial Cattle – BP non-user

79 © 2016 Ipsos.
90%
27%
17%
17%
12%
12%
10%
4%
24%
3%
46%
7%
7%
18%
4%
4%
11%
7%
50%
*TOOL / INFORMATION
Aids selection / decision-making
Breeding stock
A tool / guide
Benchmark / comparison
Helps with marketing
Able to assess the unseen elements / traits
Performance in general
*GENETICS
None, Don’t know
BP user (n=544)
BP non-user (n=28*)
80%
30%
30%
12%
5%
3%
11%
3%
22%
13%
31%
7%
6%
5%
2%
1%
1%
2%
7%
66%
*TOOL / INFORMATION
Aids selection / decision-making
Breeding stock
A tool / guide
Benchmark / comparison
Helps with marketing
Able to assess the unseen elements / traits
Performance in general
*GENETICS
None, Don’t know
BP user (n=215)
BP non-user (n=244)
The most commonly-cited benefits of BP are its decision-helping capabilities PERCEPTIONS OF BREEDPLAN
Q20b. What are the best things about BREEDPLAN for people running businesses like yours?
Base: Cattle Stud – BP user (n=544), Cattle Stud – BP non-user (n=28*), Commercial Cattle – BP user (n=215), Commercial Cattle – BP non-user (n=244). *Note: Small base size.
Cattle StudWhat Are The Best Things About BP?
Commercial Cattle
Significantly higher than BP non-user – Significantly lower than BP non-user
Non-Users find it harder to cite positive aspects, which indicates
reduced attraction to them.

80 © 2016 Ipsos.
The majority of comments relate to how BP can be a useful toolPERCEPTIONS OF BREEDPLAN
Cattle Stud – BP user
It provides a quantifiable and measurable product. It’s a useful indicator and
provides productive indictor for your seed stock.
It’s a tool for people who don’t know how to look at cattle and how to see; it’s a tool on how to assess them.
Showing you the animals and comparisons, size of calves, etc., allows you to look at genetics all over the world and gives the advantage to
source from overseas.
Good, quick, easy guide to sell animals, it is also a
useful tool.
It makes it easier to check whether genetics would suit what you are
aiming for. It makes it easier to match the
genetics to your objectives.
Gives you some idea on how to make decisions on what
you are buying when it comes to bulls.
You can track your herd’s growth to make sure it is going in the direction you
want it to go in, i.e. financial and physical beef growth.
It gives you what the breeding value of the animal is based on genetics rather
than just environment.Gives you another option to look at when buying stock. Before it was just done on
visual with no actual history. Now there is.
Cattle Stud – BP non-user* Commercial Cattle – BP user Commercial Cattle – BP non-user
What Are The Best Things About BP?
Management tool for assisting selection. A good tool to work with.
Benchmarking, using BREEDPLAN to select good
bulls. I suppose the hard thing is if you put more into
it, you get more out of it.
Q20b. What are the best things about BREEDPLAN for people running businesses like yours?
Base: Cattle Stud – BP user (n=544), Cattle Stud – BP non-user (n=28*), Commercial Cattle – BP user (n=215), Commercial Cattle – BP non-user (n=244). *Note: Small base size.
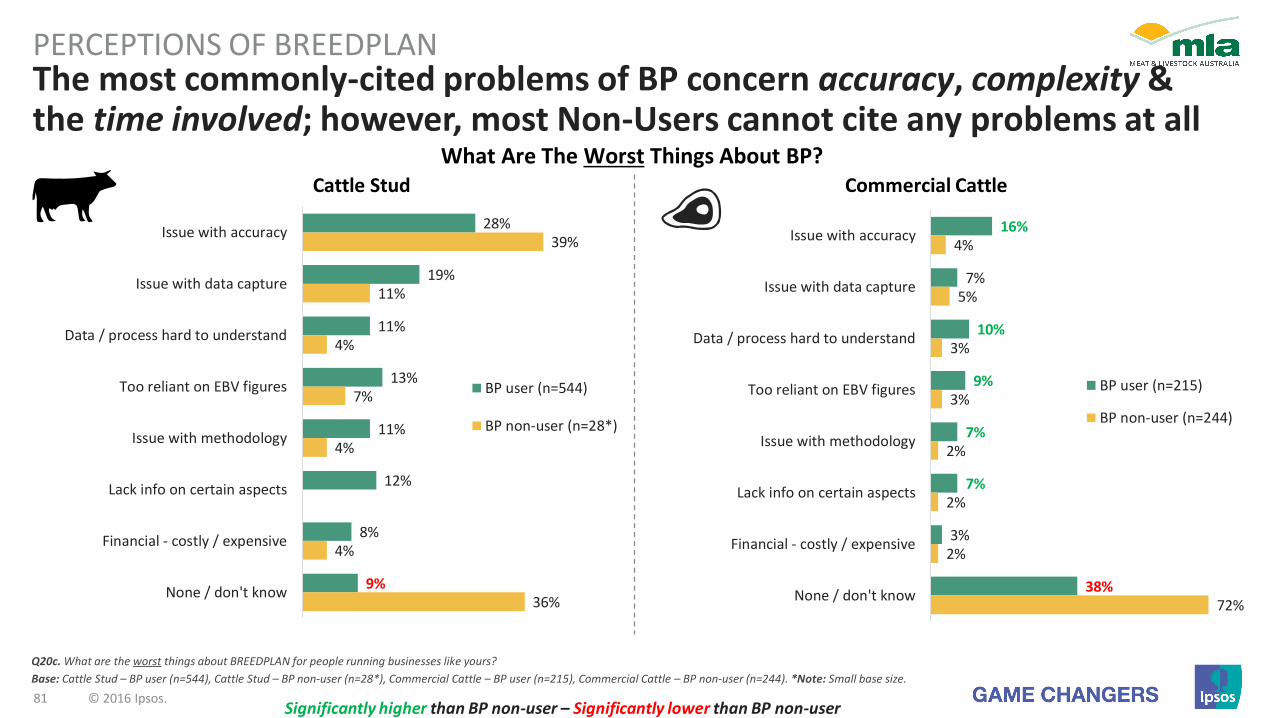
81 © 2016 Ipsos.
28%
19%
11%
13%
11%
12%
8%
9%
39%
11%
4%
7%
4%
4%
36%
Issue with accuracy
Issue with data capture
Data / process hard to understand
Too reliant on EBV figures
Issue with methodology
Lack info on certain aspects
Financial - costly / expensive
None / don't know
BP user (n=544)
BP non-user (n=28*)
The most commonly-cited problems of BP concern accuracy, complexity &the time involved; however, most Non-Users cannot cite any problems at all
PERCEPTIONS OF BREEDPLAN
Q20c. What are the worst things about BREEDPLAN for people running businesses like yours?
Base: Cattle Stud – BP user (n=544), Cattle Stud – BP non-user (n=28*), Commercial Cattle – BP user (n=215), Commercial Cattle – BP non-user (n=244). *Note: Small base size.
16%
7%
10%
9%
7%
7%
3%
38%
4%
5%
3%
3%
2%
2%
2%
72%
Issue with accuracy
Issue with data capture
Data / process hard to understand
Too reliant on EBV figures
Issue with methodology
Lack info on certain aspects
Financial - costly / expensive
None / don't know
BP user (n=215)
BP non-user (n=244)
What Are The Worst Things About BP?Cattle Stud Commercial Cattle
Significantly higher than BP non-user – Significantly lower than BP non-user
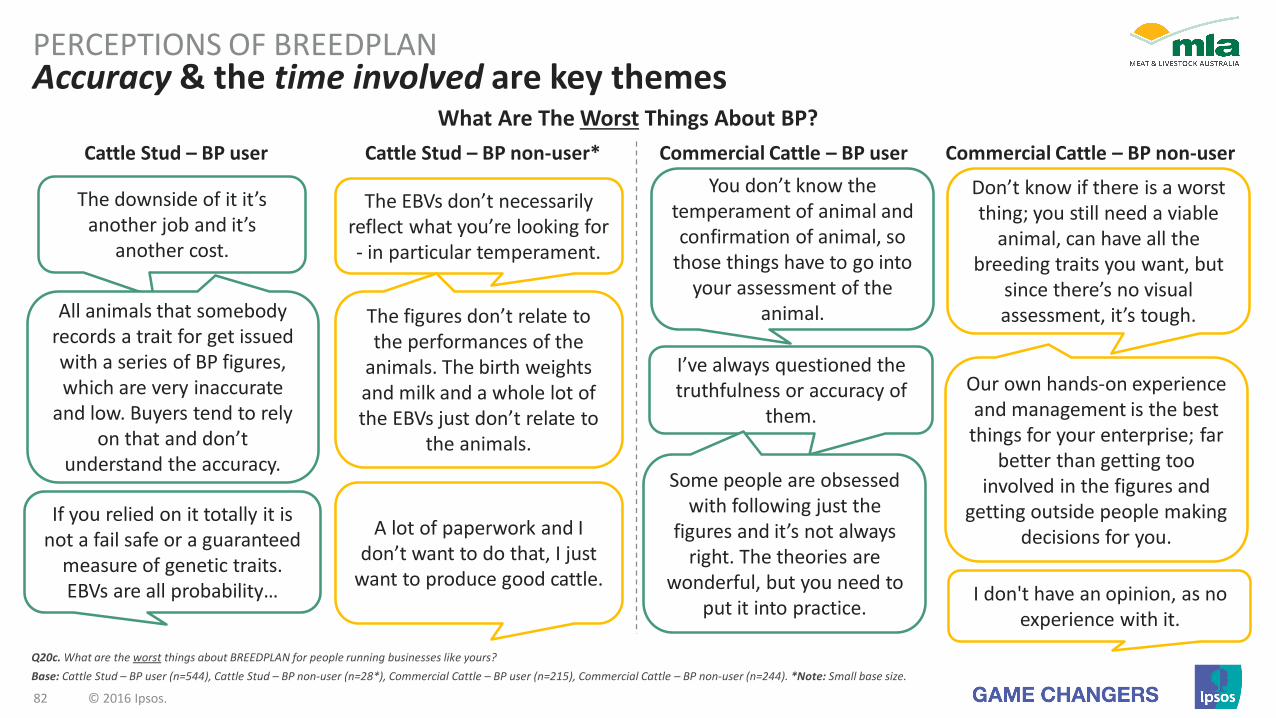
82 © 2016 Ipsos.
Accuracy & the time involved are key themesPERCEPTIONS OF BREEDPLAN
Cattle Stud – BP user
The downside of it it’s another job and it’s
another cost.
All animals that somebody records a trait for get issued with a series of BP figures, which are very inaccurate
and low. Buyers tend to rely on that and don’t
understand the accuracy.
The EBVs don’t necessarily reflect what you’re looking for - in particular temperament.
The figures don’t relate to the performances of the
animals. The birth weights and milk and a whole lot of the EBVs just don’t relate to
the animals.
If you relied on it totally it is not a fail safe or a guaranteed
measure of genetic traits. EBVs are all probability…
Cattle Stud – BP non-user* Commercial Cattle – BP user Commercial Cattle – BP non-user
What Are The Worst Things About BP?
A lot of paperwork and I don’t want to do that, I just
want to produce good cattle.
Q20c. What are the worst things about BREEDPLAN for people running businesses like yours?
Base: Cattle Stud – BP user (n=544), Cattle Stud – BP non-user (n=28*), Commercial Cattle – BP user (n=215), Commercial Cattle – BP non-user (n=244). *Note: Small base size.
You don’t know the temperament of animal and confirmation of animal, so
those things have to go into your assessment of the
animal.
Don’t know if there is a worst thing; you still need a viable
animal, can have all the breeding traits you want, but
since there’s no visual assessment, it’s tough.
I don't have an opinion, as no experience with it.
Our own hands-on experience and management is the best things for your enterprise; far
better than getting too involved in the figures and
getting outside people making decisions for you.
I’ve always questioned the truthfulness or accuracy of
them.
Some people are obsessed with following just the
figures and it’s not always right. The theories are
wonderful, but you need to put it into practice.
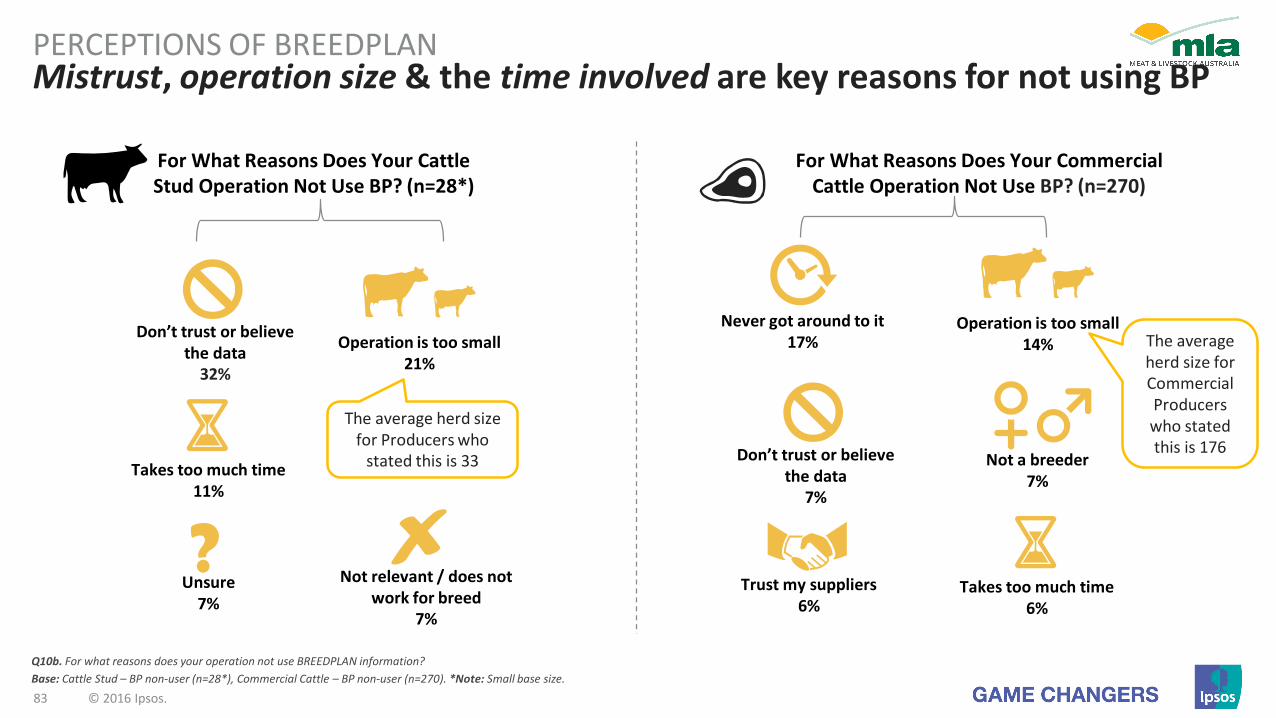
83 © 2016 Ipsos.
Mistrust, operation size & the time involved are key reasons for not using BPPERCEPTIONS OF BREEDPLAN
Q10b. For what reasons does your operation not use BREEDPLAN information?
Base: Cattle Stud – BP non-user (n=28*), Commercial Cattle – BP non-user (n=270). *Note: Small base size.
For What Reasons Does Your Cattle Stud Operation Not Use BP? (n=28*)
Operation is too small21%
Don’t trust or believe the data
32%
Takes too much time11%
The average herd size for Producers who
stated this is 33
For What Reasons Does Your Commercial Cattle Operation Not Use BP? (n=270)
Never got around to it17%
Operation is too small14%
Don’t trust or believe the data
7%
Takes too much time6%
The average herd size for Commercial Producers who stated this is 176
Unsure 7%
Not relevant / does not work for breed
7%
Trust my suppliers6%
Not a breeder7%
?
Perceptions of LAMBPLAN
84 © 2016 Ipsos.

85 © 2016 Ipsos.
86%
41%
42%
19%
12%
7%
11%
20%
19%
26%
1%
7%
26%
2%
4%
2%
3%
4%
4%
8%
7%
77%
2%
51%
9%
*DATABASE
Data to assist decision-making
Data regarding rams
Data regarding genetics / parentage / pedigree
Database to be used as a tool
Positive comments
Data regarding growth / weight gain
*OTHER LAMBPLAN
LAMBPLAN
*OTHER
Negative comments
None / nothing / DK / do not use nfi
No comment
LP user (n=74)
LP non-user (n=241)
83%
15%
11%
20%
20%
15%
4%
13%
11%
29%
13%
27%
5%
9%
5%
5%
5%
5%
77%
14%
27%
9%
*DATABASE
Data to assist decision-making
Data regarding rams
Data regarding genetics / parentage / pedigree
Database to be used as a tool
Positive comments
Data regarding growth / weight gain
*OTHER LAMBPLAN
LAMBPLAN
*OTHER
Negative comments
None / nothing / DK / do not use nfi
No comment
LP user (n=95)
LP non-user (n=22*)
Commercial sheep Producers tend to cite a wider range of LP featuresPERCEPTIONS OF LAMBPLAN
Q21a. So before we go any further, what can you tell me about LAMBPLAN?
Base: Sheep Stud – LP user (n=95), Sheep Stud – LP non-user (n=22*), Commercial Sheep – LP user (n=74), Commercial Sheep – LP non-user (n=241). *Note: Small base size.
Sheep StudWhat Can You Tell Me About LP?
Commercial Sheep
Significantly higher than LP non-user – Significantly lower than LP non-user
Not coded / shown here as too few said enough on a
consistent theme.to warrant charting.
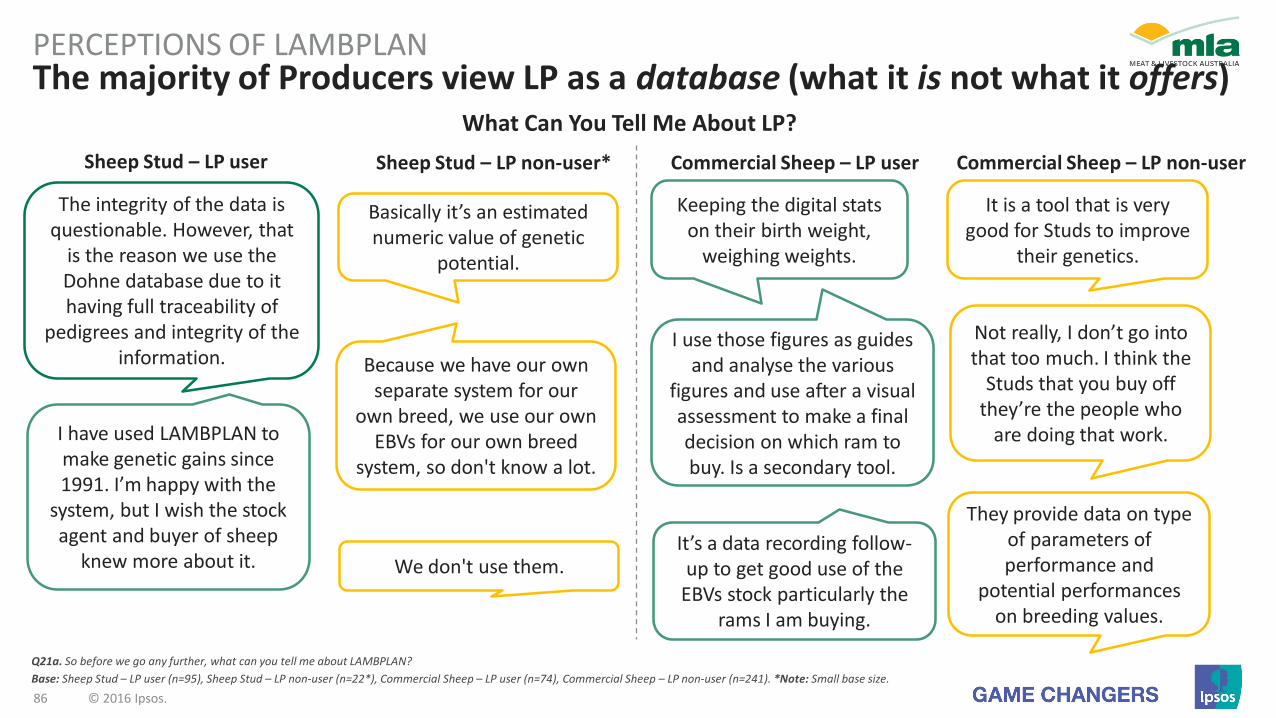
86 © 2016 Ipsos.
The majority of Producers view LP as a database (what it is not what it offers) PERCEPTIONS OF LAMBPLAN
What Can You Tell Me About LP?
Sheep Stud – LP user
Basically it’s an estimated numeric value of genetic
potential.
I have used LAMBPLAN to make genetic gains since 1991. I’m happy with the
system, but I wish the stock agent and buyer of sheep
knew more about it.
The integrity of the data is questionable. However, that
is the reason we use the Dohne database due to it having full traceability of
pedigrees and integrity of the information. Because we have our own
separate system for our own breed, we use our own
EBVs for our own breed system, so don't know a lot.
Keeping the digital stats on their birth weight,
weighing weights.
It is a tool that is very good for Studs to improve
their genetics.
They provide data on type of parameters of performance and
potential performances on breeding values.
Not really, I don’t go into that too much. I think the
Studs that you buy off they’re the people who
are doing that work.
I use those figures as guides and analyse the various
figures and use after a visual assessment to make a final decision on which ram to buy. Is a secondary tool.
It’s a data recording follow-up to get good use of the
EBVs stock particularly the rams I am buying.
Sheep Stud – LP non-user* Commercial Sheep – LP user Commercial Sheep – LP non-user
Q21a. So before we go any further, what can you tell me about LAMBPLAN?
Base: Sheep Stud – LP user (n=95), Sheep Stud – LP non-user (n=22*), Commercial Sheep – LP user (n=74), Commercial Sheep – LP non-user (n=241). *Note: Small base size.
We don't use them.
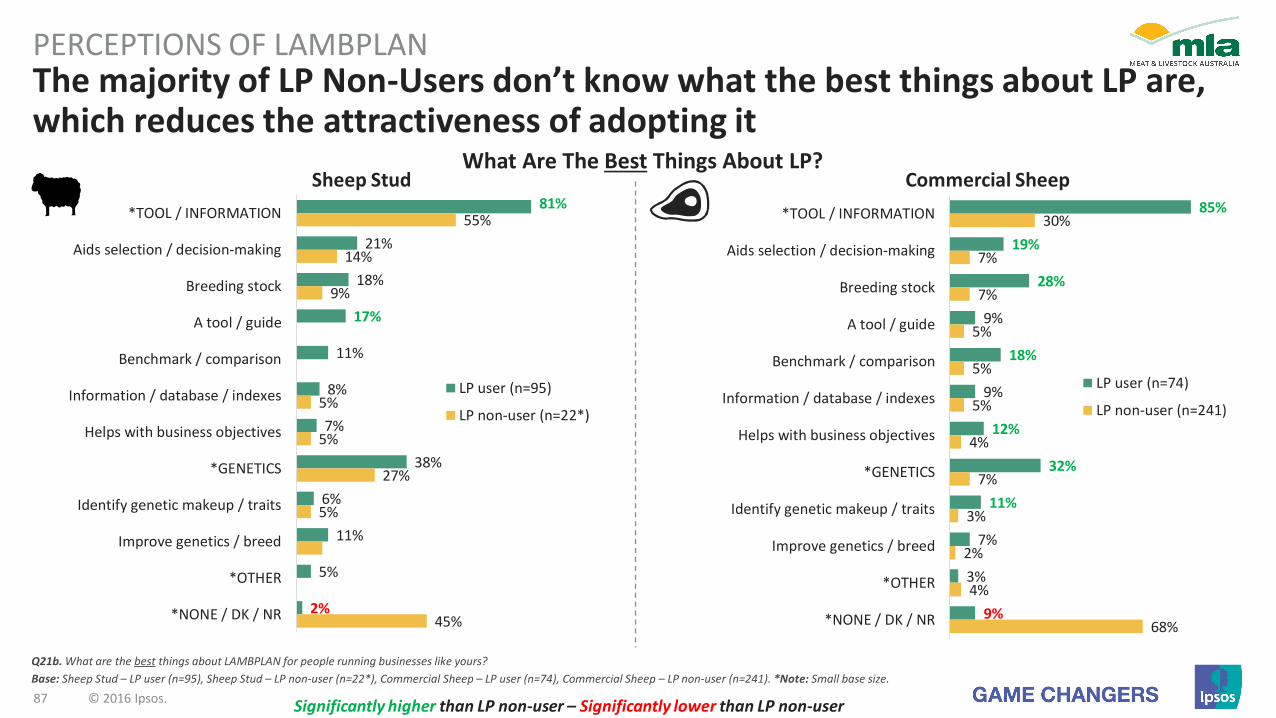
87 © 2016 Ipsos.
81%
21%
18%
17%
11%
8%
7%
38%
6%
11%
5%
2%
55%
14%
9%
5%
5%
27%
5%
45%
*TOOL / INFORMATION
Aids selection / decision-making
Breeding stock
A tool / guide
Benchmark / comparison
Information / database / indexes
Helps with business objectives
*GENETICS
Identify genetic makeup / traits
Improve genetics / breed
*OTHER
*NONE / DK / NR
LP user (n=95)
LP non-user (n=22*)
85%
19%
28%
9%
18%
9%
12%
32%
11%
7%
3%
9%
30%
7%
7%
5%
5%
5%
4%
7%
3%
2%
4%
68%
*TOOL / INFORMATION
Aids selection / decision-making
Breeding stock
A tool / guide
Benchmark / comparison
Information / database / indexes
Helps with business objectives
*GENETICS
Identify genetic makeup / traits
Improve genetics / breed
*OTHER
*NONE / DK / NR
LP user (n=74)
LP non-user (n=241)
The majority of LP Non-Users don’t know what the best things about LP are, which reduces the attractiveness of adopting it
PERCEPTIONS OF LAMBPLAN
Q21b. What are the best things about LAMBPLAN for people running businesses like yours?
Base: Sheep Stud – LP user (n=95), Sheep Stud – LP non-user (n=22*), Commercial Sheep – LP user (n=74), Commercial Sheep – LP non-user (n=241). *Note: Small base size.
What Are The Best Things About LP?Sheep Stud Commercial Sheep
Significantly higher than LP non-user – Significantly lower than LP non-user
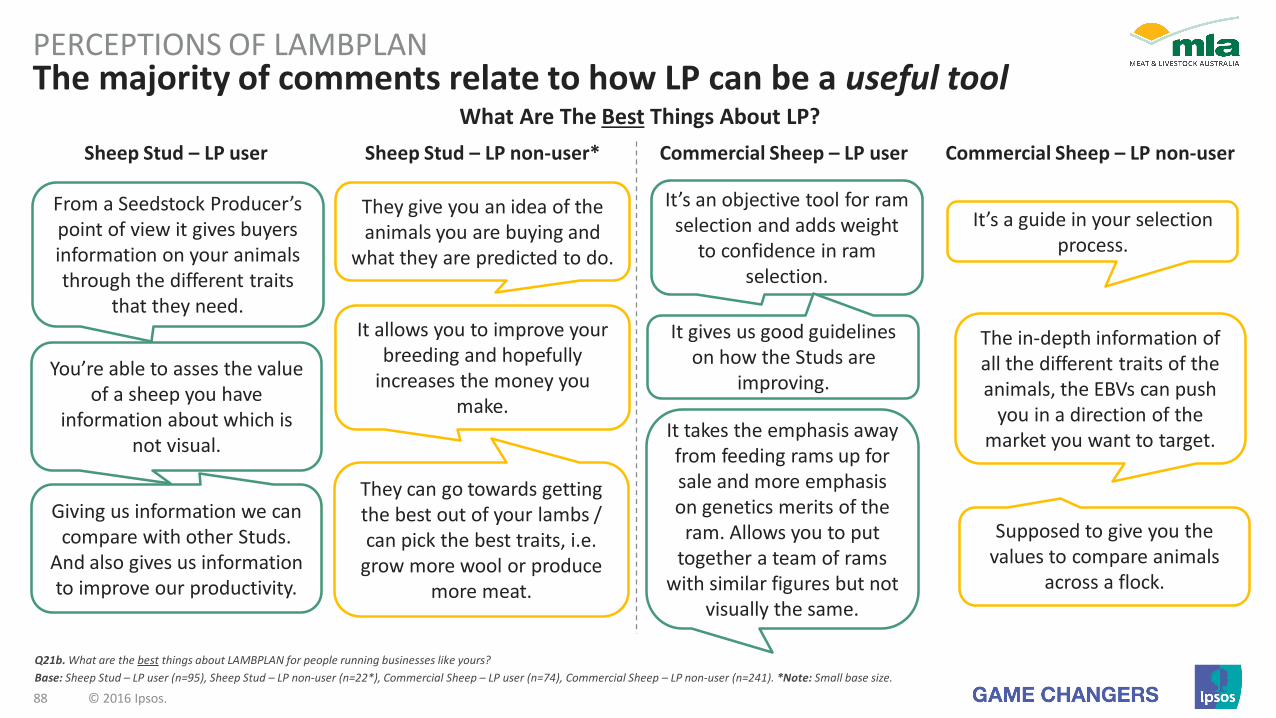
88 © 2016 Ipsos.
The majority of comments relate to how LP can be a useful toolPERCEPTIONS OF LAMBPLAN
Q21b. What are the best things about LAMBPLAN for people running businesses like yours?
Base: Sheep Stud – LP user (n=95), Sheep Stud – LP non-user (n=22*), Commercial Sheep – LP user (n=74), Commercial Sheep – LP non-user (n=241). *Note: Small base size.
Sheep Stud – LP user
From a Seedstock Producer’s point of view it gives buyers information on your animals through the different traits
that they need.
They give you an idea of the animals you are buying and
what they are predicted to do.
It allows you to improve your breeding and hopefully
increases the money you make.
You’re able to asses the value of a sheep you have
information about which is not visual.
It’s an objective tool for ram selection and adds weight
to confidence in ram selection.
It’s a guide in your selection process.
Supposed to give you the values to compare animals
across a flock.
The in-depth information of all the different traits of the animals, the EBVs can push
you in a direction of the market you want to target.
It gives us good guidelines on how the Studs are
improving.
Sheep Stud – LP non-user* Commercial Sheep – LP user Commercial Sheep – LP non-user
What Are The Best Things About LP?
They can go towards getting the best out of your lambs / can pick the best traits, i.e.
grow more wool or produce more meat.
It takes the emphasis away from feeding rams up for sale and more emphasis on genetics merits of the
ram. Allows you to put together a team of rams
with similar figures but not visually the same.
Giving us information we can compare with other Studs.
And also gives us information to improve our productivity.

89 © 2016 Ipsos.
28%
18%
12%
12%
13%
3%
14%
5%
5%
14%
5%
14%
55%
Issue with data capture
Issue with accuracy / quality
Data / process hard to understand
Financial
LAMBPLAN
Too reliant on ASBV figures
*NONE / DK / NR
LP user (n=95)
LP non-user (n=22*)
The common LP problems relate to issues with accuracy & data capturePERCEPTIONS OF LAMBPLAN
Q21c. What are the worst things about LAMBPLAN for people running businesses like yours?
Base: Sheep Stud – LP user (n=95), Sheep Stud – LP non-user (n=22*), Commercial Sheep – LP user (n=74), Commercial Sheep – LP non-user (n=241). *Note: Small base size.
7%
9%
15%
1%
3%
5%
47%
5%
5%
3%
1%
1%
1%
78%
Issue with data capture
Issue with accuracy / quality
Data / process hard to understand
Financial
LAMBPLAN
Too reliant on ASBV figures
*NONE / DK / NR
LP user (n=74)
LP non-user (n=241)
What Are The Worst Things About LP?
Sheep Stud Commercial Sheep
Significantly higher than LP non-user – Significantly lower than LP non-user

90 © 2016 Ipsos.
Data capture, accuracy & understanding are key themesPERCEPTIONS OF LAMBPLAN
Sheep Stud – LP user
A bit costly, the whole process is costly, if you’re in the system it isolates your genetic selection to only
people within the system.
Not convinced with comparing against Studs.
Not relevant to me as I’m not using it, but I think that other people rely on it too much.
The figures don’t always show up in the sheep, sheep
may have real high figures and when you look at him in
the paddock he does not look like a sheep.
The amount of data that you have to put in, the weight scanning is a lot of work
involved and you have to pay to get it done.
If you have no visual appraisal of the lambs,
LAMBPLAN does not work.
Trying to take it all in to get what you want out of it the
best part out of it.
I think added workload in the office and increased time to
deal with it.
The accuracy of the data collected by individual Studs and the associated ambiguity
around that.
Sometimes you can find the numbers confusing, as it is a moving scale. May be difficult for some people to
follow.
Sheep Stud – LP non-user* Commercial Sheep – LP user Commercial Sheep – LP non-user
What Are The Worst Things About LP?
Sometimes you can get blinded by figures and still need to look at the animal
itself.
Q21c. What are the worst things about LAMBPLAN for people running businesses like yours?
Base: Sheep Stud – LP user (n=95), Sheep Stud – LP non-user (n=22*), Commercial Sheep – LP user (n=74), Commercial Sheep – LP non-user (n=241). *Note: Small base size.
There’s that many figures involved, they can get a bit
baffled with that.
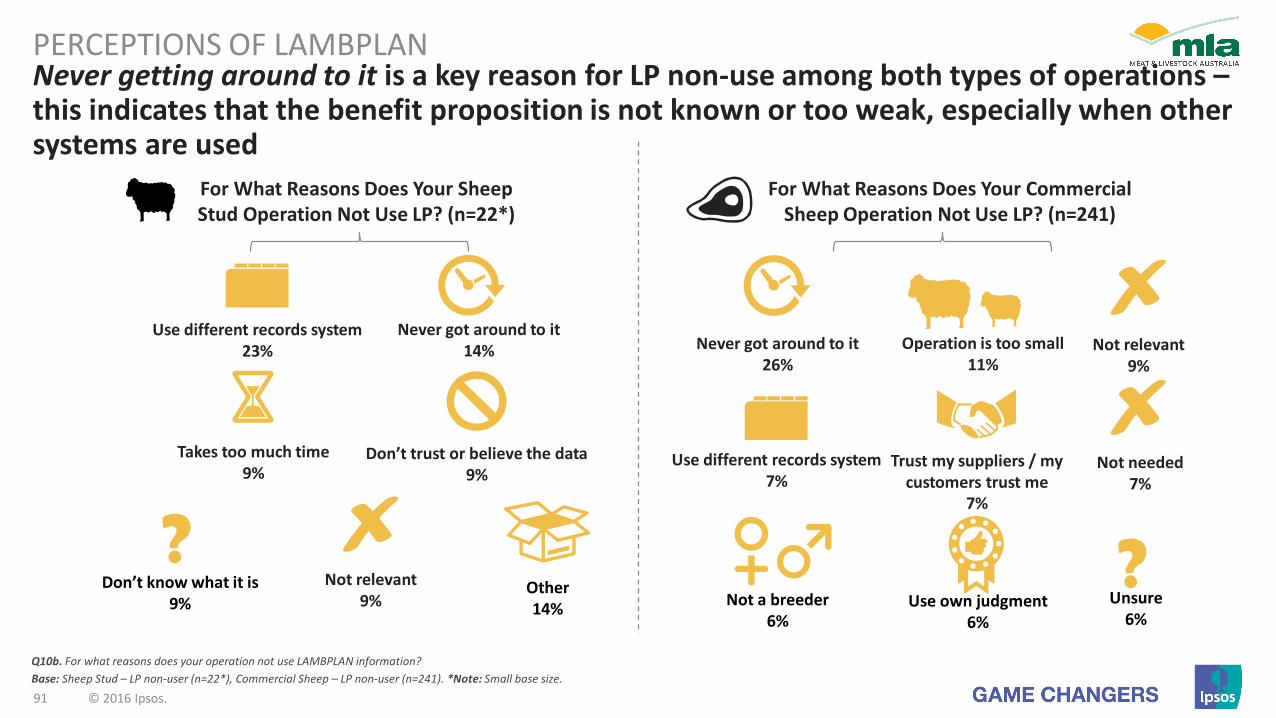
91 © 2016 Ipsos.
Never getting around to it is a key reason for LP non-use among both types of operations –this indicates that the benefit proposition is not known or too weak, especially when other systems are used
PERCEPTIONS OF LAMBPLAN
Q10b. For what reasons does your operation not use LAMBPLAN information?
Base: Sheep Stud – LP non-user (n=22*), Commercial Sheep – LP non-user (n=241). *Note: Small base size.
For What Reasons Does Your Sheep Stud Operation Not Use LP? (n=22*)
Use different records system23%
Never got around to it14%
For What Reasons Does Your Commercial Sheep Operation Not Use LP? (n=241)
Don’t trust or believe the data9%
Takes too much time9%
Trust my suppliers / my customers trust me
7%
Use different records system7%
Never got around to it26%
Not needed7%
Not relevant9%
Operation is too small11%
Not relevant9%
Don’t know what it is 9%
?Other14%
Unsure 6%
?Not a breeder
6%Use own judgment
6%
Perceptions of MERINOSELECT
92 © 2016 Ipsos.
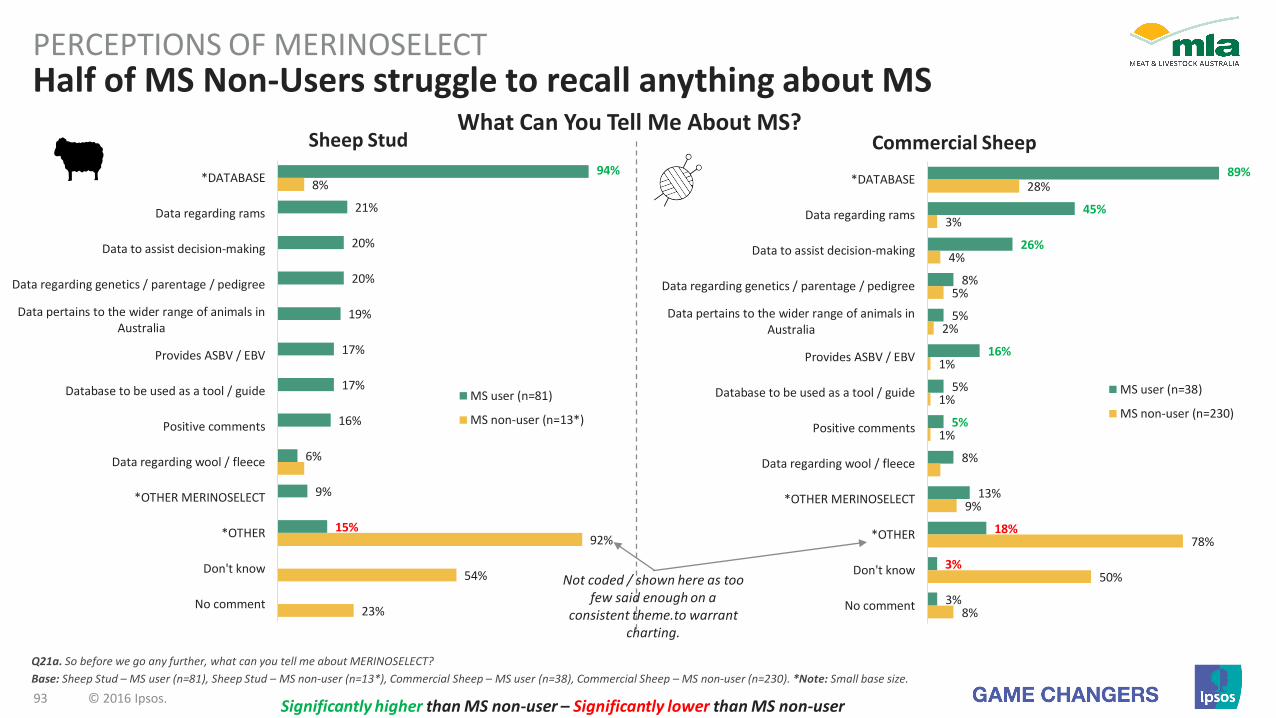
93 © 2016 Ipsos.
94%
21%
20%
20%
19%
17%
17%
16%
6%
9%
15%
8%
92%
54%
23%
*DATABASE
Data regarding rams
Data to assist decision-making
Data regarding genetics / parentage / pedigree
Data pertains to the wider range of animals inAustralia
Provides ASBV / EBV
Database to be used as a tool / guide
Positive comments
Data regarding wool / fleece
*OTHER MERINOSELECT
*OTHER
Don't know
No comment
MS user (n=81)
MS non-user (n=13*)
Half of MS Non-Users struggle to recall anything about MSPERCEPTIONS OF MERINOSELECT
Q21a. So before we go any further, what can you tell me about MERINOSELECT?
Base: Sheep Stud – MS user (n=81), Sheep Stud – MS non-user (n=13*), Commercial Sheep – MS user (n=38), Commercial Sheep – MS non-user (n=230). *Note: Small base size.
Sheep Stud Commercial Sheep
89%
45%
26%
8%
5%
16%
5%
5%
8%
13%
18%
3%
3%
28%
3%
4%
5%
2%
1%
1%
1%
9%
78%
50%
8%
*DATABASE
Data regarding rams
Data to assist decision-making
Data regarding genetics / parentage / pedigree
Data pertains to the wider range of animals inAustralia
Provides ASBV / EBV
Database to be used as a tool / guide
Positive comments
Data regarding wool / fleece
*OTHER MERINOSELECT
*OTHER
Don't know
No comment
MS user (n=38)
MS non-user (n=230)
Significantly higher than MS non-user – Significantly lower than MS non-user
What Can You Tell Me About MS?
Not coded / shown here as too few said enough on a
consistent theme.to warrant charting.

94 © 2016 Ipsos.
MS is generally viewed as a helpful database toolPERCEPTIONS OF MERINOSELECT
Q21a. So before we go any further, what can you tell me about MERINOSELECT?
Base: Sheep Stud – MS user (n=81), Sheep Stud – MS non-user (n=13*), Commercial Sheep – MS user (n=38), Commercial Sheep – MS non-user (n=230). *Note: Small base size.
What Can You Tell Me About MS?
Sheep Stud – MS user
We use it as a bit of a sales tool for selling rams.
It collects data from all over Australia. It allows us measure our animals to compare with others.
All traits and the two that are number of lambs / fertility /
traits for Caracas / fat depth / muscle depth / yearly weight /
worm egg count / wool.
It’s a tool, it’s not a ‘be all or end all’. We have to
use visuals as well. ASBV figures are very handy.
It is a way of comparing rams from different breeders across the country to remove
environmental effects.
MERINOSELECT has a pool of animals with genetic
characteristics.
Compares sheep from other flock, tries to standardise.
Don’t worry much about it.They are informative, don’t take everything on board, pick and choose what suits me. Info there if and when
I require it.
I use ASBV to select my rams and don’t buy rams
without ASBV.
Sheep Stud – MS non-user* Commercial Sheep – MS user Commercial Sheep – MS non-user
Don't know much about it don't have much to do with
that sort of thing.
Know a little bit / do look at figures.
MERINOSELECT has influence in comparing merino genetics
on national basis.

95 © 2016 Ipsos.
89%
45%
26%
8%
5%
16%
5%
5%
8%
13%
18%
28%
3%
4%
5%
2%
1%
1%
1%
4%
78%
*DATABASE
Data regarding sires or rams
Data to assist decision-making
Data regarding genetics / parentage /pedigree
Data pertains to the wider range ofanimals in Australia
Provides ASBV / EBV
Database to be used as a tool
Positive comments
Data regarding wool / fleece
*OTHER MERINOSELECT
No reply / Don't know
MS user (n=38)
MS non-user (n=230)
94%
21%
20%
20%
19%
17%
17%
16%
6%
9%
15%
8%
8%
92%
*DATABASE
Data regarding sires or rams
Data to assist decision-making
Data regarding genetics / parentage /pedigree
Data pertains to the wider range of animalsin Australia
Provides ASBV / EBV
Database to be used as a tool
Positive comments
Data regarding wool / fleece
*OTHER MERINOSELECT
No reply / Don't know
MS user (n=81)
MS non-user (n=13*)
The most commonly-cited benefits of MS are data regarding rams & aiding decision-making;however, around 16% of users could not cite ‘the best thing’ about MS
PERCEPTIONS OF MERINOSELECT
Q21b. What are the best things about MERINOSELECT for people running businesses like yours?
Base: Sheep Stud – MS user (n=81), Sheep Stud – MS non-user (n=13*), Commercial Sheep – MS user (n=38), Commercial Sheep – MS non-user (n=230). *Note: Small base size.
Sheep StudWhat Are The Best Things About MS?
Commercial Sheep
Significantly higher than MS non-user – Significantly lower than MS non-user
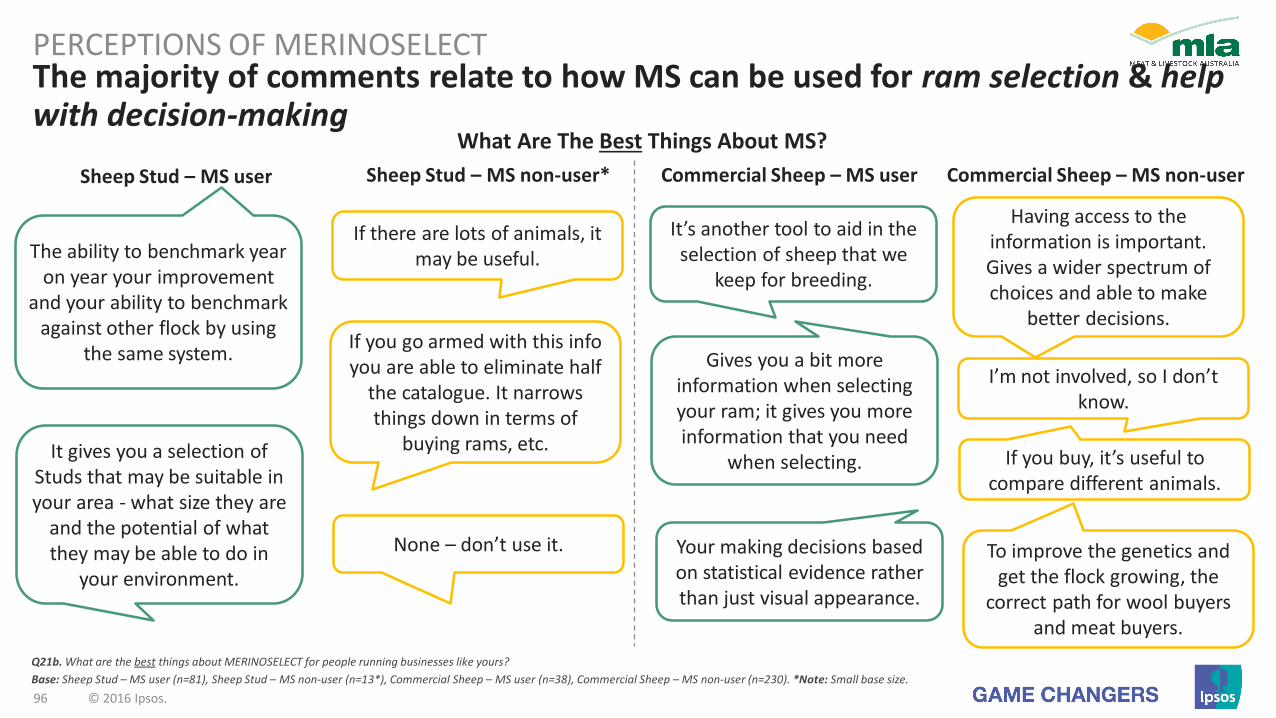
96 © 2016 Ipsos.
The majority of comments relate to how MS can be used for ram selection & help with decision-making
PERCEPTIONS OF MERINOSELECT
What Are The Best Things About MS?
Sheep Stud – MS user
The ability to benchmark year on year your improvement
and your ability to benchmark against other flock by using
the same system.
If there are lots of animals, it may be useful.
It gives you a selection of Studs that may be suitable in your area - what size they are
and the potential of what they may be able to do in
your environment.
It’s another tool to aid in the selection of sheep that we
keep for breeding.
Having access to the information is important. Gives a wider spectrum of choices and able to make
better decisions.
If you buy, it’s useful to compare different animals.
I’m not involved, so I don’t know.
Gives you a bit more information when selecting your ram; it gives you more information that you need
when selecting.
Your making decisions based on statistical evidence rather than just visual appearance.
Sheep Stud – MS non-user* Commercial Sheep – MS user Commercial Sheep – MS non-user
If you go armed with this info you are able to eliminate half
the catalogue. It narrows things down in terms of
buying rams, etc.
None – don’t use it. To improve the genetics and get the flock growing, the
correct path for wool buyers and meat buyers.
Q21b. What are the best things about MERINOSELECT for people running businesses like yours?
Base: Sheep Stud – MS user (n=81), Sheep Stud – MS non-user (n=13*), Commercial Sheep – MS user (n=38), Commercial Sheep – MS non-user (n=230). *Note: Small base size.
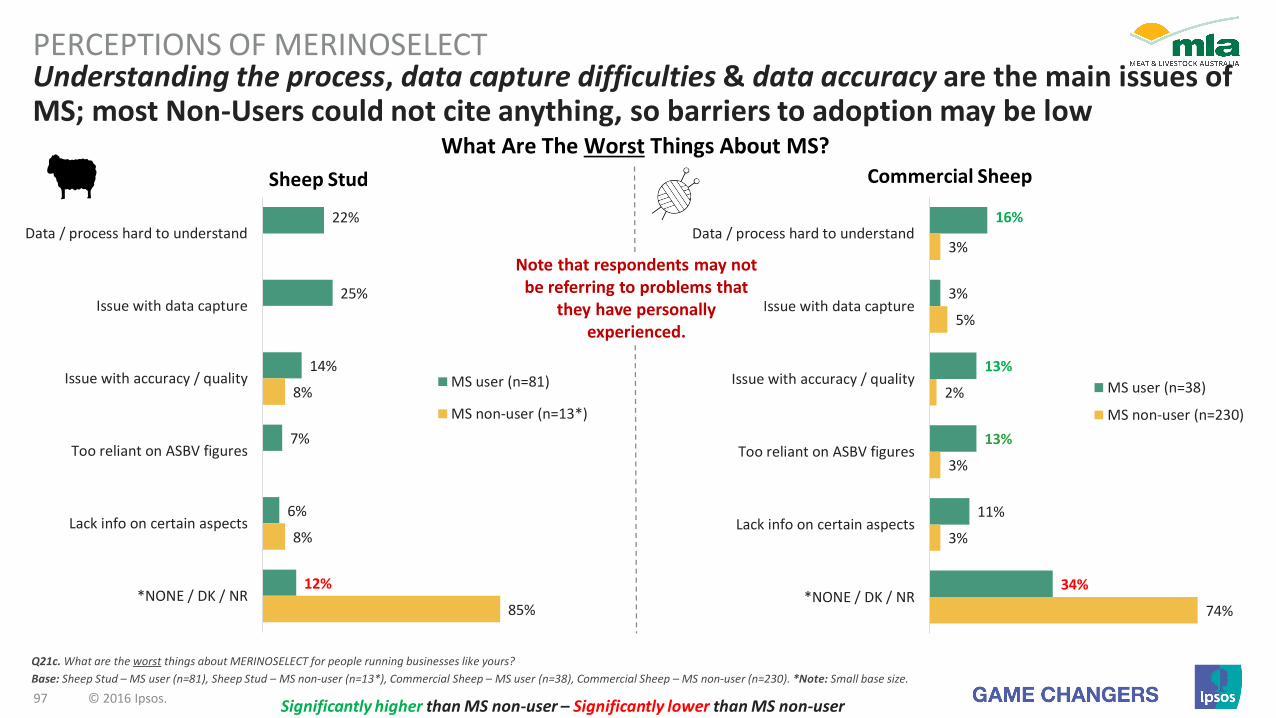
97 © 2016 Ipsos.
16%
3%
13%
13%
11%
34%
3%
5%
2%
3%
3%
74%
Data / process hard to understand
Issue with data capture
Issue with accuracy / quality
Too reliant on ASBV figures
Lack info on certain aspects
*NONE / DK / NR
MS user (n=38)
MS non-user (n=230)
22%
25%
14%
7%
6%
12%
8%
8%
85%
Data / process hard to understand
Issue with data capture
Issue with accuracy / quality
Too reliant on ASBV figures
Lack info on certain aspects
*NONE / DK / NR
MS user (n=81)
MS non-user (n=13*)
Understanding the process, data capture difficulties & data accuracy are the main issues of MS; most Non-Users could not cite anything, so barriers to adoption may be low
PERCEPTIONS OF MERINOSELECT
Q21c. What are the worst things about MERINOSELECT for people running businesses like yours?
Base: Sheep Stud – MS user (n=81), Sheep Stud – MS non-user (n=13*), Commercial Sheep – MS user (n=38), Commercial Sheep – MS non-user (n=230). *Note: Small base size.
Sheep Stud
What Are The Worst Things About MS?Commercial Sheep
Note that respondents may not be referring to problems that
they have personally experienced.
Significantly higher than MS non-user – Significantly lower than MS non-user
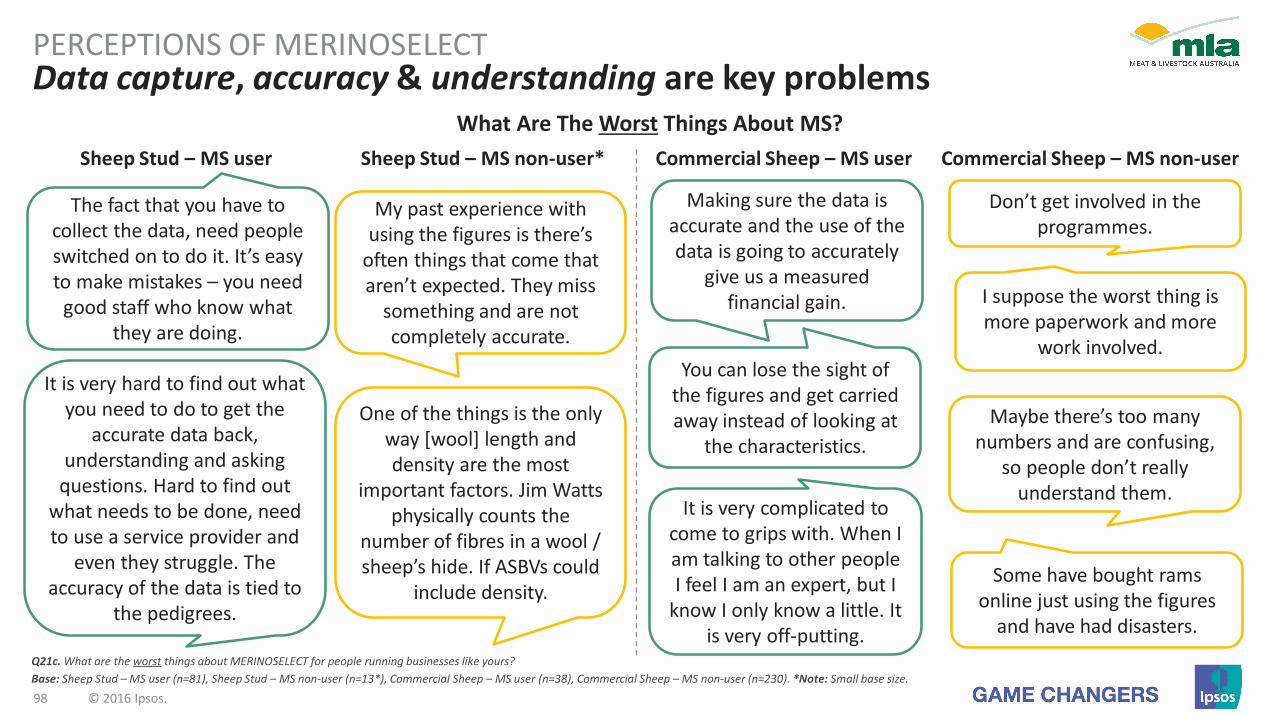
98 © 2016 Ipsos.
Data capture, accuracy & understanding are key problemsPERCEPTIONS OF MERINOSELECT
The fact that you have to collect the data, need people switched on to do it. It’s easy to make mistakes – you need
good staff who know what they are doing.
My past experience with using the figures is there’s
often things that come that aren’t expected. They miss
something and are not completely accurate.
It is very hard to find out what you need to do to get the
accurate data back, understanding and asking
questions. Hard to find out what needs to be done, need to use a service provider and
even they struggle. The accuracy of the data is tied to
the pedigrees.
Making sure the data is accurate and the use of the data is going to accurately
give us a measured financial gain.
Don’t get involved in the programmes.
Maybe there’s too many numbers and are confusing,
so people don’t really understand them.
I suppose the worst thing is more paperwork and more
work involved.You can lose the sight of
the figures and get carried away instead of looking at
the characteristics.
It is very complicated to come to grips with. When I am talking to other people I feel I am an expert, but I
know I only know a little. It is very off-putting.
One of the things is the only way [wool] length and density are the most
important factors. Jim Watts physically counts the
number of fibres in a wool / sheep’s hide. If ASBVs could
include density.Some have bought rams
online just using the figures and have had disasters.
What Are The Worst Things About MS?
Sheep Stud – MS user Sheep Stud – MS non-user* Commercial Sheep – MS user Commercial Sheep – MS non-user
Q21c. What are the worst things about MERINOSELECT for people running businesses like yours?
Base: Sheep Stud – MS user (n=81), Sheep Stud – MS non-user (n=13*), Commercial Sheep – MS user (n=38), Commercial Sheep – MS non-user (n=230). *Note: Small base size.
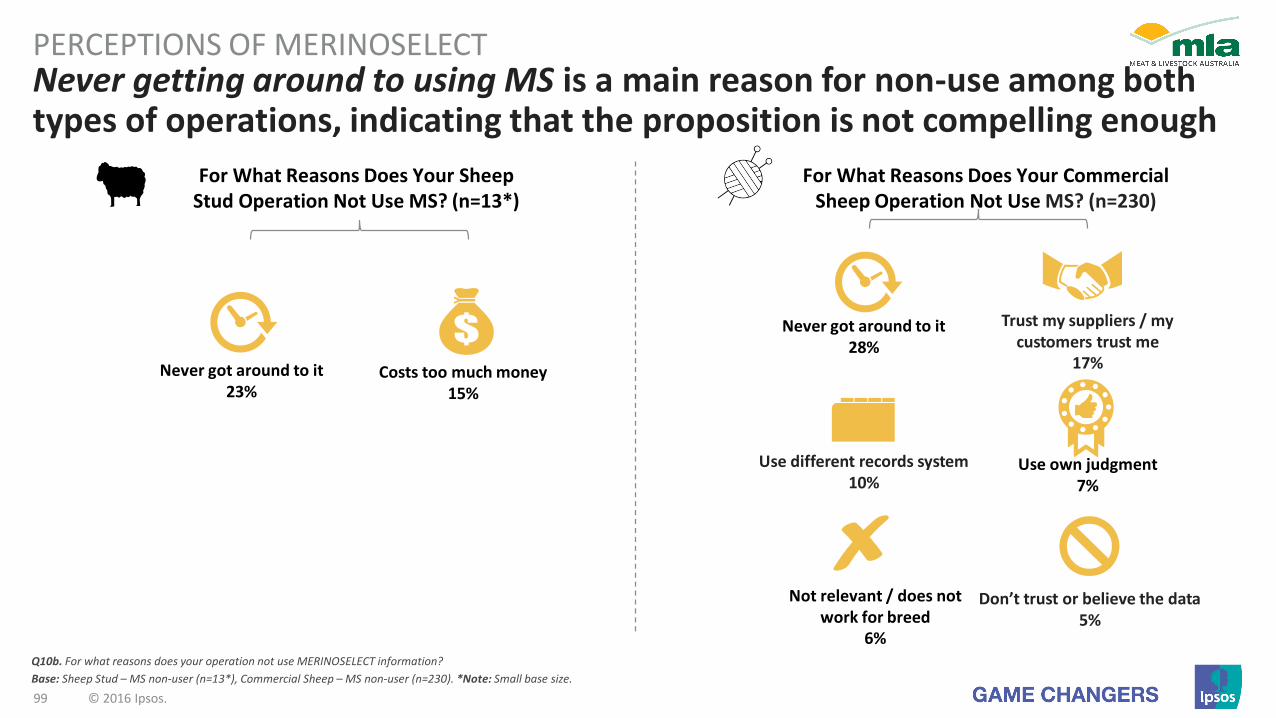
99 © 2016 Ipsos.
Never getting around to using MS is a main reason for non-use among both types of operations, indicating that the proposition is not compelling enough
PERCEPTIONS OF MERINOSELECT
Q10b. For what reasons does your operation not use MERINOSELECT information?
Base: Sheep Stud – MS non-user (n=13*), Commercial Sheep – MS non-user (n=230). *Note: Small base size.
For What Reasons Does Your Sheep Stud Operation Not Use MS? (n=13*)
Costs too much money15%
Never got around to it23%
For What Reasons Does Your Commercial Sheep Operation Not Use MS? (n=230)
Never got around to it28%
Not relevant / does not work for breed
6%
Use own judgment7%
Trust my suppliers / my customers trust me
17%
Use different records system10%
Don’t trust or believe the data5%

100 © 2016 Ipsos.
Key Learnings: Trust & Perceptions of the PLANs
1. Users trust the PLANs, but Studs’ trust is under-performing and CommercialUsers’ Trust is ‘Blind’. Non-Users seldom know enough to even start trusting.
2. Users and Non-Users say similar things, just to different degrees:“A genetics database to aid decision-making.”
3. Genetics management is mainly related to trait selection rather than avoidance.
4. Biggest complaints concern data inaccuracy / non-transparency and the data capture / entry effort required.
5. Main reasons for Non-Use concern data distrust and a time-benefit imbalance (esp. for smaller operations).
PERCEPTIONS OF BREEDPLAN, LAMBPLAN & MERINOSELECT
Training & Extension Resources
© 2016 Ipsos.101
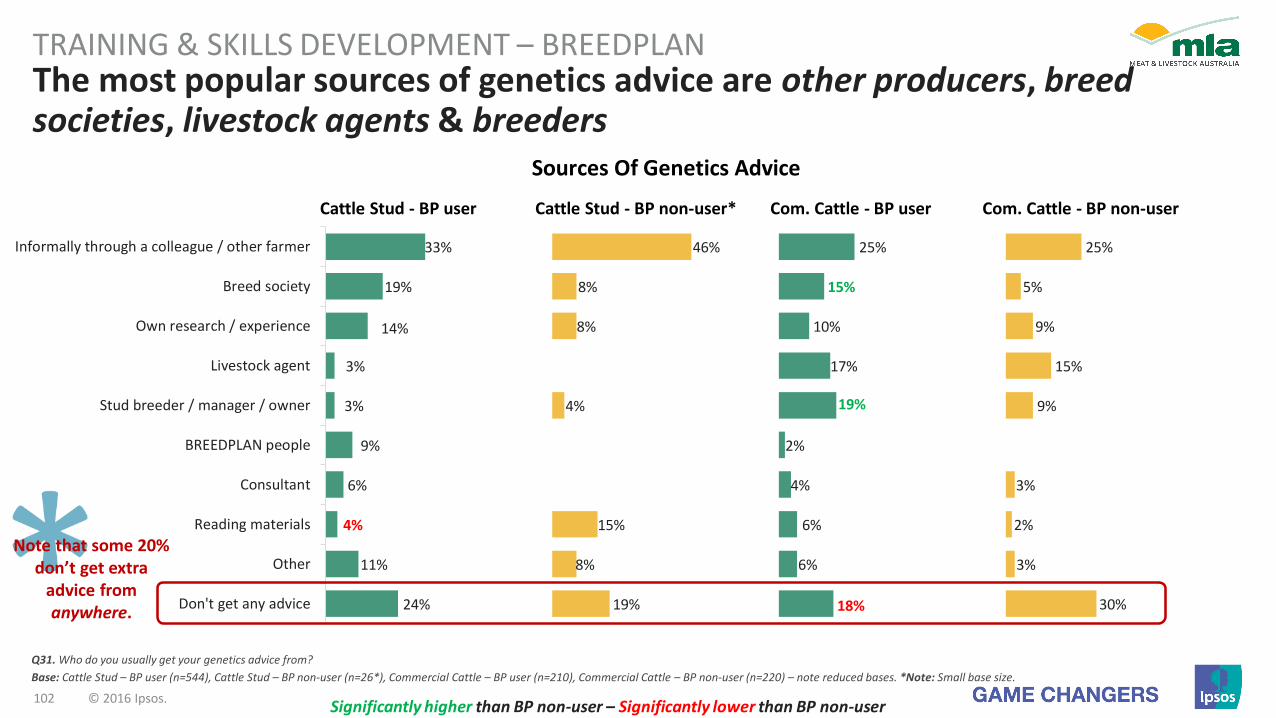
102 © 2016 Ipsos.
The most popular sources of genetics advice are other producers, breed societies, livestock agents & breeders
TRAINING & SKILLS DEVELOPMENT – BREEDPLAN
Q31. Who do you usually get your genetics advice from?
Base: Cattle Stud – BP user (n=544), Cattle Stud – BP non-user (n=26*), Commercial Cattle – BP user (n=210), Commercial Cattle – BP non-user (n=220) – note reduced bases. *Note: Small base size.
33%
19%
14%
3%
3%
9%
6%
4%
11%
24%
46%
8%
8%
4%
15%
8%
19%
25%
15%
10%
17%
19%
2%
4%
6%
6%
18%
25%
5%
9%
15%
9%
3%
2%
3%
30%
Informally through a colleague / other farmer
Breed society
Own research / experience
Livestock agent
Stud breeder / manager / owner
BREEDPLAN people
Consultant
Reading materials
Other
Don't get any advice
Sources Of Genetics Advice
Cattle Stud - BP user Cattle Stud - BP non-user* Com. Cattle - BP user Com. Cattle - BP non-user
Significantly higher than BP non-user – Significantly lower than BP non-user
Note that some 20% don’t get extra
advice from anywhere.

103 © 2016 Ipsos.
While the low levels of training amongst Non-Users is understandable,39% of Stud Users have not had training, citing a lack of need or info
TRAINING & SKILLS DEVELOPMENT – BREEDPLAN
Q32. Have you ever had proper training or guidance in how to use BREEDPLAN information such as EBVs to make your breeding or purchase decisions? / Q34b. For what reasons have you not had any proper training or guidance?
Base: Users who haven't had training from Q32: Cattle Stud – BP user (n=215), Cattle Stud – BP non-user (n=20*), Commercial Cattle – BP user (n=136), Commercial Cattle – BP non-user (n=192) – note reduced bases. *Note: Small base size.
Cattle Stud - BP user Cattle Stud - BP non-user* Com. Cattle - BP user Com. Cattle - BP non-user
No training / Unsure 39% 77% 65% 87%
Why Have You Not Had BP Training?
11%
12%
17%
16%
46%
2%
10%
5%
5%
10%
50%
15%
21%
12%
10%
9%
45%
6%
19%
13%
7%
1%
30%
34%
Never got around to it
Not enough time
Don't know where to go / who to ask
No need - already know how to use them
Other
No need - don't use these systems
Have You Had Proper BP Training Or Guidance?
Significantly higher than BP non-user – Significantly lower than BP non-user
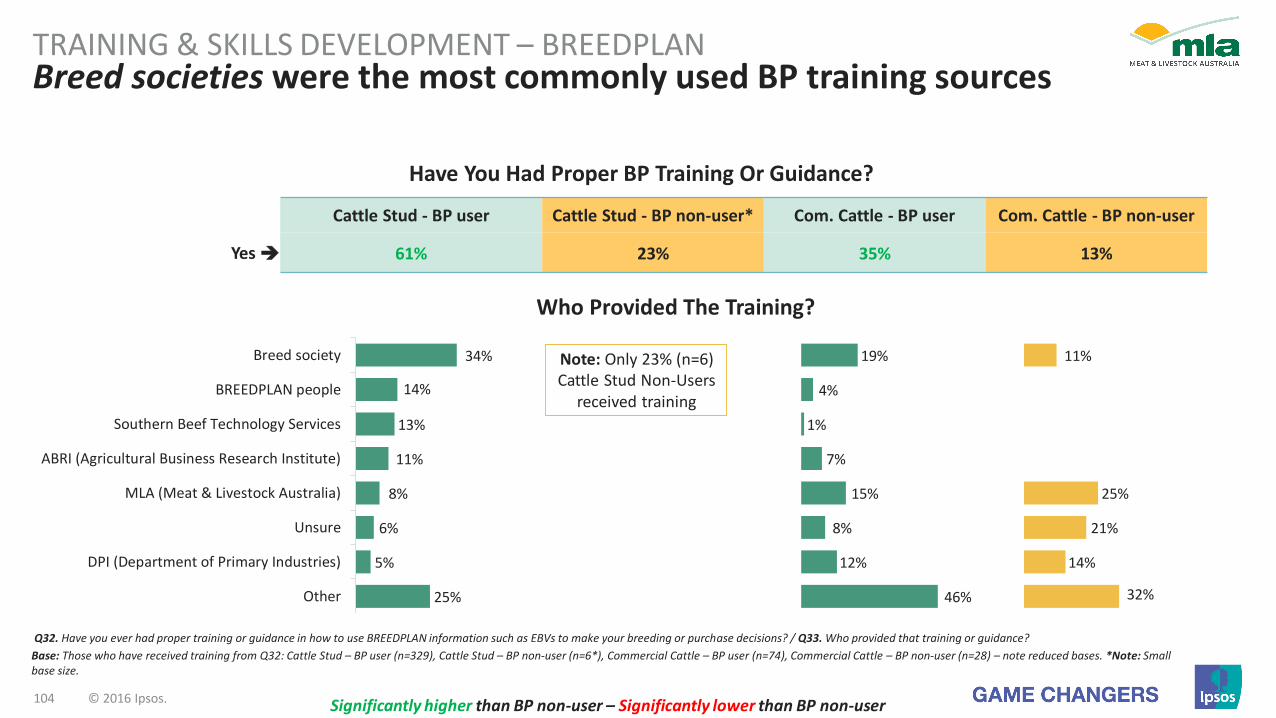
104 © 2016 Ipsos.
Breed societies were the most commonly used BP training sourcesTRAINING & SKILLS DEVELOPMENT – BREEDPLAN
Q32. Have you ever had proper training or guidance in how to use BREEDPLAN information such as EBVs to make your breeding or purchase decisions? / Q33. Who provided that training or guidance?
Base: Those who have received training from Q32: Cattle Stud – BP user (n=329), Cattle Stud – BP non-user (n=6*), Commercial Cattle – BP user (n=74), Commercial Cattle – BP non-user (n=28) – note reduced bases. *Note: Small base size.
Cattle Stud - BP user Cattle Stud - BP non-user* Com. Cattle - BP user Com. Cattle - BP non-user
Yes 61% 23% 35% 13%
Who Provided The Training?
34%
14%
13%
11%
8%
6%
5%
25%
19%
4%
1%
7%
15%
8%
12%
46%
11%
25%
21%
14%
32%
Breed society
BREEDPLAN people
Southern Beef Technology Services
ABRI (Agricultural Business Research Institute)
MLA (Meat & Livestock Australia)
Unsure
DPI (Department of Primary Industries)
Other
Note: Only 23% (n=6) Cattle Stud Non-Users
received training
Have You Had Proper BP Training Or Guidance?
Significantly higher than BP non-user – Significantly lower than BP non-user

105 © 2016 Ipsos.
20%
45%
5%
2%
11%
23%
15%
5%
37%
2%
1%
6%
20%
36%
Breed society
MLA (Meat & Livestock Australia)
BREEDPLAN people
ABRI (Agricultural Business ResearchInstitute)
DPI (Department of Primary Industries)
Southern Beef Technology Services
Other
Unsure
BP user (n=210)
BP non-user (n=220)
Breed societies are expected to provide training for BP-using Studs; others are just as likely to expect MLA to provide help
TRAINING & SKILLS DEVELOPMENT – BREEDPLAN
Q35. If you wanted to get more training or guidance, who would you expect to provide it?
Base: Cattle Stud – BP user (n=544), Cattle Stud – BP non-user (n=26*), Commercial Cattle – BP user (n=210), Commercial Cattle – BP non-user (n=220) – note reduced bases. *Note: Small base size.
42%
16%
20%
13%
2%
8%
18%
7%
15%
15%
19%
4%
23%
Breed society
MLA (Meat & Livestock Australia)
BREEDPLAN people
ABRI (Agricultural Business ResearchInstitute)
DPI (Department of Primary Industries)
Southern Beef Technology Services
Other
Unsure
BP user (n=544)
BP non-user (n=26*)
Who Do You Expect To Provide BP Training?Cattle Stud Commercial Cattle
Significantly higher than BP non-user – Significantly lower than BP non-user

106 © 2016 Ipsos.
The most popular way for sheep meat Producers to gain genetics advice is through informal methods such as colleagues, agents & breeders
TRAINING & SKILLS DEVELOPMENT – LAMBPLAN
31%
3%
13%
20%
5%
4%
29%
48%
19%
5%
14%
10%
5%
14%
10%
24%
26%
30%
15%
1%
8%
4%
12%
18%
22%
19%
8%
3%
8%
25%
Informally through a colleague / other farmer
Livestock agent
Stud breeder / manager / owner
Own research / experience
Sheep Genetics / LAMBPLAN people
Consultant
Other
Don't get any advice
Sources Of Genetics Advice
Sheep Stud - LP user Sheep Stud - LP non-user* Com. Sheep - LP user Com. Sheep - LP non-user
Significantly higher than LP non-user – Significantly lower than LP non-user
Q31. Who do you usually get your genetics advice from?
Base: Sheep Stud – LP user (n=95), Sheep Stud – LP non-user (n=21*), Commercial Sheep – LP user (n=74), Commercial Sheep – LP non-user (n=241) – note reduced bases. *Note: Small base size.
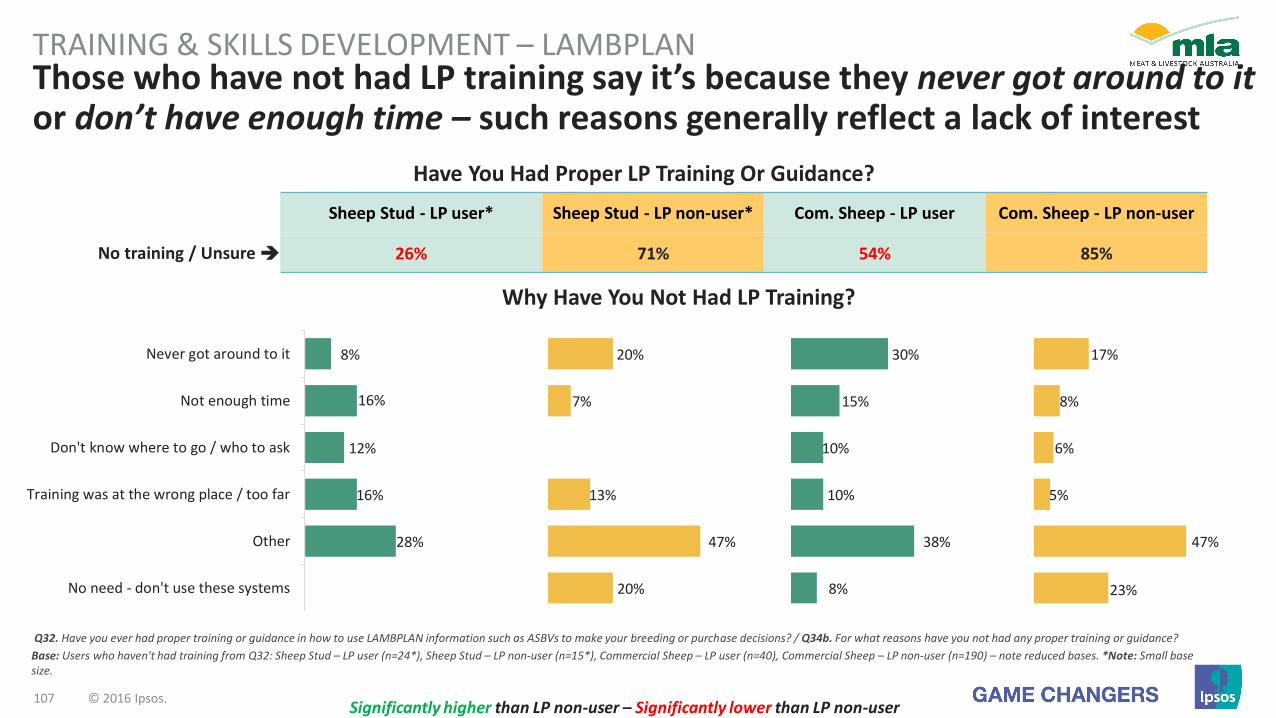
107 © 2016 Ipsos.
Those who have not had LP training say it’s because they never got around to it or don’t have enough time – such reasons generally reflect a lack of interest
TRAINING & SKILLS DEVELOPMENT – LAMBPLAN
Q32. Have you ever had proper training or guidance in how to use LAMBPLAN information such as ASBVs to make your breeding or purchase decisions? / Q34b. For what reasons have you not had any proper training or guidance?
Base: Users who haven't had training from Q32: Sheep Stud – LP user (n=24*), Sheep Stud – LP non-user (n=15*), Commercial Sheep – LP user (n=40), Commercial Sheep – LP non-user (n=190) – note reduced bases. *Note: Small base size.
Significantly higher than LP non-user – Significantly lower than LP non-user
Sheep Stud - LP user* Sheep Stud - LP non-user* Com. Sheep - LP user Com. Sheep - LP non-user
No training / Unsure 26% 71% 54% 85%
Why Have You Not Had LP Training?
8%
16%
12%
16%
28%
20%
7%
13%
47%
20%
30%
15%
10%
10%
38%
8%
17%
8%
6%
5%
47%
23%
Never got around to it
Not enough time
Don't know where to go / who to ask
Training was at the wrong place / too far
Other
No need - don't use these systems
Have You Had Proper LP Training Or Guidance?
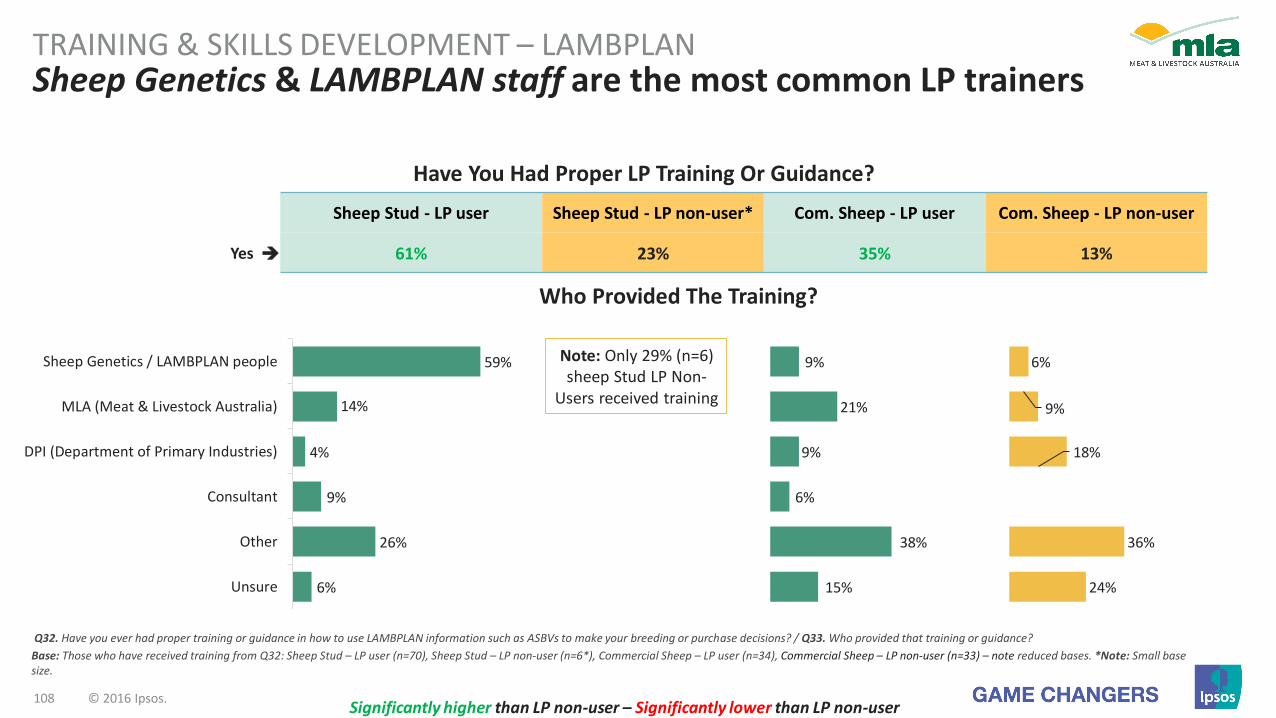
108 © 2016 Ipsos.
Sheep Genetics & LAMBPLAN staff are the most common LP trainersTRAINING & SKILLS DEVELOPMENT – LAMBPLAN
Q32. Have you ever had proper training or guidance in how to use LAMBPLAN information such as ASBVs to make your breeding or purchase decisions? / Q33. Who provided that training or guidance?
Base: Those who have received training from Q32: Sheep Stud – LP user (n=70), Sheep Stud – LP non-user (n=6*), Commercial Sheep – LP user (n=34), Commercial Sheep – LP non-user (n=33) – note reduced bases. *Note: Small base size.
Sheep Stud - LP user Sheep Stud - LP non-user* Com. Sheep - LP user Com. Sheep - LP non-user
Yes 61% 23% 35% 13%
Who Provided The Training?
59%
14%
4%
9%
26%
6%
9%
21%
9%
6%
38%
15%
6%
9%
18%
36%
24%
Sheep Genetics / LAMBPLAN people
MLA (Meat & Livestock Australia)
DPI (Department of Primary Industries)
Consultant
Other
Unsure
Note: Only 29% (n=6) sheep Stud LP Non-
Users received training
Have You Had Proper LP Training Or Guidance?
Significantly higher than LP non-user – Significantly lower than LP non-user

109 © 2016 Ipsos.
50%
7%
9%
5%
11%
22%
16%
37%
5%
8%
7%
2%
23%
32%
MLA (Meat & Livestock Australia)
Sheep Genetics / LAMBPLAN people
DPI (Department of Primary Industries)
Agent / livestock agent
Consultant
Other
Unsure
LP user (n=74)
LP non-user (n=241)
Sheep Genetics are expected to provide training for Studs, while Commercial farmers expect to go to MLA
TRAINING & SKILLS DEVELOPMENT – LAMBPLAN
Q35. If you wanted to get more training or guidance, who would you expect to provide it?
Base: Sheep Stud – LP user (n=95), Sheep Stud – LP non-user (n=21*), Commercial Sheep – LP user (n=74), Commercial Sheep – LP non-user (n=241) – note reduced bases. *Note: Small base size.
14%
68%
1%
1%
4%
13%
7%
24%
24%
5%
5%
43%
10%
MLA (Meat & Livestock Australia)
Sheep Genetics / LAMBPLAN people
DPI (Department of Primary Industries)
Agent / livestock agent
Consultant
Other
Unsure
LP user (n=95)
LP non-user (n=21*)
Who Do You Expect To Provide LP Training?Sheep Stud Commercial Sheep
Significantly higher than LP non-user – Significantly lower than LP non-user
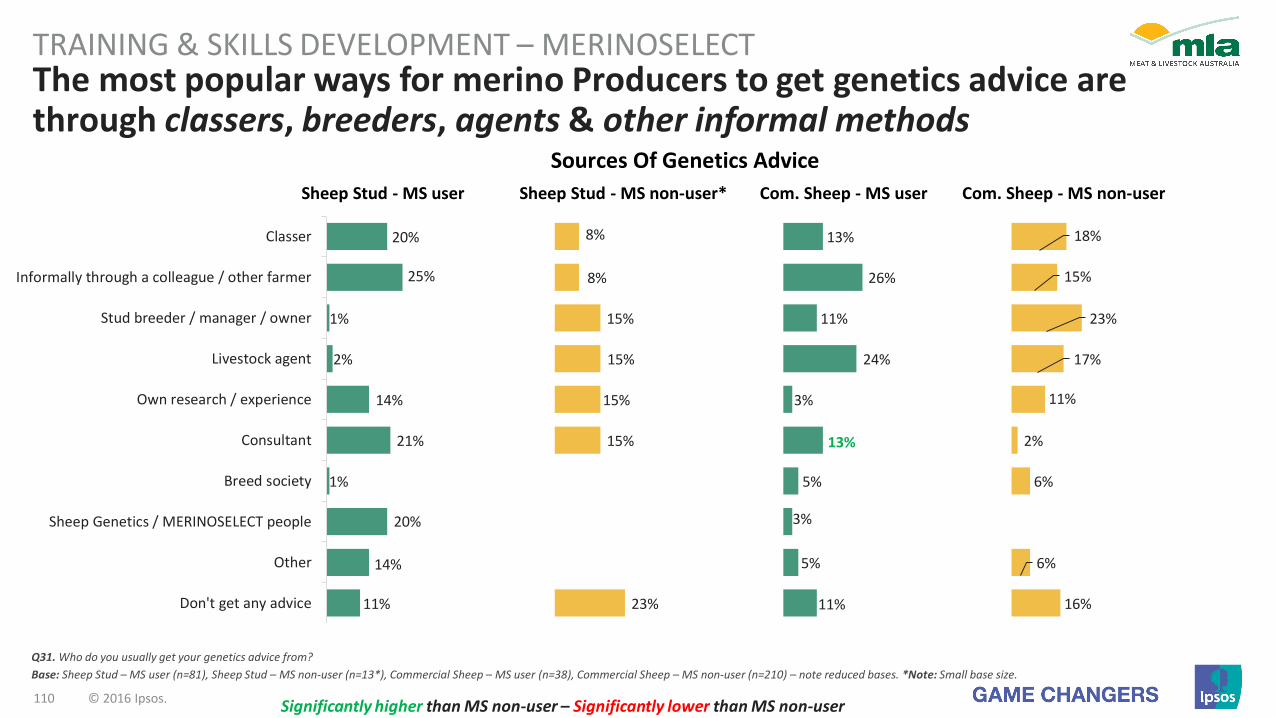
110 © 2016 Ipsos.
The most popular ways for merino Producers to get genetics advice are through classers, breeders, agents & other informal methods
TRAINING & SKILLS DEVELOPMENT – MERINOSELECT
Q31. Who do you usually get your genetics advice from?
Base: Sheep Stud – MS user (n=81), Sheep Stud – MS non-user (n=13*), Commercial Sheep – MS user (n=38), Commercial Sheep – MS non-user (n=210) – note reduced bases. *Note: Small base size.
20%
25%
1%
2%
14%
21%
1%
20%
14%
11%
8%
8%
15%
15%
15%
15%
23%
13%
26%
11%
24%
3%
13%
5%
3%
5%
11%
18%
15%
23%
17%
11%
2%
6%
6%
16%
Classer
Informally through a colleague / other farmer
Stud breeder / manager / owner
Livestock agent
Own research / experience
Consultant
Breed society
Sheep Genetics / MERINOSELECT people
Other
Don't get any advice
Sources Of Genetics Advice
Sheep Stud - MS user Sheep Stud - MS non-user* Com. Sheep - MS user Com. Sheep - MS non-user
Significantly higher than MS non-user – Significantly lower than MS non-user

111 © 2016 Ipsos.
The majority of MS Users have received training, the most common reasons for a lack of training being general disinterest / motivation
TRAINING & SKILLS DEVELOPMENT – MERINOSELECT
Q32. Have you ever had proper training or guidance in how to use MERINOSELECT information such as ASBVs to make your breeding or purchase decisions? / Q34b. For what reasons have you not had any proper training or guidance?
Base: Users who haven't had training from Q32: Sheep Stud – MS user (n=11*), Sheep Stud – MS non-user (n=13*), Commercial Sheep – MS user (n=17*), Commercial Sheep – MS non-user (n=180) – note reduced bases. *Note: Small base size.
Sheep Stud - MS user Sheep Stud - MS non-user* Com. Sheep - MS user Com. Sheep - MS non-user
No training / Unsure 14% 100% 45% 85%
Why Have You Not Had MS Training?
18%
18%
18%
45%
9%
38%
15%
46%
8%
29%
6%
18%
6%
12%
47%
25%
24%
8%
4%
4%
41%
6%
Never got around to it
No need - don't use these systems
Not enough time
Don't know where to go / who to ask
Training was at the wrong place / too far
Other
Unsure
Have You Had Proper MS Training Or Guidance?
Significantly higher than MS non-user – Significantly lower than MS non-user

112 © 2016 Ipsos.
Sheep Genetics & MLA are the most common trainers, but there is a large number using alternative informal sources
TRAINING & SKILLS DEVELOPMENT – MERINOSELECT
Q32. Have you ever had proper training or guidance in how to use MERINOSELECT information such as ASBVs to make your breeding or purchase decisions? / Q33. Who provided that training or guidance?
Base: Those who have received training from Q32: Sheep Stud – MS user (n=70), Commercial Sheep – MS user (n=21*), Commercial Sheep – MS non-user (n=30) – note reduced bases. *Note: Small base size.
Sheep Stud - MS user Sheep Stud - MS non-user* Com. Sheep - MS user Com. Sheep - MS non-user
Yes 86% 0% 55% 14%
Who Provided The Training?
47%
20%
7%
7%
10%
33%
6%
38%
10%
14%
5%
43%
10%
3%
7%
17%
7%
7%
53%
27%
Sheep Genetics / MERINOSELECT people
MLA (Meat & Livestock Australia)
DPI (Department of Primary Industries)
AWI (Australian Wool Innovation)
Consultant
Other
Unsure
Note: 0% of sheep Stud MS Non-Users have
received training
Have You Had Proper MS Training Or Guidance?
Significantly higher than MS non-user – Significantly lower than MS non-user

113 © 2016 Ipsos.
42%
11%
26%
11%
29%
18%
31%
4%
9%
7%
26%
31%
MLA (Meat & Livestock Australia)
Sheep Genetics / MERINOSELECT people
AWI (Australian Wool Innovation)
DPI (Department of Primary Industries)
Other
Unsure
MS user (n=38)
MS non-user (n=210)
Sheep Genetics & MLA are the most commonly-cited training sources, but large proportions could not name who they would seek MS training from
TRAINING & SKILLS DEVELOPMENT – MERINOSELECT
Q35. If you wanted to get more training or guidance, who would you expect to provide it?
Base: Sheep Stud – MS user (n=81), Sheep Stud – MS non-user (n=13*), Commercial Sheep – MS user (n=38), Commercial Sheep – MS non-user (n=210) – note reduced bases. *Note: Small base size.
26%
52%
11%
4%
17%
9%
31%
8%
15%
62%
MLA (Meat & Livestock Australia)
Sheep Genetics / MERINOSELECT people
AWI (Australian Wool Innovation)
DPI (Department of Primary Industries)
Other
Unsure
MS user (n=81)
MS non-user (n=13*)
Who Do You Expect To Provide MS Training?Sheep Stud Commercial Sheep
Significantly higher than MS non-user – Significantly lower than MS non-user
Website Usage
© 2016 Ipsos.114
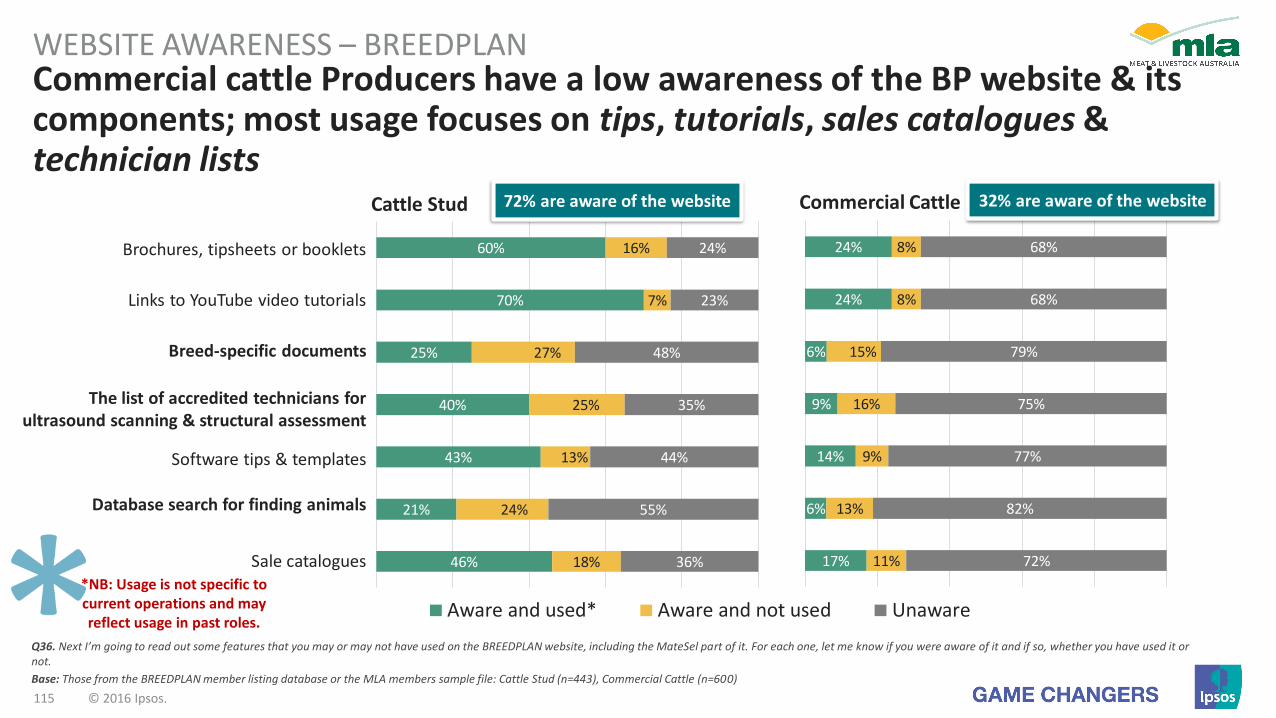
115 © 2016 Ipsos.
17%
6%
14%
9%
6%
24%
24%
11%
13%
9%
16%
15%
8%
8%
72%
82%
77%
75%
79%
68%
68%
46%
21%
43%
40%
25%
70%
60%
18%
24%
13%
25%
27%
7%
16%
36%
55%
44%
35%
48%
23%
24%Brochures, tipsheets or booklets
Links to YouTube video tutorials
Breed-specific documents
The list of accredited technicians for ultrasound scanning & structural assessment
Software tips & templates
Database search for finding animals
Sale catalogues
Commercial cattle Producers have a low awareness of the BP website & its components; most usage focuses on tips, tutorials, sales catalogues & technician lists
WEBSITE AWARENESS – BREEDPLAN
Aware and used* Aware and not used Unaware
Cattle Stud Commercial Cattle
Q36. Next I’m going to read out some features that you may or may not have used on the BREEDPLAN website, including the MateSel part of it. For each one, let me know if you were aware of it and if so, whether you have used it or not.
Base: Those from the BREEDPLAN member listing database or the MLA members sample file: Cattle Stud (n=443), Commercial Cattle (n=600)
72% are aware of the website 32% are aware of the website
*NB: Usage is not specific to current operations and may reflect usage in past roles.
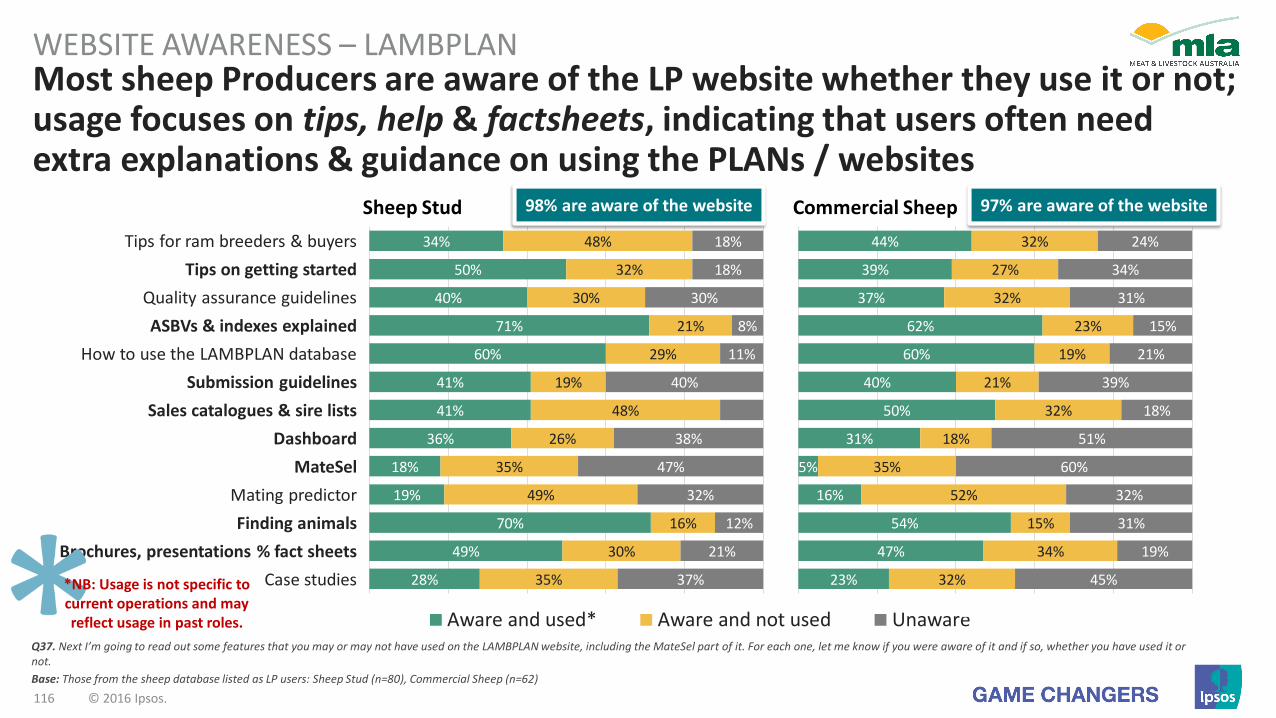
116 © 2016 Ipsos.
Most sheep Producers are aware of the LP website whether they use it or not; usage focuses on tips, help & factsheets, indicating that users often need extra explanations & guidance on using the PLANs / websites
WEBSITE AWARENESS – LAMBPLAN
Sheep Stud Commercial Sheep
34%
50%
40%
71%
60%
41%
41%
36%
18%
19%
70%
49%
28%
48%
32%
30%
21%
29%
19%
48%
26%
35%
49%
16%
30%
35%
18%
18%
30%
8%
11%
40%
38%
47%
32%
12%
21%
37%
44%
39%
37%
62%
60%
40%
50%
31%
5%
16%
54%
47%
23%
32%
27%
32%
23%
19%
21%
32%
18%
35%
52%
15%
34%
32%
24%
34%
31%
15%
21%
39%
18%
51%
60%
32%
31%
19%
45%
Aware and used* Aware and not used Unaware
98% are aware of the website 97% are aware of the website
Q37. Next I’m going to read out some features that you may or may not have used on the LAMBPLAN website, including the MateSel part of it. For each one, let me know if you were aware of it and if so, whether you have used it or not.
Base: Those from the sheep database listed as LP users: Sheep Stud (n=80), Commercial Sheep (n=62)
Tips for ram breeders & buyers
Tips on getting started
Quality assurance guidelines
ASBVs & indexes explained
How to use the LAMBPLAN database
Submission guidelines
Sales catalogues & sire lists
Dashboard
MateSel
Mating predictor
Finding animals
Brochures, presentations % fact sheets
Case studies*NB: Usage is not specific to current operations and may reflect usage in past roles.

117 © 2016 Ipsos.
Most sheep Producers are aware of the MS website whether they use it or not; usage focuses on tips, help & factsheets, with many seeking help on ASBVs & indexes
WEBSITE AWARENESS – MERINOSELECT
Sheep Stud Commercial Sheep
34%
52%
48%
84%
24%
46%
74%
34%
12%
18%
78%
72%
30%
52%
28%
22%
12%
46%
22%
26%
18%
34%
54%
10%
24%
40%
14%
20%
30%
4%
30%
32%
48%
54%
28%
12%
4%
30%
47%
55%
47%
78%
33%
60%
55%
42%
15%
16%
63%
51%
42%
36%
25%
25%
13%
47%
16%
29%
22%
31%
42%
15%
36%
33%
16%
20%
27%
9%
20%
24%
16%
36%
54%
42%
22%
13%
25%
Aware and used* Aware and not used Unaware
98% are aware of the website 96% are aware of the website
Q37. Next I’m going to read out some features that you may or may not have used on the MERINOSELECT website, including the MateSel part of it. For each one, let me know if you were aware of it and if so, whether you have used it or not.
Base: Those from the sheep database listed as MS users: Sheep Stud (n=51), Commercial Sheep (n=55)
Tips for ram breeders & buyers
Tips on getting started
Quality assurance guidelines
ASBVs & indexes explained
How to use the MERINOSELECT database
Submission guidelines
Sales catalogues & sire lists
Dashboard
MateSel
Mating predictor
Finding animals
Brochures, presentations & fact sheets
Case studies*NB: Usage is not specific to current operations and may reflect usage in past roles.

118 © 2016 Ipsos.
Key Learnings: Training & Extension ResourcesTRAINING & EXTENSION NEEDS
1. Informal information sources still predominate(also higher for accessibility and cost), followed by breed societies and MLA.
2. Lack of motivation is the main reason for lack of formal training.
3. Go-to trainers largely felt to be programme suppliersor MLA, but many use informal connections.
4. Website usage varies, but appears to be generally underused (ref: lack of motivation).
• BP website awareness is very low amongst Commercial cattle Producers, whereas the Sheep Genetics website has higher degrees of awareness and usage amongst both MS / LP Users and Non-Users.
• The most commonly-used sections are the tips, tutorials, factsheets, sales catalogues and technicians.
Achieving Desired Behaviour Change
© 2016 Ipsos.119 © 2016 Ipsos.
© 2016 Ipsos.120
Background to the Analysis Used
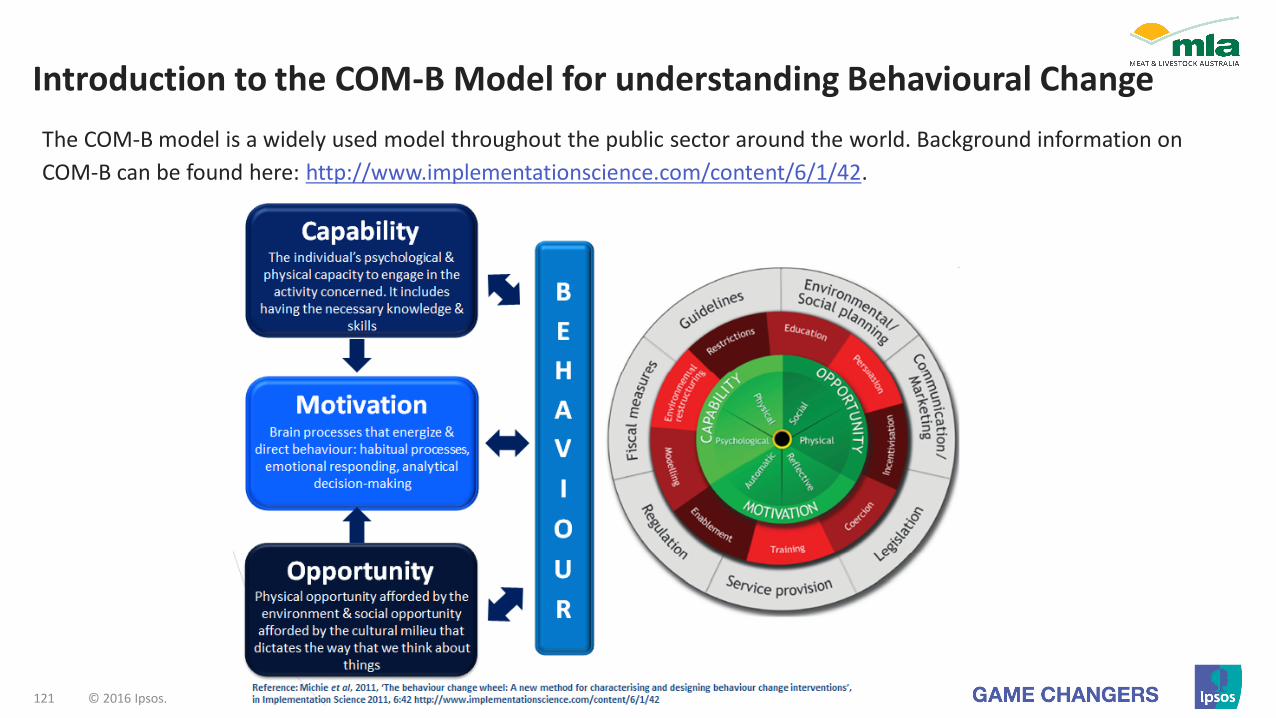
121 © 2016 Ipsos.
Introduction to the COM-B Model for understanding Behavioural Change
The COM-B model is a widely used model throughout the public sector around the world. Background information on
COM-B can be found here: http://www.implementationscience.com/content/6/1/42.

122 © 2016 Ipsos.
Introduction to the COM-B Model for understanding Behavioural Change
The COM-B framework recognises that for any given behaviour to occur, three conditions must be met - the people
concerned must:
Have the ability to do it, i.e. they must have the knowledge, skill, mental resources, etc.
This is the Capability requirement.
Have the opportunity in terms of a conducive physical and social environment,
i.e. they must be able to afford it, it must be easily used / accessible, and they
must have the time, tools, etc. This is the Opportunity requirement.
Have the motivation, i.e. they must be more highly motivated to do it than
not to, or to engage in a competing behaviour. This is the Motivation
requirement.
By using this model, we able to:
Measure everything of importance;
Identify the barriers and drivers of better BREEDPLAN, LAMBPLAN and MERINOSELECT usage;
Identify the best strategies for improving the situation.
DRIVER ANALYSIS
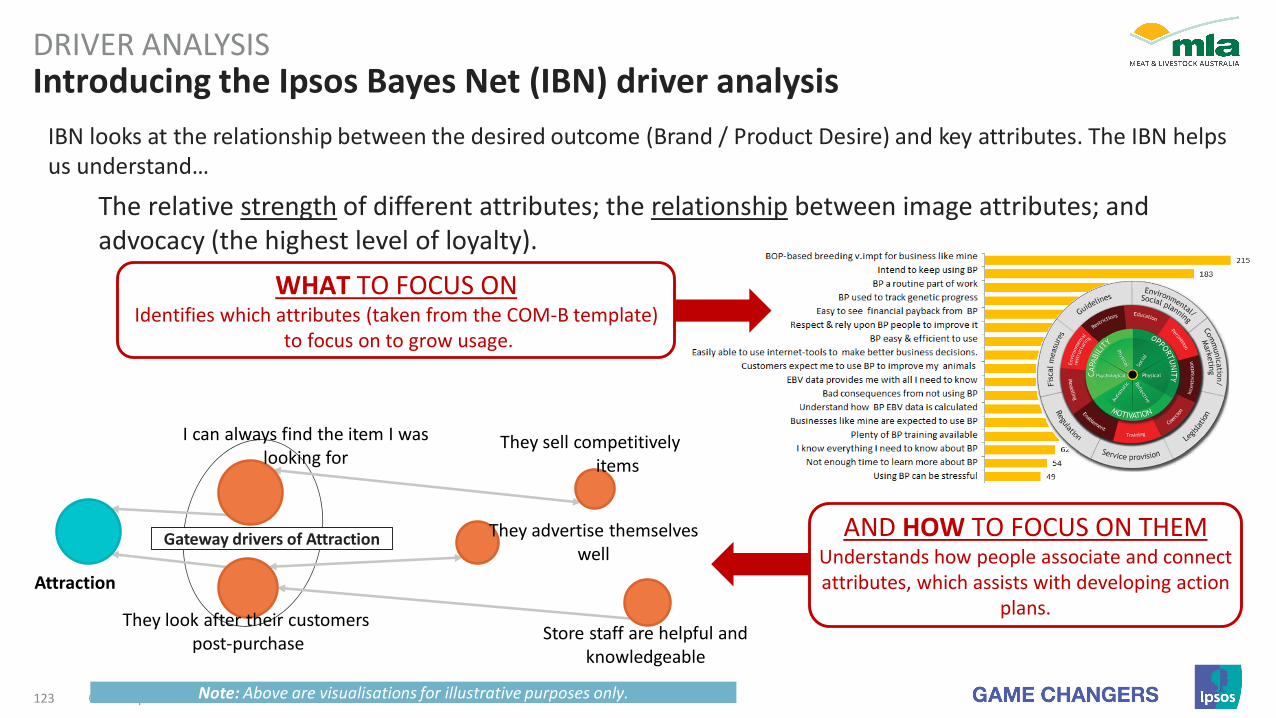
123 © 2016 Ipsos.
Introducing the Ipsos Bayes Net (IBN) driver analysisDRIVER ANALYSIS
IBN looks at the relationship between the desired outcome (Brand / Product Desire) and key attributes. The IBN helps us understand…
The relative strength of different attributes; the relationship between image attributes; and advocacy (the highest level of loyalty).
AND HOW TO FOCUS ON THEMUnderstands how people associate and connect attributes, which assists with developing action
plans.Attraction
They sell competitively priced items
I can always find the item I was looking for
Store staff are helpful and knowledgeable
They look after their customerspost-purchase
They advertise themselves well
Gateway drivers of Attraction
Note: Above are visualisations for illustrative purposes only.
WHAT TO FOCUS ONIdentifies which attributes (taken from the COM-B template)
to focus on to grow usage.

© 2016 Ipsos.124
Identifying What Is Truly Motivating

125 © 2016 Ipsos.
IBN analysis reveals that Studs’ BP support is mostly driven by Motivationalfactors
DRIVER ANALYSIS – CATTLE STUD & SEEDSTOCK PRODUCERS
Base: Cattle Stud – BP user (n=544)
BREEDPLANAdvocacy
I know everything I need to know about BP
BP a routine part of workBP used to track genetic progress
BP helpsprofits
Easily able to use internet tools to make better business decisions
Customers expect me to use BP to improve my animals
Businesses like mine are expected to use BP
Respect & rely upon BP people to improve it
Not enough time to learn more about BP
BP easy & efficient to use
Plenty of BP training available
BP-based breeding v. impt. for businesses like mine
Helps gettinggenetic gains
Bad consequences from not using BP
Intend to keep using BP
Impt. way to reach business goals
BP means easy-to-see genetic payback
Easy to see financial payback from BP
Gives peaceof mind
Using BP can be stressful
Understand how BP EBV data is calculated EBV data provides me
with all I need to know
These are the factors to communicate to increase BP uptake amongst Studs

126 © 2016 Ipsos.
High Priority for ImprovementLow Priority for Improvement
Raise Priority of These Factors
Maintain Performance
BP a routine part of workBP used to track genetic progress
Easily able to use internet tools to make better business decisions
Understand how BP EBV data is calculated
I know everything I need to know about BP
Respect & rely upon BP people to improve it
BP easy & efficient to useCustomers expect me to use BP to improve my animals
EBV data provides me with all I need to know
Businesses like mine are expected to use BP
Plenty of BP training available
Not enough time to learn more about BP
Helps get genetic gains
Gives peace of mind
Impt. way to reach business goals
BP helps profits BP means easy-to-see genetic payback
BP-based breeding v. impt for businesses like mine
Intend to keep using BP
Easy to see financial payback from BP
Using BP can be stressful
Motivation factors need to be the main focusPERFORMANCE & IMPORTANCE OF BP – STUD & SEEDSTOCK
Importance
Pe
rfo
rman
ce
Q38. For this last set of remaining questions, I’m going to read a statement out to you, and ask how much you agree or disagree with it, using a 7-point scale. So, if you completely agree that the statement describes you perfectly, you would give a score of 7. If you completely disagreed with the statement, you would give a score of 1. For all the statements I read to you, please consider them in terms of using BREEDPLAN information such as EBVs to make your breeding or purchase decisions
Base: Users of BP who own a farm with cattle stud or seedstock (n=544)
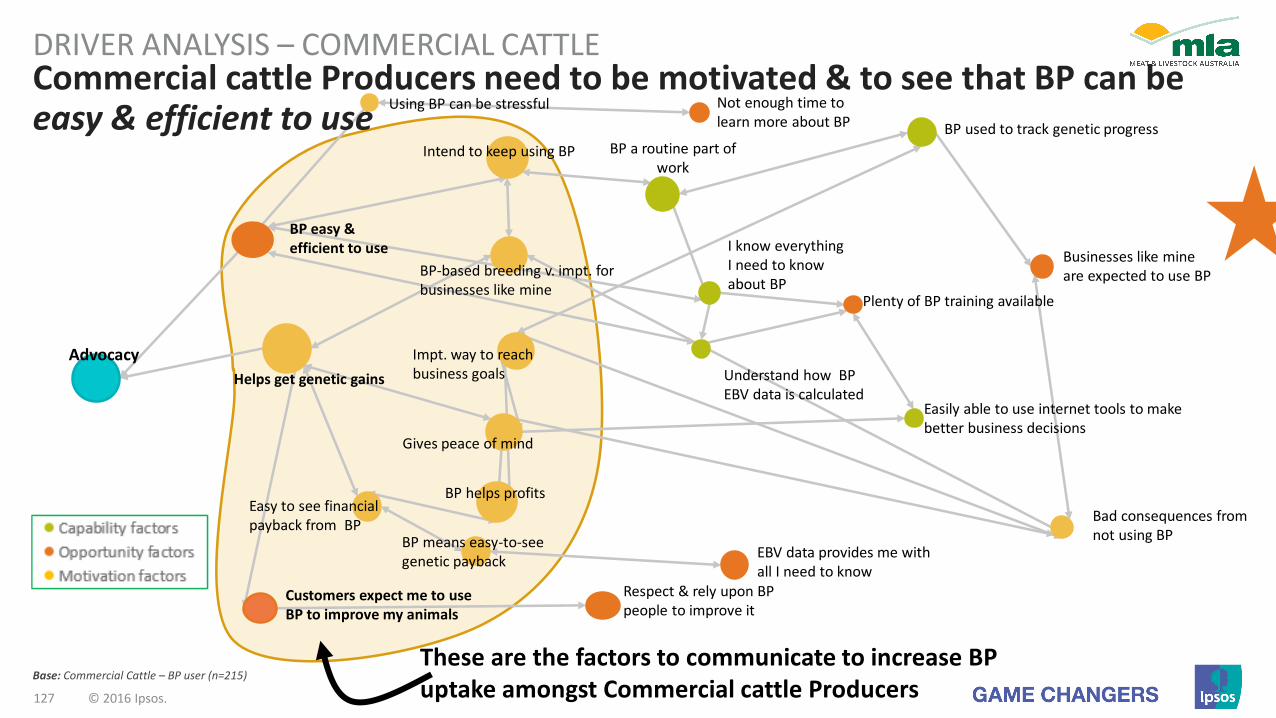
127 © 2016 Ipsos.
DRIVER ANALYSIS – COMMERCIAL CATTLE
Base: Commercial Cattle – BP user (n=215)
Advocacy
I know everything I need to know about BP
BP a routine part of work
BP used to track genetic progress
BP helps profits
Easily able to use internet tools to make better business decisions
Customers expect me to use BP to improve my animals
Businesses like mine are expected to use BP
Respect & rely upon BP people to improve it
Not enough time to learn more about BP
BP easy & efficient to use
Plenty of BP training available
BP-based breeding v. impt. for businesses like mine
Helps get genetic gains
Bad consequences from not using BP
Intend to keep using BP
Impt. way to reach business goals
BP means easy-to-see genetic payback
Easy to see financial payback from BP
Gives peace of mind
Using BP can be stressful
Understand how BP EBV data is calculated
EBV data provides me with all I need to know
These are the factors to communicate to increase BP uptake amongst Commercial cattle Producers
Commercial cattle Producers need to be motivated & to see that BP can be easy & efficient to use
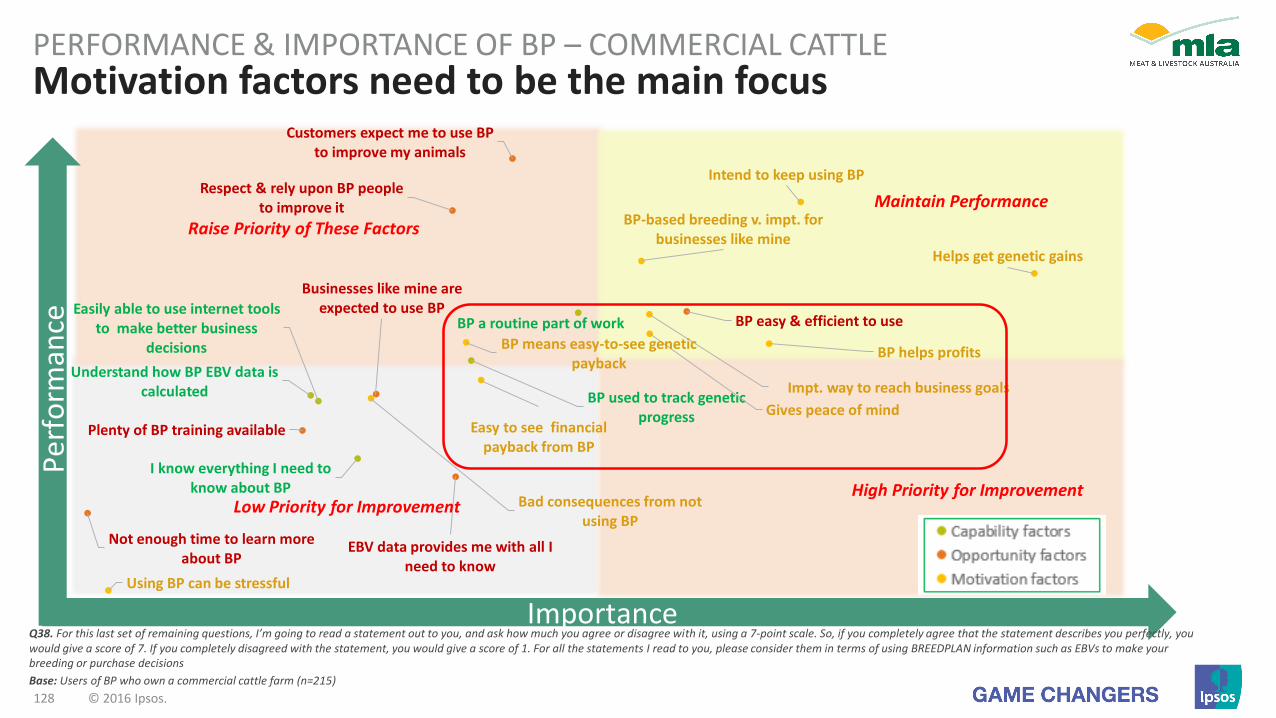
128 © 2016 Ipsos.
BP a routine part of work
BP used to track genetic progress
Easily able to use internet tools to make better business
decisions
Understand how BP EBV data is calculated
I know everything I need to know about BP
Respect & rely upon BP people to improve it
BP easy & efficient to use
Customers expect me to use BP to improve my animals
EBV data provides me with all I need to know
Businesses like mine are expected to use BP
Plenty of BP training available
Not enough time to learn more about BP
Helps get genetic gains
Gives peace of mind
Impt. way to reach business goals
BP helps profitsBP means easy-to-see genetic
payback
BP-based breeding v. impt. for businesses like mine
Intend to keep using BP
Easy to see financial payback from BP
Bad consequences from not using BP
Using BP can be stressful
Motivation factors need to be the main focusPERFORMANCE & IMPORTANCE OF BP – COMMERCIAL CATTLE
Importance
Pe
rfo
rman
ce
Q38. For this last set of remaining questions, I’m going to read a statement out to you, and ask how much you agree or disagree with it, using a 7-point scale. So, if you completely agree that the statement describes you perfectly, you would give a score of 7. If you completely disagreed with the statement, you would give a score of 1. For all the statements I read to you, please consider them in terms of using BREEDPLAN information such as EBVs to make your breeding or purchase decisions
Base: Users of BP who own a commercial cattle farm (n=215)
High Priority for ImprovementLow Priority for Improvement
Raise Priority of These Factors
Maintain Performance
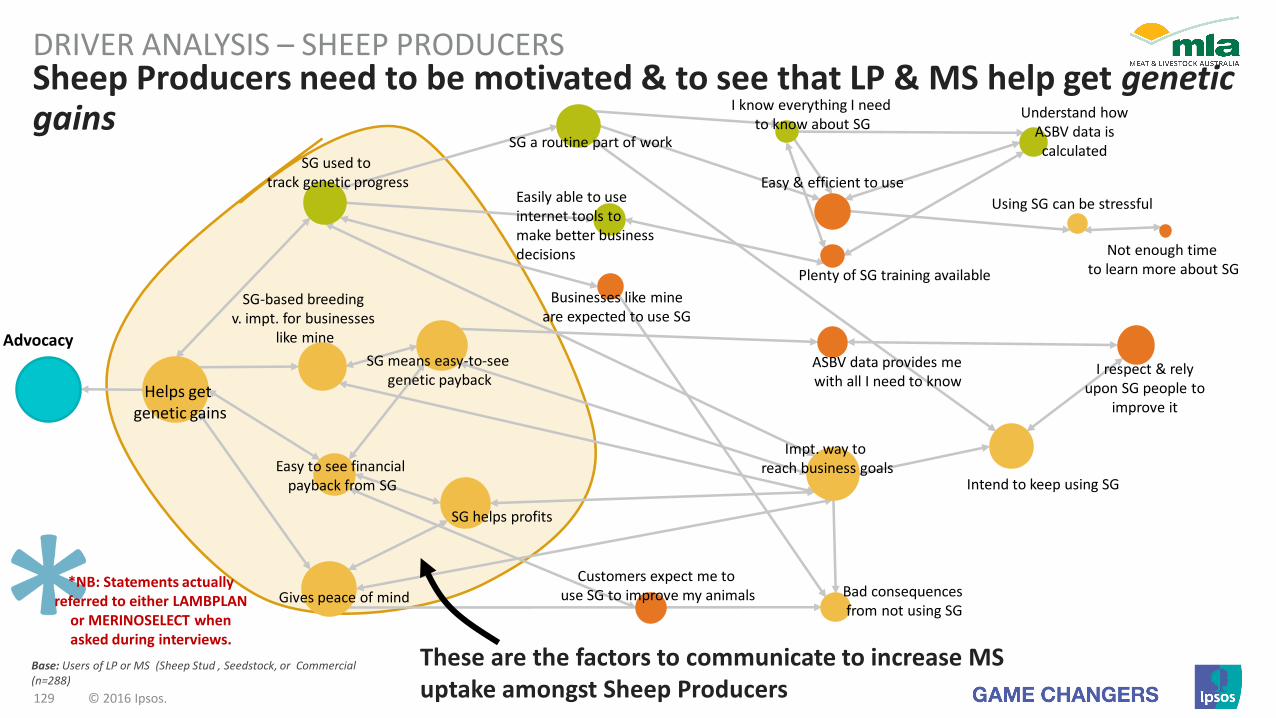
129 © 2016 Ipsos.
Sheep Producers need to be motivated & to see that LP & MS help get genetic gains
DRIVER ANALYSIS – SHEEP PRODUCERS
Advocacy
I know everything I needto know about SG
SG a routine part of work
SG used to track genetic progress
SG helps profits
Businesses like mineare expected to use SG
I respect & rely upon SG people to
improve it
Not enough timeto learn more about SG
Easy & efficient to use
Plenty of SG training available
Helps getgenetic gains
Bad consequencesfrom not using SG
Intend to keep using SG
Impt. way to reach business goals
SG means easy-to-seegenetic payback
Easy to see financial payback from SG
Gives peace of mind
Using SG can be stressful
Understand how ASBV data is calculated
Customers expect me to use SG to improve my animals
Easily able to use internet tools to make better business decisions
ASBV data provides me with all I need to know
SG-based breedingv. impt. for businesses
like mine
Base: Users of LP or MS (Sheep Stud , Seedstock, or Commercial (n=288)
*NB: Statements actually referred to either LAMBPLAN
or MERINOSELECT when asked during interviews.
These are the factors to communicate to increase MS uptake amongst Sheep Producers

130 © 2016 Ipsos.
Merino farmers need to agree that MS is an easy-to-use way to see and improve financial and genetic gains
PERFORMANCE & IMPORTANCE OF MS – ALL MS USERS
Importance (MERINOSELECT)
Perf
orm
ance
High Priority for ImprovementLow Priority for Improvement
Raise Priority of These Factors
Maintain Performance
Q38. For this last set of remaining questions, I’m going to read a statement out to you, and ask how much you agree or disagree with it, using a 7-point scale. So, if you completely agree that the statement describes you perfectly, you would give a score of 7. If you completely disagreed with the statement, you would give a score of 1. For all the statements I read to you, please consider them in terms of using MERINOSELECT information such as ASBVs to make your breeding or purchase decisions.
Base: Importance – All users of MS and LP (n=288), Performance – MS users (n=119)
Note that the ‘Importance re: MERINOSELECT’
calculation is based on users of LP and
users of MS combined in order
to attain the required minimum
sample size for accurate statistical
calculation.
Respect & rely upon MS people to improve it
MS easy & efficient to use
Customers expect me to use MS to improve my animals
ASBV data provides me with all I need to know
Businesses like mine are expected to use MS
Plenty of MS training available
Not enough time to learn more about MS
Helps get genetic gains
Gives peace of mind
Impt. way to reach business goals
MS helps profits
MS means easy-to-see genetic
payback
MS-based breeding v. impt. for business like mine
Intend to keep using MS
Easy to see financial payback from MS
Bad consequences from not using MS
Using MS can be stressful
MS a routine part of work
MS used to track genetic progress
Easily able to use internet
tools to make better business
decisions
Understand how ASBV data is calculated
I know everything I need to know about MS
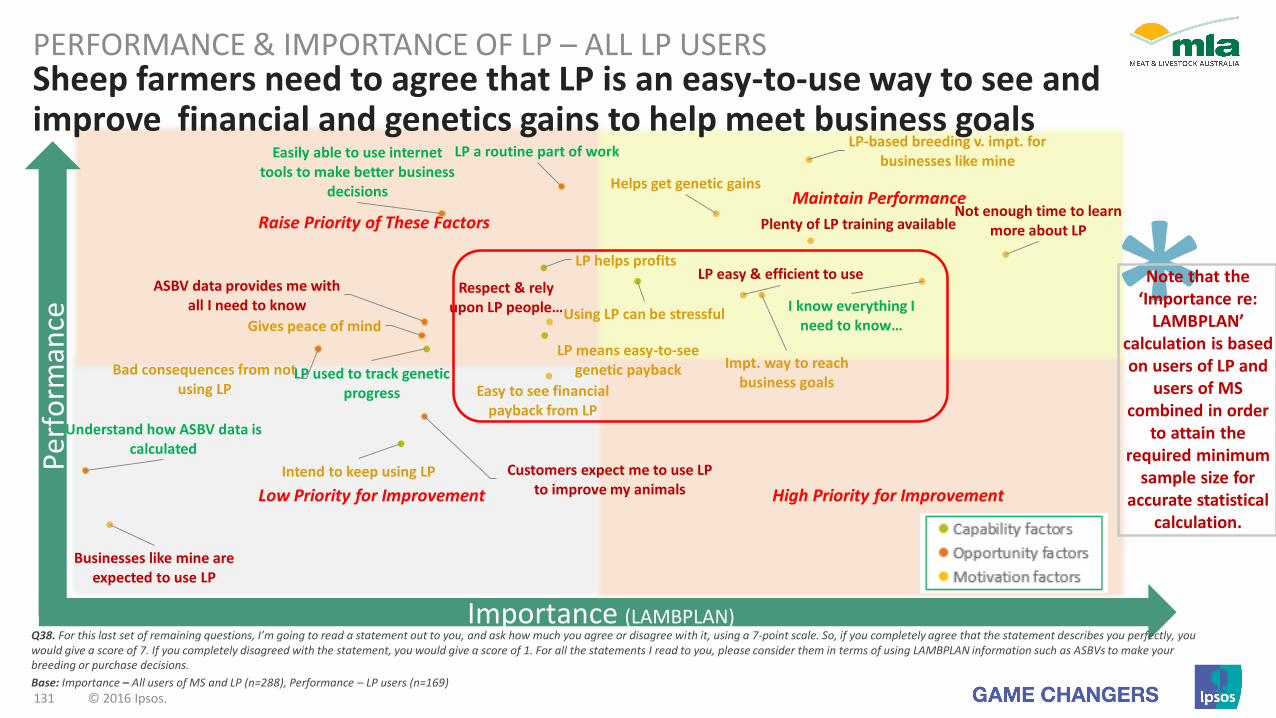
131 © 2016 Ipsos.
Sheep farmers need to agree that LP is an easy-to-use way to see andimprove financial and genetics gains to help meet business goals
PERFORMANCE & IMPORTANCE OF LP – ALL LP USERS
Importance (LAMBPLAN)
Pe
rfo
rman
ce
High Priority for ImprovementLow Priority for Improvement
Raise Priority of These Factors
Maintain Performance
Q38. For this last set of remaining questions, I’m going to read a statement out to you, and ask how much you agree or disagree with it, using a 7-point scale. So, if you completely agree that the statement describes you perfectly, you would give a score of 7. If you completely disagreed with the statement, you would give a score of 1. For all the statements I read to you, please consider them in terms of using LAMBPLAN information such as ASBVs to make your breeding or purchase decisions.
Base: Importance – All users of MS and LP (n=288), Performance – LP users (n=169)
Note that the ‘Importance re:
LAMBPLAN’ calculation is based on users of LP and
users of MS combined in order
to attain the required minimum
sample size for accurate statistical
calculation.
LP helps profits
LP means easy-to-see genetic payback
Intend to keep using LP
LP used to track genetic progress
Using LP can be stressful
Helps get genetic gains
Impt. way to reach business goals
LP-based breeding v. impt. for businesses like mine
Easy to see financial payback from LP
Respect & rely upon LP people …
LP easy & efficient to use
Businesses like mine are expected to use LP
Plenty of LP training available
I know everything I need to know …
Not enough time to learn more about LP
Gives peace of mind
LP a routine part of workEasily able to use internet tools to make better business
decisions
Customers expect me to use LP to improve my animals
ASBV data provides me with all I need to know
Bad consequences from not using LP
Understand how ASBV data is calculated
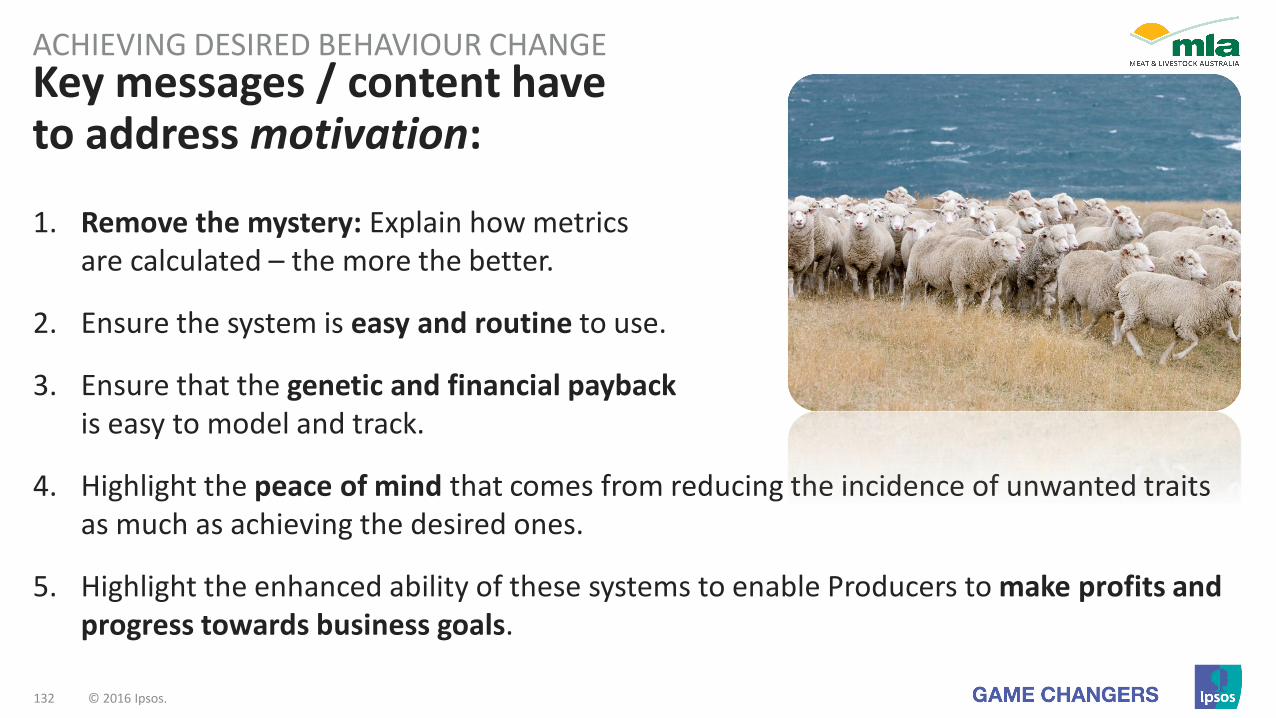
132 © 2016 Ipsos.
Key messages / content haveto address motivation:
ACHIEVING DESIRED BEHAVIOUR CHANGE
1. Remove the mystery: Explain how metricsare calculated – the more the better.
2. Ensure the system is easy and routine to use.
3. Ensure that the genetic and financial paybackis easy to model and track.
4. Highlight the peace of mind that comes from reducing the incidence of unwanted traits as much as achieving the desired ones.
5. Highlight the enhanced ability of these systems to enable Producers to make profits and progress towards business goals.
Summary of Key Points:QUANTITATIVE SURVEY
© 2016 Ipsos.133

134 © 2016 Ipsos.
Key Learnings: Business Profile
1. A lot of breeding software variance; many informal DIY tracking options used including pen and paper, and even just memory.The perceived need to adopt a new tracking system is a likely barrier to uptake.
2. No relationship between Producers’ duration in breeding, operation size and system usage – usage is not an issue of small / new /old / large farms…Usage is a consequence of Producers’ personal attitude, not functional elements.
3. Breed society membership naturally higher amongst PLAN Users, but many Non-Users are also breed society members.Breed societies can provide access to many Non-Users.
4. The larger incidence of composite breeds in the North leads to a focus on different traits, reduced BREEDPLAN Usage and Trust.
BUSINESS PROFILE & GENETIC PROGRESS
135 © 2016 Ipsos.
Key Learnings: Genetic Progress
1. The presence of set breeding objectives is not a predictor of PLAN usage.Cannot assume that Non-Users are ‘slack’ or have a poor handle on their breeding.
2. Those using PLANs employ a wider range of metrics and are also more likely to track ‘hidden’ traits; Non-Users are more likely to rely on fewer, more visual assessments.Non-Users are likely to view PLAN uptake as requiring a lot of extra, possibly unnecessary recording.
3. With the exception of MERINOSELECT Studs, satisfaction with genetic gains is not related to PLAN usage.With Non-Users being just as satisfied with their genetic gains, the promise of more satisfactory gains will not be effective nor justifiable.
BUSINESS PROFILE & GENETIC PROGRESS
136 © 2016 Ipsos.
Key Learnings: Trust & PLAN Perceptions
1. Users trust the PLANs, but:
Studs’ Trust is under-performing (the more Users know, the more they are inclinedto question).
Commercial Users’ Trust is ‘Blind’ and thus prone to being undermined.
Biggest complaints concern data inaccuracy / non-transparency; the data capture / entry effort required; and the slow rate of progress.More transparency and information is required to increase trust and advocacy.
2. Genetics management is mainly related to trait selection rather than avoidance.Need to highlight that good trait management is about trait reduction as well as promotion.
PERCEPTIONS OF BREEDPLAN, LAMBPLAN & MERINOSELECT
137 © 2016 Ipsos.
Key Learnings: Training & ExtensionTRAINING & EXTENSION NEEDS
1. Go-to trainers largely felt to be programme suppliers or MLA. Website usage varies but appears to be generally under-used.
2. Most information sources are skewed towards the informal and non-specialist contacts.There is an argument for extending basic knowledge and advocacy throughout the industry so that enquiries are met with consistent feedback and direction.
3. Lack of motivation is the main reason for lack of formal training. Motivation being hampered by Non-Users…
• Being no more dissatisfied than Users;
• Knowing little detail about the PLANs except that they seem to involve more work.
138 © 2016 Ipsos.
Key messages / content have to address motivation:ACHIEVING DESIRED BEHAVIOUR CHANGE
1. Remove the mystery: Explain how metrics are calculated – the more the better.
2. Ensure the system is easy and routine to use.
3. Consider a focus on the actual transition processes required.
4. Ensure that the genetic and financial payback is easy to model and track.
5. Highlight the peace of mind that comes from reducing the incidence of unwanted traits as much as achieving the desired ones.
6. Highlight the enhanced ability of these systems to enable Producers to make profits and progress towards business goals.

CONCLUSIONS & RECOMMENDATIONS
© 2016 Ipsos.139

140 © 2016 Ipsos.
Producers do ‘get’ the value of genetics-based breeding & purchasing
CONCLUSIONS
• This research has confirmed that Australian cattle and sheep Producers mostly:
– DO value and track their genetic gains;
– DO make breeding and purchase decisions based in large part on the desire to control the genetic quality of their stock;
– DO generally have more positive than negative impressions of BREEDPLAN / LAMBPLAN / MERINOSELECT;
– DO know where to go to get more information or training;
– Are equally satisfied with their progress regardless of whether they use a PLAN or not.
141 © 2016 Ipsos.
Despite Producers’ current usage of genetics-based buying / breeding, the PLANs offer too little for the effort required
CONCLUSIONS
• The key problems for Producers using / considering BREEDPLAN / LAMBPLAN / MERINOSELECT are that:
– The full range of traits that they value and record are seldom all included in BREEDPLAN / LAMBPLAN / MERINOSELECT (especially the Northern, often composite breeders), which weakens the perceived accuracy and value of the PLANs, accentuated by the ‘black box’ nature of their calculations.
– The time, complexities and effort involved in data capture raise questions about (deliberate or accidental) data accuracies and thereby reduce the attraction of contributing one’s own data or relying too much on PLAN data.
– The returns to be made from trait management are clouded and sometimes seen to be overrun by the more immediate and tangible factors that also influence animal productivity.
– This is accentuated by the suggestion from the qualitative stage that trait management is seen more as a means to avoid unwanted traits than to breed specifically for others (i.e. is an insurance against negative outcomes instead of an investment into positive outcomes).

142 © 2016 Ipsos.
RECOMMENDATIONS
Changing the TOOLS Changing the MESSAGES
• The industry standard, expected and used by more Producers.
• A proven way to help reach business goals and improve profits.
• Easy-to-see financial and genetic payback.
• Improved, easier and more efficient.
• Helps speed up genetic gains.
• Increases the positive effects of improvements made throughout the farm systems.
• Gives peace of mind – reduces likelihood of unwanted traits.
• Understandable, transparent EBV / ASBV calculations.
• Making data entry easier and more accurate (e.g. changing interface or processes, creating an input app).
• Enabling Users to record other user-defined / -customised traits, even if they are not included in EBV / ASBV calculation (to enable a single data collection point).
• Enabling easier introduction of new bloodlines (e.g. for Studs importing new animals).
• Widening range of breeds catered for, especially composites and those favoured in the North.
• Increasing the amount of financial modelling available.
• Add a ‘mythbusting’ section to acknowledge and address the concerns and misconceptions identified here.
Changing the INDUSTRY
• Make the improved PLANs and tools measures ubiquitous – work to make them the norm in all sales, breed societies and related channels.
• Go on the charm offensive once improvements are made

143 © 2016 Ipsos.
Contacts
Jonathan DoddResearch Director
+64 21 538 634
Daniel PeetersResearcher
+64 9 538 0542