Embed Size (px)
Citation preview
Understanding the Tools and Techniques Needed to Reduce, Eliminate, or Accept
Asset and Facility Risk
PRESENTERS:
Name
Organization
Facility Management Experience
Expectations from Course
2
Understand Basic Risk Management
Become Familiar with Risk Management Tools
What is Failure Mode and Effect Analysis (FMEA)
FMEA Tools and Processes
FMEA Examples and Exercises
Overview of a Risk Audit
Course Summary and Questions
3
What Keeps You Awake at Night?
Mike’s Three (3) Priorities Safety – Keeping Employees and Customers Safe
Ensuring He Doesn’t Go to Jail
Making Sure He Sleeps All Night
4
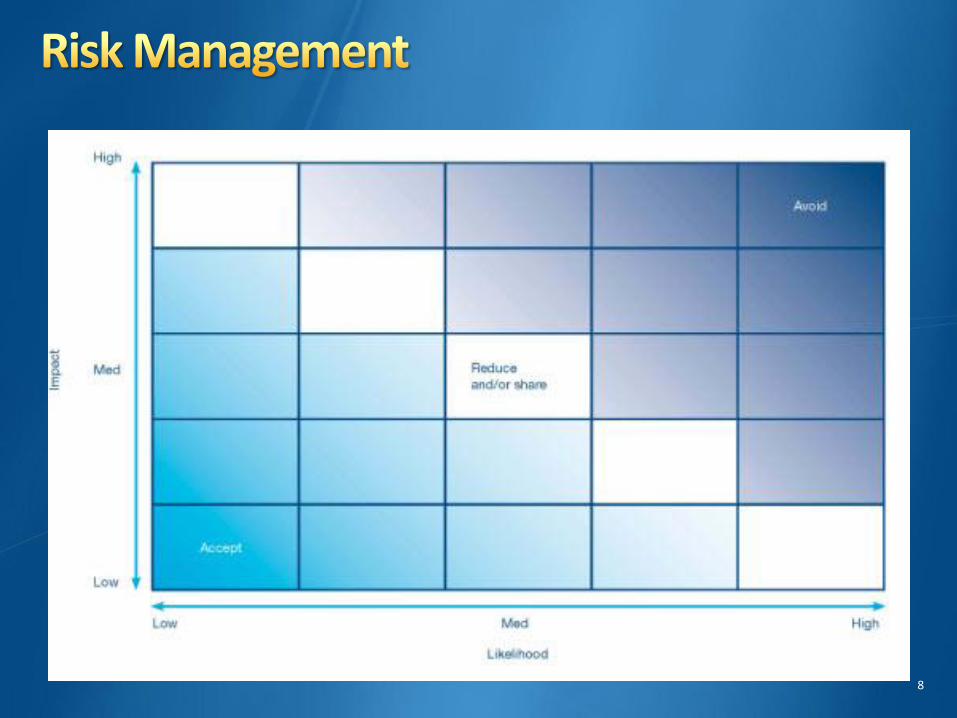
Unacceptable Risk Risk assessment is the determination of quantitative or qualitative value of risk related to a concrete situation and a recognized hazard.
Quantitative risk assessment requires calculations of two components of risk: the magnitude of the potential loss, and the probability the loss will occur.
5
Acceptable Risk Is a risk that is understood and tolerated usually because the cost or difficulty of implementing an effective countermeasure for the associated vulnerability exceeds the expectation of loss.
6
Management Culture of Continuous Improvement
Leading Class Equipment and Asset Management System
Complete and Detailed Understanding of Your Operating System and Process
Mature Maintenance Management System and Process
7
8
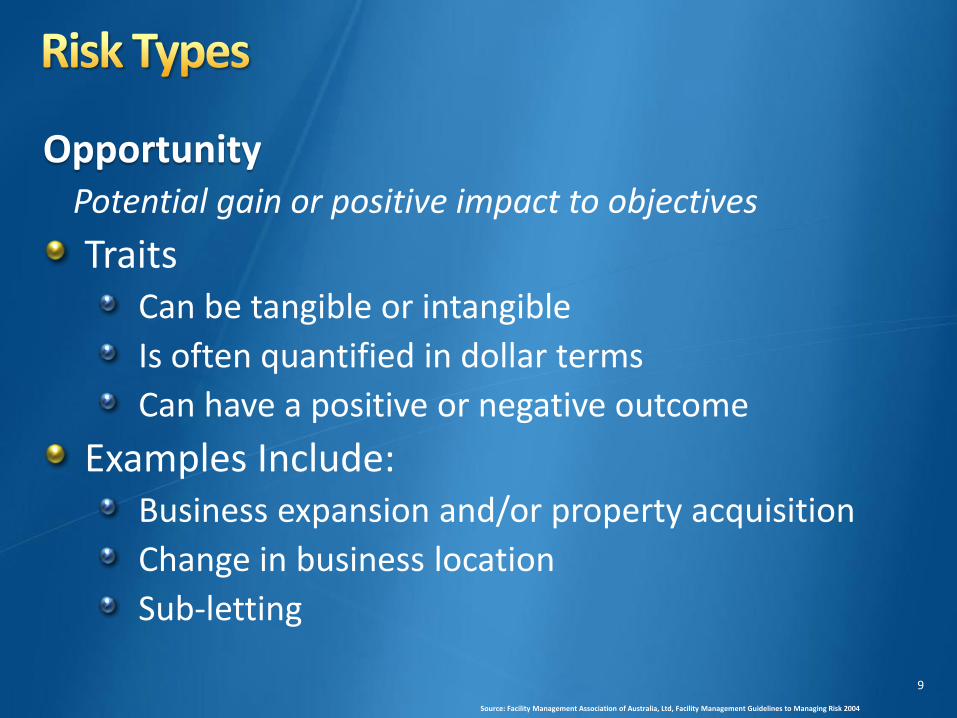
Opportunity Potential gain or positive impact to objectives
Traits Can be tangible or intangible
Is often quantified in dollar terms
Can have a positive or negative outcome
Examples Include: Business expansion and/or property acquisition
Change in business location
Sub-letting
Source: Facility Management Association of Australia, Ltd, Facility Management Guidelines to Managing Risk 2004
9

Uncertainty Associated with unknown and unexpected events, generally catastrophic
Traits Unknown or difficult to quantify
Catastrophic or disastrous
Can be costly
Outside the organization’s sphere of control
Examples Include: Building damage by flash flooding, arson or sabotage
Hurricanes, tornados or blizzards Source: Facility Management Association of Australia, Ltd, Facility Management Guidelines to Managing Risk 2004
10
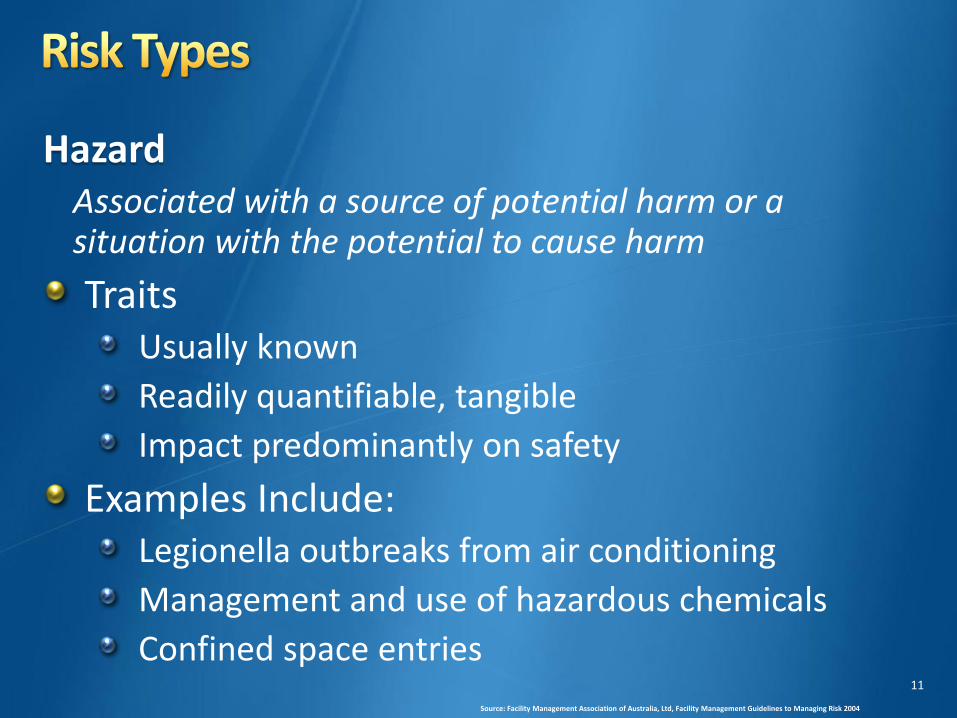
Hazard Associated with a source of potential harm or a situation with the potential to cause harm
Traits Usually known
Readily quantifiable, tangible
Impact predominantly on safety
Examples Include: Legionella outbreaks from air conditioning
Management and use of hazardous chemicals
Confined space entries Source: Facility Management Association of Australia, Ltd, Facility Management Guidelines to Managing Risk 2004
11
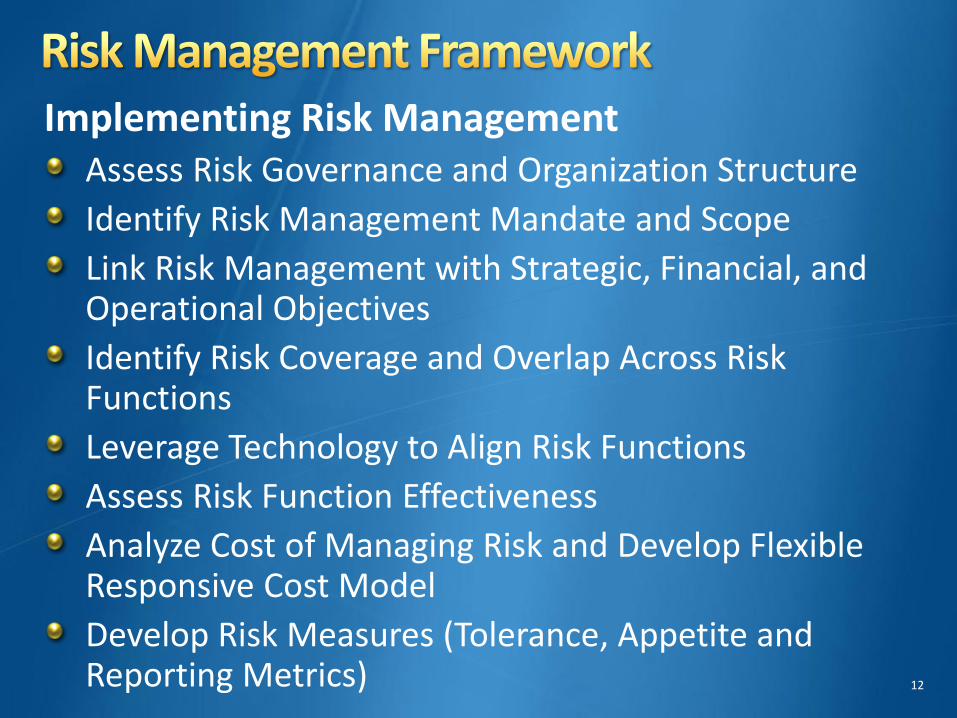
Implementing Risk Management Assess Risk Governance and Organization Structure
Identify Risk Management Mandate and Scope
Link Risk Management with Strategic, Financial, and Operational Objectives
Identify Risk Coverage and Overlap Across Risk Functions
Leverage Technology to Align Risk Functions
Assess Risk Function Effectiveness
Analyze Cost of Managing Risk and Develop Flexible Responsive Cost Model
Develop Risk Measures (Tolerance, Appetite and Reporting Metrics) 12
Risk Management Formalization and Assessment Methods
13
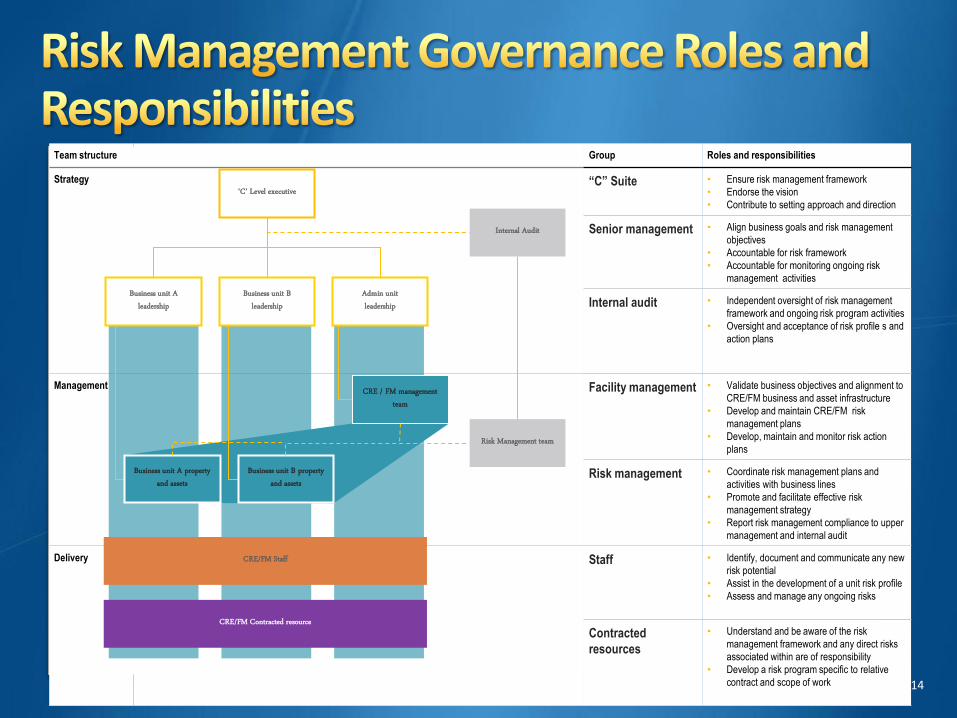
Team structure Group Roles and responsibilities
Strategy “C” Suite • Ensure risk management framework
• Endorse the vision
• Contribute to setting approach and direction
Senior management • Align business goals and risk management
objectives
• Accountable for risk framework
• Accountable for monitoring ongoing risk
management activities
Internal audit • Independent oversight of risk management
framework and ongoing risk program activities
• Oversight and acceptance of risk profile s and
action plans
Management Facility management • Validate business objectives and alignment to
CRE/FM business and asset infrastructure
• Develop and maintain CRE/FM risk
management plans
• Develop, maintain and monitor risk action
plans
Risk management • Coordinate risk management plans and
activities with business lines
• Promote and facilitate effective risk
management strategy
• Report risk management compliance to upper
management and internal audit
Delivery Staff • Identify, document and communicate any new
risk potential
• Assist in the development of a unit risk profile
• Assess and manage any ongoing risks
Contracted
resources
• Understand and be aware of the risk
management framework and any direct risks
associated within are of responsibility
• Develop a risk program specific to relative
contract and scope of work
CRE/FM Staff
Business unit A leadership
Risk Management team
Business unit A property and assets
‘C’ Level executive
CRE / FM management team
Business unit B leadership
Internal Audit
Admin unit leadership
Business unit B property and assets
CRE/FM Contracted resource
14
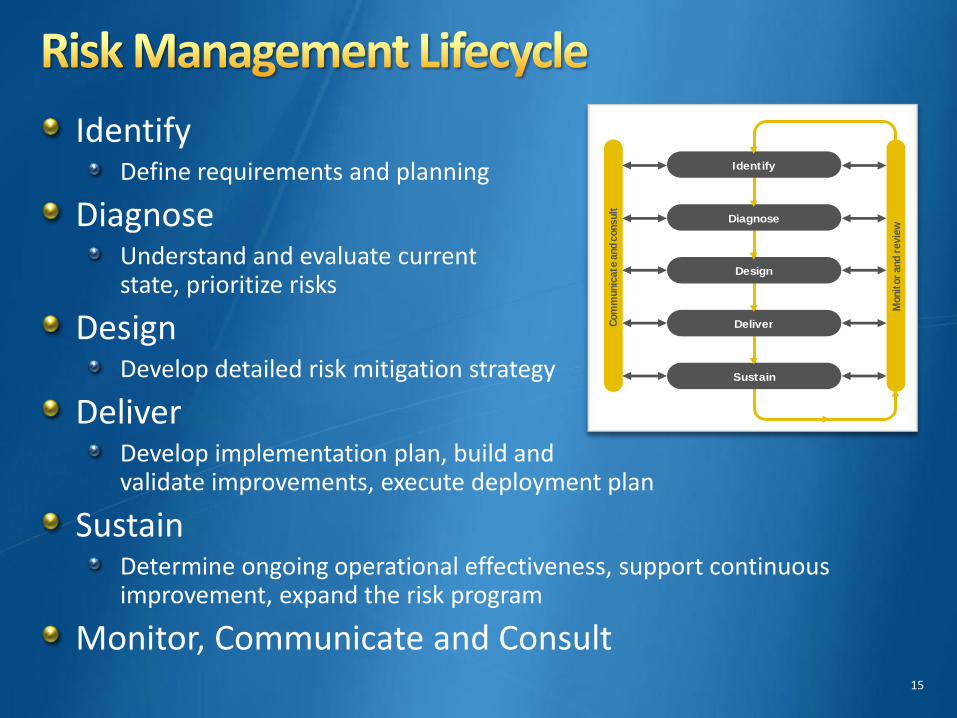
Identify Define requirements and planning
Diagnose Understand and evaluate current state, prioritize risks
Design Develop detailed risk mitigation strategy
Deliver Develop implementation plan, build and validate improvements, execute deployment plan
Sustain Determine ongoing operational effectiveness, support continuous improvement, expand the risk program
Monitor, Communicate and Consult
Monit
or
and r
evie
w
Com
munic
ate
and c
onsult
Identify
Deliver
Diagnose
Sustain
Design
15
A Tool for Each Purpose and FMEA Explained
16
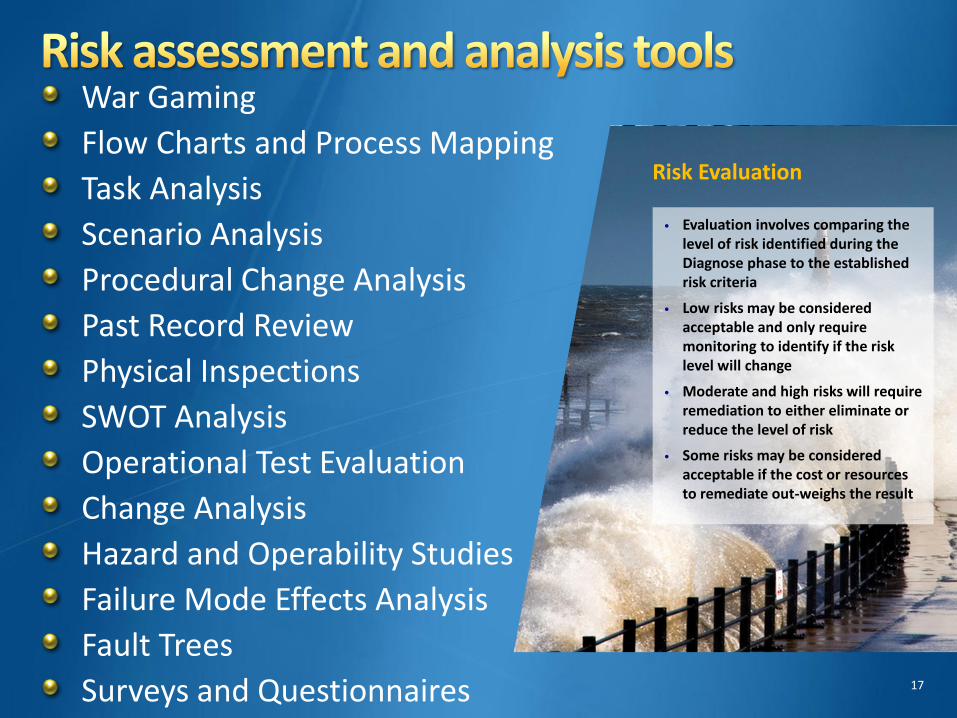
War Gaming
Flow Charts and Process Mapping
Task Analysis
Scenario Analysis
Procedural Change Analysis
Past Record Review
Physical Inspections
SWOT Analysis
Operational Test Evaluation
Change Analysis
Hazard and Operability Studies
Failure Mode Effects Analysis
Fault Trees
Surveys and Questionnaires
Risk Evaluation
• Evaluation involves comparing the level of risk identified during the Diagnose phase to the established risk criteria
• Low risks may be considered acceptable and only require monitoring to identify if the risk level will change
• Moderate and high risks will require remediation to either eliminate or reduce the level of risk
• Some risks may be considered acceptable if the cost or resources to remediate out-weighs the result
17
18
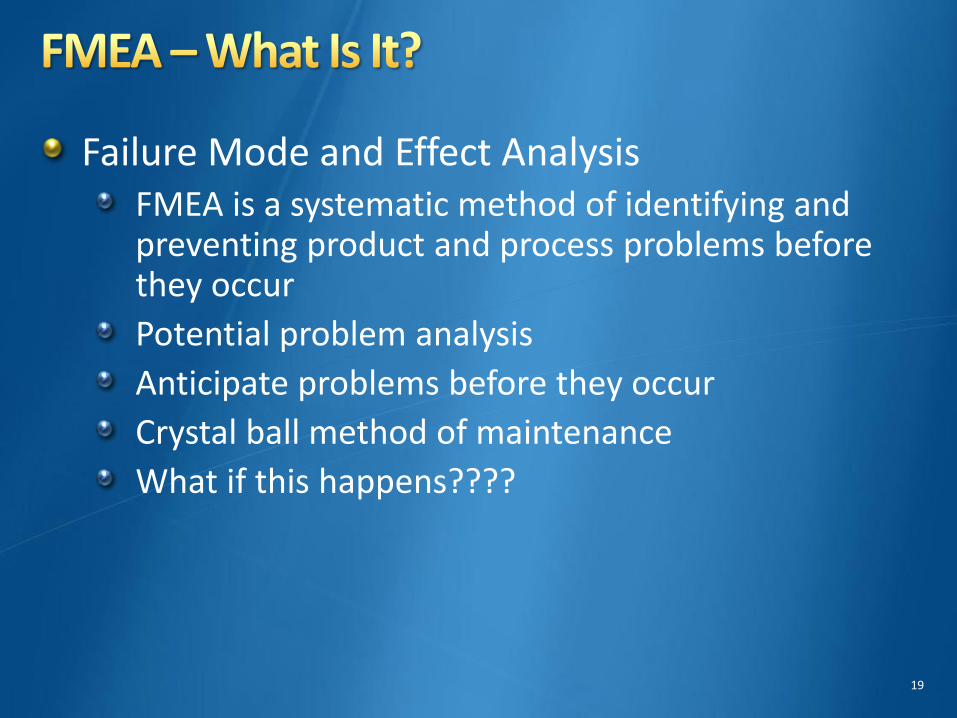
Failure Mode and Effect Analysis FMEA is a systematic method of identifying and preventing product and process problems before they occur
Potential problem analysis
Anticipate problems before they occur
Crystal ball method of maintenance
What if this happens????
19
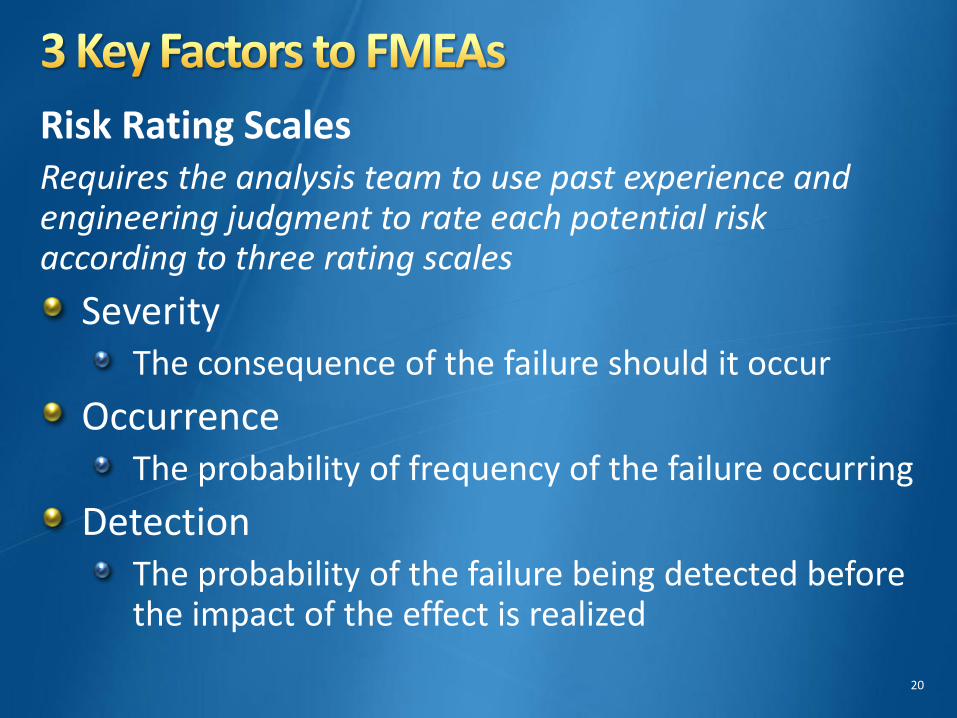
Risk Rating Scales Requires the analysis team to use past experience and engineering judgment to rate each potential risk according to three rating scales
Severity The consequence of the failure should it occur
Occurrence The probability of frequency of the failure occurring
Detection The probability of the failure being detected before the impact of the effect is realized
20
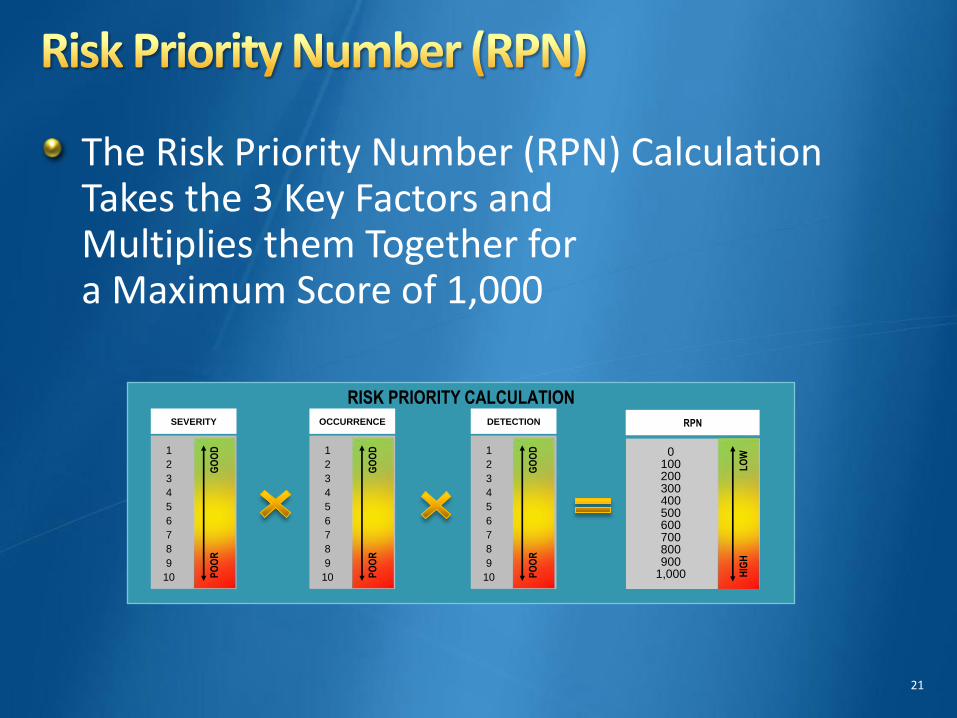
The Risk Priority Number (RPN) Calculation Takes the 3 Key Factors and Multiplies them Together for a Maximum Score of 1,000
RPN Calculation S x O x D (max score 1,000) ► Severity - rates the severity of the potential effect of the failure.
► Occurrence - rates the likelihood that the failure will occur.
► Detection - rates the likelihood that the problem will be detected before it reaches the end-user/customer.
RISK PRIORITY CALCULATION
1
2
3
4
5
6
7
8
9
10
SEVERITY OCCURRENCE DETECTION
0 100 200 300 400 500 600 700 800 900
1,000 HIG
H
LO
W
RPN
1
2
3
4
5
6
7
8
9
10
1
2
3
4
5
6
7
8
9
10
PO
OR
G
OO
D
PO
OR
G
OO
D
PO
OR
G
OO
D
21
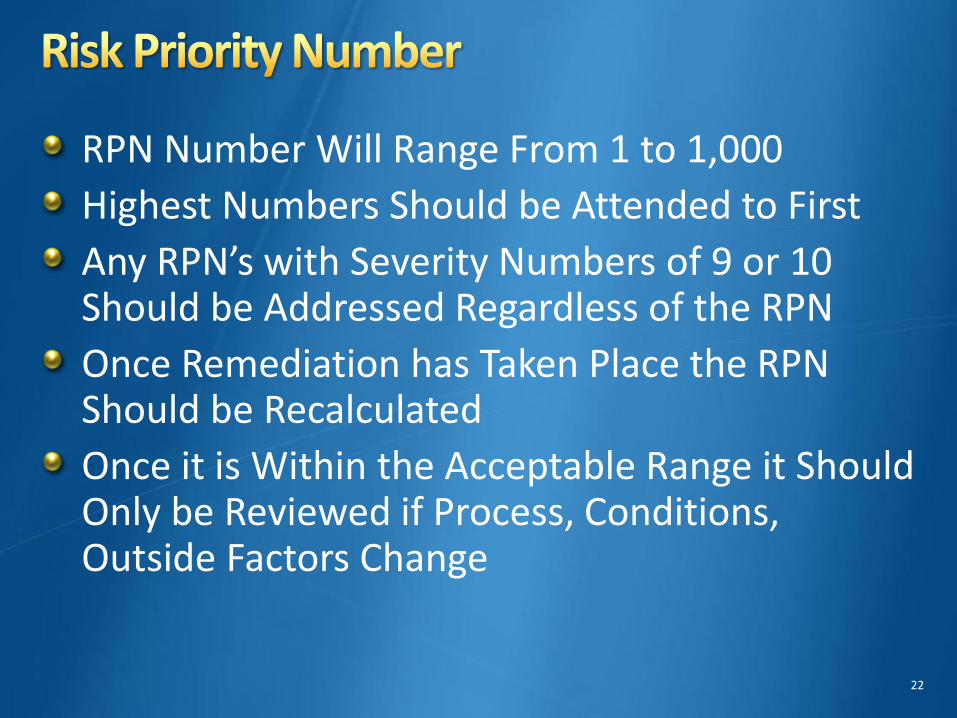
RPN Number Will Range From 1 to 1,000
Highest Numbers Should be Attended to First
Any RPN’s with Severity Numbers of 9 or 10 Should be Addressed Regardless of the RPN
Once Remediation has Taken Place the RPN Should be Recalculated
Once it is Within the Acceptable Range it Should Only be Reviewed if Process, Conditions, Outside Factors Change
22
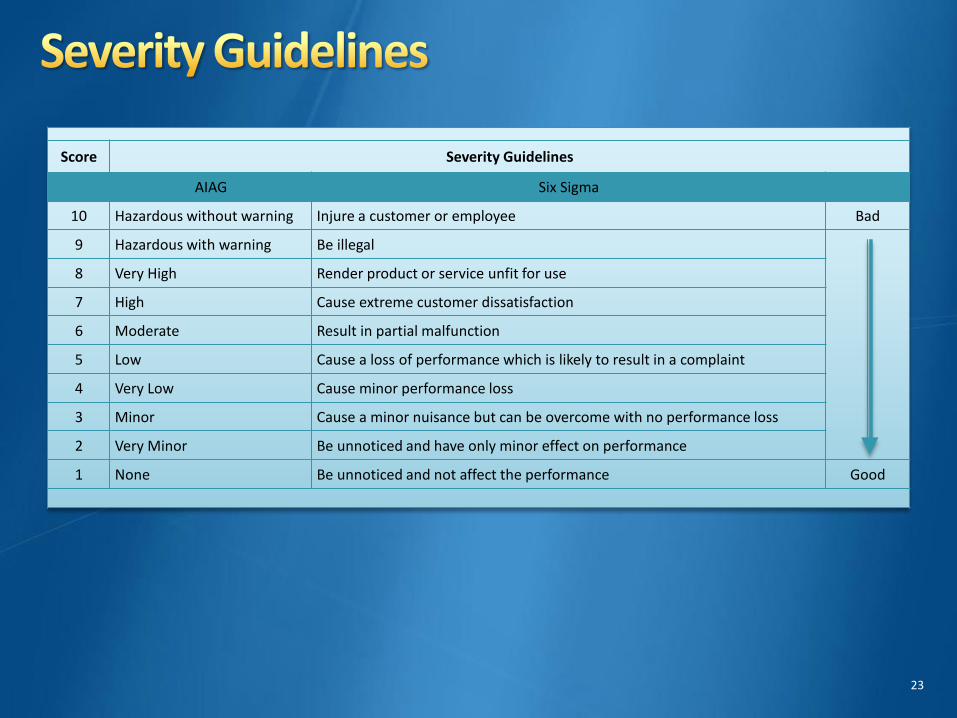
Score Severity Guidelines
AIAG Six Sigma
10 Hazardous without warning Injure a customer or employee Bad
9 Hazardous with warning Be illegal
8 Very High Render product or service unfit for use
7 High Cause extreme customer dissatisfaction
6 Moderate Result in partial malfunction
5 Low Cause a loss of performance which is likely to result in a complaint
4 Very Low Cause minor performance loss
3 Minor Cause a minor nuisance but can be overcome with no performance loss
2 Very Minor Be unnoticed and have only minor effect on performance
1 None Be unnoticed and not affect the performance Good
23
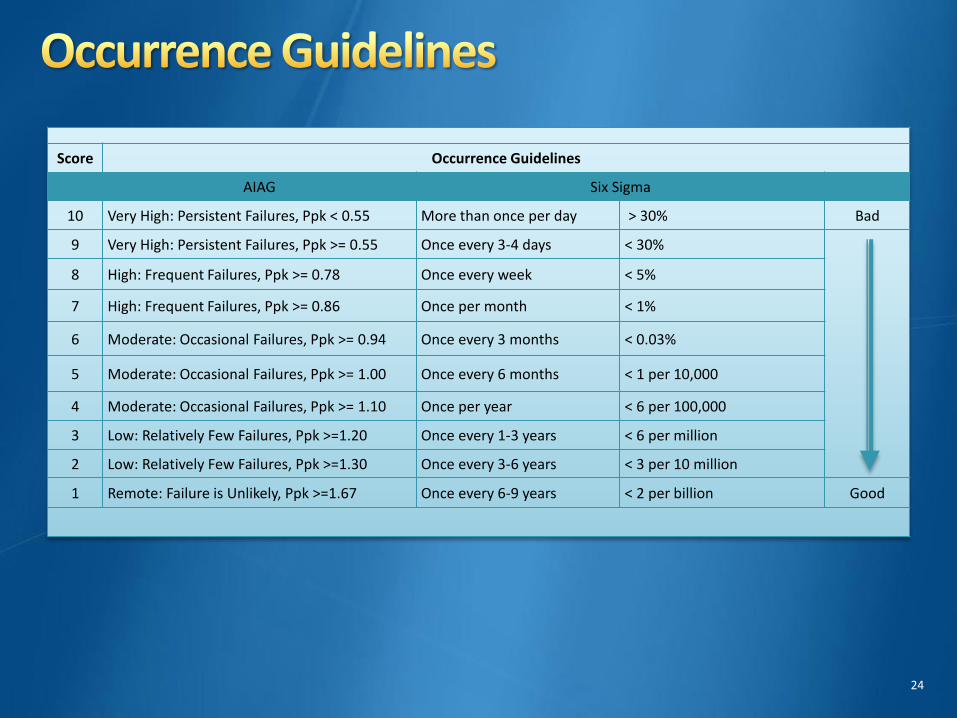
Score Occurrence Guidelines
AIAG Six Sigma
10 Very High: Persistent Failures, Ppk < 0.55 More than once per day > 30% Bad
9 Very High: Persistent Failures, Ppk >= 0.55 Once every 3-4 days < 30%
8 High: Frequent Failures, Ppk >= 0.78 Once every week < 5%
7 High: Frequent Failures, Ppk >= 0.86 Once per month < 1%
6 Moderate: Occasional Failures, Ppk >= 0.94 Once every 3 months < 0.03%
5 Moderate: Occasional Failures, Ppk >= 1.00 Once every 6 months < 1 per 10,000
4 Moderate: Occasional Failures, Ppk >= 1.10 Once per year < 6 per 100,000
3 Low: Relatively Few Failures, Ppk >=1.20 Once every 1-3 years < 6 per million
2 Low: Relatively Few Failures, Ppk >=1.30 Once every 3-6 years < 3 per 10 million
1 Remote: Failure is Unlikely, Ppk >=1.67 Once every 6-9 years < 2 per billion Good
24
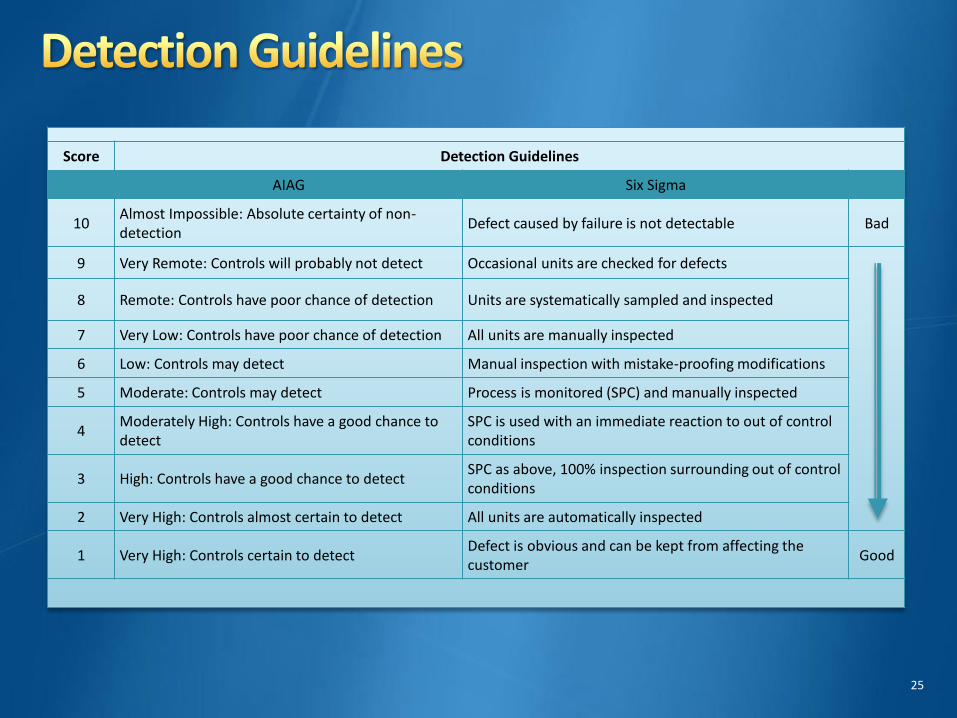
Score Detection Guidelines
AIAG Six Sigma
10 Almost Impossible: Absolute certainty of non-detection
Defect caused by failure is not detectable Bad
9 Very Remote: Controls will probably not detect Occasional units are checked for defects
8 Remote: Controls have poor chance of detection Units are systematically sampled and inspected
7 Very Low: Controls have poor chance of detection All units are manually inspected
6 Low: Controls may detect Manual inspection with mistake-proofing modifications
5 Moderate: Controls may detect Process is monitored (SPC) and manually inspected
4 Moderately High: Controls have a good chance to detect
SPC is used with an immediate reaction to out of control conditions
3 High: Controls have a good chance to detect SPC as above, 100% inspection surrounding out of control conditions
2 Very High: Controls almost certain to detect All units are automatically inspected
1 Very High: Controls certain to detect Defect is obvious and can be kept from affecting the customer
Good
25
Team Leader
Process or Equipment Expert
4-6 Members
26

Team Leader Responsible for:
Communication
Organization
Documentation
Resource provider
Ensure team stays focused and on subject
Does not need to be process or equipment expert
Does need to fully understand the FMEA process
Leader is more of facilitator then decision maker
27
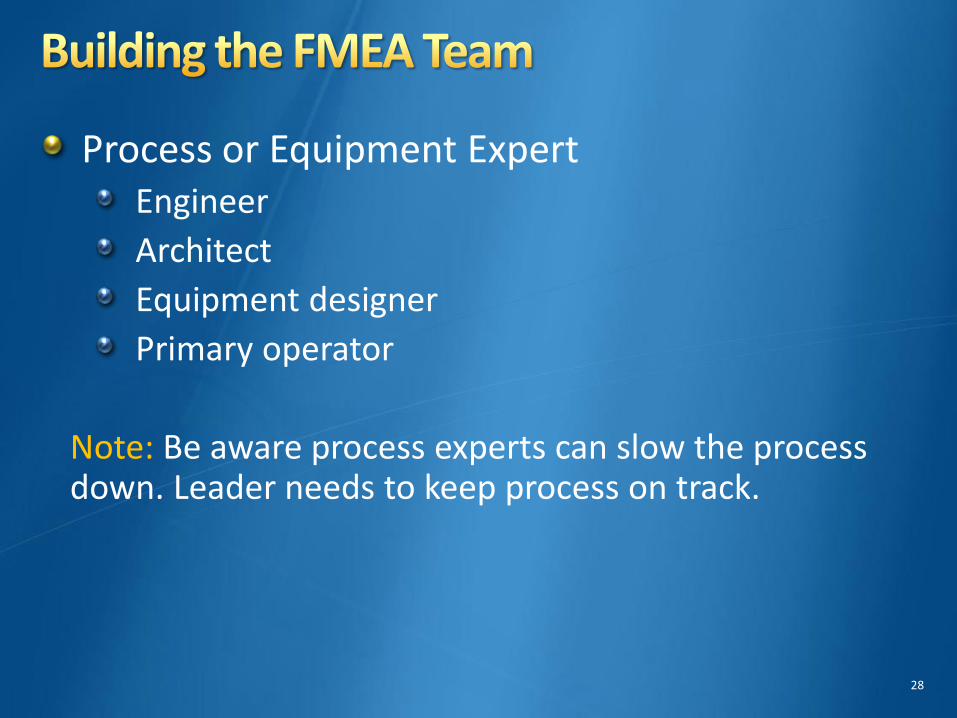
Process or Equipment Expert Engineer
Architect
Equipment designer
Primary operator
Note: Be aware process experts can slow the process down. Leader needs to keep process on track.
28
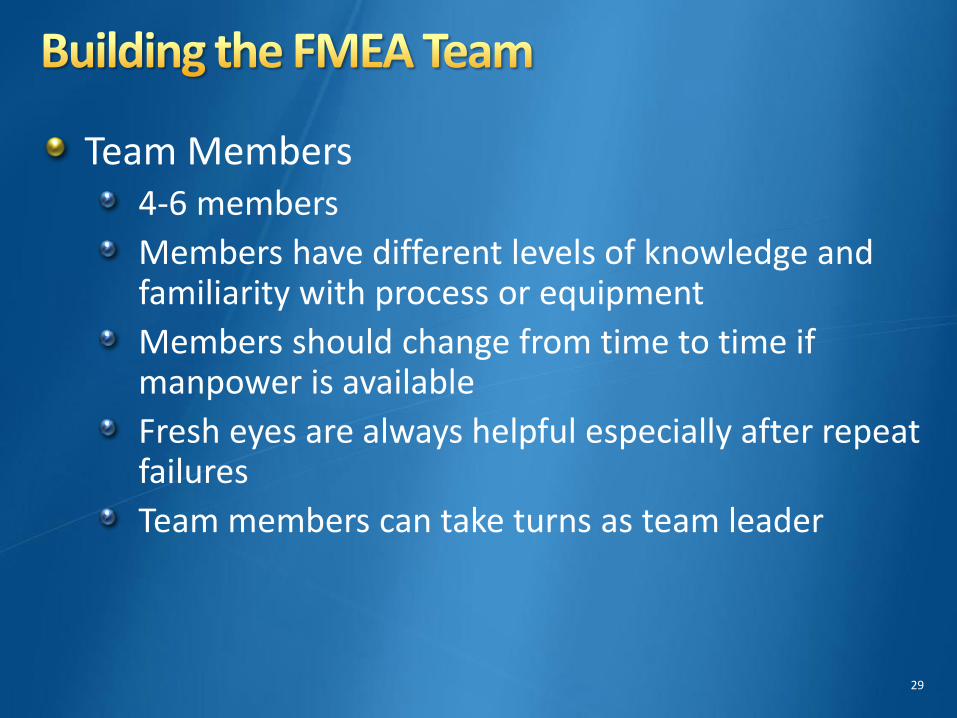
Team Members 4-6 members
Members have different levels of knowledge and familiarity with process or equipment
Members should change from time to time if manpower is available
Fresh eyes are always helpful especially after repeat failures
Team members can take turns as team leader
29
Basic FMEA Process Training
Problem Solving Techniques
Brainstorming Processes
Simple and Common FMEA Exercises
Note: Lower amounts of training are required if the team leader is experienced in the FMEA process
30
Consider Important Boundaries Keeps team on task
Periodic Reviews by Management Will Add Some Controls
Will the Team be Responsible for Implementing the Recommendations?
Is There a Financial Component? What is team’s budget?
Are There Deadlines?
How Does the Team Communicate the Final Results?
31

1. Review the Process or Equipment Review drawings and process flow diagrams
Tour the location or equipment
Have process or operations expert present
2. Brainstorm Possible Failure Modes Begin the brainstorming process
Each member of team should be responsible for numerous ideas
Remember it’s brainstorming, listen to all thoughts even the unusual
32
3. List Potential Effects of Each Failure Mode List all effects of each potential failure mode
Some may have several potential effects
4. Assign Severity Ranking for Each Effect How severe is the effect if it happens?
What are the consequences of the failure?
The ranking is 1-10
33
5. Assign an Occurrence Ranking for Each Failure Use actual data if available
Obtained from CMMS history or event logs from operators
The ranking is 1-10
6. Assign a Detection Ranking for Each Failure Mode and/or Effect
How likely will you be able to detect the failure?
If difficult or impossible to detect then it warrants a high score
Detection rankings are 1-10 34
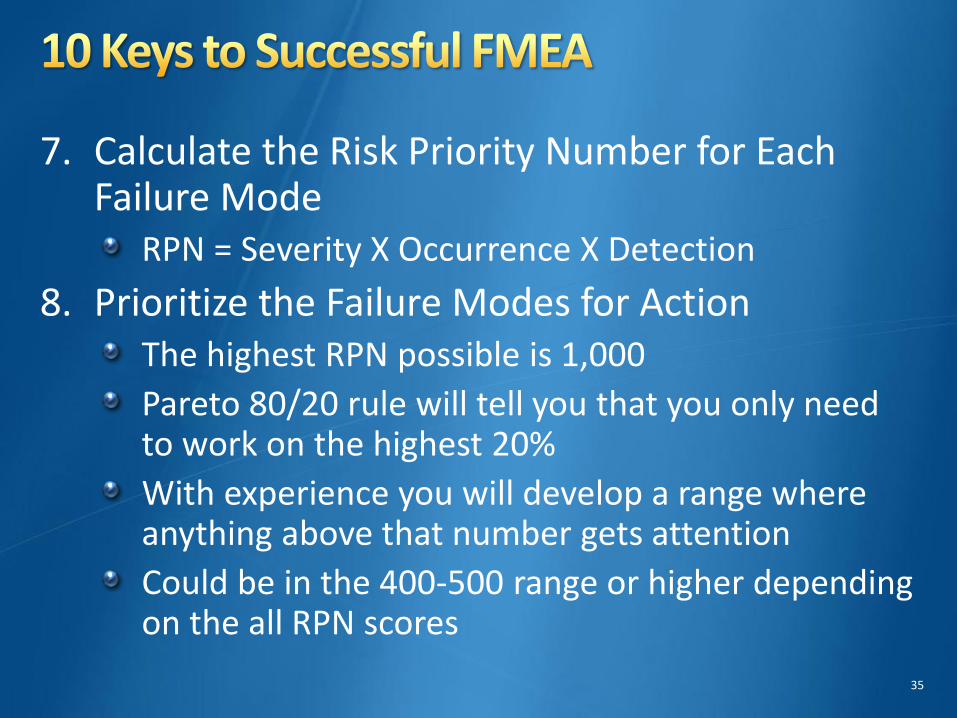
7. Calculate the Risk Priority Number for Each Failure Mode
RPN = Severity X Occurrence X Detection
8. Prioritize the Failure Modes for Action The highest RPN possible is 1,000
Pareto 80/20 rule will tell you that you only need to work on the highest 20%
With experience you will develop a range where anything above that number gets attention
Could be in the 400-500 range or higher depending on the all RPN scores
35
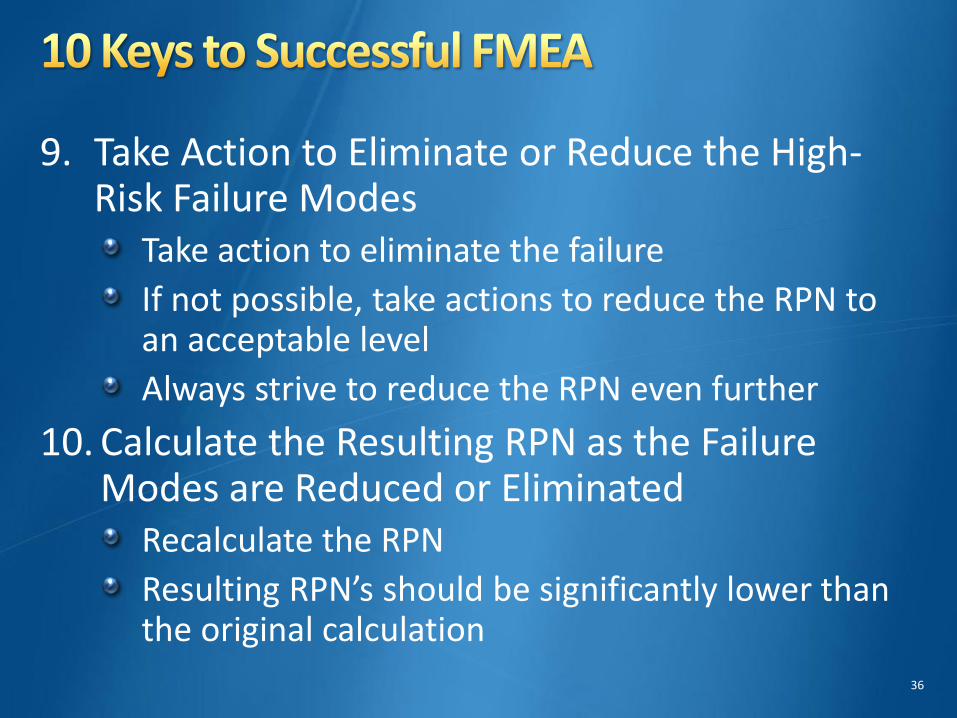
9. Take Action to Eliminate or Reduce the High-Risk Failure Modes
Take action to eliminate the failure
If not possible, take actions to reduce the RPN to an acceptable level
Always strive to reduce the RPN even further
10. Calculate the Resulting RPN as the Failure Modes are Reduced or Eliminated
Recalculate the RPN
Resulting RPN’s should be significantly lower than the original calculation
36
37

38
39
40

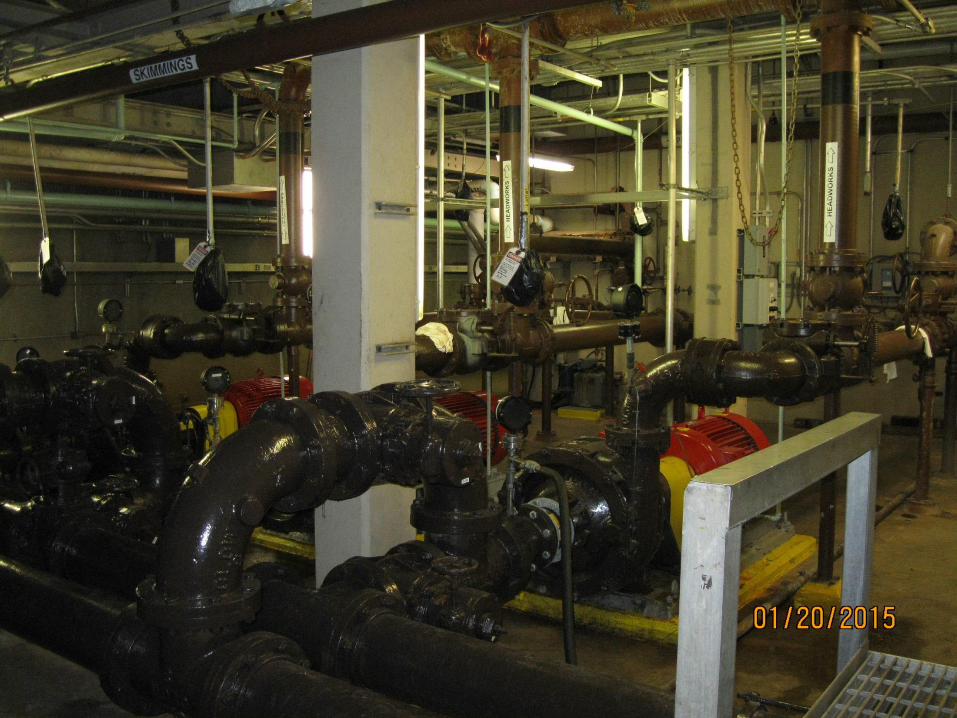
1. Must pump 500 GPM on consistent basis
2. Must pump 24/7
3. Pump flow monitored in control room, but not an alarm function
4. Operator rounds conducted every 2-4 hours. Unless other problems are being handled
5. Pump leakage detected by observation only
6. Might take operator 24 hours to discover pump performance is sub-standard. Due to rise in sludge blanket in clarifiers
7. 2 pumps normally operate at one time
8. Pump speed and flow managed by VFD’s
41
What was the Top Failure Mode? What do You Think the RPN (Risk Priority Number) Was?
What do You Think Were the Most Critical Components of the System?
What Part of the System Needed the Most Attention to Ensure Consistent Operation and Pumping?
42
Answer:
The Fractional horsepower motor on the VFD cabinet cooling Fan!!
and
Pump shaft packing problems
43
44
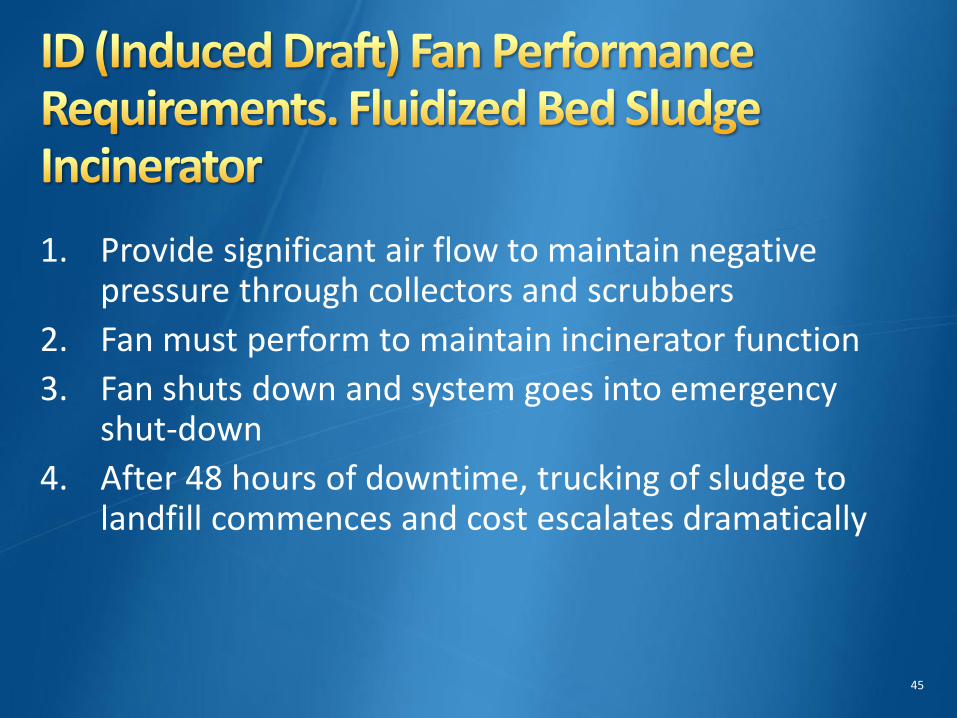
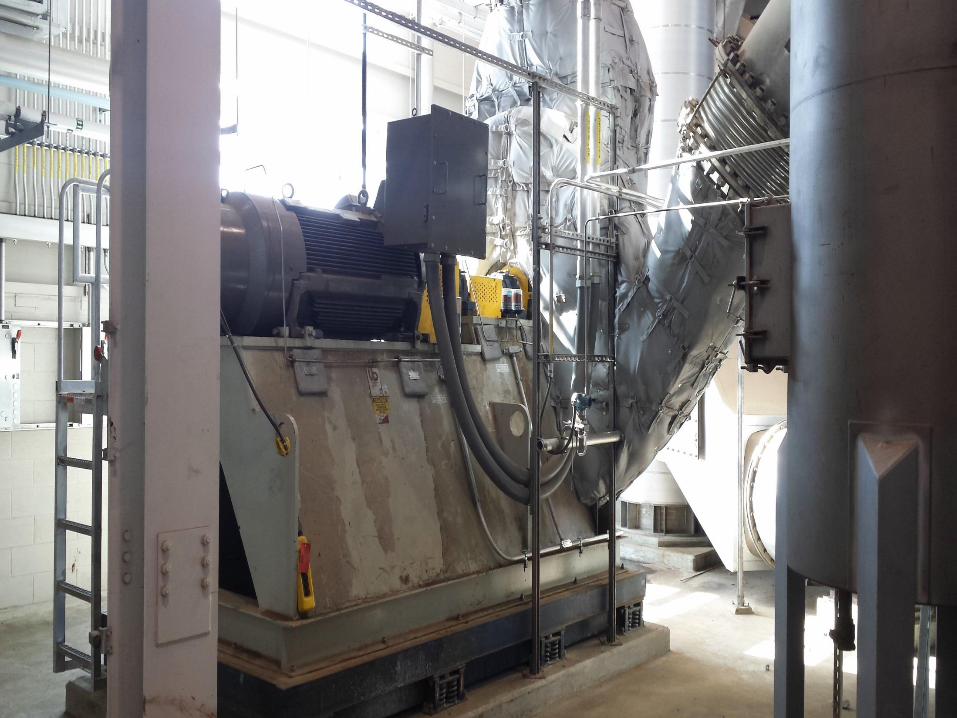
1. Provide significant air flow to maintain negative pressure through collectors and scrubbers
2. Fan must perform to maintain incinerator function
3. Fan shuts down and system goes into emergency shut-down
4. After 48 hours of downtime, trucking of sludge to landfill commences and cost escalates dramatically
45
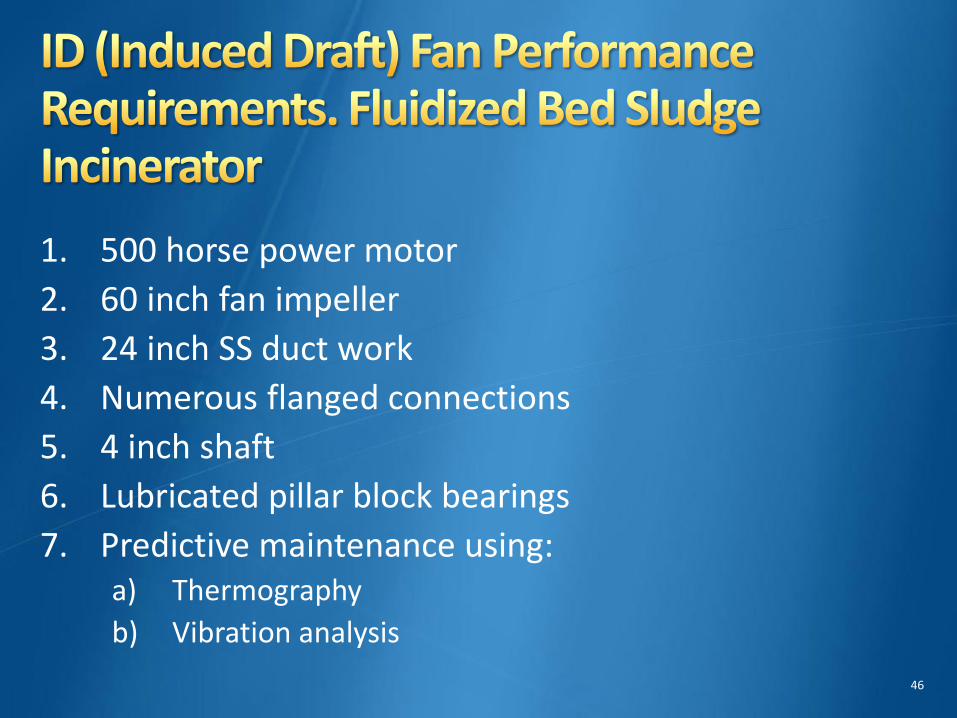
1. 500 horse power motor
2. 60 inch fan impeller
3. 24 inch SS duct work
4. Numerous flanged connections
5. 4 inch shaft
6. Lubricated pillar block bearings
7. Predictive maintenance using: a) Thermography
b) Vibration analysis
46
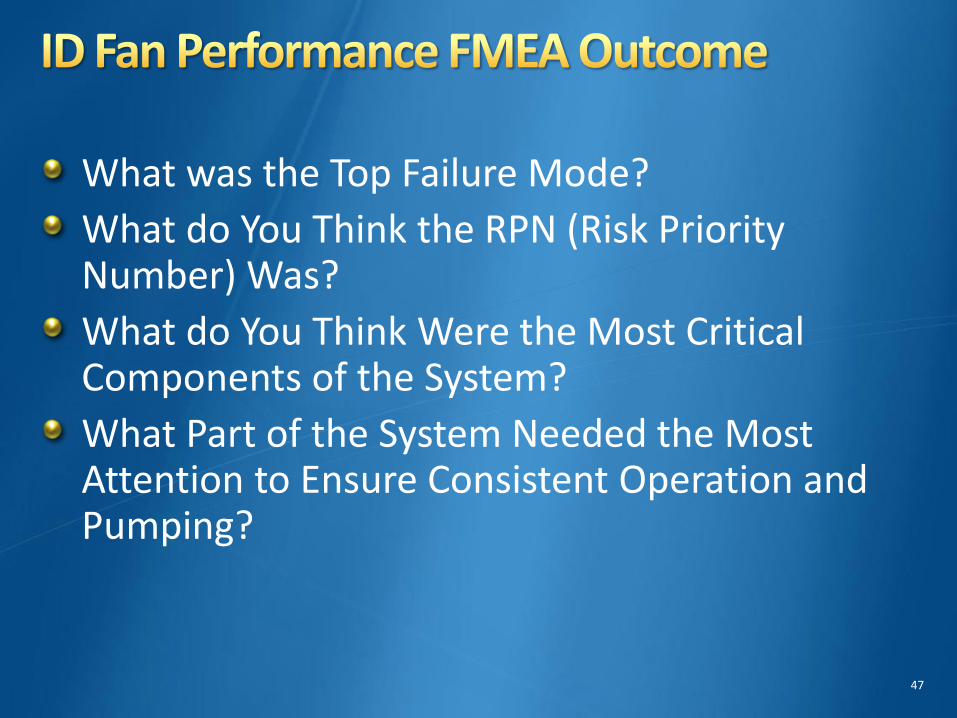
What was the Top Failure Mode?
What do You Think the RPN (Risk Priority Number) Was?
What do You Think Were the Most Critical Components of the System?
What Part of the System Needed the Most Attention to Ensure Consistent Operation and Pumping?
47
48

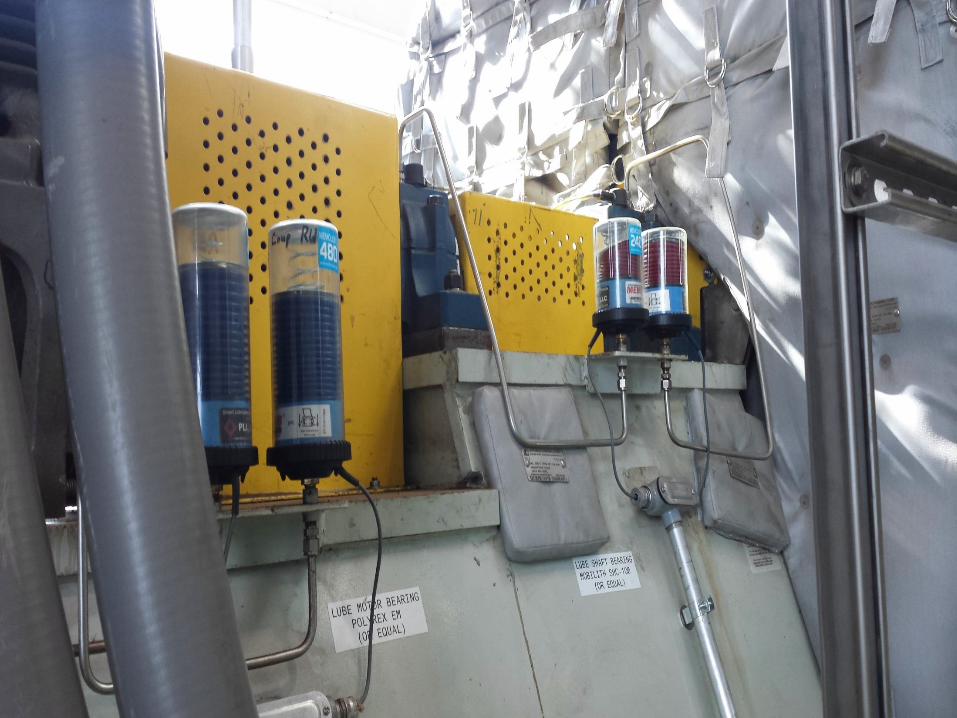
Answer:
The batteries powering the automatic bearing lubricators
and
Fasteners on flanges and motor base housing
49

#2037
50
PricewaterhouseCoopers
Ernst & Young
The Basics of FMEA, 2nd edition Robin E. McDermott
Raymond J. Mikulak
Michael R. Beauregard
51
Chris McCollin, Working Around Failure, Manufacturing Engineer, February 1999
Robin E. McDermott, Raymond J. Mikulak, and Michael R. Beauregard, The Basics of FMEA, New York: Productivity, Inc., 1996
DH. Stamatis, Failure Mode and Effect Analysis: FMEA from Theory to Execution, Milwaukee: American Society for Quality Control; 1995
Barrie G. Dale (ed.), Managing Quality, Prentice Hall, Hemel Hempstead, 1994
W. Grant Ireson and Clyde F. Coombs, Jr., Handbook of Reliability Engineering and Management, McGraw-Hill, NY, 1995
Joseph M. Juran and Godfrey, A. Blanton, editors, Juran's Quality Handbook: The Complete Guide to Performance Excellence, New York: McGraw-Hill, 2010
Van den brande, Willy W., How to Use FMEA to Reduce the Size of Your Quality Toolbox, Quality Progress, 31 (11), November 1998
52
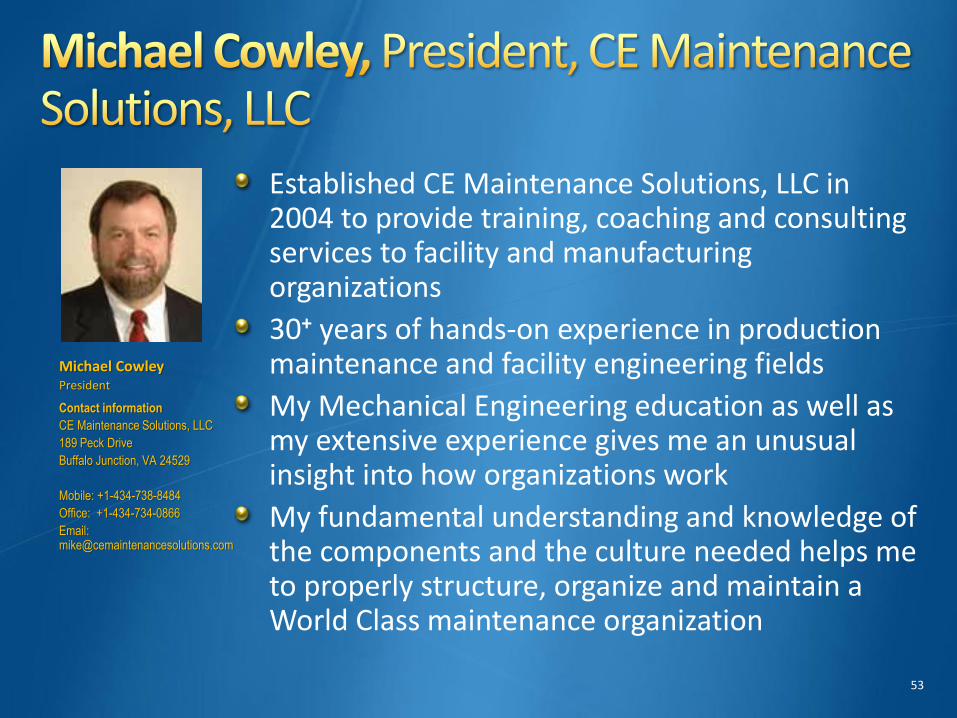
Michael Cowley President
Contact information
CE Maintenance Solutions, LLC
189 Peck Drive
Buffalo Junction, VA 24529
Mobile: +1-434-738-8484
Office: +1-434-734-0866
Email: [email protected]
Established CE Maintenance Solutions, LLC in 2004 to provide training, coaching and consulting services to facility and manufacturing organizations
30+ years of hands-on experience in production maintenance and facility engineering fields
My Mechanical Engineering education as well as my extensive experience gives me an unusual insight into how organizations work
My fundamental understanding and knowledge of the components and the culture needed helps me to properly structure, organize and maintain a World Class maintenance organization
53
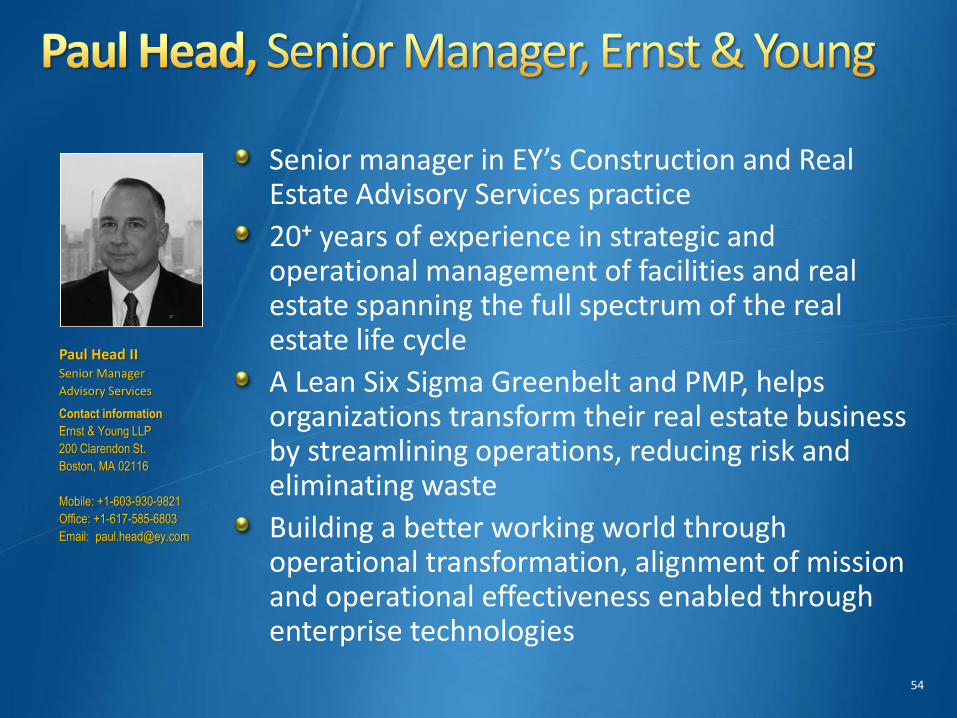
Paul Head II Senior Manager
Advisory Services
Contact information
Ernst & Young LLP
200 Clarendon St.
Boston, MA 02116
Mobile: +1-603-930-9821
Office: +1-617-585-6803
Email: [email protected]
Senior manager in EY’s Construction and Real Estate Advisory Services practice
20+ years of experience in strategic and operational management of facilities and real estate spanning the full spectrum of the real estate life cycle
A Lean Six Sigma Greenbelt and PMP, helps organizations transform their real estate business by streamlining operations, reducing risk and eliminating waste
Building a better working world through operational transformation, alignment of mission and operational effectiveness enabled through enterprise technologies
54