Embed Size (px)
Citation preview
Journal ofMaterials Chemistry A
PAPER
Publ
ishe
d on
15
Sept
embe
r 20
14. D
ownl
oade
d by
Uni
vers
ity o
f V
erm
ont o
n 06
/11/
2014
09:
34:0
6.
View Article OnlineView Journal | View Issue
Understanding th
aNanomaterials Centre, School of Chemic
Bioengineering and Nanotechnology, The U
4072, Australia. E-mail: [email protected] Engineering, The University of QucCentre for Microscopy and Microanalysis,
QLD 4072, Australia
† Electronic supplementary informa10.1039/c4ta03692a
Cite this: J. Mater. Chem. A, 2014, 2,18767
Received 18th July 2014Accepted 15th September 2014
DOI: 10.1039/c4ta03692a
www.rsc.org/MaterialsA
This journal is © The Royal Society of C
e stepwise capacity increase ofhigh energy low-Co Li-rich cathode materials forlithium ion batteries†
Delai Ye,a Bei Wang,a Yu Chen,a Guang Han,b Zhi Zhang,b Denisa Hulicova-Jurcakova,a Jin Zoubc and Lianzhou Wang*a
Li-rich layered materials as promising high-energy cathode candidates have attracted much attention in
recent years for next generation lithium ion batteries. However, the fundamental mechanism of high
specific capacity in these cathode materials has not been fully revealed so far. In this work, we report a
new class of Li-rich cathode materials Li[CoxLi1/3�x/3Mn2/3�2x/3]O2 (x ¼ 0.087, 0.1, and 0.118) with a very
low level of Co doping, which exhibit impressive stepwise capacity increase over dozens of cycles from
less than 50 mA h g�1 to around 250 mA h g�1. A systematic study on their composition, crystal
structure and electrochemical performance revealed that the small change of Co content has negligible
effect on the crystal structure and morphology, but plays an important role in enhancing the activation
rate of the Li2MnO3 phase. In addition, the optimized cycling potential window and current rate were
proven to be critically important for effective Li2MnO3 activation and better long-term cycling stability.
Introduction
Lithium ion batteries (LIBs) have become the dominant powersource for portable electronic devices in recent years due totheir high energy densities.1,2 The massive consumption offossil fuels and the corresponding derived environmentalproblems have triggered the rapid development of electricvehicles, which are highly dependent on large-scale applica-tions of high performance LIBs.3 Currently, a large number ofnew anode materials have been developed with concurrentsuperior high specic capacity of up to 1000 mA h g�1 and goodpower density;4–7 however, the specic capacities of the majorcathode materials such as LiCoO2, LiFePO4 and LiMn2O4 arestill too low (less than 170 mA h g�1) to match the anode side.8
Therefore, the search for new cathode materials with highcapacity is critical for the future development of LIBs and evenfor the electric vehicle industry.
Li-richMn-based layered compounds are a new series of highenergy cathode materials that have attracted signicant recentattention. Generally, they are composed of two highly integratedlayered phases and can be formulated as xLi2MnO3$(1 � x)
al Engineering, Australian Institute of
niversity of Queensland, Brisbane, QLD
eensland, Brisbane, QLD 4072, Australia
The University of Queensland, Brisbane,
tion (ESI) available. See DOI:
hemistry 2014
LiMO2 (0 < x < 1, M ¼ Mn, Co, Ni or their mixture).9,10 Typically,the Li-rich Li2MnO3 phase can be activated at a high chargingvoltage above 4.5 V. During the activation process, the oxygenions of the crystal lattice will be extracted in the form of oxygenwith concurrent deintercalation of Li+ from the transition metal(TM) layers and diffusion of TM ions to the Li layers. The acti-vation of the Li2MnO3 phase has been demonstrated to provideextra specic capacity to the Li-rich cathode materials, whichmight deliver a specic capacity of over 250 mA h g�1 at roomtemperature.11,12 However, there are still a few serious chal-lenging issues that Li-rich cathode materials have to addressbefore practical applications including the low initial columbicefficiency, poor cycling stability, low rate capability and longterm working voltage decline.13 To solve these problems, it isessential to fundamentally understand the lithium storagemechanisms and the origin of these problems from the aspectsof chemical compositions and crystal structures.14 Most Li-richcathode materials in the Li–Mn–Co–O system have beenreported with a Co/Mn mole ratio equal or more than 1/3 whilethe materials with a Co/Mn ratio less than 1/3 are rarely inves-tigated.15–17 In fact, it would be of advantage if the Co content inLi-rich cathodematerials can be signicantly reduced due to thehigh cost and toxicity of Co. In this regard, we have studied aseries of Li-rich Co-doped materials recently with a furtherreduced Co/Mnmole ratios down to 1/6 and variable ratios of Li/(Mn + Co).18,19 It was found that the specic capacities of thesematerials increased upon cycling in the rst cycles and such asmall amount of Co doping can effectively promote the Li2MnO3
activation.
J. Mater. Chem. A, 2014, 2, 18767–18774 | 18767
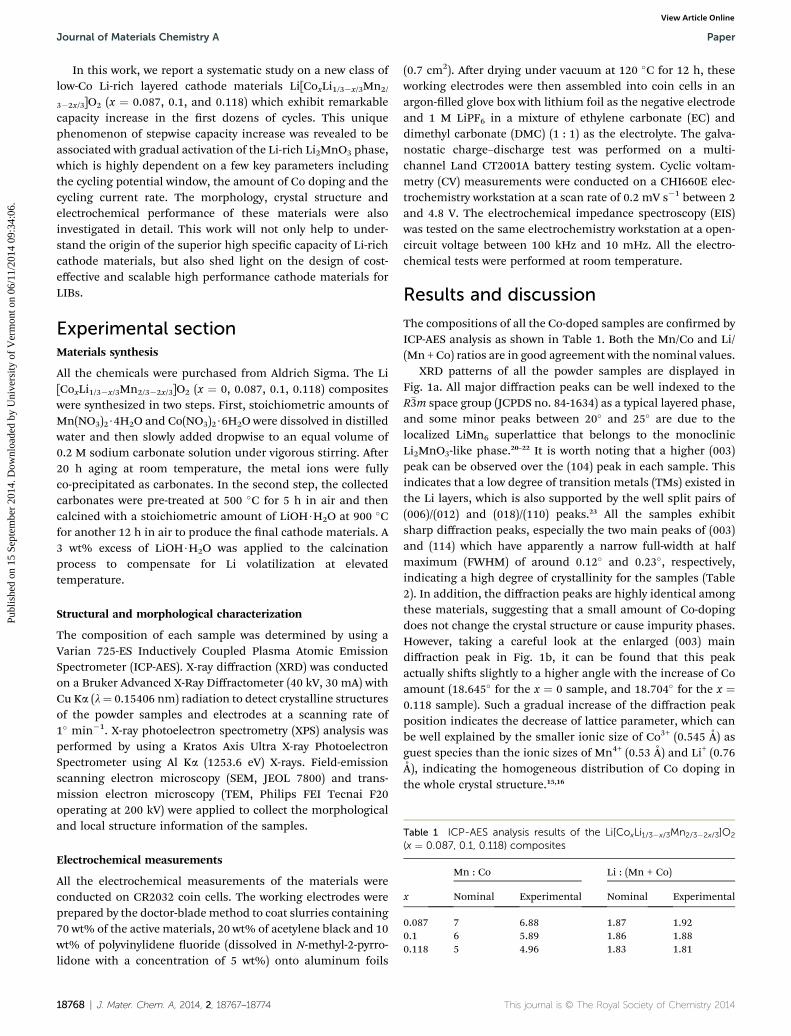
Table 1 ICP-AES analysis results of the Li[CoxLi1/3�x/3Mn2/3�2x/3]O2
(x ¼ 0.087, 0.1, 0.118) composites
x
Mn : Co Li : (Mn + Co)
Nominal Experimental Nominal Experimental
0.087 7 6.88 1.87 1.920.1 6 5.89 1.86 1.880.118 5 4.96 1.83 1.81
Journal of Materials Chemistry A Paper
Publ
ishe
d on
15
Sept
embe
r 20
14. D
ownl
oade
d by
Uni
vers
ity o
f V
erm
ont o
n 06
/11/
2014
09:
34:0
6.
View Article Online
In this work, we report a systematic study on a new class oflow-Co Li-rich layered cathode materials Li[CoxLi1/3�x/3Mn2/
3�2x/3]O2 (x ¼ 0.087, 0.1, and 0.118) which exhibit remarkablecapacity increase in the rst dozens of cycles. This uniquephenomenon of stepwise capacity increase was revealed to beassociated with gradual activation of the Li-rich Li2MnO3 phase,which is highly dependent on a few key parameters includingthe cycling potential window, the amount of Co doping and thecycling current rate. The morphology, crystal structure andelectrochemical performance of these materials were alsoinvestigated in detail. This work will not only help to under-stand the origin of the superior high specic capacity of Li-richcathode materials, but also shed light on the design of cost-effective and scalable high performance cathode materials forLIBs.
Experimental sectionMaterials synthesis
All the chemicals were purchased from Aldrich Sigma. The Li[CoxLi1/3�x/3Mn2/3�2x/3]O2 (x ¼ 0, 0.087, 0.1, 0.118) compositeswere synthesized in two steps. First, stoichiometric amounts ofMn(NO3)2$4H2O and Co(NO3)2$6H2O were dissolved in distilledwater and then slowly added dropwise to an equal volume of0.2 M sodium carbonate solution under vigorous stirring. Aer20 h aging at room temperature, the metal ions were fullyco-precipitated as carbonates. In the second step, the collectedcarbonates were pre-treated at 500 �C for 5 h in air and thencalcined with a stoichiometric amount of LiOH$H2O at 900 �Cfor another 12 h in air to produce the nal cathode materials. A3 wt% excess of LiOH$H2O was applied to the calcinationprocess to compensate for Li volatilization at elevatedtemperature.
Structural and morphological characterization
The composition of each sample was determined by using aVarian 725-ES Inductively Coupled Plasma Atomic EmissionSpectrometer (ICP-AES). X-ray diffraction (XRD) was conductedon a Bruker Advanced X-Ray Diffractometer (40 kV, 30 mA) withCu Ka (l¼ 0.15406 nm) radiation to detect crystalline structuresof the powder samples and electrodes at a scanning rate of1� min�1. X-ray photoelectron spectrometry (XPS) analysis wasperformed by using a Kratos Axis Ultra X-ray PhotoelectronSpectrometer using Al Ka (1253.6 eV) X-rays. Field-emissionscanning electron microscopy (SEM, JEOL 7800) and trans-mission electron microscopy (TEM, Philips FEI Tecnai F20operating at 200 kV) were applied to collect the morphologicaland local structure information of the samples.
Electrochemical measurements
All the electrochemical measurements of the materials wereconducted on CR2032 coin cells. The working electrodes wereprepared by the doctor-blade method to coat slurries containing70 wt% of the active materials, 20 wt% of acetylene black and 10wt% of polyvinylidene uoride (dissolved in N-methyl-2-pyrro-lidone with a concentration of 5 wt%) onto aluminum foils
18768 | J. Mater. Chem. A, 2014, 2, 18767–18774
(0.7 cm2). Aer drying under vacuum at 120 �C for 12 h, theseworking electrodes were then assembled into coin cells in anargon-lled glove box with lithium foil as the negative electrodeand 1 M LiPF6 in a mixture of ethylene carbonate (EC) anddimethyl carbonate (DMC) (1 : 1) as the electrolyte. The galva-nostatic charge–discharge test was performed on a multi-channel Land CT2001A battery testing system. Cyclic voltam-metry (CV) measurements were conducted on a CHI660E elec-trochemistry workstation at a scan rate of 0.2 mV s�1 between 2and 4.8 V. The electrochemical impedance spectroscopy (EIS)was tested on the same electrochemistry workstation at a open-circuit voltage between 100 kHz and 10 mHz. All the electro-chemical tests were performed at room temperature.
Results and discussion
The compositions of all the Co-doped samples are conrmed byICP-AES analysis as shown in Table 1. Both the Mn/Co and Li/(Mn + Co) ratios are in good agreement with the nominal values.
XRD patterns of all the powder samples are displayed inFig. 1a. All major diffraction peaks can be well indexed to theR�3m space group (JCPDS no. 84-1634) as a typical layered phase,and some minor peaks between 20� and 25� are due to thelocalized LiMn6 superlattice that belongs to the monoclinicLi2MnO3-like phase.20–22 It is worth noting that a higher (003)peak can be observed over the (104) peak in each sample. Thisindicates that a low degree of transition metals (TMs) existed inthe Li layers, which is also supported by the well split pairs of(006)/(012) and (018)/(110) peaks.23 All the samples exhibitsharp diffraction peaks, especially the two main peaks of (003)and (114) which have apparently a narrow full-width at halfmaximum (FWHM) of around 0.12� and 0.23�, respectively,indicating a high degree of crystallinity for the samples (Table2). In addition, the diffraction peaks are highly identical amongthese materials, suggesting that a small amount of Co-dopingdoes not change the crystal structure or cause impurity phases.However, taking a careful look at the enlarged (003) maindiffraction peak in Fig. 1b, it can be found that this peakactually shis slightly to a higher angle with the increase of Coamount (18.645� for the x ¼ 0 sample, and 18.704� for the x ¼0.118 sample). Such a gradual increase of the diffraction peakposition indicates the decrease of lattice parameter, which canbe well explained by the smaller ionic size of Co3+ (0.545 A) asguest species than the ionic sizes of Mn4+ (0.53 A) and Li+ (0.76A), indicating the homogeneous distribution of Co doping inthe whole crystal structure.15,16
This journal is © The Royal Society of Chemistry 2014
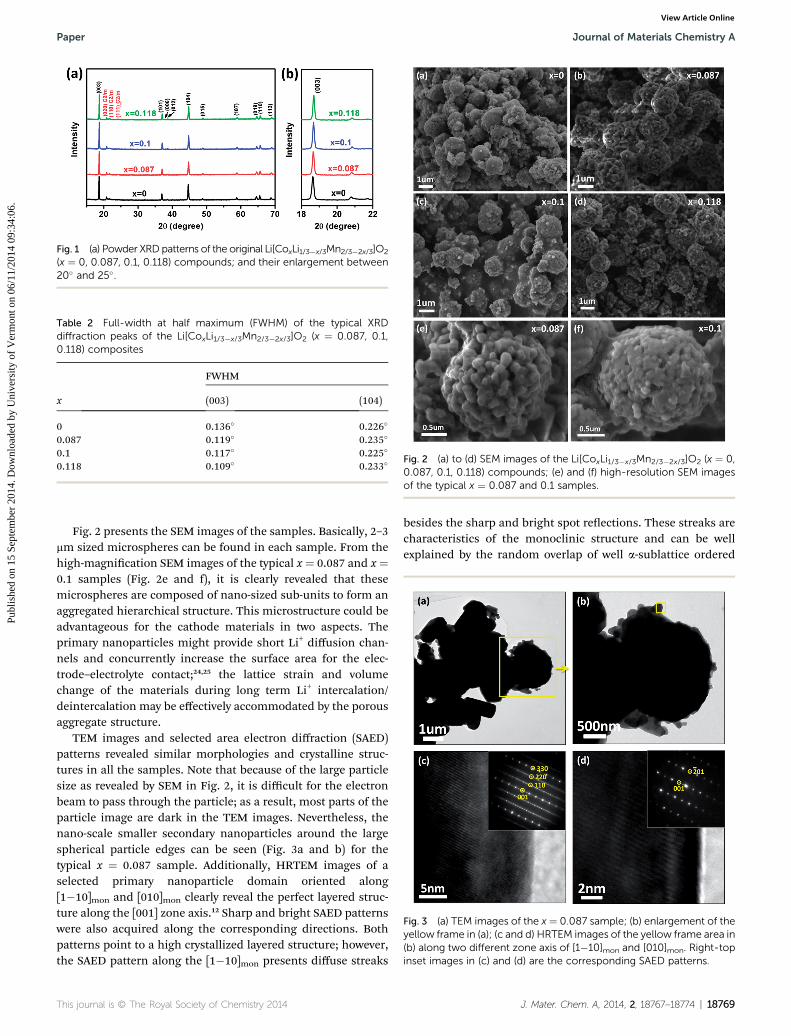
Fig. 1 (a) Powder XRDpatterns of the original Li[CoxLi1/3�x/3Mn2/3�2x/3]O2
(x ¼ 0, 0.087, 0.1, 0.118) compounds; and their enlargement between20� and 25�.
Table 2 Full-width at half maximum (FWHM) of the typical XRDdiffraction peaks of the Li[CoxLi1/3�x/3Mn2/3�2x/3]O2 (x ¼ 0.087, 0.1,0.118) composites
x
FWHM
(003) (104)
0 0.136� 0.226�
0.087 0.119� 0.235�
0.1 0.117� 0.225�
0.118 0.109� 0.233�Fig. 2 (a) to (d) SEM images of the Li[CoxLi1/3�x/3Mn2/3�2x/3]O2 (x ¼ 0,0.087, 0.1, 0.118) compounds; (e) and (f) high-resolution SEM imagesof the typical x ¼ 0.087 and 0.1 samples.
Fig. 3 (a) TEM images of the x ¼ 0.087 sample; (b) enlargement of theyellow frame in (a); (c and d) HRTEM images of the yellow frame area in(b) along two different zone axis of [1�10]mon and [010]mon. Right-topinset images in (c) and (d) are the corresponding SAED patterns.
Paper Journal of Materials Chemistry A
Publ
ishe
d on
15
Sept
embe
r 20
14. D
ownl
oade
d by
Uni
vers
ity o
f V
erm
ont o
n 06
/11/
2014
09:
34:0
6.
View Article Online
Fig. 2 presents the SEM images of the samples. Basically, 2–3mm sized microspheres can be found in each sample. From thehigh-magnication SEM images of the typical x¼ 0.087 and x¼0.1 samples (Fig. 2e and f), it is clearly revealed that thesemicrospheres are composed of nano-sized sub-units to form anaggregated hierarchical structure. This microstructure could beadvantageous for the cathode materials in two aspects. Theprimary nanoparticles might provide short Li+ diffusion chan-nels and concurrently increase the surface area for the elec-trode–electrolyte contact;24,25 the lattice strain and volumechange of the materials during long term Li+ intercalation/deintercalation may be effectively accommodated by the porousaggregate structure.
TEM images and selected area electron diffraction (SAED)patterns revealed similar morphologies and crystalline struc-tures in all the samples. Note that because of the large particlesize as revealed by SEM in Fig. 2, it is difficult for the electronbeam to pass through the particle; as a result, most parts of theparticle image are dark in the TEM images. Nevertheless, thenano-scale smaller secondary nanoparticles around the largespherical particle edges can be seen (Fig. 3a and b) for thetypical x ¼ 0.087 sample. Additionally, HRTEM images of aselected primary nanoparticle domain oriented along[1�10]mon and [010]mon clearly reveal the perfect layered struc-ture along the [001] zone axis.12 Sharp and bright SAED patternswere also acquired along the corresponding directions. Bothpatterns point to a high crystallized layered structure; however,the SAED pattern along the [1�10]mon presents diffuse streaks
This journal is © The Royal Society of Chemistry 2014
besides the sharp and bright spot reections. These streaks arecharacteristics of the monoclinic structure and can be wellexplained by the random overlap of well a-sublattice ordered
J. Mater. Chem. A, 2014, 2, 18767–18774 | 18769
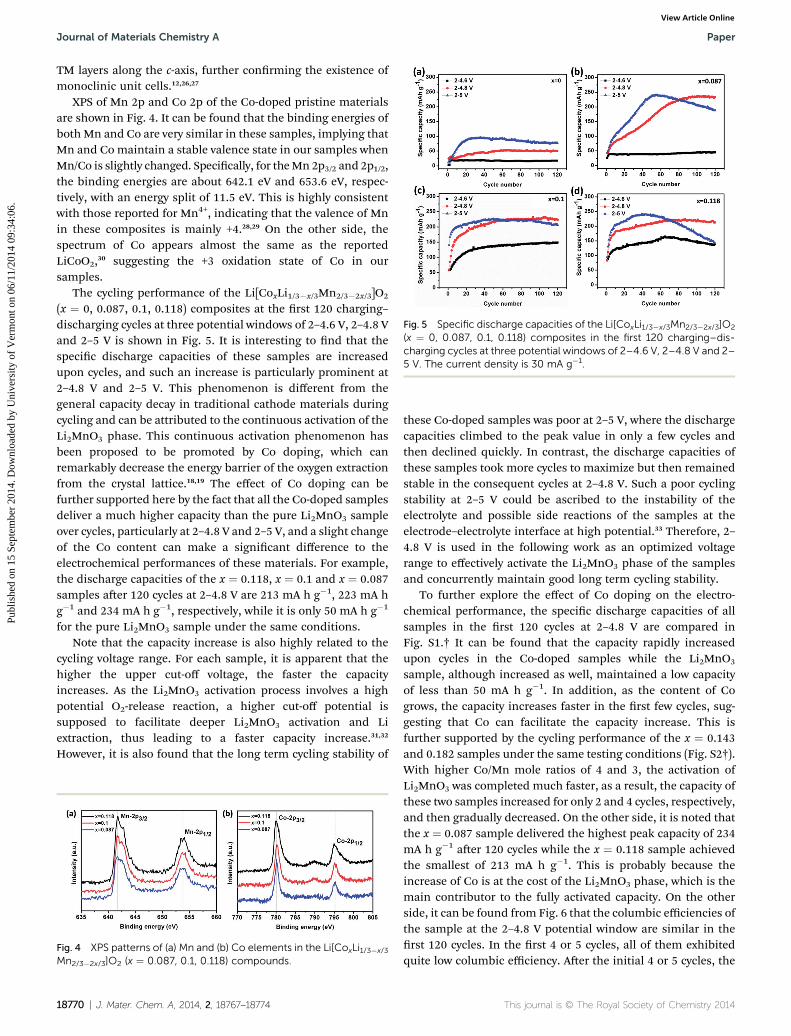
Fig. 5 Specific discharge capacities of the Li[CoxLi1/3�x/3Mn2/3�2x/3]O2
(x ¼ 0, 0.087, 0.1, 0.118) composites in the first 120 charging–dis-charging cycles at three potential windows of 2–4.6 V, 2–4.8 V and 2–5 V. The current density is 30 mA g�1.
Journal of Materials Chemistry A Paper
Publ
ishe
d on
15
Sept
embe
r 20
14. D
ownl
oade
d by
Uni
vers
ity o
f V
erm
ont o
n 06
/11/
2014
09:
34:0
6.
View Article Online
TM layers along the c-axis, further conrming the existence ofmonoclinic unit cells.12,26,27
XPS of Mn 2p and Co 2p of the Co-doped pristine materialsare shown in Fig. 4. It can be found that the binding energies ofboth Mn and Co are very similar in these samples, implying thatMn and Co maintain a stable valence state in our samples whenMn/Co is slightly changed. Specically, for theMn 2p3/2 and 2p1/2,the binding energies are about 642.1 eV and 653.6 eV, respec-tively, with an energy split of 11.5 eV. This is highly consistentwith those reported for Mn4+, indicating that the valence of Mnin these composites is mainly +4.28,29 On the other side, thespectrum of Co appears almost the same as the reportedLiCoO2,30 suggesting the +3 oxidation state of Co in oursamples.
The cycling performance of the Li[CoxLi1/3�x/3Mn2/3�2x/3]O2
(x ¼ 0, 0.087, 0.1, 0.118) composites at the rst 120 charging–discharging cycles at three potential windows of 2–4.6 V, 2–4.8 Vand 2–5 V is shown in Fig. 5. It is interesting to nd that thespecic discharge capacities of these samples are increasedupon cycles, and such an increase is particularly prominent at2–4.8 V and 2–5 V. This phenomenon is different from thegeneral capacity decay in traditional cathode materials duringcycling and can be attributed to the continuous activation of theLi2MnO3 phase. This continuous activation phenomenon hasbeen proposed to be promoted by Co doping, which canremarkably decrease the energy barrier of the oxygen extractionfrom the crystal lattice.18,19 The effect of Co doping can befurther supported here by the fact that all the Co-doped samplesdeliver a much higher capacity than the pure Li2MnO3 sampleover cycles, particularly at 2–4.8 V and 2–5 V, and a slight changeof the Co content can make a signicant difference to theelectrochemical performances of these materials. For example,the discharge capacities of the x ¼ 0.118, x ¼ 0.1 and x ¼ 0.087samples aer 120 cycles at 2–4.8 V are 213 mA h g�1, 223 mA hg�1 and 234 mA h g�1, respectively, while it is only 50 mA h g�1
for the pure Li2MnO3 sample under the same conditions.Note that the capacity increase is also highly related to the
cycling voltage range. For each sample, it is apparent that thehigher the upper cut-off voltage, the faster the capacityincreases. As the Li2MnO3 activation process involves a highpotential O2-release reaction, a higher cut-off potential issupposed to facilitate deeper Li2MnO3 activation and Liextraction, thus leading to a faster capacity increase.31,32
However, it is also found that the long term cycling stability of
Fig. 4 XPS patterns of (a) Mn and (b) Co elements in the Li[CoxLi1/3�x/3
Mn2/3�2x/3]O2 (x ¼ 0.087, 0.1, 0.118) compounds.
18770 | J. Mater. Chem. A, 2014, 2, 18767–18774
these Co-doped samples was poor at 2–5 V, where the dischargecapacities climbed to the peak value in only a few cycles andthen declined quickly. In contrast, the discharge capacities ofthese samples took more cycles to maximize but then remainedstable in the consequent cycles at 2–4.8 V. Such a poor cyclingstability at 2–5 V could be ascribed to the instability of theelectrolyte and possible side reactions of the samples at theelectrode–electrolyte interface at high potential.33 Therefore, 2–4.8 V is used in the following work as an optimized voltagerange to effectively activate the Li2MnO3 phase of the samplesand concurrently maintain good long term cycling stability.
To further explore the effect of Co doping on the electro-chemical performance, the specic discharge capacities of allsamples in the rst 120 cycles at 2–4.8 V are compared inFig. S1.† It can be found that the capacity rapidly increasedupon cycles in the Co-doped samples while the Li2MnO3
sample, although increased as well, maintained a low capacityof less than 50 mA h g�1. In addition, as the content of Cogrows, the capacity increases faster in the rst few cycles, sug-gesting that Co can facilitate the capacity increase. This isfurther supported by the cycling performance of the x ¼ 0.143and 0.182 samples under the same testing conditions (Fig. S2†).With higher Co/Mn mole ratios of 4 and 3, the activation ofLi2MnO3 was completed much faster, as a result, the capacity ofthese two samples increased for only 2 and 4 cycles, respectively,and then gradually decreased. On the other side, it is noted thatthe x ¼ 0.087 sample delivered the highest peak capacity of 234mA h g�1 aer 120 cycles while the x ¼ 0.118 sample achievedthe smallest of 213 mA h g�1. This is probably because theincrease of Co is at the cost of the Li2MnO3 phase, which is themain contributor to the fully activated capacity. On the otherside, it can be found from Fig. 6 that the columbic efficiencies ofthe sample at the 2–4.8 V potential window are similar in therst 120 cycles. In the rst 4 or 5 cycles, all of them exhibitedquite low columbic efficiency. Aer the initial 4 or 5 cycles, the
This journal is © The Royal Society of Chemistry 2014
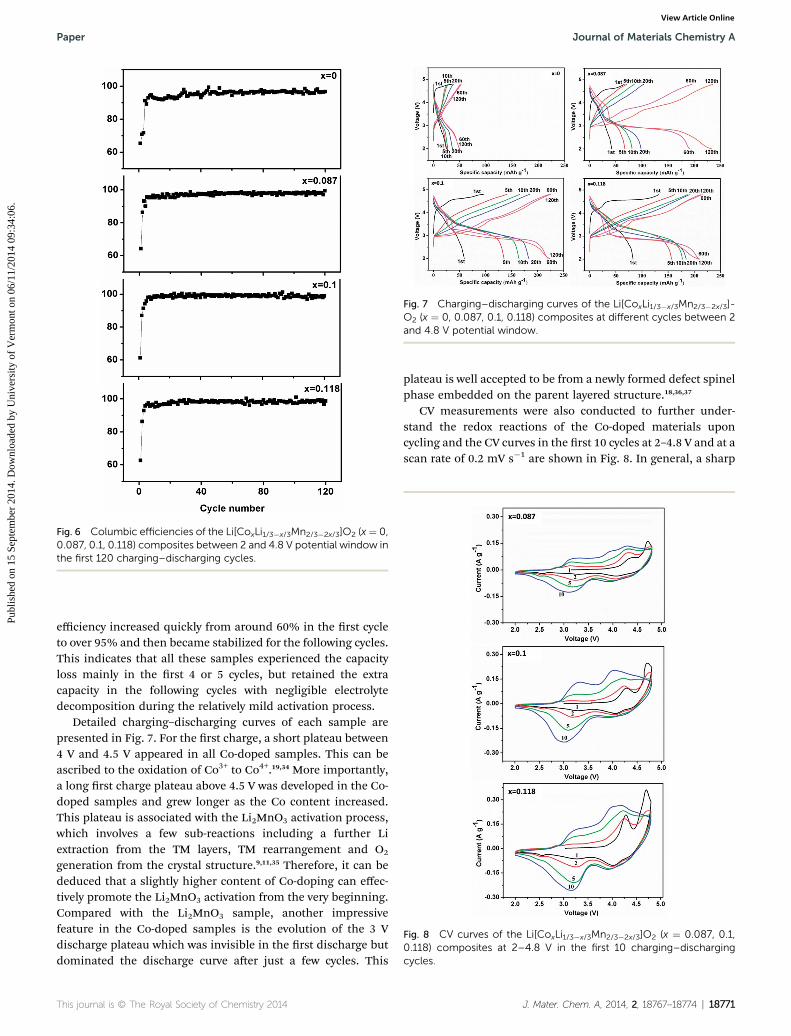
Fig. 6 Columbic efficiencies of the Li[CoxLi1/3�x/3Mn2/3�2x/3]O2 (x¼ 0,0.087, 0.1, 0.118) composites between 2 and 4.8 V potential window inthe first 120 charging–discharging cycles.
Fig. 7 Charging–discharging curves of the Li[CoxLi1/3�x/3Mn2/3�2x/3]-O2 (x ¼ 0, 0.087, 0.1, 0.118) composites at different cycles between 2and 4.8 V potential window.
Fig. 8 CV curves of the Li[CoxLi1/3�x/3Mn2/3�2x/3]O2 (x ¼ 0.087, 0.1,0.118) composites at 2–4.8 V in the first 10 charging–dischargingcycles.
Paper Journal of Materials Chemistry A
Publ
ishe
d on
15
Sept
embe
r 20
14. D
ownl
oade
d by
Uni
vers
ity o
f V
erm
ont o
n 06
/11/
2014
09:
34:0
6.
View Article Online
efficiency increased quickly from around 60% in the rst cycleto over 95% and then became stabilized for the following cycles.This indicates that all these samples experienced the capacityloss mainly in the rst 4 or 5 cycles, but retained the extracapacity in the following cycles with negligible electrolytedecomposition during the relatively mild activation process.
Detailed charging–discharging curves of each sample arepresented in Fig. 7. For the rst charge, a short plateau between4 V and 4.5 V appeared in all Co-doped samples. This can beascribed to the oxidation of Co3+ to Co4+.19,34 More importantly,a long rst charge plateau above 4.5 V was developed in the Co-doped samples and grew longer as the Co content increased.This plateau is associated with the Li2MnO3 activation process,which involves a few sub-reactions including a further Liextraction from the TM layers, TM rearrangement and O2
generation from the crystal structure.9,11,35 Therefore, it can bededuced that a slightly higher content of Co-doping can effec-tively promote the Li2MnO3 activation from the very beginning.Compared with the Li2MnO3 sample, another impressivefeature in the Co-doped samples is the evolution of the 3 Vdischarge plateau which was invisible in the rst discharge butdominated the discharge curve aer just a few cycles. This
This journal is © The Royal Society of Chemistry 2014
plateau is well accepted to be from a newly formed defect spinelphase embedded on the parent layered structure.18,36,37
CV measurements were also conducted to further under-stand the redox reactions of the Co-doped materials uponcycling and the CV curves in the rst 10 cycles at 2–4.8 V and at ascan rate of 0.2 mV s�1 are shown in Fig. 8. In general, a sharp
J. Mater. Chem. A, 2014, 2, 18767–18774 | 18771
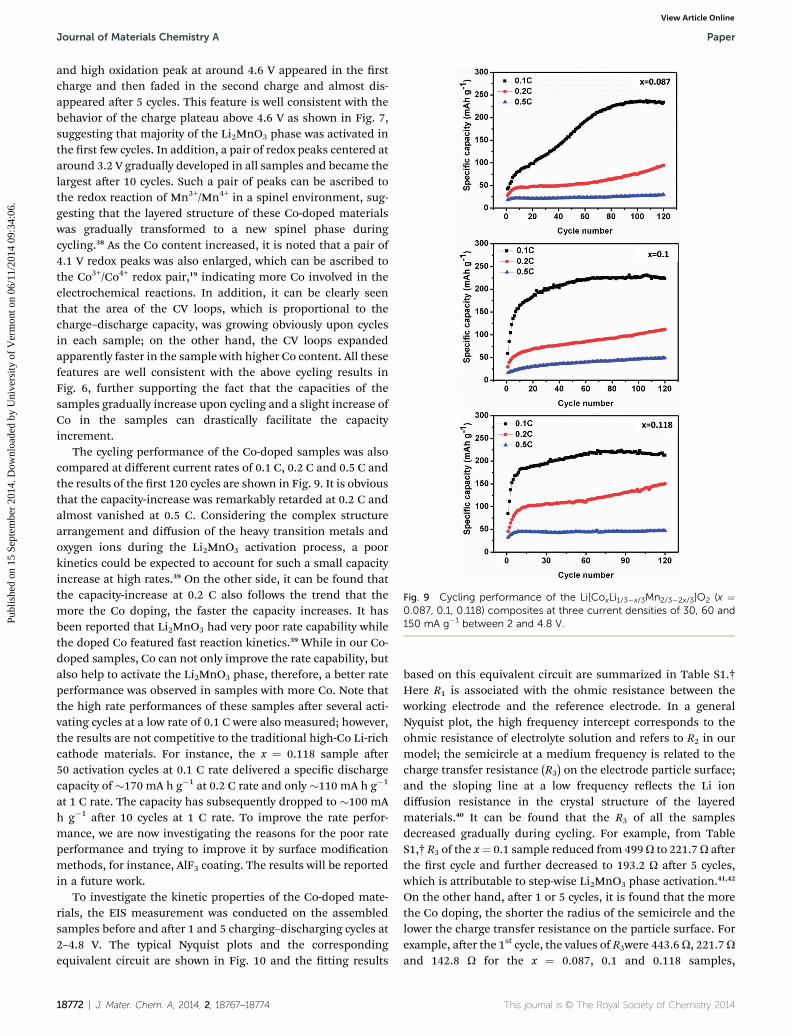
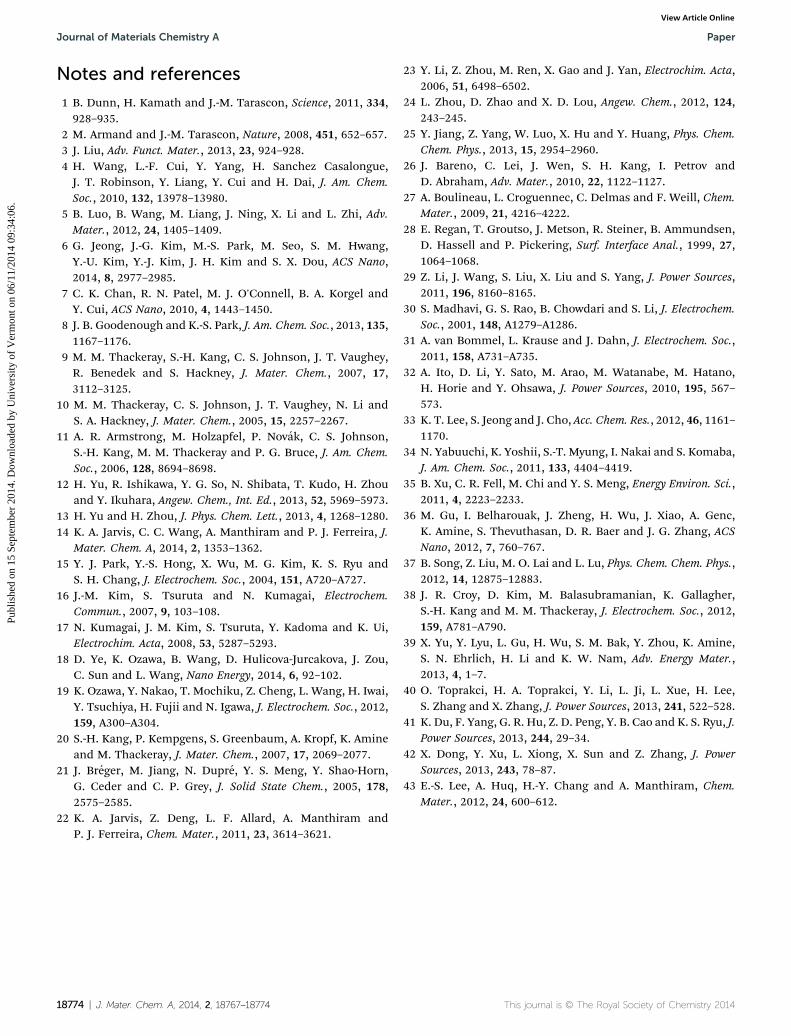
Fig. 9 Cycling performance of the Li[CoxLi1/3�x/3Mn2/3�2x/3]O2 (x ¼0.087, 0.1, 0.118) composites at three current densities of 30, 60 and150 mA g�1 between 2 and 4.8 V.
Journal of Materials Chemistry A Paper
Publ
ishe
d on
15
Sept
embe
r 20
14. D
ownl
oade
d by
Uni
vers
ity o
f V
erm
ont o
n 06
/11/
2014
09:
34:0
6.
View Article Online
and high oxidation peak at around 4.6 V appeared in the rstcharge and then faded in the second charge and almost dis-appeared aer 5 cycles. This feature is well consistent with thebehavior of the charge plateau above 4.6 V as shown in Fig. 7,suggesting that majority of the Li2MnO3 phase was activated inthe rst few cycles. In addition, a pair of redox peaks centered ataround 3.2 V gradually developed in all samples and became thelargest aer 10 cycles. Such a pair of peaks can be ascribed tothe redox reaction of Mn3+/Mn4+ in a spinel environment, sug-gesting that the layered structure of these Co-doped materialswas gradually transformed to a new spinel phase duringcycling.38 As the Co content increased, it is noted that a pair of4.1 V redox peaks was also enlarged, which can be ascribed tothe Co3+/Co4+ redox pair,19 indicating more Co involved in theelectrochemical reactions. In addition, it can be clearly seenthat the area of the CV loops, which is proportional to thecharge–discharge capacity, was growing obviously upon cyclesin each sample; on the other hand, the CV loops expandedapparently faster in the sample with higher Co content. All thesefeatures are well consistent with the above cycling results inFig. 6, further supporting the fact that the capacities of thesamples gradually increase upon cycling and a slight increase ofCo in the samples can drastically facilitate the capacityincrement.
The cycling performance of the Co-doped samples was alsocompared at different current rates of 0.1 C, 0.2 C and 0.5 C andthe results of the rst 120 cycles are shown in Fig. 9. It is obviousthat the capacity-increase was remarkably retarded at 0.2 C andalmost vanished at 0.5 C. Considering the complex structurearrangement and diffusion of the heavy transition metals andoxygen ions during the Li2MnO3 activation process, a poorkinetics could be expected to account for such a small capacityincrease at high rates.39 On the other side, it can be found thatthe capacity-increase at 0.2 C also follows the trend that themore the Co doping, the faster the capacity increases. It hasbeen reported that Li2MnO3 had very poor rate capability whilethe doped Co featured fast reaction kinetics.39 While in our Co-doped samples, Co can not only improve the rate capability, butalso help to activate the Li2MnO3 phase, therefore, a better rateperformance was observed in samples with more Co. Note thatthe high rate performances of these samples aer several acti-vating cycles at a low rate of 0.1 C were also measured; however,the results are not competitive to the traditional high-Co Li-richcathode materials. For instance, the x ¼ 0.118 sample aer50 activation cycles at 0.1 C rate delivered a specic dischargecapacity of �170 mA h g�1 at 0.2 C rate and only �110 mA h g�1
at 1 C rate. The capacity has subsequently dropped to �100 mAh g�1 aer 10 cycles at 1 C rate. To improve the rate perfor-mance, we are now investigating the reasons for the poor rateperformance and trying to improve it by surface modicationmethods, for instance, AlF3 coating. The results will be reportedin a future work.
To investigate the kinetic properties of the Co-doped mate-rials, the EIS measurement was conducted on the assembledsamples before and aer 1 and 5 charging–discharging cycles at2–4.8 V. The typical Nyquist plots and the correspondingequivalent circuit are shown in Fig. 10 and the tting results
18772 | J. Mater. Chem. A, 2014, 2, 18767–18774
based on this equivalent circuit are summarized in Table S1.†Here R1 is associated with the ohmic resistance between theworking electrode and the reference electrode. In a generalNyquist plot, the high frequency intercept corresponds to theohmic resistance of electrolyte solution and refers to R2 in ourmodel; the semicircle at a medium frequency is related to thecharge transfer resistance (R3) on the electrode particle surface;and the sloping line at a low frequency reects the Li iondiffusion resistance in the crystal structure of the layeredmaterials.40 It can be found that the R3 of all the samplesdecreased gradually during cycling. For example, from TableS1,† R3 of the x¼ 0.1 sample reduced from 499U to 221.7U aerthe rst cycle and further decreased to 193.2 U aer 5 cycles,which is attributable to step-wise Li2MnO3 phase activation.41,42
On the other hand, aer 1 or 5 cycles, it is found that the morethe Co doping, the shorter the radius of the semicircle and thelower the charge transfer resistance on the particle surface. Forexample, aer the 1st cycle, the values of R3were 443.6U, 221.7Uand 142.8 U for the x ¼ 0.087, 0.1 and 0.118 samples,
This journal is © The Royal Society of Chemistry 2014
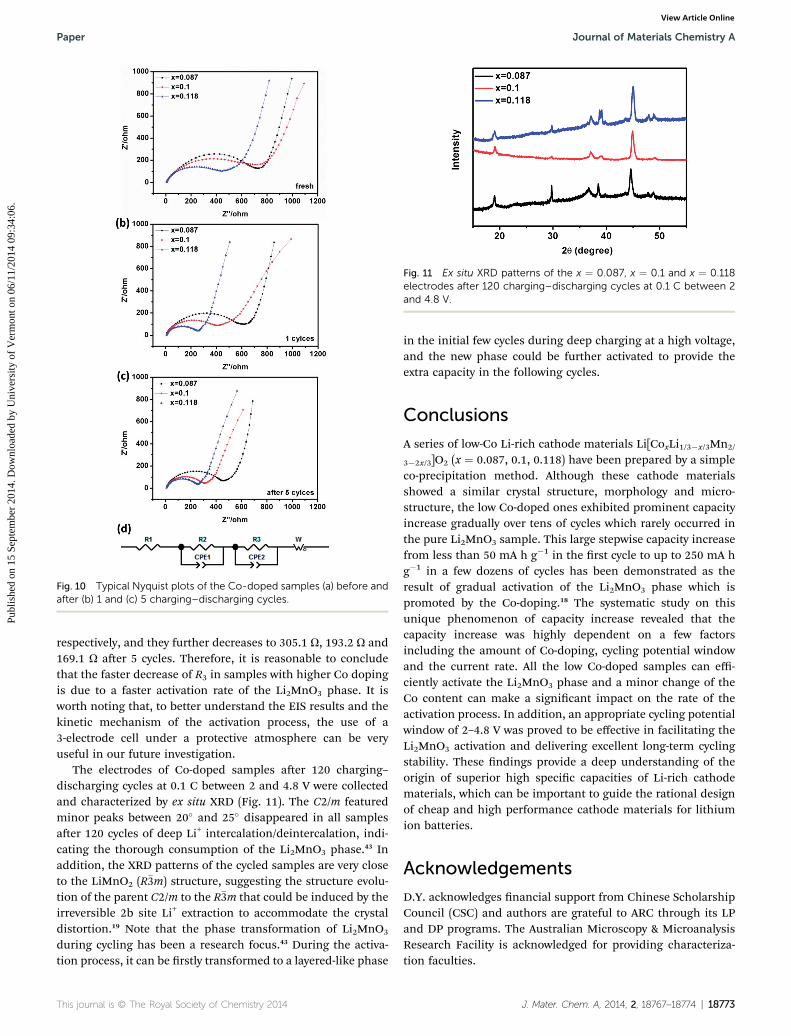
Fig. 10 Typical Nyquist plots of the Co-doped samples (a) before andafter (b) 1 and (c) 5 charging–discharging cycles.
Fig. 11 Ex situ XRD patterns of the x ¼ 0.087, x ¼ 0.1 and x ¼ 0.118electrodes after 120 charging–discharging cycles at 0.1 C between 2and 4.8 V.
Paper Journal of Materials Chemistry A
Publ
ishe
d on
15
Sept
embe
r 20
14. D
ownl
oade
d by
Uni
vers
ity o
f V
erm
ont o
n 06
/11/
2014
09:
34:0
6.
View Article Online
respectively, and they further decreases to 305.1 U, 193.2 U and169.1 U aer 5 cycles. Therefore, it is reasonable to concludethat the faster decrease of R3 in samples with higher Co dopingis due to a faster activation rate of the Li2MnO3 phase. It isworth noting that, to better understand the EIS results and thekinetic mechanism of the activation process, the use of a3-electrode cell under a protective atmosphere can be veryuseful in our future investigation.
The electrodes of Co-doped samples aer 120 charging–discharging cycles at 0.1 C between 2 and 4.8 V were collectedand characterized by ex situ XRD (Fig. 11). The C2/m featuredminor peaks between 20� and 25� disappeared in all samplesaer 120 cycles of deep Li+ intercalation/deintercalation, indi-cating the thorough consumption of the Li2MnO3 phase.43 Inaddition, the XRD patterns of the cycled samples are very closeto the LiMnO2 (R�3m) structure, suggesting the structure evolu-tion of the parent C2/m to the R�3m that could be induced by theirreversible 2b site Li+ extraction to accommodate the crystaldistortion.19 Note that the phase transformation of Li2MnO3
during cycling has been a research focus.43 During the activa-tion process, it can be rstly transformed to a layered-like phase
This journal is © The Royal Society of Chemistry 2014
in the initial few cycles during deep charging at a high voltage,and the new phase could be further activated to provide theextra capacity in the following cycles.
Conclusions
A series of low-Co Li-rich cathode materials Li[CoxLi1/3�x/3Mn2/
3�2x/3]O2 (x ¼ 0.087, 0.1, 0.118) have been prepared by a simpleco-precipitation method. Although these cathode materialsshowed a similar crystal structure, morphology and micro-structure, the low Co-doped ones exhibited prominent capacityincrease gradually over tens of cycles which rarely occurred inthe pure Li2MnO3 sample. This large stepwise capacity increasefrom less than 50 mA h g�1 in the rst cycle to up to 250 mA hg�1 in a few dozens of cycles has been demonstrated as theresult of gradual activation of the Li2MnO3 phase which ispromoted by the Co-doping.18 The systematic study on thisunique phenomenon of capacity increase revealed that thecapacity increase was highly dependent on a few factorsincluding the amount of Co-doping, cycling potential windowand the current rate. All the low Co-doped samples can effi-ciently activate the Li2MnO3 phase and a minor change of theCo content can make a signicant impact on the rate of theactivation process. In addition, an appropriate cycling potentialwindow of 2–4.8 V was proved to be effective in facilitating theLi2MnO3 activation and delivering excellent long-term cyclingstability. These ndings provide a deep understanding of theorigin of superior high specic capacities of Li-rich cathodematerials, which can be important to guide the rational designof cheap and high performance cathode materials for lithiumion batteries.
Acknowledgements
D.Y. acknowledges nancial support from Chinese ScholarshipCouncil (CSC) and authors are grateful to ARC through its LPand DP programs. The Australian Microscopy & MicroanalysisResearch Facility is acknowledged for providing characteriza-tion faculties.
J. Mater. Chem. A, 2014, 2, 18767–18774 | 18773
Journal of Materials Chemistry A Paper
Publ
ishe
d on
15
Sept
embe
r 20
14. D
ownl
oade
d by
Uni
vers
ity o
f V
erm
ont o
n 06
/11/
2014
09:
34:0
6.
View Article Online
Notes and references
1 B. Dunn, H. Kamath and J.-M. Tarascon, Science, 2011, 334,928–935.
2 M. Armand and J.-M. Tarascon, Nature, 2008, 451, 652–657.3 J. Liu, Adv. Funct. Mater., 2013, 23, 924–928.4 H. Wang, L.-F. Cui, Y. Yang, H. Sanchez Casalongue,J. T. Robinson, Y. Liang, Y. Cui and H. Dai, J. Am. Chem.Soc., 2010, 132, 13978–13980.
5 B. Luo, B. Wang, M. Liang, J. Ning, X. Li and L. Zhi, Adv.Mater., 2012, 24, 1405–1409.
6 G. Jeong, J.-G. Kim, M.-S. Park, M. Seo, S. M. Hwang,Y.-U. Kim, Y.-J. Kim, J. H. Kim and S. X. Dou, ACS Nano,2014, 8, 2977–2985.
7 C. K. Chan, R. N. Patel, M. J. O'Connell, B. A. Korgel andY. Cui, ACS Nano, 2010, 4, 1443–1450.
8 J. B. Goodenough and K.-S. Park, J. Am. Chem. Soc., 2013, 135,1167–1176.
9 M. M. Thackeray, S.-H. Kang, C. S. Johnson, J. T. Vaughey,R. Benedek and S. Hackney, J. Mater. Chem., 2007, 17,3112–3125.
10 M. M. Thackeray, C. S. Johnson, J. T. Vaughey, N. Li andS. A. Hackney, J. Mater. Chem., 2005, 15, 2257–2267.
11 A. R. Armstrong, M. Holzapfel, P. Novak, C. S. Johnson,S.-H. Kang, M. M. Thackeray and P. G. Bruce, J. Am. Chem.Soc., 2006, 128, 8694–8698.
12 H. Yu, R. Ishikawa, Y. G. So, N. Shibata, T. Kudo, H. Zhouand Y. Ikuhara, Angew. Chem., Int. Ed., 2013, 52, 5969–5973.
13 H. Yu and H. Zhou, J. Phys. Chem. Lett., 2013, 4, 1268–1280.14 K. A. Jarvis, C. C. Wang, A. Manthiram and P. J. Ferreira, J.
Mater. Chem. A, 2014, 2, 1353–1362.15 Y. J. Park, Y.-S. Hong, X. Wu, M. G. Kim, K. S. Ryu and
S. H. Chang, J. Electrochem. Soc., 2004, 151, A720–A727.16 J.-M. Kim, S. Tsuruta and N. Kumagai, Electrochem.
Commun., 2007, 9, 103–108.17 N. Kumagai, J. M. Kim, S. Tsuruta, Y. Kadoma and K. Ui,
Electrochim. Acta, 2008, 53, 5287–5293.18 D. Ye, K. Ozawa, B. Wang, D. Hulicova-Jurcakova, J. Zou,
C. Sun and L. Wang, Nano Energy, 2014, 6, 92–102.19 K. Ozawa, Y. Nakao, T. Mochiku, Z. Cheng, L. Wang, H. Iwai,
Y. Tsuchiya, H. Fujii and N. Igawa, J. Electrochem. Soc., 2012,159, A300–A304.
20 S.-H. Kang, P. Kempgens, S. Greenbaum, A. Kropf, K. Amineand M. Thackeray, J. Mater. Chem., 2007, 17, 2069–2077.
21 J. Breger, M. Jiang, N. Dupre, Y. S. Meng, Y. Shao-Horn,G. Ceder and C. P. Grey, J. Solid State Chem., 2005, 178,2575–2585.
22 K. A. Jarvis, Z. Deng, L. F. Allard, A. Manthiram andP. J. Ferreira, Chem. Mater., 2011, 23, 3614–3621.
18774 | J. Mater. Chem. A, 2014, 2, 18767–18774
23 Y. Li, Z. Zhou, M. Ren, X. Gao and J. Yan, Electrochim. Acta,2006, 51, 6498–6502.
24 L. Zhou, D. Zhao and X. D. Lou, Angew. Chem., 2012, 124,243–245.
25 Y. Jiang, Z. Yang, W. Luo, X. Hu and Y. Huang, Phys. Chem.Chem. Phys., 2013, 15, 2954–2960.
26 J. Bareno, C. Lei, J. Wen, S. H. Kang, I. Petrov andD. Abraham, Adv. Mater., 2010, 22, 1122–1127.
27 A. Boulineau, L. Croguennec, C. Delmas and F. Weill, Chem.Mater., 2009, 21, 4216–4222.
28 E. Regan, T. Groutso, J. Metson, R. Steiner, B. Ammundsen,D. Hassell and P. Pickering, Surf. Interface Anal., 1999, 27,1064–1068.
29 Z. Li, J. Wang, S. Liu, X. Liu and S. Yang, J. Power Sources,2011, 196, 8160–8165.
30 S. Madhavi, G. S. Rao, B. Chowdari and S. Li, J. Electrochem.Soc., 2001, 148, A1279–A1286.
31 A. van Bommel, L. Krause and J. Dahn, J. Electrochem. Soc.,2011, 158, A731–A735.
32 A. Ito, D. Li, Y. Sato, M. Arao, M. Watanabe, M. Hatano,H. Horie and Y. Ohsawa, J. Power Sources, 2010, 195, 567–573.
33 K. T. Lee, S. Jeong and J. Cho, Acc. Chem. Res., 2012, 46, 1161–1170.
34 N. Yabuuchi, K. Yoshii, S.-T. Myung, I. Nakai and S. Komaba,J. Am. Chem. Soc., 2011, 133, 4404–4419.
35 B. Xu, C. R. Fell, M. Chi and Y. S. Meng, Energy Environ. Sci.,2011, 4, 2223–2233.
36 M. Gu, I. Belharouak, J. Zheng, H. Wu, J. Xiao, A. Genc,K. Amine, S. Thevuthasan, D. R. Baer and J. G. Zhang, ACSNano, 2012, 7, 760–767.
37 B. Song, Z. Liu, M. O. Lai and L. Lu, Phys. Chem. Chem. Phys.,2012, 14, 12875–12883.
38 J. R. Croy, D. Kim, M. Balasubramanian, K. Gallagher,S.-H. Kang and M. M. Thackeray, J. Electrochem. Soc., 2012,159, A781–A790.
39 X. Yu, Y. Lyu, L. Gu, H. Wu, S. M. Bak, Y. Zhou, K. Amine,S. N. Ehrlich, H. Li and K. W. Nam, Adv. Energy Mater.,2013, 4, 1–7.
40 O. Toprakci, H. A. Toprakci, Y. Li, L. Ji, L. Xue, H. Lee,S. Zhang and X. Zhang, J. Power Sources, 2013, 241, 522–528.
41 K. Du, F. Yang, G. R. Hu, Z. D. Peng, Y. B. Cao and K. S. Ryu, J.Power Sources, 2013, 244, 29–34.
42 X. Dong, Y. Xu, L. Xiong, X. Sun and Z. Zhang, J. PowerSources, 2013, 243, 78–87.
43 E.-S. Lee, A. Huq, H.-Y. Chang and A. Manthiram, Chem.Mater., 2012, 24, 600–612.
This journal is © The Royal Society of Chemistry 2014