Embed Size (px)
Citation preview
BioMed CentralBMC Public Health
ss
Open AcceStudy protocolUnderstanding the Relationship between Activity and Neighbourhoods (URBAN) Study: research design and methodologyHannah M Badland1, Grant M Schofield1, Karen Witten2, Philip J Schluter3, Suzanne Mavoa2, Robin A Kearns*4, Erica A Hinckson1, Melody Oliver1, Hector Kaiwai5, Victoria G Jensen5, Christina Ergler4, Leslie McGrath1 and Julia McPhee1Address: 1Centre for Physical Activity and Nutrition Research, Auckland University of Technology, Auckland, New Zealand, 2Centre for Social and Health Outcomes Research and Evaluation, Massey University, Auckland, New Zealand, 3School of Public Health and Psychosocial Studies, Auckland University of Technology, Auckland, New Zealand and School of Nursing and Midwifery, The University of Queensland, Qld 4072, Australia, 4School of Geography, Geology, and Environmental Science, University of Auckland, Auckland, New Zealand and 5Whariki Research Group, Massey University, Auckland, New Zealand
Email: Hannah M Badland - [email protected]; Grant M Schofield - [email protected]; Karen Witten - [email protected]; Philip J Schluter - [email protected]; Suzanne Mavoa - [email protected]; Robin A Kearns* - [email protected]; Erica A Hinckson - [email protected]; Melody Oliver - [email protected]; Hector Kaiwai - [email protected]; Victoria G Jensen - [email protected]; Christina Ergler - [email protected]; Leslie McGrath - [email protected]; Julia McPhee - [email protected]
* Corresponding author
AbstractBackground: Built environment attributes are recognized as being important contributors tophysical activity (PA) engagement and body size in adults and children. However, much of theexisting research in this emergent public health field is hindered by methodological limitations,including: population and site homogeneity, reliance on self-report measures, aggregated measuresof PA, and inadequate statistical modeling. As an integral component of multi-country collaborativeresearch, the Understanding the Relationship between Activity and Neighbourhoods (URBAN)Study seeks to overcome these limitations by determining the strengths of association betweendetailed measures of the neighborhood built environment with PA levels across multiple domainsand body size measures in adults and children. This article outlines the research protocoldeveloped for the URBAN Study.
Methods and design: The URBAN Study is a multi-centered, stratified, cross-sectional researchdesign, collecting data across four New Zealand cities. Within each city, 12 neighborhoods wereidentified and selected for investigation based on higher or lower walkability and Maoridemographic attributes. Neighborhoods were selected to ensure equal representation of thesecharacteristics. Within each selected neighborhood, 42 households are being randomly selectedand an adult and child (where possible) recruited into the study. Data collection includes: objectiveand self-reported PA engagement, neighborhood perceptions, demographics, and body sizemeasures. The study was designed to recruit approximately 2,000 adults and 250 children into theproject. Other aspects of the study include photovoice, which is a qualitative assessment of built
Published: 10 July 2009
BMC Public Health 2009, 9:224 doi:10.1186/1471-2458-9-224
Received: 19 May 2009Accepted: 10 July 2009
This article is available from: http://www.biomedcentral.com/1471-2458/9/224
© 2009 Badland et al; licensee BioMed Central Ltd. This is an Open Access article distributed under the terms of the Creative Commons Attribution License (http://creativecommons.org/licenses/by/2.0), which permits unrestricted use, distribution, and reproduction in any medium, provided the original work is properly cited.
Page 1 of 11(page number not for citation purposes)
BMC Public Health 2009, 9:224 http://www.biomedcentral.com/1471-2458/9/224
environment features associated with PA engagement, an audit of the neighborhood streetscapeenvironment, and an individualized neighborhood walkability profile centered on each participant'sresidential address. Multilevel modeling will be used to examine the individual-level andneighborhood-level relationships with PA engagement and body size.
Discussion: The URBAN Study is applying a novel scientifically robust research design to provideurgently needed epidemiological information regarding the associations between the builtenvironment and health outcomes. The findings will contribute to a larger, international initiativein which similar neighborhood selection and PA measurement procedures are utilized across eightcountries. Accordingly, this study directly addresses the international priority issues of increasingPA engagement and decreasing obesity levels.
BackgroundIncreasing physical activity (PA) engagement and reduc-ing obesity levels at the population-level have been iden-tified as national [1] and international [2,3] healthpriorities. Multiple factors at different levels, includingpersonal, family, social, environmental, and economicattributes, have been shown to influence PA and obesitypatterns [4]. Environmental determinants, such aschanges in urbanization patterns and the built environ-ment, increased used of labor-saving devices, greater par-ticipation in sedentary activities, and reliance onautomobiles for transport are now being recognized askey contributors to these health outcomes [2,3,5]. Urbansprawl, a composite measure of many built environmentelements, has also been positively related to population-level overweight/obese status [6-8], potentially throughreduced accumulation of PA via increased reliance on carsand reduced access to local destinations and public trans-port infrastructure. Despite these emerging relationships,studies in this field often have methodological flaws thatlimit the robustness of the findings. More rigorous dataare urgently required to inform decision-makers of thebuilt environment variables with greatest potential forimproving PA and obesity outcomes.
A number of built environment features have been con-sistently identified as promoting PA in both adults [9-11]and children [12,13]. For adults these include increasedstreet network connectivity, higher residential populationdensity, greater access to public spaces, shops, and serv-ices, and higher levels of mixed land use [14-17]. Adult PAlevels are also influenced by streetscape characteristicsincluding neighborhood aesthetics, green space, pedes-trian infrastructure, and safety factors [16-20]. For chil-dren, distance to school [21], neighborhood design[13,22], traffic safety [23], and access to green spaces [24]and recreation locations [12] have been associated withPA engagement.
Although this evidence is accumulating, there are limita-tions in many of the studies on which it is based. To date,the majority of research investigating built environment
variables with PA engagement and body size has relied onself-report measures, largely drawn from adult samplesbased in the United States and Australia. Although self-report measures are practical to implement, they do notaccurately detect incidental PA accumulation [25] and areaffected by recall bias in adults [25] and children [26].Also, neighborhoods have often not been selected to max-imize variation in built environment attributes. Capturingneighborhood variability is fundamental to understand-ing the magnitude of built environment effects on indi-vidual PA engagement within these communities.
Ethnic differences in relation to built environment varia-bles have also been understudied. Within New Zealand,Maori (New Zealand's indigenous people) have higherobesity rates when compared with New Zealand Pakeha/European [27], and it is unknown whether urban formcharacteristics may influence these groups differently. Fur-thermore, little research has been conducted with childrenin this context; yet given the more sporadic nature of PAengagement displayed by children when compared withadults, it is conceivable that built environment variablesassociated with PA and body size will differ for adults andchildren. Parental perceptions of neighborhood safety(e.g., stranger danger, traffic concerns) may also be animportant influencing factor regarding children's PAengagement [23]. Ignoring these important variables islikely to have resulted in population and site homogene-ity, which in turn, may lead to underestimation of effectsizes in associations between the built environment andhealth outcomes. A further limitation of existing researchin this field has been the use of rudimentary analyticaltechniques that ignore clustering and the multilevel orhierarchical structure of data on individuals living in dif-ferent households, neighborhoods, cities, and countries.Multilevel modeling that can simultaneously account forfactors at individual and neighborhood levels is likely toprovide a more robust and sophisticated understanding ofPA and health determinants [28].
The International Physical Activity and Environment Net-work (IPEN) study was set up to overcome the limitations
Page 2 of 11(page number not for citation purposes)
BMC Public Health 2009, 9:224 http://www.biomedcentral.com/1471-2458/9/224
inherent with many previous studies and to address thepaucity of rigorous scientific evidence available in thisfield (refer http://www.ipenproject.org). Key strengths ofthe collaborative study are the: multi-country participa-tion (Australia, Belgium, Colombia, Czech Republic,Hong Kong, New Zealand, United Kingdom, UnitedStates of America) to ensure inclusion of diverse urbanenvironments, and the use of standardized protocols tomeasure the built environment (geographical informa-tion systems (GIS)), PA engagement (International Physi-cal Activity Questionnaire – Long Form (IPAQ-LF),accelerometry), and other health outcomes (body size).Once collected, participant and neighborhood data willbe combined to facilitate intra-and inter-country multi-level comparisons of built environment, PA, and healthoutcomes. This will produce more accurate effect size esti-mations, and improve understanding of internationalassociations between the urban design, PA, and body sizestatus. Purposefully stratifying neighborhoods based onbuilt environment attributes and combining data frommultiple sites in diverse countries will ensure that a largervariation of environmental attributes will be gained thanthose available from any one country.
The Understanding the Relationship Between Activity andNeighbourhood (URBAN) Study contributes to this col-laboration by collecting New Zealand-specific built envi-ronment and health data from four diverse cities inaccordance with IPEN protocols. In addition to the designstrengths of the IPEN collaboration, the URBAN Study hasincorporated several additional features that will add to itspotential to contribute to understanding in this field: achild sample, stratifying neighborhoods by walkabilityand ethnicity, door-to-door recruitment of participants,streetscape audits, in depth assessments of the perceivedenvironment (via photovoice), and individualized walka-bility profiles based on participants' residential location.This paper outlines the methods developed for use in theURBAN Study.
MethodsStudy aimThe overarching aim of the URBAN Study is to understandthe associations between neighborhood built environ-ment variables, PA engagement, and body size. Measuresof neighborhood urban design, PA levels across multipledomains (leisure, transport, habitual, and overall), andbody size will be used to model the associations andestablish effect sizes in a diverse sample using appositestatistical modeling.
Study designThis research is a cross-sectional study that examines theassociations between neighborhood urban design, PA lev-els, and body size in adults and children residing in
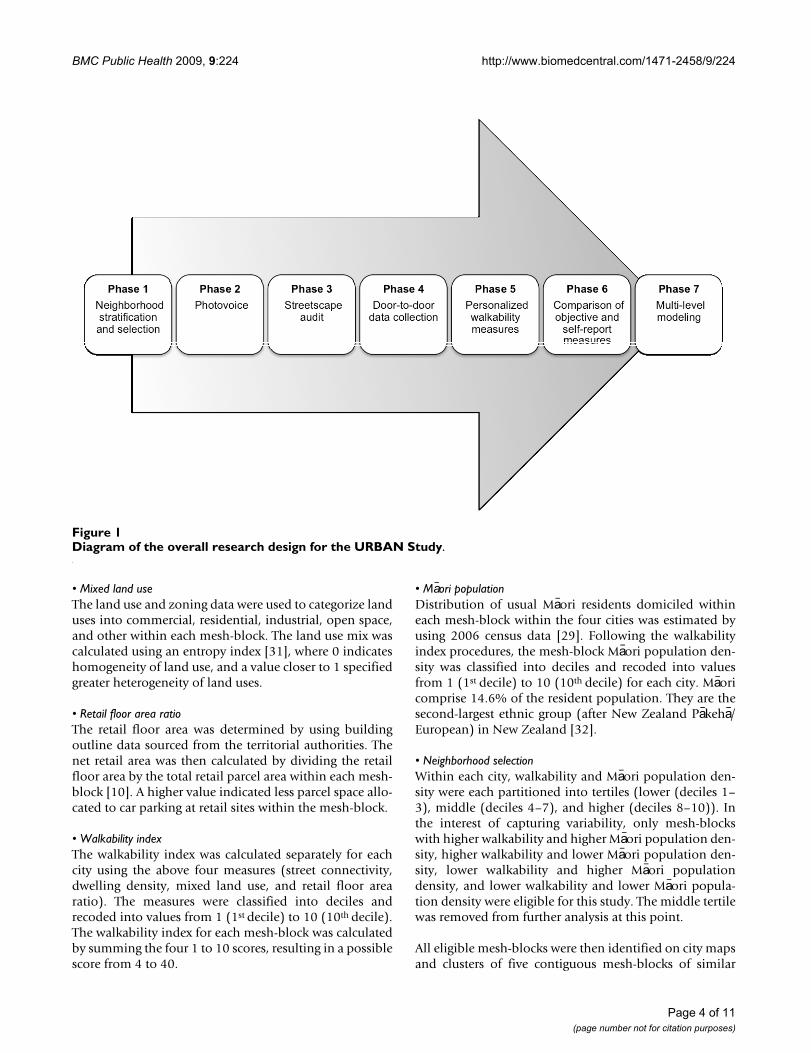
selected neighborhoods within four cities in New Zealand(North Shore, Waitakere, Wellington, and Christchurch).The sites were selected for their geographical diversity andbecause of existing access to city-level GIS data. The studywas conceptualized using a multilevel framework, withthe levels being: country, city, neighborhood, household,and individual. The URBAN Study is being conducted inseven phases, where each phase informs the subsequentstages of the research (Figure 1). Recruitment for theURBAN Study commenced in April 2008 in North ShoreCity, and the project uses a rolling data collection processacross the four cities; it is anticipated that it will take oneand a half years to complete the door-to-door data collec-tion component of the study (phase 4). The host institu-tions of the research granted ethical approval for theoutlined study procedures (AUTEC: 07/126, MUHECN:07/045).
Phase 1: Neighborhood stratificationWithin each of the four cities, 12 neighborhoods wereselected for investigation. In order to select neighbor-hoods, a walkability index was created and the domiciledMaori population was estimated. These values wereapplied to each mesh-block within the cities' boundaries.A mesh-block is a geographic census unit of approxi-mately 100 households constructed by Statistics New Zea-land [29]. The walkability index was calculated usingcombined measures of street connectivity, dwelling den-sity, land use mix, and retail floor area ratio, and was gen-erated using GIS software, ArcInfo 9.1 (ESRI, Redlands,CA). The construction of these measures replicates exist-ing IPEN research procedures [10,30]. Each of the walka-bility variables is discussed below.
• Street connectivityStreet connectivity was estimated by calculating intersec-tion density. Street intersections with three or moreunique intersecting streets were extracted from road net-work data. Mesh-block boundaries are typically definedby street centerlines. Therefore, to ensure that street inter-sections coincidental with mesh-block boundaries wereincluded, intersection density was calculated as thenumber of intersections per square kilometer within 20meters of each mesh-block boundary. Values for eachmesh-block were between 0 and 1, where a score closer to1 indicated higher street connectivity.
• Dwelling densityThe number of dwellings was estimated using mesh-blockdata for the number of occupied private dwellings takenfrom the New Zealand 2006 census [29]. Residential landarea was obtained from the land use and zoning data pro-vided by the territorial authorities. Dwelling density wascalculated by dividing the number of dwellings by the res-idential land area for each mesh-block.
Page 3 of 11(page number not for citation purposes)
BMC Public Health 2009, 9:224 http://www.biomedcentral.com/1471-2458/9/224
• Mixed land useThe land use and zoning data were used to categorize landuses into commercial, residential, industrial, open space,and other within each mesh-block. The land use mix wascalculated using an entropy index [31], where 0 indicateshomogeneity of land use, and a value closer to 1 specifiedgreater heterogeneity of land uses.
• Retail floor area ratioThe retail floor area was determined by using buildingoutline data sourced from the territorial authorities. Thenet retail area was then calculated by dividing the retailfloor area by the total retail parcel area within each mesh-block [10]. A higher value indicated less parcel space allo-cated to car parking at retail sites within the mesh-block.
• Walkability indexThe walkability index was calculated separately for eachcity using the above four measures (street connectivity,dwelling density, mixed land use, and retail floor arearatio). The measures were classified into deciles andrecoded into values from 1 (1st decile) to 10 (10th decile).The walkability index for each mesh-block was calculatedby summing the four 1 to 10 scores, resulting in a possiblescore from 4 to 40.
• Maori populationDistribution of usual Maori residents domiciled withineach mesh-block within the four cities was estimated byusing 2006 census data [29]. Following the walkabilityindex procedures, the mesh-block Maori population den-sity was classified into deciles and recoded into valuesfrom 1 (1st decile) to 10 (10th decile) for each city. Maoricomprise 14.6% of the resident population. They are thesecond-largest ethnic group (after New Zealand Pakeha/European) in New Zealand [32].
• Neighborhood selectionWithin each city, walkability and Maori population den-sity were each partitioned into tertiles (lower (deciles 1–3), middle (deciles 4–7), and higher (deciles 8–10)). Inthe interest of capturing variability, only mesh-blockswith higher walkability and higher Maori population den-sity, higher walkability and lower Maori population den-sity, lower walkability and higher Maori populationdensity, and lower walkability and lower Maori popula-tion density were eligible for this study. The middle tertilewas removed from further analysis at this point.
All eligible mesh-blocks were then identified on city mapsand clusters of five contiguous mesh-blocks of similar
Diagram of the overall research design for the URBAN StudyFigure 1Diagram of the overall research design for the URBAN Study.
Page 4 of 11(page number not for citation purposes)
BMC Public Health 2009, 9:224 http://www.biomedcentral.com/1471-2458/9/224
walkability and/or Maori population density characteris-tics were grouped together to form neighborhoods. Theresearch team then purposefully selected three neighbor-hoods for each walkability/Maori population strata percity. This ensured geographical spread within each regionand diversity across cities were captured. In total, 12neighborhoods were selected per city and 48 neighbor-hoods were chosen across New Zealand. All neighbor-hoods are drawn from urban settings. In the instanceswhere the number of potential respondents is exhaustedwithin the neighborhood during the door-to-door recruit-ment phase (generally because of a high number of com-mercial premises within that setting), an additionalcontiguous mesh-block of similar built environment andMaori population characteristics is added to the neighbor-hood.
Phase 2: PhotovoicePhotovoice is a research method that allows individuals,including those who may be marginalized, to conceptual-ize their environment through photography. In this study,neighborhood features associated with PA engagementacross different cities, settings, and populations are quali-tatively captured by photovoice. Children, as well asadults (approximately n = 10 per group) are drawn fromfive diverse neighborhoods in North Shore and Waitakerecities and invited to participate in the photovoice compo-nent of the URBAN Study. These participants do not nec-essarily partake in the door-to-door data collection aspectof the study. After an initial briefing, participants are eachprovided with a disposable camera to take photographs offeatures in their local environment they perceive maketheir self-defined neighborhood more and less conducivefor engaging in PA. The photographs are developed,brought to a participant focus group (either adult- orchild-specific). Participants presented noteworthy photosin relation to neighborhood PA attributes and explainedthe images to the group, both verbally and by way of cap-tions written underneath the pictures. This process, eitherin small breakout groups or as a whole group discussion,enables the identification of key PA themes of significanceand concern for participants in each locality. The discus-sions are audio taped, transcribed, and thematic induc-tion analyses is conducted using Nvivo software (QSR,VIC, Australia). The photovoice procedures follow anestablished methodology [33,34].
Phase 3: Streetscape auditIn 12 selected street segments in each study neighborhooda streetscape audit using a modified version of the System-atic Pedestrian and Cycling Environment Scan (SPACES)tool [35] is undertaken to assess the presence and absenceof features that support walking and cycling (e.g., physicalinfrastructure, aesthetics, traffic safety attributes). TheSPACES, developed in Australia, has demonstrated appro-
priate reliability for most variables examined in that set-ting (kappa ≥ 75% agreement) [36], and was adapted forthe New Zealand context. The starting point for the auditis randomly selected within the neighborhood and there-after the street segments are selected sequentially. Scoresfrom each street segment are combined to provide aneighborhood streetscape value. All streetscape audits areconducted when door-to-door data collection is occurringin the city. For reliability purposes, 10% of the street seg-ments are re-audited by a second trained assessor. A train-ing manual based on the SPACES protocols wasdeveloped for the URBAN Study that included New Zea-land specific reference images.
Phase 4: Participant recruitment and data collectionTrained interviewers recruited participants using a door-to-door recruitment strategy. For each selected neighbor-hood, GIS is used to generate street maps, identify parcellots, random start points, walk paths, and enumeratehouseholds. These maps are provided to three or fourtrained interviewers for door-to-door recruitment withinstructions to approach every nth household. The house-hold sampling rate is determined by dividing the neigh-borhood dwelling density [29] by the estimated responserate of 60%. This value varies between neighborhoodsbecause of the changeable number of residential dwell-ings located within each mesh-block. Commercial or tem-porary residential (e.g., motel rooms) premises areexcluded from the sampling frame.
Interviewers start from GIS-derived randomly selectedstart points and approach the households identified bythe enumeration process. The interviewers follow the pre-determined walk path for each neighborhood. Forty-twohouseholds are selected in each neighborhood, and oneadult and one child (where possible) are surveyed perhousehold. This sampling strategy is designed to yield atotal of 2,000 adult participants once data collection iscomplete. It is estimated that 250 children will berecruited into the study.
Individuals aged between 20–65 years and 3–12 yearsinclusive usually resident in private dwellings in the 48selected neighborhoods are eligible to participate in thestudy. Where there is more than one eligible person in thehousehold, potential participants are identified by the cri-terion of having the next birthday. Exclusion criteria are:falling outside the age ranges, not intending on living inthe household over the measurement period, not residentin the dwelling three months prior to recruitment, unableto speak the English language, or having walking mobilityrestrictions, such as using crutches. The eligible child inthe household is unable to participate in the research ifthe eligible adult from the household refuses to take partin the study. In the event that there is no eligible adult
Page 5 of 11(page number not for citation purposes)
BMC Public Health 2009, 9:224 http://www.biomedcentral.com/1471-2458/9/224
residing in the household or the eligible adult refuses toparticipate, the household becomes 'closed' and the inter-viewer moves on to the next household identified on theneighborhood walk. If no one is at home or an eligibleadult resides in the household, but is not available, theinterviewer makes a maximum of five return visits forrecruitment purposes. The outcome for each visit isrecorded on a door-to-door call sheet. Informationregarding door-to-door recruitment procedures is docu-mented in a training manual and briefing session.
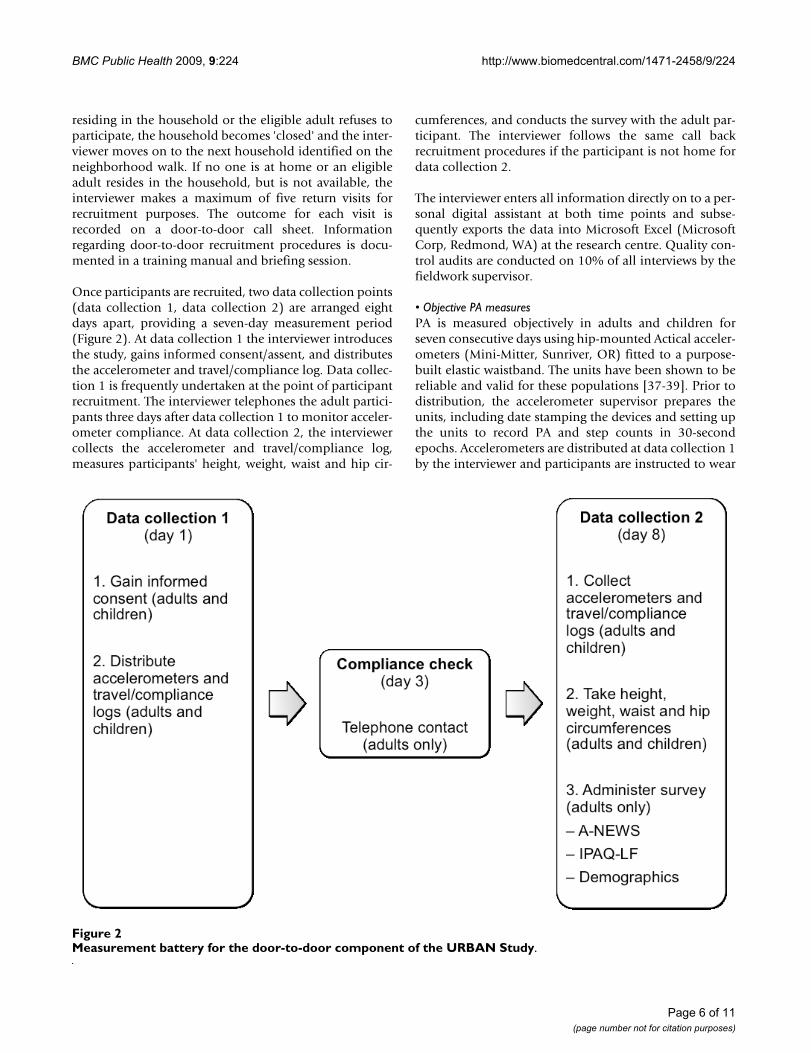
Once participants are recruited, two data collection points(data collection 1, data collection 2) are arranged eightdays apart, providing a seven-day measurement period(Figure 2). At data collection 1 the interviewer introducesthe study, gains informed consent/assent, and distributesthe accelerometer and travel/compliance log. Data collec-tion 1 is frequently undertaken at the point of participantrecruitment. The interviewer telephones the adult partici-pants three days after data collection 1 to monitor acceler-ometer compliance. At data collection 2, the interviewercollects the accelerometer and travel/compliance log,measures participants' height, weight, waist and hip cir-
cumferences, and conducts the survey with the adult par-ticipant. The interviewer follows the same call backrecruitment procedures if the participant is not home fordata collection 2.
The interviewer enters all information directly on to a per-sonal digital assistant at both time points and subse-quently exports the data into Microsoft Excel (MicrosoftCorp, Redmond, WA) at the research centre. Quality con-trol audits are conducted on 10% of all interviews by thefieldwork supervisor.
• Objective PA measuresPA is measured objectively in adults and children forseven consecutive days using hip-mounted Actical acceler-ometers (Mini-Mitter, Sunriver, OR) fitted to a purpose-built elastic waistband. The units have been shown to bereliable and valid for these populations [37-39]. Prior todistribution, the accelerometer supervisor prepares theunits, including date stamping the devices and setting upthe units to record PA and step counts in 30-secondepochs. Accelerometers are distributed at data collection 1by the interviewer and participants are instructed to wear
Measurement battery for the door-to-door component of the URBAN StudyFigure 2Measurement battery for the door-to-door component of the URBAN Study.
Page 6 of 11(page number not for citation purposes)
BMC Public Health 2009, 9:224 http://www.biomedcentral.com/1471-2458/9/224
the units for all waking hours for one week (seven days),but remove the monitors when participating in water-based activities. Accelerometers are collected as close aspossible to eight days later at data collection 2 by theinterviewer. Accelerometers are returned to the researchcentre and the data are downloaded into Microsoft Excelby the accelerometer supervisor. Once cleaned, data fromthe unit are included for further analyses if at least 10hours of data are gathered per day, for a minimum of 5days. This is in accordance with IPEN protocols [40]. Amanual has been developed regarding accelerometerdownloading and uploading procedures, data storage,and data cleaning treatment protocols, and automateddata extraction procedures are currently being developed.For most analyses, the outcome variables for adults andchildren will be the percentage of waking time spent insedentary, light, moderate, and vigorous PA [41].
• Travel/compliance logParticipants self-complete a travel and compliance log forthe duration of the accelerometer data collection. Eachday, participants record what transport mode(s) they useto travel to and from work or study, the times they get upand go to bed, whether the accelerometer is removed forportions of the day, and if so, what activities the partici-pant engages in during those times. No reliability or valid-ity testing has been conducted with this tool. Theinformation on waking hours and accelerometer removalderived from the log are checked and matched againstaccelerometer data.
• Body size measuresThe interviewer measures body size at data collection 2.Height is assessed to the nearest 0.1 cm using a stadiome-ter (Mentone Educational Centre, Victoria, Australia) andweight to the nearest 0.1 kg using calibrated Seca 770scales (Protec Solutions Ltd, Wellington, NZ). Body massindex (BMI) status for adults will be determined using theWorld Health Organization ethnic-specific thresholds[42,43] and the International Obesity Task Force criteria[44] will be applied to children. Waist circumference ismeasured as the minimum value between the iliac crestand the lateral costal margin (the mid-point between thehip and the lowest rib) to the nearest 0.1 cm using aLufkin W606PM tape (Cooper Tools, Apex, NC, USA).Hip circumference is measured at the widest part of thebuttocks [45]. Age-specific thresholds for high trunk masswill be applied to the sample [46-48].
• Neighborhood perceptionsNeighborhood perceptions are assessed using the Abbre-viated-Neighborhood Walkability Scale (A-NEWS). TheA-NEWS is a 54-item tool that measures adults' percep-tions of dwelling density, land use mix, street connectiv-ity, walking and cycling infrastructure, safety, and access
to public and private facilities within their self-definedneighborhood. Responses are rated either on a four- orfive-point Likert scales. Acceptable reliability and validityof the A-NEWS has been determined previously [49].Neighborhood self-selection preferences are assessed on afive-point Likert scale using six items taken from the Strat-egies for Metropolitan Atlanta's Regional Transportationand Air Quality Study [50]. The neighborhood self-selec-tion measures have also been used in the NeighborhoodQuality of Life Study [51] and the Physical Activity inLocalities and Community Environments [9]; these stud-ies also contribute to the IPEN dataset.
• Self-reported PAThe IPAQ-LF is administered to capture adults' self-reported PA levels for the previous seven days (the periodwhen the accelerometer was worn). The IPAQ-LF hasshown to be a reliable and valid measure of PA engage-ment in 12 countries [40], and is used to assess PA engage-ment across four domains: occupational, transportation,household, and leisure. The outcome measures for overalland domain-specific PA will be frequency (days), dura-tion (minutes), and intensity (light, moderate, and vigor-ous) of engagement. Self-reported PA levels will becompared with national PA recommendations, acceler-ometer data, and other countries participating in IPEN.
• DemographicsAs part of the study, adult participants complete a demo-graphic survey that examines: ethnicity, marital status,household income, academic qualifications, occupation,travel mode engagement, dwelling type, number of chil-dren living in the dwelling, time spent watching televi-sion, perceptions of body size, and the location ofproximal and usually accessed food stores. Adult partici-pants also complete the child's survey by proxy if an eligi-ble child within the household participated in the study.Questions relating to the child include: ethnicity, screentime (e.g., television, computer, games consoles) accessand rules, PA participation and motor skill ability, percep-tions of body size, and access to and use of potential PAsettings.
• WeatherDaily weather data (minimum and maximum tempera-ture (°C), rainfall (mm)) are recorded at sites located ineach of the four cities. The New Zealand MetrologicalService collects and provides this information. Time-matched weather variables will be created to examine orcontrol for the weather effects on PA engagement.
Phase 5: Personalized walkability measuresPersonalized walkability index values will be calculatedand constructed for adults and children based on thephysical environment surrounding each participant's
Page 7 of 11(page number not for citation purposes)
BMC Public Health 2009, 9:224 http://www.biomedcentral.com/1471-2458/9/224
place of residence. The buffer distance will be developedalong a one-kilometer street network from the partici-pant's residence, excluding areas that cannot be accesseddue to major barriers (e.g., freeways, water features). Sim-ilar GIS approaches as used to construct the walkabilityindices applied to the neighborhood selection processwill be used to create the personalized walkability indexclassifications. Other potential inclusions in the indexinclude public open space, public transport infrastructure,and topography variables within the buffer zone. Creationof these individualized measures has been conducted inprevious research [52-54], and is a useful tool to enablethe objectively measured built environment variables tobe compared with individual-level health and self-reportdata.
Phase 6: Comparison of objective and self-report measuresInternational research suggests there is a mismatchbetween measures of perceived and objectively assessedPA facility availability [55] and behaviors [56], and theserelationships require further investigation. Accordingly, itis important to examine the independent associations andlevels of agreement between actual and perceived PAinfrastructure at the neighborhood level within the NewZealand context, and the relationships between objectiveand perceived PA behaviors. Objective measures derivedfrom GIS, the streetscape audit, accelerometers, and bodysize will be compared with self-report measures drawnfrom the photovoice and door-to-door data collectioncomponents of the study.
Phase 7: Multilevel modelingMultilevel modeling is one of the more appropriate meth-ods for understanding how multiple factors occurring atvarious hierarchical levels (such as individual, household,neighborhood, and city variables) operate to influence PAengagement and body size. The sampling frame andresearch design enables multilevel analyses of neighbor-hood environmental predictors for self-reported andobjectively measured PA and body size for Maori andnon-Maori adults and children. These analytic strategiesappropriately accommodate and model the hierarchy andclusters within the research design, and allow for theadjustment of important potential confounders (such asrainfall). Further analyses will likely consider how theinfluence of parental variables impacts on child healthbehaviors at the household level.
Power calculationsPrecise power calculations depend on focused and pre-determined statistical quantities; something that can bedifficult for multi-aimed and broad studies such as this.For the purpose of this study, we intend recruiting 2,000adults. However, a 10% reduction of our data is expecteddue to lack of compliance, reducing the data available for
full analysis to 1,800 adults. Based on 12 background cov-ariates explaining 25% of the variability of the dependentvariable, and intraclass correlation coefficient clustereffects of 0.05, a realized sample of 1,800 adults, α = 0.05and statistical power of 80%, the clustered multi-linearregression models will detect the smallest change in r2 of≤ 2.3% and clustered logistic regression models odds ratioof ≤ 1.27 if the prevalence rate of overweight/obesity is60%. For the Maori and non-Maori comparisons, weexpect lower Maori neighborhoods to have approximately7% of the usual residents classified as Maori and higherMaori neighborhoods to have approximately 30% of theusual residents to identify as Maori [32]. Assuming a sig-nificant level of α = 0.05 and statistical power of 80%,then the detectable difference between any Maori andnon-Maori proportion is within ± 10% for this samplesize. A difference of ± 10% was considered epidemiologi-cally worthwhile and important to detect.
DiscussionAlthough characteristics of the built environment havebeen related to PA engagement [9,11,12,22] and obesitylevels [6-8], the epidemiological understanding of theassociations between urban form and health outcomesstill remains largely unknown. Improved understandingof built environmental influences on health behaviors,through socio-ecological models, is needed to informmore effective and sustainable interventions [28]. TheURBAN Study will contribute to the evidence base per-taining to PA engagement, body size, and the built envi-ronment for adults and children by overcoming some ofthe existing methodological limitations in this field.
Applications of the URBAN StudyFour key research gaps in this area have been identifiedwhich the URBAN Study attempts to address. First, it isfeasible that the limited environmental variability shownin urban locations previously investigated has underesti-mated the strength of associations between health out-comes and urban design [28]. The URBAN Studypurposefully selects neighborhoods based on a diverserange of walkability and ethnicity characteristics, and con-tributes data to a multi-country study (IPEN). Second,although several studies have documented associationsbetween the built environment and weight status [6,8]and PA engagement [57,58], confirmatory studies haveyet to be conducted in diverse communities using robustmeasures to determine any walkability effect. Under-standing these relationships in greater detail using stand-ardized objective measurement procedures and protocols(GIS, accelerometers, body size) will provide more rigor-ous urban planning guidance to decision makers, therebyincreasing the likelihood of improving population-levelbody size and PA outcomes. To our knowledge, this is thefirst New Zealand study to simultaneously use objective
Page 8 of 11(page number not for citation purposes)
BMC Public Health 2009, 9:224 http://www.biomedcentral.com/1471-2458/9/224
and self-report measurement tools to assess adult andchild PA levels and body size status with the built environ-ment. Third, limited evidence exists regarding how thoseindividuals of different ethnicities, ages, genders, and/orfamily structures are influenced by the impact of neigh-borhood design with regard to health outcomes [28]. TheURBAN Study has been designed to in part address thisissue, with findings that can be stratified and analyzedaccording to these variables. Fourth, internationally thereis very little evidence available identifying which builtenvironment variables influence children's PA and bodysize, and how the built environment impacts on parentalchoices regarding children's PA opportunities. Accord-ingly, the URBAN Study will contribute directly to this evi-dence base by examining the interactions betweenchildren's PA behaviors, body size, parental perceptions,and built environment characteristics across diverse set-tings and child age ranges. It is anticipated that full resultsof the study will be available in 2011.
Strengths and weaknesses of the URBAN StudyThe obvious strengths of the URBAN Study are the: repli-cation of international procedures and measures, neigh-borhood stratification and selection processes, use ofobjective and self-report measures, assessment of PAengagement over multiple domains, ability to control forseasonal effects, large sample size recruited, and incorpo-ration of adults and children of diverse ethnicities into thesampling frame. Limitations of the study include its cross-sectional research design that means causality cannot bedetermined, and that neighborhoods are only drawn fromurban settings; therefore findings cannot be applied torural or small town environments within New Zealand.Neighborhood walkability and ethnicity classificationsmay also differ by region, and communities classified asbeing higher walkable or higher Maori population in onecity may not reach the inclusion threshold for anothercity. However, this may also be considered a strength ofthe study as the design will allow any city-specific or dose-response effects to be captured, and assist with the under-standing of the relative importance of other covariates andconfounders. Lastly, neighborhoods are grouped accord-ing to geographic layout through contiguous mesh-blocks, rather than according to natural and social bound-aries. This may create a mismatch between the GIS-assessed neighborhood and respondents' perceptions oftheir neighborhoods.
ConclusionTaken together, the URBAN Study will generate robust sci-entific evidence by using appropriate and standardizedmeasures to provide a New Zealand-specific understand-ing of the associations between urban design and healthoutcomes, as well as contributing data to an internationalresearch project. Providing this information will impart
urgently needed epidemiological information regardingthe associations between the built environment andhealth outcomes. Accordingly, this study directlyaddresses the international priority issues of increasing PAengagement and decreasing obesity levels at the popula-tion-level.
AbbreviationsA-NEWS: Abbreviated – Neighborhood EnvironmentWalkability Scale; BMI: Body mass index; °C: Degrees Cel-sius; GIS: Geographical information systems; IPAQ-LF:International Physical Activity Questionnaire – LongForm; IPEN: International Physical Activity and Environ-ment Network; mm: Millimeters; PA: Physical activity;SPACES: Systematic Pedestrian and Cycling EnvironmentScan; URBAN: Understanding the Relationships betweenActivity and Neighbourhoods.
Competing interestsThe authors declare that they have no competing interests.
Authors' contributionsHMB developed the first draft of the manuscript. HMB,GMS, KW, PJS, SM, and RK contributed to the conceptionand the design of the study. All authors provided criticalfeedback during manuscript development. Each authorhas read and approved the final manuscript.
Authors' informationHMB is a Post-doctoral Research Fellow at the Centre forPhysical Activity and Nutrition Research, Auckland Uni-versity of Technology, New Zealand. GMS is a Professor ofPublic Health and the Director of the Centre for PhysicalActivity and Nutrition Research, Auckland University ofTechnology, New Zealand. KW is an Associate Professor atthe Centre for Social and Health Outcomes Research andEvaluation, Massey University, New Zealand. PJS is a Pro-fessor of Biostatistics at the School of Public Health andPsychosocial Studies at Auckland University of Technol-ogy, New Zealand and the School of Nursing and Mid-wifery, University of Queensland, Australia. SM is a GISAnalyst at the Centre for Social and Health OutcomesResearch and Evaluation, Massey University, New Zea-land. RAK is a Professor of Geography at the School ofGeography, Geology, and Environmental Sciences, Uni-versity of Auckland, New Zealand. EAH is the Head ofResearch at the School of Sport and Recreation at Auck-land University of Technology, New Zealand. MO is aPost-doctoral Research Fellow at the Centre for PhysicalActivity and Nutrition Research, Auckland University ofTechnology, New Zealand. HK is a researcher at WharikiResearch Group, Massey University, New Zealand. VGJ isa researcher at Whariki Research Group, Massey Univer-sity, New Zealand. CE is a PhD student at the School ofGeography, Geology, and Environmental Sciences, Uni-
Page 9 of 11(page number not for citation purposes)
BMC Public Health 2009, 9:224 http://www.biomedcentral.com/1471-2458/9/224
versity of Auckland, New Zealand. LM is a PhD student atthe Centre for Physical Activity and Nutrition Research,Auckland University of Technology, New Zealand. JM isthe Research Manager at the Centre for Physical Activityand Nutrition Research, Auckland University of Technol-ogy, New Zealand
AcknowledgementsThe URBAN Study is supported by a three-year research grant from the Health Research Council of New Zealand (grant: 07/356). The funding body was not involved in the design, conduct, data collection, management, or publication of the study. National Heart Foundation of New Zealand Research Fellowships support HMB and MO. The authors also gratefully acknowledge the participants who completed the study, research assistants who collect the data, and territorial authorities for providing the GIS data-sets.
References1. Ministry of Health: Healthy eating-healthy action: A background Ministry
of Health: Wellington; 2003. 2. World Health Organization: Global strategy on diet, physical activity and
health World Health Organization: Geneva; 2004. 3. World Cancer Research Fund and American Institute for Cancer
Research: Food, Nutrition, Physical Activity, and the Prevention of Cancer:a Global Perspective American Institute for Cancer Research: Washing-ton DC; 2007.
4. Sallis JF, Cervero RB, Ascher W, et al.: An ecological approach tocreating active living communities. Ann Rev Public Health 2006,27:297-322.
5. Public Health Advisory Committee: Re-thinking urban environments andhealth Ministry of Health: Wellington; 2008.
6. Frank LD, Andresen MA, Schmid TL: Obesity relationships withcommunity design, physical activity, and time spent in cars.Am J Prev Med 2004, 27:87-96.
7. Ewing R, Schmid TL, Killingsworth R, et al.: Relationship betweenurban sprawl and physical activity, obesity and morbidity.Am J Health Prom 2003, 18:47-57.
8. Lopez-Zetina J, Lee H, Friis R: The link between obesity and thebuilt environment. Evidence from an ecological analysis ofobesity and vehicle miles of travel in California. Health & Place2006, 12:656-664.
9. Owen N, Cerin E, Leslie E, et al.: Neighborhood walkability andthe walking behavior of Australian adults. Am J Prev Med 2007,33:387-395.
10. Leslie E, Coffee N, Frank LD, et al.: Walkability of local commu-nities: Using geographic information systems to objectivelyassess relevant environmental attributes. Health & Place 2007,13:111-122.
11. Frank LD, Selens BE, Powell KE, et al.: Stepping towards causa-tion: Do built environments or neighborhood and travelpreferences explain physical activity, driving, and obesity?Soc Sci Med 2007, 65:1898-1914.
12. Grow HM, Saelens BE, Kerr J, et al.: Where are youth active?Roles of proximity, active transport, and built environment.Med Sci Sports Exerc 2008, 40:2071-2079.
13. Holt NL, Spence JC, Sehn ZL, et al.: Neighborhood and develop-mental differences in children's perceptions of opportunitiesfor play and physical activity. Health & Place 2008, 14:2-14.
14. Badland HM, Schofield GM: Transport, urban design, and physi-cal activity: An evidence based-update. Transportation ResearchPart D: Transport and Environment 2005, 10:177-196.
15. Sallis JF, Kraft K, Linton LS: How the environment shapes physi-cal activity: a transdisciplinary research agenda. Am J Prev Med2002, 22:208-211.
16. Eyler AA, Matson-Koffman D, Young DR, et al.: Quantitative studyof correlates of physical activity in women from diverseracial/ethnic groups. Am J Prev Med 2003, 25(Suppl 1):5-14.
17. Giles-Corti B, Donovan RJ: Socioeconomic status differences inrecreational physical activity levels and real and perceivedaccess to a supportive physical environment. Prev Med 2002,35:601-11.
18. Humpel N, Marshall AL, Leslie E, et al.: Changes in neighbourhoodwalking are related to changes in perceptions of environ-mental attributes. Ann Behav Med 2004, 27:60-67.
19. Ball K, Bauman AE, Leslie E, et al.: Perceived environmental aes-thetics, convenience, and company are associated with walk-ing for exercise among Australian adults. Prev Med 2001,33:434-440.
20. King AC, Castro CC, Eyler AA, et al.: Personal and environmen-tal factors associated with physical inactivity among differentracial/ethnic groups of U.S. middle-aged and older-agedwomen. Health Psych 2000, 19:354-364.
21. Schlossberg M, Greene J, Paulsen Phillips P, et al.: School trips:Effects of urban form and distance on travel mode. J Am Plan-ning Assoc 2006, 72:337-346.
22. Kerr J, Frank LD, Sallis JF, et al.: Urban form correlates of pedes-trian travel in youth: Differences by gender, race-ethnicityand household attributes. Transportation Research Part D: Trans-port and Environment 2007, 12:177-182.
23. Hume C, Timperio A, Salmon J, et al.: Walking and cycling toschool: Predictors of increases among children and adoles-cents. Am J Prev Med 2009, 36:195-200.
24. Epstein LH, Raja S, Gold SS, et al.: Reducing sedentary behavior:The relationship between park area and the physical activityof youth. Psych Sci 2006, 17:654-659.
25. Tudor-Locke C, Myers A: Challenges and opportunities formeasuring physical activity in sedentary adults. Sports Med2001, 31:91-100.
26. Welk GJ, Corbin CB, Dale D: Measurement issues in the assess-ment of physical activity in children. Res Q Exerc Sport 2000,71(Suppl 2):59-73.
27. Ministry of Health: A portrait of health: Key results from the 2002/03New Zealand Health Survey Ministry of Health: Wellington; 2004.
28. Sallis JF, Story M, Lou D: Study designs and analytic strategiesfor environmental and policy research on obesity, physicalactivity, and diet: Recommendations from a meeting ofexperts. Am J Prev Med 2009, 32(Suppl 2):72-77.
29. Statistics New Zealand: Census 2006 Statistics New Zealand: Welling-ton; 2007.
30. Frank LD, Sallis JF, Saelens BE, et al.: The development of thewalkability index: Application to the Neighborhood Qualityof Life Study. Br J Sports Med, Br J Sports Med 2009, 30:601-611.
31. D'Sousa E, Forsyth A, Koepp J, et al.: Twin Cities walking study. Environ-ment and physical activity: GIS protocols. Version 3.1 Minneapolis: Metro-politan Design Center, University of Minnesota; 2006.
32. Statistics New Zealand: New Zealand in profile: An overview of new Zea-land's people, economy, and environment Statistics New Zealand: Wel-lington; 2009.
33. Wang C, Burris M: Photovoice: Concept, methodology, anduse for participatory needs assessment. Health Educ Behavior1997, 24:367-387.
34. Wang C, Pies C: Family, maternal, and child health throughphotovoice. Matern Child Health J 2004, 8:95-102.
35. Pikora TJ, Giles-Corti B, Knuiman M, et al.: Neighborhood envi-ronmental factors correlated with walking near home: UsingSPACES. Med Sci Sports Exerc 2006, 38:708-718.
36. Pikora TJ, Bull F, Jamrozik J, et al.: Developing a reliable auditinstrument to measure the physical environment for physi-cal activity. Am J Prev Med 2002, 23:187-194.
37. Puyau MR, Adolph AL, Vojra FA, et al.: Prediction of activityenergy expenditure using accelerometers with children. MedSci Sports Exerc 2004, 36:1625-1631.
38. Puyau MR, Adolph AL, Vojra FA, et al.: Validation and calibrationof physical activity monitors in children. Obesity Res 2002,10:150-157.
39. Welk GJ: Use of accelerometry-based activity monitors toassess physical activity. In Use of accelerometry-based activity moni-tors to assess physical activity Edited by: Welk GJ. Champaign: HumanKinetics; 2002:125-142.
40. Craig CL, Marshall AL, Sjostrom M, et al.: International physicalactivity questionnaire: 12-country reliability and validity.Med Sci Sports Exerc 2003, 35:1381-1395.
41. Troiano RP, Berigan D, Dodd KW, et al.: Physical activity in theUnited States measured by accelerometer. Med Sci SportsExerc 2008, 40:181-188.
42. World Health Organization: The Asia-Pacific perspective: Redefiningobesity and its treatment World Health Organization: Geneva; 2000.
Page 10 of 11(page number not for citation purposes)
BMC Public Health 2009, 9:224 http://www.biomedcentral.com/1471-2458/9/224
Publish with BioMed Central and every scientist can read your work free of charge
"BioMed Central will be the most significant development for disseminating the results of biomedical research in our lifetime."
Sir Paul Nurse, Cancer Research UK
Your research papers will be:
available free of charge to the entire biomedical community
peer reviewed and published immediately upon acceptance
cited in PubMed and archived on PubMed Central
yours — you keep the copyright
Submit your manuscript here:http://www.biomedcentral.com/info/publishing_adv.asp
BioMedcentral
43. World Health Organization: Obesity and overweight World HealthOrganization: Geneva; 2006.
44. Cole TJ, Flegal KM, Nicholls D, et al.: Body mass index cut offs todefine thinness in children and adolescents: An internationalstudy. BMJ 2007, 335:166-167.
45. World Health Organization: Measuring obesity: Classification anddescription of anthropometric data World Health Organization RegionalOffice for Europe: Copenhagen; 1988.
46. Hirschler V, Maccallini G, Calcagno M, et al.: Waist circumferenceidentifies primary school children with metabolic syndromeabnormalities. Diab Tech Therap 2007, 9:149-157.
47. Lean ME, Han TS, Morrison CE: Waist circumference as a meas-ure for indicating need for weight management. BMJ 1995,311:158-161.
48. Taylor RW, Williams SM, Grant AM, et al.: Waist circumferenceas a measure of trunk fat mass in children aged 3 to 5 years.Int J Ped Obes 2008, 3:226-233.
49. Cerin E, Saelens BE, Sallis JF, et al.: Neighborhood EnvironmentWalkability Scale: validity and development of a short form.Med Sci Sports Exerc 2006, 38:1682-1691.
50. Frank LD, Sallis JF, Conway TL, et al.: Many pathways from landuse to health: Associations between neighborhood walkabil-ity and active transportation, body mass index, and air qual-ity. J Am Planning Assoc 2006, 72:75-87.
51. Saelens BE, Sallis JF, Black JB, et al.: Neighborhood-based differ-ences in physical activity: An environment scale evaluation.Am J Public Health 2003, 93:1552-1558.
52. Hoehner CM, Brennan Ramirez LK, Elliot MB, et al.: Perceived andobjective environmental measures and physical activityamong urban adults. Am J Prev Med 2005, 28(Suppl 2):105-116.
53. Lovasi GS, Neckerman KM, Quinn JW, et al.: Effect of individual orneighborhood disadvantage on the association betweenneighborhood walkability and body mass index. Am J PublicHealth 2008, 99:279-284.
54. Nagel CL, Carlson NE, Bosworth M, et al.: The relation betweenneighborhood built environment and walking activity amongolder adults. Int J Epidemio 2008, 168:461-468.
55. Ball K, Jeffery RW, Crawford DA, et al.: Mismatch between per-ceived and objective measures of physical activity environ-ments. Prev Med 2008, 47:294-298.
56. Badland HM, Schofield GM, Schluter PJ: Objectively measuredcommute distance: Associations with actual travel modesand perceptions to place of work or study in Auckland, NewZealand. J Phys Act Health 2007, 4:80-86.
57. Leslie E, McCrea R, Cerin E, et al.: Regional variations in walkingfor different purposes: The South East Queensland Qualityof Life Study. Environ Behav 2007, 39:557-577.
58. Sallis JF, Saelens BE, Franks LD, et al.: Neighborhood built environ-ment and income: Examining multiple health outcomes. SocSci Med 2009, 68:1285-1293.
Pre-publication historyThe pre-publication history for this paper can be accessedhere:
http://www.biomedcentral.com/1471-2458/9/224/prepub
Page 11 of 11(page number not for citation purposes)