Embed Size (px)
Citation preview

UNDERSTANDING THE
REAL DEPTH AND IMPACT
OF
FUEL POVERTY IN RURAL ENGLAND
A PROJECT BY THE RURAL SERVICES NETWORK
FOR THE COMMISSION FOR RURAL
COMMUNITIES
FIRST PHASE CONSULTANT’S REPORT AND
INTERIM RECOMMENDATIONS
2
“Fuel Poverty levels are more than three times the rate of five years ago and existing measures are inadequate to deal with the scope of the problem”.
CONTENTS
SECTION PAGE NO
One
Introduction 3 – 4
Executive Summary 5 – 9
Two
About the Partners to the Project 10 – 11
Three About Fuel Poverty 12 – 20
- 10 Worrying Statistics 12
- What is Fuel Poverty? 12 – 13
- The Scale of Rural Fuel Poverty 13 - 14
- Rural Characteristics Impacting on Fuel Poverty 14 – 15
- The Multiple Impacts of Rural Fuel Poverty 15 – 18
-Links with Poor Health 15 – 17
-Links with Debt 17
-Impact of Lack of Disposable Income 17 - 18
-Links with Social Deprivation 18
- How is the extent of Fuel Poverty Calculated 18 - 19
- Hard to Treat Properties (HTT) in England and CO2 Emissions
19
- Energy Costs for those without access to the gas network
20
Four
Updating the 2003 Dataset 20 – 22
INTERIM RECOMMENDATIONS 22 – 23
Five
Previous Activity and Outcomes 23 - 24
INTERIM RECOMMENDATIONS 24 – 25
Six
Barriers and Potential Solutions
25 – 29
- Analysing the distribution of Warm Front Grants: issues
29 – 30
- Energy Savings Trust: Home Energy „Pay As You Save‟ (PAYS) Pilot
31
Seven
Identifying Three Pilot Areas 31 – 32
- Planning of Pilot Activity 32 - 33
Eight
Other Key Recommendations 33 – 35
INTERIM RECOMMENDATIONS 35
Information Sources 36
APPENDIX Previous Activity and Outcomes Chart 37 – 47
3
SECTION ONE
INTRODUCTION
“Fuel Poverty levels are more than three times the rate of five years ago and existing measures are inadequate to deal with the scope of the problem”. That is the view of the Government‟s Fuel Poverty Advisory Group (July 2009). It is against this background that the Commission for Rural Communities commissioned the Rural Services Network to investigate the real depth and impact of Fuel Poverty in Rural England and its effect on consumers, service providers and the local economy. An expert Steering Group has been formed to help guide, inform and support the Project in its delivery (see pages 10 - 11 for details of the Steering Group). The Project is broken down into a number of separate but conjoined elements. Phase 1: Research: April 2009 – July 2009: The first phase of the Project sought to examine and report via desktop research and the experience of the Steering Group organisations on:- What information is available to update the 2003 dataset on the scale of
Fuel Poverty - and consider if other data may engender a more holistic view of the scale of the issue in rural areas and its multiple impacts.
Identify and report on activities that have been undertaken by the Steering
Group member organisations to tackle rural Fuel Poverty and energy efficiency.
Identify and report on the specific challenges of addressing Fuel Poverty in
rural areas (including barriers to older people taking up support) and make recommendations for action.
To identify three pilot areas in which activity will be undertaken in a later
phase of the Project to produce robust data about the scale and depth of Fuel Poverty in those areas and testing out different approaches to tackling the issues.
Phase 2: Stakeholder Consultation August – September 2009: A Stakeholder Consultation was carried out during August and September 2009 with the aim of testing out opinion on a number of issues identified in the first phase of the Project. This First Phase Consultant‟s Report and Interim Recommendations have been informed by the phase 1 desk research, advice and information from the steering group and the stakeholder responses. A copy
4
of the full stakeholder responses can be made available on request to [email protected] or [email protected]. Phase 3: Pilot Area Activities: October 2009 – April 2010: the Project will work with 3 pilot areas identified and agreed as specific rural wards within Shropshire, Durham and East Riding to identify the extent, depth and impact of rural Fuel Poverty in these areas. The pilots will also seek to monitor the impact of Fuel Poverty on local services such as health and the local economy through job creation and local spend.
The CRC will use the study to work with Government and delivery organisations to ensure that Fuel Poverty and energy efficiency programmes are effectively targeted at meeting the needs of rural communities and help in the development of an effective long term strategy for tackling rural Fuel Poverty.
5
EXECUTIVE SUMMARY This summary provides an overview of the key points and recommendations contained in this interim report on the depth and impact of rural Fuel Poverty. Detailed findings, recommendations and all information sources can be found in the main body of the report. 1. ABOUT RURAL FUEL POVERTY A household is said to be in Fuel Poverty if it needs to spend more than 10% of its income on fuel to maintain a satisfactory heating regime (usually 21 degrees for the main living areas and 18 degrees for other occupied rooms). Fuel Poverty is a growing problem
The Government‟s annual report on Fuel Poverty 2009 forecasts 4.6 million households are living in Fuel Poverty across England. This is an increase of 367% since 2003
It is calculated that well in excess of 1 million rural households are living in Fuel Poverty in 2009. That is 1 in 4 of all rural households.
Fuel Poverty is exacerbated in rural areas due to the high number of solid wall properties and off mains gas households and lower than average wages
In 2005 14.6% of households in villages and hamlets were living in Fuel Poverty, compared to a national average of 7%.
36% of all rural households have no mains gas and rely on more expensive fuels such as, LPG and coal to heat their homes.
34% of all rural households are solid wall properties which are more difficult and expensive to insulate. It can cost up to 90% more to deal with energy inefficiency in a rural home compared to urban
50% of homes in sparse areas and 25% in village centres have a SAP (Standard Assessment Procedure for Energy Efficiency Rating) below 30, compared to 8% in urban areas. A SAP rating below 35 is classified as an extremely energy inefficient home and a significant health hazard.
Households in „income poverty‟ in rural areas are much more likely to be in Fuel Poverty than those in urban areas: 44% of the „income poor‟ in rural areas lived in Fuel Poverty in 2005 compared to 26% in urban areas.
Measures aimed at increasing the energy efficiency of hard to treat homes would help alleviate Fuel Poverty and have a big impact on carbon emissions, health and local economic activity
Hard to treat homes (off mains gas and solid wall) which are mainly in rural areas account for over 50% of the UK‟s total carbon emissions from housing.
Cardiovascular and respiratory illnesses, such as Asthma, are exacerbated when people are living in cold, damp and poorly ventilated
6
homes. In 2006 hospital admissions for pneumonia for people between the ages of 60-80 cost the NHS almost a quarter of a million pounds (£243,439). Not all of those admissions were the direct result of poorly heated, damp homes, but the NHS recognises that in many cases these are contributory factors, especially for older people. The costs to the NHS of treating the results of falls, particularly amongst the elderly, are also significant: falls can result from living in cold, damp and poorly ventilated homes.
People living in Fuel Poverty have less money to spend supporting local shops and businesses. Research in Northumberland showed that local businesses/shops were not only struggling to meet their own fuel bills but the knock on effect of people having less disposable income was hitting their business hard.
The Government‟s July 2009 discussion paper “Working together for older people in rural areas” acknowledges that “a higher proportion of older people in the most rural areas live in poor housing and experience Fuel Poverty than in other areas” and the report also confirms that approximately 300,000 older people are living in rural Fuel Poverty.
Current Government programmes aimed at tackling Fuel Poverty are not accessible to many rural communities
The correlation between Warm Front Grants delivered between 2000 and 2008 and levels of Fuel Poverty was strongest in „urban‟ areas and weakest in rural areas – between 2000 and 2008 only 10% of Warm Front Grants were awarded in rural areas. This figure has risen to 15% in 2008/09 however, this is not even making a dent in the number of rural households who need to be lifted out of Fuel Poverty, especially those in hard to treat properties and/or off the gas network.
2. CURRENT BARRIERS TO ADDRESSING RURAL FUEL POVERTY Identifying and understanding the barriers rural households face is crucial to being able to put in place effective solutions. The report details a number of key barriers including:
Higher cost to install energy efficiency measures in rural areas due to greater distances of households and high number of hard to treat properties (solid wall and off mains gas)
High number of hard to treat homes needing more expensive internal and external solid wall insulation which currently is not included in Government Grant Schemes such as Warm Front.
High number of off mains gas properties and difficulties with fitting alternative renewable energy heating systems such as ground source heat pumps which are expensive to install, not always suitable for larger detached properties and sometimes require an upgrade to rural power lines.
Householders unable to afford Top Up Costs (the difference between the total costs of the works and the available grants). Warm Front confirmed
7
that cancellations due to inability of consumer to pay top up costs were high, (prior to the increase in grant rates cancellations of work in urban areas due to top up costs were 26.4%, whilst in rural areas they were 73.6%) and up until 2008 average top up costs were in the region of £875.
Householders (especially the elderly) put off by the disruption that solid wall remedial measures will create
Lack of up to date current data to identify fuel poor households
Lack of awareness by householders on what support is available and confusion on eligibility/form filling etc.
Consumer attitude (especially elderly people) is difficult to change if approached incorrectly re support on offer.
Lack of household awareness of the best energy deals to suit individual households.
High number of very inefficient housing in rural areas with a SAP rating below 35 (which represents an extremely energy inefficient house and a significant health hazard)
Higher energy costs for households that are off the gas network
Private Sector Landlords have no incentive to improve the efficiency of their housing stock as the tenants not the landlords pay the energy bill.
3. SUMMARY OF INTERIM RECOMMENDATIONS The report‟s interim recommendations and solutions to the barriers highlighted above are summarised below. These will be updated with further evidence and information gathered during the pilot studies and included in the final report due in April 2010. Updating the 2003 dataset and Fuel Poverty definitions:
The definition of Fuel Poverty should be urgently reviewed to use actual disposable income after housing costs and equivalised definitions to allow more meaningful comparison in different geographical areas
The Government should develop an updated and centralised database – able to drill down to at least Lower Super Output Area level – the database should be maintained and up-dated at least annually and should include data on solid wall, off mains gas, SAP ratings and the Index of Multiple Deprivation
DWP should include rural/urban analysis in the evaluation and analysis of the Energy Costs Support Scheme
The Government should ensure that Data Sharing Protocols are introduced, (or existing ones applied or extended) between DWP, the NHS and the Local Authorities to aid the focussing of Fuel Poverty measures on those in greatest need
Learning from best practice examples:
The CRC should consider establishing and maintaining a “Rural Fuel Poverty Data Sharing and Best Practice Forum” of practitioners, delivery bodies and policy makers.
8
All levels of Government (central, regional and local), agencies and organisations working on Fuel Poverty should develop common specifications and reporting protocols to enable informed comparisons to be made across projects. This should include not just „measurable‟ results but also learning from the processes employed.
Local Authorities should consistently capture meaningful data such as SAP ratings of properties, Benefits and data from the application of Warm Front Grants so as to establish a true picture of where fuel poor households are in their District or County. The data capture processes used by Durham County Council is a best practice example which other LAs should be encourage to adopt and which could be further improved through better data sharing protocols with DWP and the NHS.
All Rural Local Authorities should be encouraged to carry out a formal Scrutiny Review of the extent and impact of Fuel Poverty across their area as was completed by Eden District Council.
.
Other key solutions and recommendations:
Warm Front and other Government programmes aimed at alleviating Fuel Poverty and improving household energy efficiency should have specific funds, targets and suitable measures for hard to treat and off mains gas homes.
Fuel Poverty grant levels should be increased to recognise the full costs of remedial actions needed for hard to treat properties if they are to effectively tackle rural Fuel Poverty.
The Government should set up an Energy Efficiency Fund for local authorities to bid for money to help tackle the higher cost of installing energy efficiency measures in rural areas
Central Government, Local Authorities and grant organisations should identify ways to train local people to provide information and communications to local communities on the benefits of energy efficiency measures. This could help tackle householder mistrust of energy suppliers or other agencies perceived to be selling something and act as a conduit between consumers and energy suppliers
Government, Local Authorities and other agencies and organisations working on Fuel Poverty should avoid using the term „Fuel Poverty‟ in communications and grant schemes to help avoid the stigma householders feel is attached to the being labelled as „fuel poor‟
Local Government, housing associations, eaga and the energy Saving Trust should investigate sharing information on procurement programmes and prices for renewable energy installations such as ground source heat pumps and look into consortium agreements with a view to negotiating lower installation and unit costs.
Local Authorities should work closely with EAGA and energy installers to look at ways of reducing costs to service remote rural areas such as developing clusters.
Government and Local Authorities should identify better ways to identify and communicate with householders in sparse areas such as looking at new technology that can be housed centrally within an area and reach households via their TVs.
9
4. NEXT STEPS FOR THE PROJECT: PILOT AREAS
The next phase of the Project is to work with local partners in 3 rural Local Authority areas to identify and confirm barriers to take up of Fuel Poverty support and look at how Fuel Poverty is affecting local householders, local service providers (such as the NHS) and the local business economy in each area. It will also seek to monitor impacts in the local economy such as job creation for installers, increased spend with local businesses etc. Post-pilot activity short and longer term evaluation will be undertaken and findings will be provided to Government and key policy makers to help inform them on best practices in rural areas to tackle Fuel Poverty and energy efficiency. The pilot areas the Project will be working with are:
West Midlands Region – Shropshire – Apedale, Corve Valley, Bitterley with Stoke St. Milborough, Upper Corvedale (excluding Diddlebury and Stanton Lacy parishes) and Lawley.
North East Region – Wear Valley, Easington, Teesdale and St. Johns Chapel in Durham
North West Region – North and South Holderness in East Riding of Yorkshire.
The pilot phase will run until April 2010 and a further report will include information, evaluation and recommendations from the pilot activity. However as many of the impacts and uptake of measures will continue after April 2010 further longer term evaluation of the activities and impacts in each of the pilot areas will be gathered and the results captured and fed back to inform Government and other key stakeholders.
10
SECTION TWO
ABOUT THE PARTNERS TO THE PROJECT
The Commission for Rural Communities (CRC) The role of the Commission for Rural Communities (CRC) is to provide well-informed, independent advice to Government and to ensure that policies reflect the real needs of people living and working in rural England, with a particular focus on tackling disadvantage. The Commission has three key functions: - Rural Advocate: The voice for rural people, businesses and communities. Expert Advisor: Giving evidence-based, objective advice to Government and others. Independent Watchdog: Monitoring and reporting on the delivery of policies nationally, regionally and locally. The Commission has long been concerned about rural Fuel Poverty. The Rural Services Network (RSN) The Rural Services Network is a membership body consisting of local authorities (County, District and Unitary), other major public service providers (such as Police, Fire and Rescue, Ambulance, Health Trusts and Primary Care Trusts, Colleges, Housing Association, Bus and Train Operators etc and a host of other rural interest groups including from the private and voluntary/community sectors. It also has a “Community Group” of Parish/Town Councils, Primary Schools, local businesses etc. It communicates (by email) key rural news and analysis to over 18,000 people weekly through its Digests. The Project Steering Group In addition to the CRC and RSN the following bodies are represented on the Project Steering Group:- Age Concern/Help the Aged Centre for Sustainable Energy Department for Business Innovation of Skills (previously DBERR) Department for Energy and Climate Change eaga EDF Energy
11
National Energy Action Scottish Government Fuel Poverty Team The RSN and the CRC would like to take this opportunity of thanking the Steering Group members for their input, help and support.
12
SECTION THREE
ABOUT RURAL FUEL POVERTY
10 WORRYING STATISTICS
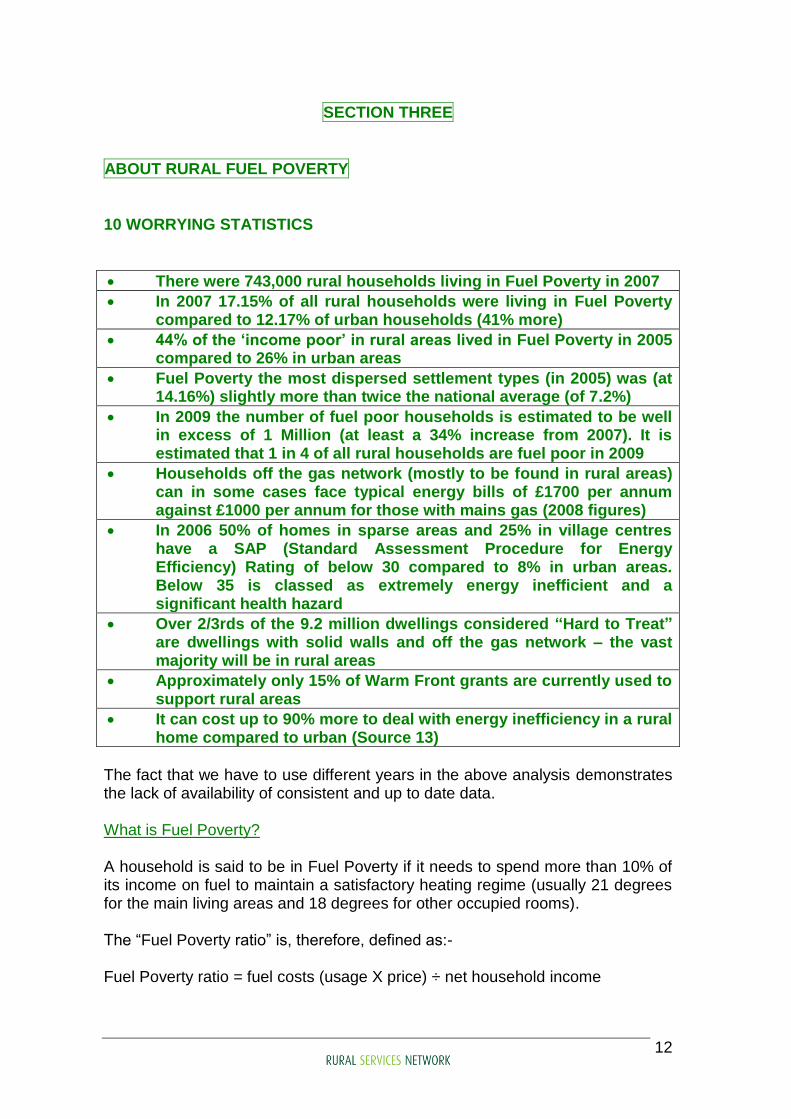
There were 743,000 rural households living in Fuel Poverty in 2007
In 2007 17.15% of all rural households were living in Fuel Poverty compared to 12.17% of urban households (41% more)
44% of the „income poor‟ in rural areas lived in Fuel Poverty in 2005 compared to 26% in urban areas
Fuel Poverty the most dispersed settlement types (in 2005) was (at 14.16%) slightly more than twice the national average (of 7.2%)
In 2009 the number of fuel poor households is estimated to be well in excess of 1 Million (at least a 34% increase from 2007). It is estimated that 1 in 4 of all rural households are fuel poor in 2009
Households off the gas network (mostly to be found in rural areas) can in some cases face typical energy bills of £1700 per annum against £1000 per annum for those with mains gas (2008 figures)
In 2006 50% of homes in sparse areas and 25% in village centres have a SAP (Standard Assessment Procedure for Energy Efficiency) Rating of below 30 compared to 8% in urban areas. Below 35 is classed as extremely energy inefficient and a significant health hazard
Over 2/3rds of the 9.2 million dwellings considered “Hard to Treat” are dwellings with solid walls and off the gas network – the vast majority will be in rural areas
Approximately only 15% of Warm Front grants are currently used to support rural areas
It can cost up to 90% more to deal with energy inefficiency in a rural home compared to urban (Source 13)
The fact that we have to use different years in the above analysis demonstrates the lack of availability of consistent and up to date data. What is Fuel Poverty? A household is said to be in Fuel Poverty if it needs to spend more than 10% of its income on fuel to maintain a satisfactory heating regime (usually 21 degrees for the main living areas and 18 degrees for other occupied rooms). The “Fuel Poverty ratio” is, therefore, defined as:- Fuel Poverty ratio = fuel costs (usage X price) ÷ net household income
13
It follows that whether or not a household is in Fuel Poverty depends (in the main) on the interaction of three factors:- The energy efficiency status of the property The cost of energy Household income The Annual Report on Fuel Poverty Statistics 2009, compiled by the Department of Energy and Climate Change (DECC) showed that in 2007 there were around 4 million fuel poor households in the UK, up from 3.5 million in 2006. In England there were around 2.8 million fuel poor households, up from 2.4 million in 2006 (a 16.66 % increase). Fuel poor amongst vulnerable households for 2007 stood at 3.25 million households (UK) and 2.3 million households (England), up 0.5m and 0.4m respectively from 2006. A vulnerable household is one that contains the elderly, children or someone who is disabled or long term sick. (Source 5) Projections for England indicate a likely upper bound of around 3.6m fuel poor households in 2008 and 4.6m in 2009 (Source 5) NEA says “Fuel Poverty results from a combination of low household income, unaffordable energy costs and inadequate thermal insulation and inefficient and uneconomic heating systems…. Welfare benefit increases for vulnerable groups and other initiatives such as the minimum wage, have addressed some aspects of general poverty and Fuel Poverty, this approach must be considered short term in the context of Fuel Poverty. NEA maintains that energy efficiency is the only rational solution to Fuel Poverty and that Government should direct much greater resources to improving the energy efficiency of the housing stock”.
The Scale of Rural Fuel Poverty The Centre for Sustainable Energy (CSE) (Source 1) calculated, based on the 2003 dataset, that across England rural Fuel Poverty accounts for between 16.6% and 19.56% of Fuel Poverty households depending upon the income definition applied (18.19% based on basic income, 16.6% based on equivalised income and 19.56% based on full income). In 2003 there were 1.25 million fuel poor households in England based on the Government‟s preferred full income definition But it is a very different picture today. As previously mentioned, the Annual Report on Fuel Poverty Statistics 2009 forecasts an upper bound of 4.6 million fuel poor households across England in 2009. The increase of 367% (from 1.25m to 4.6m) in fuel poor households (England) since 2003 is likely to have been more in rural areas than urban given the demographics, the nature of the housing stock, lower earnings levels and off gas properties. Taking the 2003 19.56% (based on full income) of total fuel poor households in England as being in rural areas and applying that to the 4.6 million (projected)
14
fuel poor households in 2009 shows the minimum scale of fuel poor rural households in 2009 as being almost 900,000 (899,760). Given that it is probable that a far greater proportion of fuel poor households live in rural areas the scale of rural Fuel Poverty is – almost certainly, in practice, well in exceess of one million.
Rural Characteristics Impacting on Fuel Poverty Some of the main characteristics of rural areas which impact on the scale of Fuel Poverty in those areas (and the means of addressing the issue) are:- 1. The extent of solid walled properties is much higher in rural areas than
urban (with the exception of London). Solid walled properties represent a significant Fuel Poverty risk factor since they have higher fuel costs than properties built with cavities. They are also much more expensive to insulate than cavity walls (Source 1).
2. The extent of „off gas‟ properties is much higher in rural areas than urban,
with the problem increasing as settlements become more dispersed. Households without gas have to rely on more expensive fuels (Source 1). Estimates from 2008 suggest that households off the gas network can in some cases face typical energy bills of £1,700 per annum against £1,000 for those with mains gas (Source 1).
3. The correlation between Warm Fronts grants delivered between 2000
and 2008 and levels of Fuel Poverty was strongest in „urban‟ areas and weakest in „hamlets‟ (Source 1).
4. Rural areas have lower average wage levels than urban areas (Source
1). Palmer, Macinnes and Kenway (Source 1) found that households in „income poverty‟ in rural areas were much more likely to be in Fuel Poverty than those in urban areas: 44% of the „income poor‟ in rural areas lived in Fuel Poverty in 2005 compared to 26% in urban areas (Palmer et al, 2008). The study concluded that the difference was due to higher fuel costs in rural areas. The „income poor‟ in rural areas were found to spend 15% more on fuel than elsewhere due to larger properties and lower energy efficiency levels. There is no one single definition of „income poverty‟. The most commonly used threshold for low income is a household income that is 60% or less of the average (mean) British household income in that year. Furthermore, the Government‟s July 2009 discussion paper “Working together for older people in rural areas” (produced by the Cabinet Office Social Exclusion Task Force and Defra) acknowledges that “a higher proportion of older people in the most rural areas live in poor housing and experience Fuel Poverty than in other areas” and the report also confirms that approximately 300,000 older people are living in rural Fuel Poverty. It says “Higher rates of Fuel Poverty in rural areas are mostly due to the poor insulation of many homes in these areas and the fact that fewer homes have mains gas, thereby requiring more expensive forms of heating” (Source 7)

15
As a general picture, we can see that all of the factors in the Fuel Poverty ratio present real challenges in rural areas and continue to drive up the scale of rural Fuel Poverty. NB. County maps of the „off gas‟ and „solid wall‟ indicators for all of England‟s nine Government Office regions can be accessed at a „rural Fuel Poverty‟ website: www.ruralfuelpoverty.org.uk. Ward level versions of the two data bases can also be accessed from that website. Statistical analysis of the scale of Fuel Poverty varies dependant upon whether “full income” or „basic‟ or „basic equivalised‟ definitions are used. Nevertheless, (Source 1) “Fuel Poverty” appears to be significantly higher in the more remote rural settlement types (villages and hamlets) whichever (income) definition is used”. The 2005 English House Condition Survey found that Fuel Poverty (full income) in villages and hamlets (the two most dispersed settlement types) was 14.6% - slightly more than twice the national average of 7.2%. The comparable figures under the basic income definition were 13.4% in villages and hamlets and 8% in rural areas (Source 1). However, the number of households living in rural Fuel Poverty has more than doubled since 2005. It is currently estimated that some 1.1 million rural households are in Fuel Poverty (Source 2). That is a staggering one in four rural households that spend more than 10% of their income on fuel - and will still struggle to keep their homes warm. And this is not just about money and impact on the environment. Research shows that respiratory and cardiovascular illnesses can be exacerbated when living in a cold, damp and poorly ventilated home (Source 2). The 2006 English House Condition Survey found that 50% of homes in sparse areas and 25% in village centres have a SAP rating of below 30 compared to 8% in urban areas. To put this in context, a SAP (Standard Assessment Procedure for Energy Efficiency) below 35 is classified as an extremely energy inefficient home and a significant health hazard. (Source 6) The Multiple Impacts of Rural Fuel Poverty Links with Poor Health The link between poor health and people living in cold, damp and poorly ventilated homes cannot, and should not be ignored, Cardiovascular and respiratory illnesses, such as asthma, are known to be exacerbated when people are living in cold, damp and poorly ventilated homes. The cost to the National Health Service is tremendous. A two day stay to treat hypothermia in an NHS hospital costs an average of approximately £1400. The average length of stay for people with hypothermia is, 18.9 days – giving an average treatment costs to the NHS of £13,230, In 2006 1759 people across the UK between the ages of 60 -80 were admitted through
16
Accident and Emergency with pneumonia which represents 34,777 bed days giving a staggering cost to the NHS of almost a quarter of a million pounds (£243,439). Clearly not all of those admissions were the direct result of poorly heated, damp homes, but Regional NHS colleagues have stated that in many cases these are contributory factors, especially in relation to older people. Falls in later life are important because they can cause injury. Many older people especially women suffer from bone weakness – osteoporosis – which means that a fall can result in a fragility fracture, commonly of wrist, upper arm, pelvis or hip. Age Concern report that hip fracture is the most serious
It is the most common cause of accidental death in older people ;
30% of people sustaining a hip fracture die within a year; 14,000 in total;
Half will become at least partly dependent on others, often needing long-term care.
Whilst we have not found specific evidence linking the above deaths and dependency issues with hip fractures it is likely that the fractures were part of the cause in many instances. Age Concern has confirmed at a Steering Group meeting that many falls amongst the elderly can be attributed to poor living conditions such as cold, damp and poorly ventilated homes. Each year, 35% of people over 65 and 45% of people over 80 living in the community fall. Between 10 and 25% will sustain a serious injury. Half of women and 1:6 of men will suffer a fragility fracture at some point. Nationally, hip fracture occurs in 60,000 people, costing the NHS approximately £1.7 billion a year. The incidence of hip fracture is projected to increase by 50 per cent by 2020. The Department of Health‟s South East Regional Public Health Group in December 2009 issued a Fact Sheet relating to Health and Winter Warmth. (Source 8). It refers to the issue being important because (inter alia):- “Excess winter deaths contribute to 1 in 20 of all deaths per year;
there were an estimated 36,700 excess winter deaths in England and Wales in 2008/9 – a much higher level than in most of Europe, including countries with much colder winters such as Norway and Russia.
Cold weather increases hospital admissions;
after a „cold snap‟, there is a 2 day lag before there is an increase in deaths from heart disease, a 5 day lag for deaths from stroke and a 12 day lag for both deaths and admissions for COPD. For each excess winter death, there is an estimated 8 emergency admissions each winter.
Promoting winter warmth brings multiple health gains;
Improves self rated health by approximately 50%, results in fewer visits to a general practitioner by 27% and fewer days off work by 38%
17
improves householders‟ mental health - residents with warm bedrooms are 50% less likely to suffer depression and anxiety than those with cold bedrooms
reduces stress – people in fuel poverty were 2.5 times more likely to report high or moderate stress than people who could afford their fuel bills. For every 10,000 properties improved by Warm Front over 3,000 people will be relieved of stress or depression
improves children‟s educational achievements, school attendance (50% reduction in self reported days off school following insulation measures), and reduces the incidence of childhood asthma
The vulnerable are most at risk – the elderly, people with disabilities and families with young children;
a 1% increase in fuel costs increases fuel poverty by 40,000 households” Links with Debt In 2008 energywatch reported that over 2 million consumers were in debt to their fuel suppliers.. The National Debt Agency also confirmed in 2007 (Source 11) that one of the biggest areas of debt was fuel debt. People have been known to take out loans to buy LPG because they had to pay out a lump sum to top up their tanks. Many older people were lulled into a payment scheme for their gas and electricity that allowed them to pay a set amount each month and were, in effect, told they were able to use as much energy as they liked.- only to find at the end of one/two years that they were deemed to be paying too little. Not only did they get asked to pay lump sums back, their monthly payments went up in some cases by 50-100% and they went on to higher energy tariffs. They could not switch to a cheaper tariff as they were deemed “high users”. (Sources 11 & 12) . Both Citizen‟s Advice Bureau and the Money Advice Trust debt agencies have seen large increases in clients turning to them with energy debt. The National Debt Agency also confirmed (Source 11) that people who had fuel debt were more than likely to have other debts and therefore, living in general poverty. Impact of Lack of Disposable Income The lack of adequate disposable income forces many people to make choices between in some cases heating or eating – this is especially true of families on low income and older people living on their own. By default this will affect the money available to support the local business economy. An example of the impact on the local business economy has been reported from a campaign that was carried out in Northumberland in 2007 (Source 12) which showed that local businesses/shops were not only struggling to meet their own fuel bills but the knock on effect of people having less disposable income was hitting their business hard. The research included speaking to older people living in rural areas and what became clear was how they just put up with their lot. Many didn‟t claim pension credits and other benefits that they were eligible

18
for; hence many of them lost out on grants that could have made a big difference to their wellbeing. They also accepted the fuel tariffs that they were on. When asked why they didn‟t claim e.g. pension credits, many said they were okay and didn‟t need any more money and stated that it was too much hassle filling out forms etc. However, when told that their local shops (such as “John the Butcher”, “Ann in the Bakers” etc) were suffering because of less money being spent in the community, and on being asked to consider if they had more money would they spend it in the local economy – the answer from almost all of the 200 people interviewed was a resounding yes. Their attitude and behaviour towards increasing their income changed. Not only did they voice their support, 70% took action to find out what they were eligible to claim. Links with Social Deprivation Many families who are living in general poverty, including Fuel Poverty, will be unable to afford the usual social activities that other families take for granted, such as going to local clubs, swimming, school trips and other types of community activity. This can have a very damaging effect on the self esteem of parents and their children. Steering Group colleagues are aware of research showing that there is a link to academic achievement from poorly heated, damp housing – children in fuel poor households losing time in school due to ill health and the benefits of warmer homes for study/home work have been cited as examples. This is backed up by Source 8 A comment made to this Project from ACRE‟s Consultant Community Halls Advisor was that those suffering from Fuel Poverty go out of their homes and into community halls, being in need of community activities which reduces isolation and provides much needed services and support.. There is a problem, however, in that over 50% of the stock of community buildings in rural areas is more than 70 years old, much of it solid walled and hard to heat and efforts at energy efficiency are happening, but it is patchy and with very little funding being available. Installing efficient heating or heating controls is an area of need – vulnerable elderly people need warmth and if they come out of their home into a hall which is only just beginning to warm up could be very damaging to their health. Heating is one of the biggest running costs for community halls and users are being hit by hikes in energy prices causing hire charges to rise. How is the extent of Fuel Poverty Calculated? The key data source used to derive estimates of Fuel Poverty in England is the English House Condition Survey (EHCS). The 2003 dataset is the application of the 2003 EHCS data to the 2001 Census data which became available in 2003. This survey provides information on the changing condition and composition of the housing stock and the characteristics of the households living in different types of dwellings. Originally carried out (by local housing authorities) every five years until 2001, the EHCS now operates on a continuous format in which a population of approximately 8,000 dwellings is sampled each year. For the majority of
19
analysis, including the monitoring of Fuel Poverty in England, two years datasets are combined to provide data on some 16,000 dwellings/households. The EHCS comprises three components: an interview survey, a physical survey and a market value survey. To calculate Fuel Poverty household level information on fuel costs and income are also required. Two different classifications of incomes are used, and from these two different poverty ratios are calculated. The official headline figure uses the full income definition whilst the basic income definition is also produced. For both definitions, income is measured net of income tax and national insurance. The basic income is a measure of household income and is calculated by
adding the personal incomes of every member of the household together plus any benefit payments that the household receives (from private source, state benefits and savings) but excludes income related directly to housing;
The full income definition is the official headline figure. In addition to the
basic income measure, it includes income related directly to housing (i.e. Housing Benefit, Income Support for Mortgage Interest, Mortgage Payment Protection Insurance, Council Tax Benefit).
Fuel costs are modelled, rather than based on actual spending. They are calculated by combining the fuel requirements of the household with the corresponding fuel prices. The key goal in the modelling is to make sure that the household achieves the adequate level of warmth set out in the definition of Fuel Poverty, whilst also meeting their other domestic fuel requirements. Fuel prices per unit are calculated using data supplied by DECC at a regional level and split by payment type. A household‟s location, fuel mix (gas, standard electricity, economy 7 electricity, heating oils etc) and fuel payment method (direct debit, standard credit and prepayment) are matched against the fuel price data to give the cost per unit of fuel required. Hard to Treat Properties (HTT) in England and CO2 Emissions In England, there are currently 9.2 million dwellings that can be considered HTT, accounting for 43% of the total stock. Within this, dwellings with solid walls and off the gas network make up the largest component (6.6 million dwellings which equates to 72% of the total HTT housing stock). Nearly 84% of this HTT stock is in the private sector; the private rented tenure comprises the greatest proportion of HTT dwellings with more than 50% of this sector being designated as HTT. In its current state, under the specified SAP heating regime, the HTT stock in England emits 62 million tonnes of carbon dioxide (MtCO2) per annum. This compares to total emissions of 123 MtCO2 from the stock as a whole. The HTT stock is therefore responsible for emitting slightly over half of domestic notional CO2 emissions, despite representing only 42% of the dwelling stock. (Source 4)
20
Energy Costs for those without access to the Gas Network There is quite a lot of confusion and misunderstanding about the costs of different heating fuels, with people often bracketing heating oil and LPG together. In each of the 6 years from October 2003 to October 2009 the costs of space and water heating for an average three bedroom house in the UK were very significantly higher using LPG (conventional boiler) than other heating sources. For most of that time, and ever since May 2006 coal (anthracite grains) was the cheapest followed until May 2009 by gas (conventional boiler). There was a significant spike in costs using oil (conventional boiler) from October 2007 to October 2008 but in October 2009 the costs using oil were slightly less than using gas. (Source 14) However, since October 2009 the price of oil has been increasing quite aggressively – since December it has increased from about 39p per litre to around 47p per litre. Further increases are projected over 2010. The Federation of Petroleum Suppliers Ltd acknowledges that charges for oil do depend to some extent on the size of delivery and smaller deliveries attract a higher price per litre when delivery costs are factored in. There are savings to be made for consumers where deliveries are in the same locality. The Federation of Petroleum Suppliers Ltd has also commented that oil prices change on a daily basis, sometimes over the day as well and that it has to be remembered that if a distributor has bought in a falling market and has been kept in storage rather than sold on immediately, then the distributor may have to charge customers more than oil newly purchased by another distributor, if he is to avoid selling at a loss. There are also significant differences in space and water heating costs (with the exception of where coal is used) at the regional level with consumption volumes, and therefore costs, for colder areas such as Northern England higher than elsewhere (Source 14)
SECTION FOUR
UPDATING THE 2003 DATASET
Part of the Project actions was to consider what information is available to update the 2003 dataset on the scale of Fuel Poverty (see „How is the extent of Fuel Poverty Calculated‟ in Section Three for a description of what comprises the dataset) and to consider if other data may engender a more holistic view of the scale of the issue in rural areas and its multiple effects. The findings concluded this information is not readily available and whilst organisations such as Centre for Sustainable Energy (CSE) and National Energy Action (NEA) can apply an uplift based on fuel and inflation increases since 2003, which does
21
provide a fairly accurate national picture, it is still at best an estimate. This Project will be looking to ascertain from relevant partners what resources and actions would be required to have an updated and maintained dataset that could be used to monitor the effectiveness of initiatives by Government, local authorities (LA‟s) and partners in relation to Fuel Poverty and energy efficiency. Perceived benefits would be:
The ability to highlight and share best practice amongst Local Authorities
Be able to identify areas that clearly need to be doing more to tackle Fuel Poverty and energy efficiency
Provide guidance on better use of Government funding and grant initiatives.
The Centre for Sustainable Energy produced a report to the eaga Partnership Charitable Trust (August 2008) entitled “Quantifying rural Fuel Poverty” One of its recommendations (recommendation 8) was:-
“The Government should develop both „After Housing Costs‟ (AHC) and equivalised definitions of Fuel Poverty. This would enable more meaningful comparison of Fuel Poverty in different geographical areas (since variations in housing costs will not affect Fuel Poverty rates); better evaluation of the targeting effectiveness of Fuel Poverty programmes (since equivalised incomes more closely approximate benefit eligibility criteria); and improved comparison of Fuel Poverty with other forms of deprivation (which tend to use both equivalised and AHC definitions of income)”
The Government‟s preferred definition of household income includes Housing Benefit and Income Support for Mortgage Interest in the calculation of household resources, although Fuel Poverty estimates are also published using a formula that excludes housing subsidies. National Energy Action‟s (NEA) view is that neither of these definitions is acceptable or rational and that the only sensible definition of income is one that uses actual disposable income after housing costs.
Background – the need to accurately remodel the distribution of Fuel Poverty Ian Preston of CSE has commented to this Project:- “The current English FPI (Fuel Poverty Index) is based on three main data sources: the 2001 Census, the 2003 English House Condition Survey (EHCS); and the 2004 version of the national property database, RESIDATA. More up-to-date data is now available for local population (via the mid-2007 post-census small area population estimates), family income (from the 2007-08 Family Resources Survey) and housing standards via the 2006 EHCS.
22
In addition, since 2003 gas and electricity prices have risen significantly with a cumulative change of 133% and 77% respectively. Fuel Poverty in England has subsequently almost trebled from 1.2 million in 2003 to 3.2 million in the second quarter of 2008 [and, as stated earlier in this report, is forecast to increase by 367% on the 2003 figure to 4.6 million fuel poor households across England in 2009 – over one million of which are in rural areas]. It is important to recognise that due to the multi-faceted nature of Fuel Poverty, the impact of these fuel price rises will not be consistent across all households, housing types and geographical areas (i.e. the demographics of Fuel Poverty cannot be assumed to remain the same with levels simply tripling in all geographical areas). The impact of changes in fuel prices on Fuel Poverty is particularly marked due to the critical relationship between the general distribution of fuel costs in the housing stock and the distribution of incomes in the household population. As fuel prices rise and a higher income is required to avoid being fuel poor, an increasingly large and accelerating number of households are brought into Fuel Poverty. For example, a high number of households that are now in marginal Fuel Poverty are unlikely to qualify for means tested benefits and thus free energy efficiency measures. The updated Fuel Poverty indicator will therefore need to review the model variables included in the regression analyses. If the FPI is developed for 2009 then the model will need to include additional data on benefits and income to reflect the increased importance of income as a predictor of Fuel Poverty. We understand that DECC has commissioned Bristol University to review the composition of the Fuel Poverty Index and that Bristol University has reported its findings. CSE has intimated its intention to Peer Review the Bristol report. This Project will review the findings from both of these two studies in its final report. INTERIM RECOMMENDATIONS
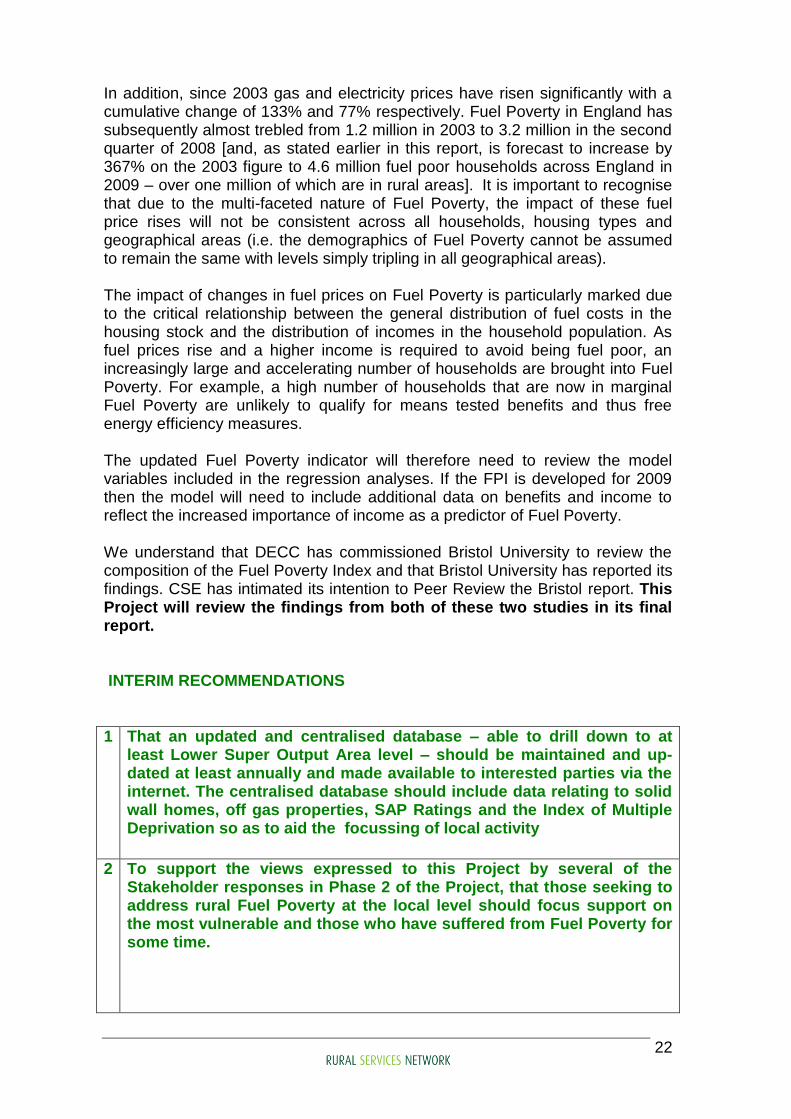
1 That an updated and centralised database – able to drill down to at least Lower Super Output Area level – should be maintained and up-dated at least annually and made available to interested parties via the internet. The centralised database should include data relating to solid wall homes, off gas properties, SAP Ratings and the Index of Multiple Deprivation so as to aid the focussing of local activity
2 To support the views expressed to this Project by several of the Stakeholder responses in Phase 2 of the Project, that those seeking to address rural Fuel Poverty at the local level should focus support on the most vulnerable and those who have suffered from Fuel Poverty for some time.
23
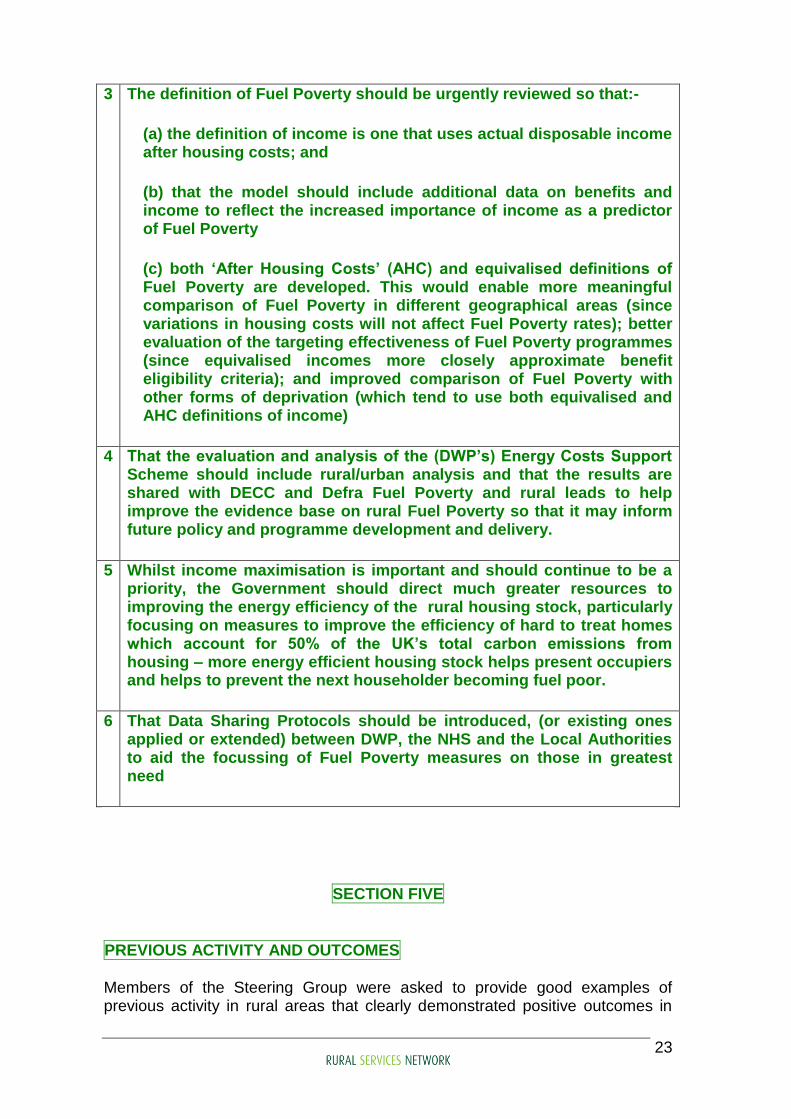
3 The definition of Fuel Poverty should be urgently reviewed so that:-
(a) the definition of income is one that uses actual disposable income after housing costs; and
(b) that the model should include additional data on benefits and income to reflect the increased importance of income as a predictor of Fuel Poverty
(c) both „After Housing Costs‟ (AHC) and equivalised definitions of Fuel Poverty are developed. This would enable more meaningful comparison of Fuel Poverty in different geographical areas (since variations in housing costs will not affect Fuel Poverty rates); better evaluation of the targeting effectiveness of Fuel Poverty programmes (since equivalised incomes more closely approximate benefit eligibility criteria); and improved comparison of Fuel Poverty with other forms of deprivation (which tend to use both equivalised and AHC definitions of income)
4 That the evaluation and analysis of the (DWP‟s) Energy Costs Support Scheme should include rural/urban analysis and that the results are shared with DECC and Defra Fuel Poverty and rural leads to help improve the evidence base on rural Fuel Poverty so that it may inform future policy and programme development and delivery.
5 Whilst income maximisation is important and should continue to be a priority, the Government should direct much greater resources to improving the energy efficiency of the rural housing stock, particularly focusing on measures to improve the efficiency of hard to treat homes which account for 50% of the UK‟s total carbon emissions from housing – more energy efficient housing stock helps present occupiers and helps to prevent the next householder becoming fuel poor.
6 That Data Sharing Protocols should be introduced, (or existing ones applied or extended) between DWP, the NHS and the Local Authorities to aid the focussing of Fuel Poverty measures on those in greatest need
SECTION FIVE
PREVIOUS ACTIVITY AND OUTCOMES
Members of the Steering Group were asked to provide good examples of previous activity in rural areas that clearly demonstrated positive outcomes in
24
tackling Fuel Poverty and increasing energy efficiency. The synergy across the responses showed that a community based approach working with local partners resulted in households reducing their fuel bills, increased energy efficiency and brought more disposable income into the local areas. These outcomes will help to inform this Project on best approaches to adopt within the pilot areas. Case studies of best practice examples are attached below (see pages 35 -45) as an Appendix to this Report.
INTERIM RECOMMENDATIONS
7 The CRC should consider establishing and maintaining a “Rural Fuel Poverty Data Sharing and Best Practice Forum” of practitioners, delivery bodies and policy makers.
8 That future projects should all be encouraged to capture the same type of data and learning to a common „specification‟ so that informed comparisons can be made across projects. This should include not just „measurable‟ (such as reduced fuel bills) but also learning from the processes employed. Future projects should also ensure that sufficient resources are available to enable robust evaluation of the project.
9 That Local Authorities be encouraged to capture meaningful data such as SAP ratings of properties, Benefits and data from the application of Warm Front Grants so as to establish a true picture of where fuel poor households are in their District or County. They can then start to identify areas where an economy of scale approach to reduce overhead costs such as travel and installation costs and drive down renewable energy costs. The Durham County Council database is commended as good practice which could be developed even further with better sharing of key data from DWP and other relevant partners such as the NHS.
In this regard it is considered that the present National Indicator 187 “ Tackling fuel poverty - % of people receiving income based benefits living in houses with a low and high energy rating” should be reviewed so that a more robust common data system is created across the relevant Las. (NB nationally only 44 of the 152 Local Area Agreements include an improvement target for NI 187, about 15 of which are rural).
10 That rural Local Authorities should be encouraged to carry out a formal Scrutiny Review of the extent and impact of Fuel Poverty across their area and the actions the authority is taking to remedy the problems. This was carried out by Eden District Council and is commended as good practice.
11 Warm Front and other Government programmes aimed at alleviating
Fuel Poverty and improving household energy efficiency should
25
provide measures suitable for hard to treat homes and at grant levels
which recognise the costs of remedial actions if it is to effectively
tackle rural Fuel Poverty. (The results reported in Case Study 6 in the
Appendix to this report show that Air Source Heat Pumps provide the
greatest overall value for money in terms of lifting households out of
Fuel Poverty per £1m capital spend)
SECTION SIX
BARRIERS AND POTENTIAL SOLUTIONS
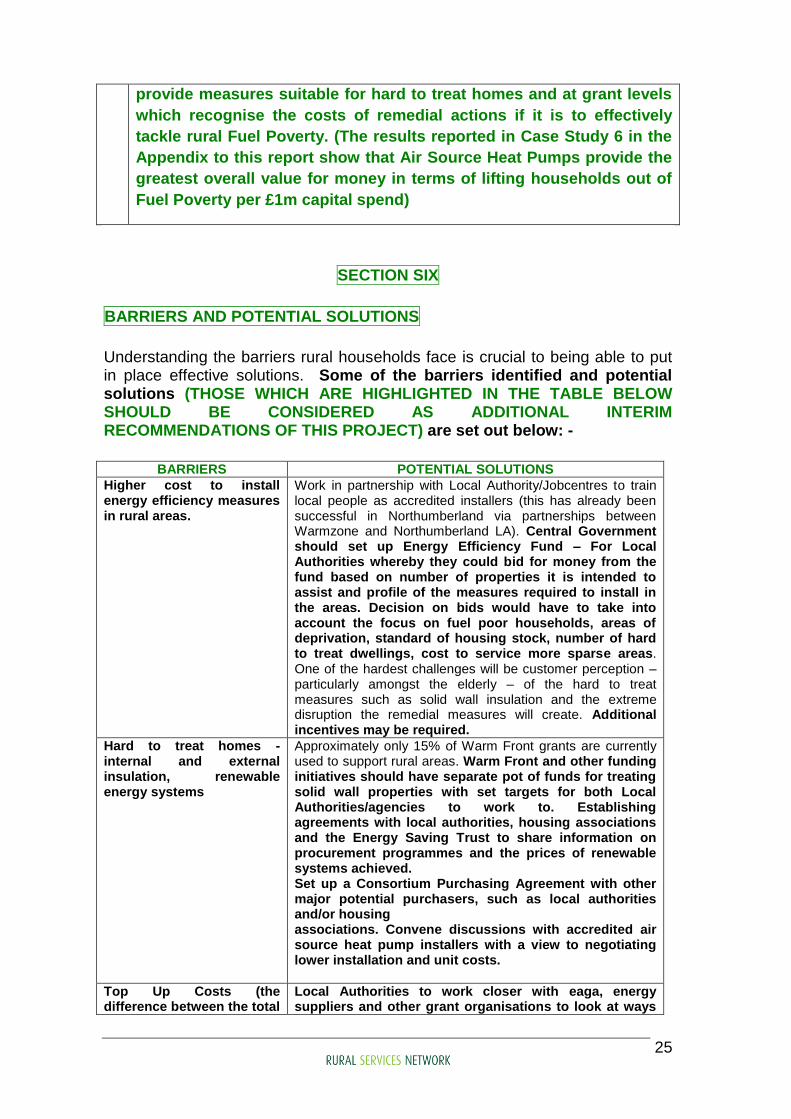
Understanding the barriers rural households face is crucial to being able to put in place effective solutions. Some of the barriers identified and potential solutions (THOSE WHICH ARE HIGHLIGHTED IN THE TABLE BELOW SHOULD BE CONSIDERED AS ADDITIONAL INTERIM RECOMMENDATIONS OF THIS PROJECT) are set out below: -
BARRIERS POTENTIAL SOLUTIONS
Higher cost to install energy efficiency measures in rural areas.
Work in partnership with Local Authority/Jobcentres to train local people as accredited installers (this has already been successful in Northumberland via partnerships between Warmzone and Northumberland LA). Central Government should set up Energy Efficiency Fund – For Local Authorities whereby they could bid for money from the fund based on number of properties it is intended to assist and profile of the measures required to install in the areas. Decision on bids would have to take into account the focus on fuel poor households, areas of deprivation, standard of housing stock, number of hard to treat dwellings, cost to service more sparse areas. One of the hardest challenges will be customer perception – particularly amongst the elderly – of the hard to treat measures such as solid wall insulation and the extreme disruption the remedial measures will create. Additional incentives may be required.
Hard to treat homes - internal and external insulation, renewable energy systems
Approximately only 15% of Warm Front grants are currently used to support rural areas. Warm Front and other funding initiatives should have separate pot of funds for treating solid wall properties with set targets for both Local Authorities/agencies to work to. Establishing agreements with local authorities, housing associations and the Energy Saving Trust to share information on procurement programmes and the prices of renewable systems achieved. Set up a Consortium Purchasing Agreement with other major potential purchasers, such as local authorities and/or housing associations. Convene discussions with accredited air source heat pump installers with a view to negotiating lower installation and unit costs.
Top Up Costs (the difference between the total
Local Authorities to work closer with eaga, energy suppliers and other grant organisations to look at ways
26
BARRIERS POTENTIAL SOLUTIONS
costs of the works and the available grants)
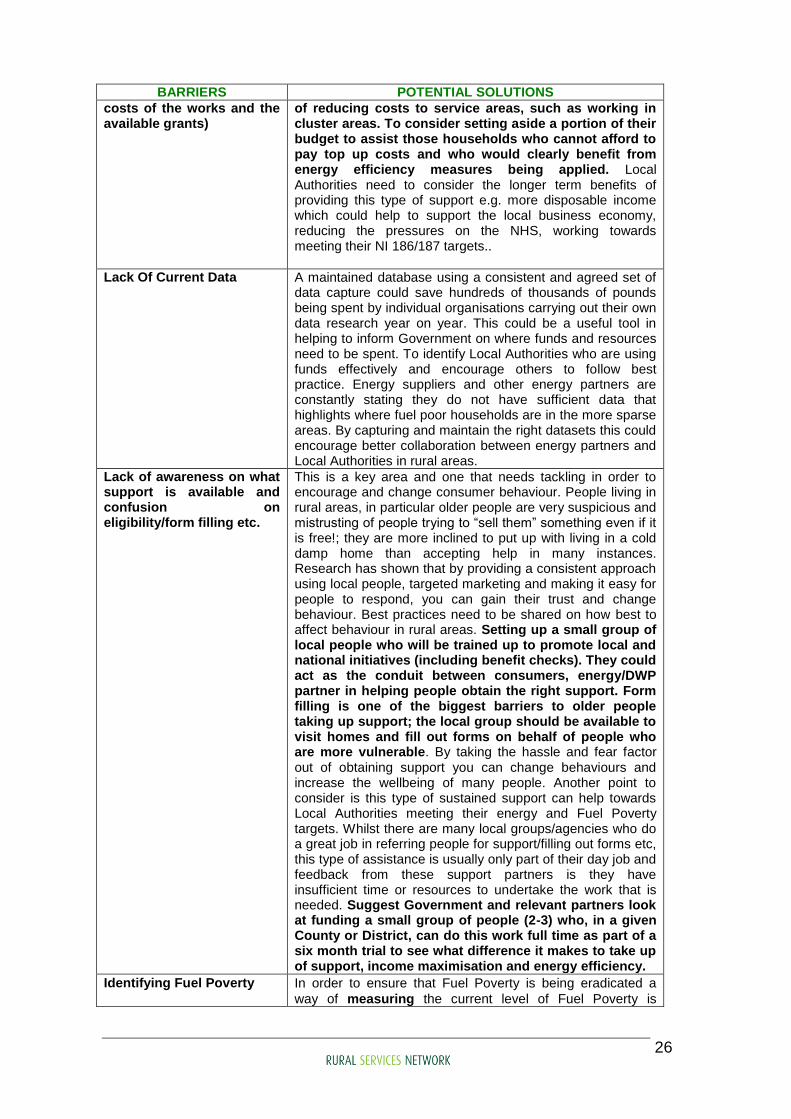
of reducing costs to service areas, such as working in cluster areas. To consider setting aside a portion of their budget to assist those households who cannot afford to pay top up costs and who would clearly benefit from energy efficiency measures being applied. Local Authorities need to consider the longer term benefits of providing this type of support e.g. more disposable income which could help to support the local business economy, reducing the pressures on the NHS, working towards meeting their NI 186/187 targets..
Lack Of Current Data
A maintained database using a consistent and agreed set of data capture could save hundreds of thousands of pounds being spent by individual organisations carrying out their own data research year on year. This could be a useful tool in helping to inform Government on where funds and resources need to be spent. To identify Local Authorities who are using funds effectively and encourage others to follow best practice. Energy suppliers and other energy partners are constantly stating they do not have sufficient data that highlights where fuel poor households are in the more sparse areas. By capturing and maintain the right datasets this could encourage better collaboration between energy partners and Local Authorities in rural areas.
Lack of awareness on what support is available and confusion on eligibility/form filling etc.
This is a key area and one that needs tackling in order to encourage and change consumer behaviour. People living in rural areas, in particular older people are very suspicious and mistrusting of people trying to “sell them” something even if it is free!; they are more inclined to put up with living in a cold damp home than accepting help in many instances. Research has shown that by providing a consistent approach using local people, targeted marketing and making it easy for people to respond, you can gain their trust and change behaviour. Best practices need to be shared on how best to affect behaviour in rural areas. Setting up a small group of local people who will be trained up to promote local and national initiatives (including benefit checks). They could act as the conduit between consumers, energy/DWP partner in helping people obtain the right support. Form filling is one of the biggest barriers to older people taking up support; the local group should be available to visit homes and fill out forms on behalf of people who are more vulnerable. By taking the hassle and fear factor out of obtaining support you can change behaviours and increase the wellbeing of many people. Another point to consider is this type of sustained support can help towards Local Authorities meeting their energy and Fuel Poverty targets. Whilst there are many local groups/agencies who do a great job in referring people for support/filling out forms etc, this type of assistance is usually only part of their day job and feedback from these support partners is they have insufficient time or resources to undertake the work that is needed. Suggest Government and relevant partners look at funding a small group of people (2-3) who, in a given County or District, can do this work full time as part of a six month trial to see what difference it makes to take up of support, income maximisation and energy efficiency.
Identifying Fuel Poverty
In order to ensure that Fuel Poverty is being eradicated a
way of measuring the current level of Fuel Poverty is

27
BARRIERS POTENTIAL SOLUTIONS
required. This can then be monitored to ensure that the
numbers of householders suffering from Fuel Poverty is
actually being reduced.
Measuring Fuel Poverty accurately is, however, extremely
difficult, as it requires information on:
income level of the household
energy efficiency levels of their home
how the occupants control their heating system and
pay for fuel.
Since it is unlikely that this information will ever be to hand
for each specific household, it becomes necessary to use
indicators of Fuel Poverty rather than true measures.
One indicator is the energy rating of the property e.g. SAP
rating. Properties with a low energy rating are more likely to
have occupants in Fuel Poverty than those with a high
energy rating. The SAP and the NHER are both indicators
that can assist with eradicating Fuel Poverty by drawing
attention to those properties most likely to be prone to
households in Fuel Poverty.
Income levels can be obtained through housing needs &
stock surveys but households are usually reluctant to reveal
true household income information.
All Local Authorities are required to report on National Indicator 187 (% of people receiving income based benefits living in homes with low and high energy efficiency rating) to monitor performance to eradicate Fuel Poverty.
Price of Fuel – Consumer
Awareness
Ensuring consumers are made aware of the best options
available to them. The cheapest payment method can be by
direct debit or on line but this obviously prohibits those
without a bank account or access to a computer.
Many fuel companies have prompt payment discounts. As
highlighted below householders in Fuel Poverty often tend to
use prepayment meters to pay off debts or to help them
budget which is the most expensive form of paying for fuel.
Most fuel companies charge a premium per unit of energy
consumed as well as an increased standing charge. All fuel
companies have alternative budgeting methods, which work
out cheaper. Social tariffs are another tool in helping
vulnerable customers to afford their fuel bills.
A social tariff is taken to mean any special payment
arrangement, over and above those specified by supplier‟s
Licence Conditions, devised with a view to benefiting
disadvantaged energy consumers. The Government‟s
commitment to eradicate Fuel Poverty by 2016 has focused
the minds of suppliers, and the energy regulator Ofgem, on
how innovative tariffs can contribute to this wider policy
objective. Consequently there have been a number of tariff
initiatives developed by companies to address specific
elements of Fuel Poverty. Householders need to have this information to hand before
28
BARRIERS POTENTIAL SOLUTIONS
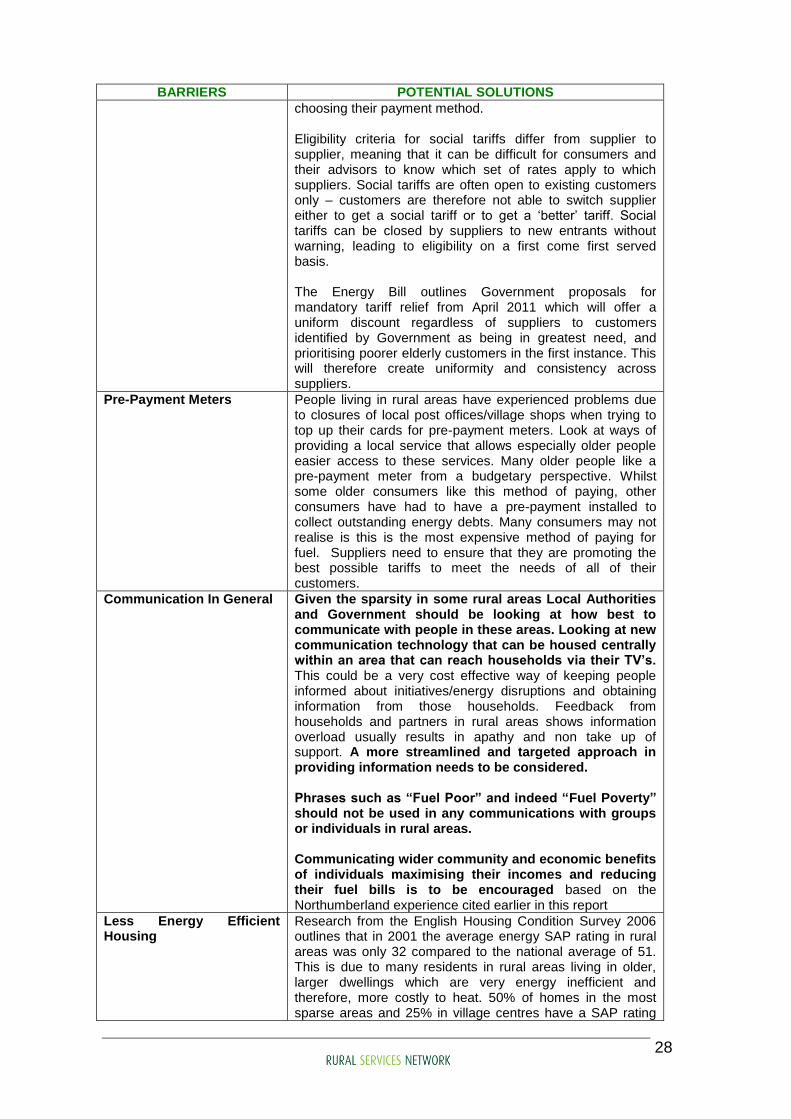
choosing their payment method. Eligibility criteria for social tariffs differ from supplier to supplier, meaning that it can be difficult for consumers and their advisors to know which set of rates apply to which suppliers. Social tariffs are often open to existing customers only – customers are therefore not able to switch supplier either to get a social tariff or to get a „better‟ tariff. Social tariffs can be closed by suppliers to new entrants without warning, leading to eligibility on a first come first served basis. The Energy Bill outlines Government proposals for mandatory tariff relief from April 2011 which will offer a uniform discount regardless of suppliers to customers identified by Government as being in greatest need, and prioritising poorer elderly customers in the first instance. This will therefore create uniformity and consistency across suppliers.
Pre-Payment Meters People living in rural areas have experienced problems due to closures of local post offices/village shops when trying to top up their cards for pre-payment meters. Look at ways of providing a local service that allows especially older people easier access to these services. Many older people like a pre-payment meter from a budgetary perspective. Whilst some older consumers like this method of paying, other consumers have had to have a pre-payment installed to collect outstanding energy debts. Many consumers may not realise is this is the most expensive method of paying for fuel. Suppliers need to ensure that they are promoting the best possible tariffs to meet the needs of all of their customers.
Communication In General Given the sparsity in some rural areas Local Authorities and Government should be looking at how best to communicate with people in these areas. Looking at new communication technology that can be housed centrally within an area that can reach households via their TV‟s. This could be a very cost effective way of keeping people informed about initiatives/energy disruptions and obtaining information from those households. Feedback from households and partners in rural areas shows information overload usually results in apathy and non take up of support. A more streamlined and targeted approach in providing information needs to be considered. Phrases such as “Fuel Poor” and indeed “Fuel Poverty” should not be used in any communications with groups or individuals in rural areas. Communicating wider community and economic benefits of individuals maximising their incomes and reducing their fuel bills is to be encouraged based on the Northumberland experience cited earlier in this report
Less Energy Efficient Housing
Research from the English Housing Condition Survey 2006 outlines that in 2001 the average energy SAP rating in rural areas was only 32 compared to the national average of 51. This is due to many residents in rural areas living in older, larger dwellings which are very energy inefficient and therefore, more costly to heat. 50% of homes in the most sparse areas and 25% in village centres have a SAP rating

29
BARRIERS POTENTIAL SOLUTIONS
below 30 compared to just 8% of homes in urban areas. A SAP rating below 35 represents a significant health hazard under the Housing Health and Safety Rating System. Better data capture at LA level needs to be undertaken to identify these households and targeted funding being made available to treat “hard to treat” homes.
Higher Energy Costs Households who are off the gas network are more vulnerable to price increases as they have a more limited choice of suppliers, are not able to negotiate dual fuel deals and cannot easily shop around for the best prices. Around a quarter of households in England who use oil or LPG to heat their homes are in Fuel Poverty. Currently the minimum quantity consumers can buy is by national Regulation 500 litres. (Source 3) a time. For households on low incomes this can see them getting into debt; thus ending up paying high cost for their fuel plus the high cost of interest on their debt. Oil distributors do have monthly payment schemes but obviously if a customer has run up large deficits on their account distributors are reluctant to extend credit further. There needs to be a centralised system set up that allows fuel poor and low income households to purchase and have oil delivered as and when needed. Barriers (if any) to local authorities setting up and administering local purchase and distribution of domestic heating oil (so as to achieve bulk purchase discounts) should be examined and where possible removed. Community based energy solutions should be supported and wood fuel‟s potential as a domestic heating source should be considered
Private Sector Landlords dlords Incentives should be found to encourage private sector landlords to improve the energy efficiency of their tenanted stock despite the fact that it is tenants rather than the landlords who will feel the financial benefit of reduced fuel bills.
Better incentives should be found to encourage private sector landlords to improve the energy efficiency of their tenanted stock despite the fact that it is the tenants rather than the landlords who will feel the direct financial benefit of reduced fuel bills
Acknowledgements: Thank you to NEA, CSE, eaga, EDF, Warmzone and Rural Services Network for contributing to the above data.
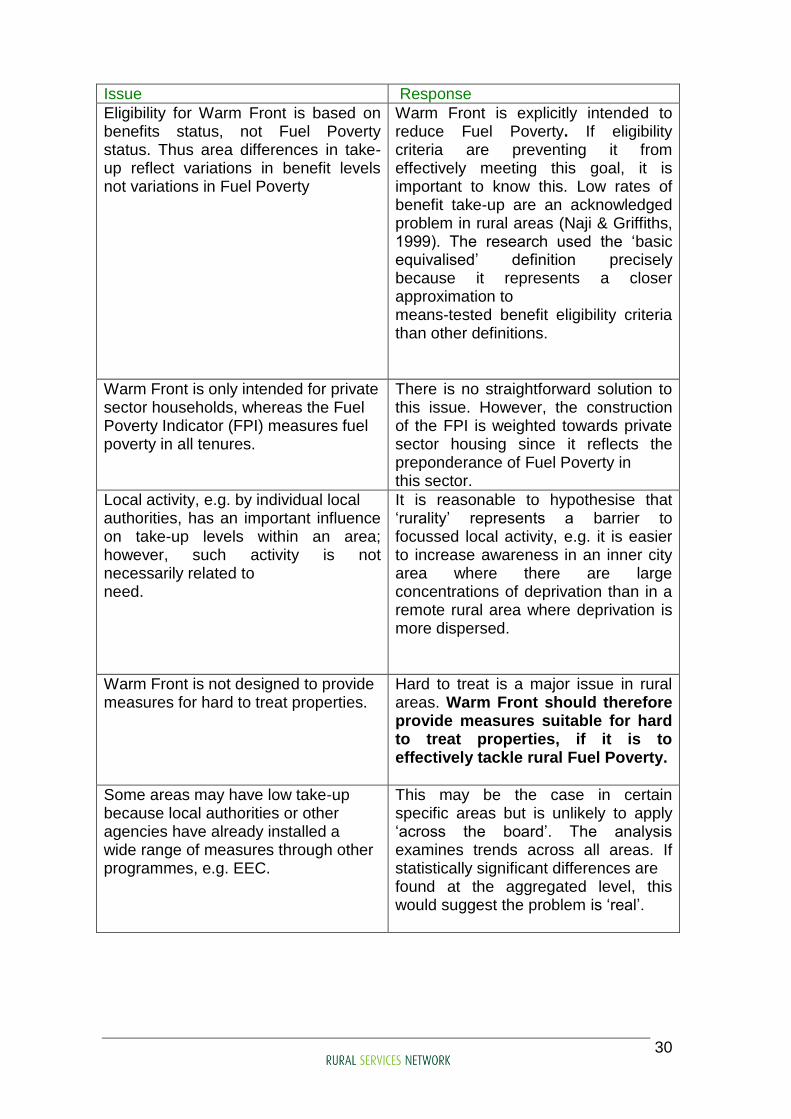
Analysing the distribution of Warm Front Grant: issues
The following is an extract from the CSE report cited at Source 1. It presents further barriers and responses to tackling rural Fuel Poverty.
This study starts with an assumption that geographic equity between urban and rural areas in delivering Warm Front grants is an important concern. However, commentators have raised a number of issues about analysing the allocation of Warm Front take-up by area. The table below summarises the key issues and our response to these.
30
Issue Response
Eligibility for Warm Front is based on benefits status, not Fuel Poverty status. Thus area differences in take-up reflect variations in benefit levels not variations in Fuel Poverty
Warm Front is explicitly intended to reduce Fuel Poverty. If eligibility criteria are preventing it from effectively meeting this goal, it is important to know this. Low rates of benefit take-up are an acknowledged problem in rural areas (Naji & Griffiths, 1999). The research used the „basic equivalised‟ definition precisely because it represents a closer approximation to means-tested benefit eligibility criteria than other definitions.
Warm Front is only intended for private sector households, whereas the Fuel Poverty Indicator (FPI) measures fuel poverty in all tenures.
There is no straightforward solution to this issue. However, the construction of the FPI is weighted towards private sector housing since it reflects the preponderance of Fuel Poverty in this sector.
Local activity, e.g. by individual local authorities, has an important influence on take-up levels within an area; however, such activity is not necessarily related to need.
It is reasonable to hypothesise that „rurality‟ represents a barrier to focussed local activity, e.g. it is easier to increase awareness in an inner city area where there are large concentrations of deprivation than in a remote rural area where deprivation is more dispersed.
Warm Front is not designed to provide measures for hard to treat properties.
Hard to treat is a major issue in rural areas. Warm Front should therefore provide measures suitable for hard to treat properties, if it is to effectively tackle rural Fuel Poverty.
Some areas may have low take-up because local authorities or other agencies have already installed a wide range of measures through other programmes, e.g. EEC.
This may be the case in certain specific areas but is unlikely to apply „across the board‟. The analysis examines trends across all areas. If statistically significant differences are found at the aggregated level, this would suggest the problem is „real‟.
31
Energy Saving Trust; Home Energy „Pay As You Save‟ (PAYS) Pilot
The following is extracted from a Frequently Asked Questions sheet issued by the Energy Saving Trust dated 22nd October 2009 regarding the recently announced PAYS pilot. The pilot areas have recently been announced as Birmingham, Sunderland, the London Borough of Sutton and Stroud. The PAYS initiative is focused on encouraging households to invest in whole house energy retrofits to reduce carbon emissions and is not specifically focused on reducing Fuel Poverty. Stroud has a significant rural area and this Project suggest that the Commission for Rural Communities should review the impact the PAYS scheme may have in rural areas. Q: What is PAYS? A: PAYS is a new way to pay for whole-house energy retrofits that will deliver the greenhouse gas reductions that are necessary for the UK to meet its 2050 targets. The concept removes the upfront costs – which can often be as much as £10,000 – from householders and allows them to repay the capital costs of energy efficiency and micro generation measures over an extended period of time. The aim is that the repayments will be less than the predicted savings and that the charge will be linked to the property rather than the person. Q: Why do we need it? A: Installing loft insulation, cavity wall insulation and using energy efficient lighting is making a major impact on the UK‟s green house gas emissions. However, by 2015 the homes where these measures are possible and suitable will have had them fitted and the challenge will to be to find ways to maintain the UK‟s progress against its 2050 targets when more advanced energy efficiency measures such as solid wall insulation and micro generation are very expensive. PAYS will help solve this problem and allow the UK to meet its long term greenhouse gas emission targets Q: It sounds like a big idea. What is being done to test its practicality and likely success? A: The Energy Saving Trust (EST) has been appointed by the Department of Energy and Climate Change (DECC) to manage a pilot that will test elements of the Pay As You Save concept. The Low Carbon Investment Fund (LCIF) is providing a pot of funding of £4m to be spent over a two year period 2009 – 2011, £2m of which must be spent in the financial year 2009/10. It is envisaged that at least 400 householders will participate in the pilot that will operate across England only in up to four locations. The pilot will test a range of financing repayment options elements of which could be replicated on a larger scale.
32
SECTION SEVEN
IDENTIFYING THREE PILOT AREAS
A key element of this part of the Project was to identify 3 pilot areas based on criteria agreed by the Steering Group. The criteria are based on the following elements:
Good proportion of older people
Predominantly off the gas network
Rural 50 and rural 80 variances
A good proportion of hard to treat properties e.g. solid walls
Supportive Local Authorities
High levels of fuel poor households
The pilot areas have now been identified and agreed with the Steering Group as West Midlands Region – Shropshire (2009 wards) – Apedale, Corve Valley, Bitterley with Stoke St. Milborough, Upper Corvedale (excluding Diddlebury and Stanton Lacy parishes) and Lawley; North East Region – Wear Valley, Easington, Teesdale and St. Johns Chapel in Durham and North West Region – North and South Holderness in East Riding of Yorkshire.
The aim of the pilots is to work with local partners to identify barriers to take up of support, look at how Fuel Poverty is affecting consumers, service providers such as the NHS and the local business economy. It will also seek to monitor impacts in the local economy such as job creation for installers, increased spend with local businesses etc. Feedback will be used to implement a bespoke campaign approach to affect consumer behaviour, reduce Fuel Poverty, income maximisation and energy efficiency. Prior to pilot activity and for evaluation purposes we will seek to benchmark where households are in relation to Fuel Poverty, income, energy efficiency and wellbeing. Post-pilot activity short and longer term evaluation will be undertaken against these areas and findings will be provided to Government and key policy makers to help inform them on best practices in rural areas to tackle Fuel Poverty and energy efficiency.
Planning of Pilot Activity
The Steering Group has agreed on the name of the pilot campaign activity “Hands Up” which encompasses saving money, saving energy and supporting the community. We deliberately steered away from using Fuel Poverty and vulnerability in the mix and wanted to portray a positive and
33
empowering statement that did not depict households as vulnerable and dependant.
A sub-group has worked on the marketing materials and wording of the consumer and business questionnaires.
Identify and meet with key partners in local areas e.g. LA‟s, support groups. This activity has already commenced.
Work with LA‟s to identify households to target
Agree processes with local partners on how best to reach consumers. We envisage a mix of face to face activity, distribution of marketing materials via trusted partners (including Parish/Town Councillors), local events and media promotion.
Set up effective response mechanisms as follows: -
Provide telephone number for people to speak to a real person who will take consumers details and ensure they receive the appropriate support. Freepost address/and or local address to send response back, email/website address to send feedback.
Look to gain feedback from business groups and service providers e.g. NHS on the effect Fuel Poverty is having on their relevant areas. e.g. higher number of cardiovascular and respiratory related illnesses which are exacerbated by living in cold, damp homes. Seek where feasible to ascertain what effect higher fuel prices have had on the local business economy.
The pilots aim to be rolled out from the end of November onwards (this will be dependent on getting the right levels of support in place at local level)
SECTION EIGHT
OTHER KEY RECOMMENDATIONS
The CSE report to eaga Partnership Charitable Trust (Source 1) contained a series of recommendations. They are:-
1. While Warm Front take-up has improved in market towns, Warm Front is still not adequately reaching fuel poor households in remote rural areas despite their relatively high levels of Fuel Poverty. Defra (now DECC) should recognise the additional costs of delivering Warm Front in remote rural areas due to longer travelling times and dispersed populations etc. It should set targets for delivery of Warm Front in „villages‟ and „hamlets‟ proportionate to Fuel Poverty levels in these settlement types.
34
2. There is considerable under-claiming of benefits and tax credits among
rural households which further exacerbates the poor take-up of Warm Front among rural fuel poor households. Community development and other outreach activities are particularly effective in encouraging take-up among rural households. DWP and Defra (NB. Defra‟s responsibilities in that regard have subsequently been taken over by DECC) should, therefore, jointly fund outreach activities in rural areas to encourage improved take-up. The Welsh Assembly Government‟s funding of welfare rights advice sessions in rural GP surgeries has helped improve benefits take-up among rural households. Similar advice and information initiatives should be carried out in rural areas of England, including advice on Warm Front. Increased benefit take-up will both improve incomes and increase access to Warm Front, both of which will contribute to the reduction of Fuel Poverty.
3. Even with improved take-up of passport benefits, it is likely that many fuel
poor households in more remote rural areas will not be eligible for Warm Front. Defra (now DECC) should consider introducing more flexible eligibility criteria for Warm Front in cases where there is a clear demonstration of need. For example, certain front-line staff, such as health workers, could refer clients for help following a simple assessment of need.
4. Many fuel poor households in rural areas require expensive measures to
take them out of Fuel Poverty due to the high levels of hard to treat housing in rural areas. Measure options include solid wall insulation, ground and air source heat pumps, biomass boilers, solar thermal and, for larger rural settlements, communal biomass CHP/district heating. These solutions are considerably more expensive than the maximum Warm Front Grant (now £6,000) in the case of oil condensing boilers). However, these costs should come down with escalated installation rates due to improved economies of scale. Defra (now DECC) should include suitable measures for hard to treat properties within the Warm Front scheme and raise grant maxima for cases where such measures are suitable.
5. CLG should recognise the additional costs of achieving affordable
warmth in hard to treat social housing, and ensure sufficient funds are available for social housing providers to install the more expensive measure options required. Setting SAP81 target within the successor to the Decent Homes Programme would ensure occupants of such properties should not live in Fuel Poverty. This could require the installation of low/zero carbon technologies in a large number of properties particularly hard to treat, with consequent environmental benefits.
6. The Design and Demonstration Unit within BERR has carried out a
number of innovative initiatives to extend the gas network and install renewable technologies in areas currently off the gas network. However, only 4,000 households to date have benefited from these initiatives. The
35
Treasury should reconsider its rejection of the former DTI‟s 2006 £95m spending proposal to extend the gas network to 200,000 households. This would have a major impact on reducing Fuel Poverty among rural households.
7. While gas network extensions, solid wall insulation and renewable
technologies provide long-term physical solutions to tackling rural Fuel Poverty (and for households living in hard to treat properties in urban areas), more immediate policies are required in the interim. Given the reliance of many rural households on oil and LPG, there is a strong case for regulation of these sectors, including improved consumer protection, transparent pricing and the establishment of easy pay schemes to enable bulk purchase of oil.
In addition we make a recommendation (see recommendation 13 below) on the Government‟s recent Pre-Budget Report in respect of Fuel Poverty and energy efficiency measures announced therein.
INTERIM RECOMMENDATION .
12 That the Commission for Rural Communities should support the CSE‟s recommendations set out above and work with DECC and Defra to ensure that they are applied to current and future Fuel Poverty policy and programmes
13 That the Commission for Rural Communities should continue to press Government to ensure more Warm Front Grants are applied to Hard to Treat homes in rural areas.
.

36
INFORMATION SOURCES
SOURCE 1: CSE Final Report: Quantifying rural Fuel Poverty
SOURCE 2: NEA Rural Fuel Poverty Report 2009
SOURCE 3: English House Condition Survey 2006
SOURCE 4: NEA Cumbrian Fuel Poverty 2009
SOURCE 5: DECC Annual Report on Fuel Poverty Statistics
SOURCE 6: CRC Response to DWP consultation on the proposed “Energy Costs Support Scheme”
SOURCE 7: Defra Working Together for older people in rural areas
SOURCE 8: DoH South East Regional Public Health Group Fact Sheet “Health and Winter Warmth – Reducing Health Inequalities”s
SOURCE 9: EST/NHS Hot Spots Project
SOURCE 10: Department of Health Website
SOURCE 11: National Debt Agency and energywatch (The Big Book of Energy)
SOURCE 12: energywatch Priority Consumer Team “Are You Missing Out” Campaign – 2007
SOURCE 13: Warm Front Northumberland – 2006/07
SOURCE 14: Sutherland Tables through the National Federation of Petroleum Suppliers Ltd
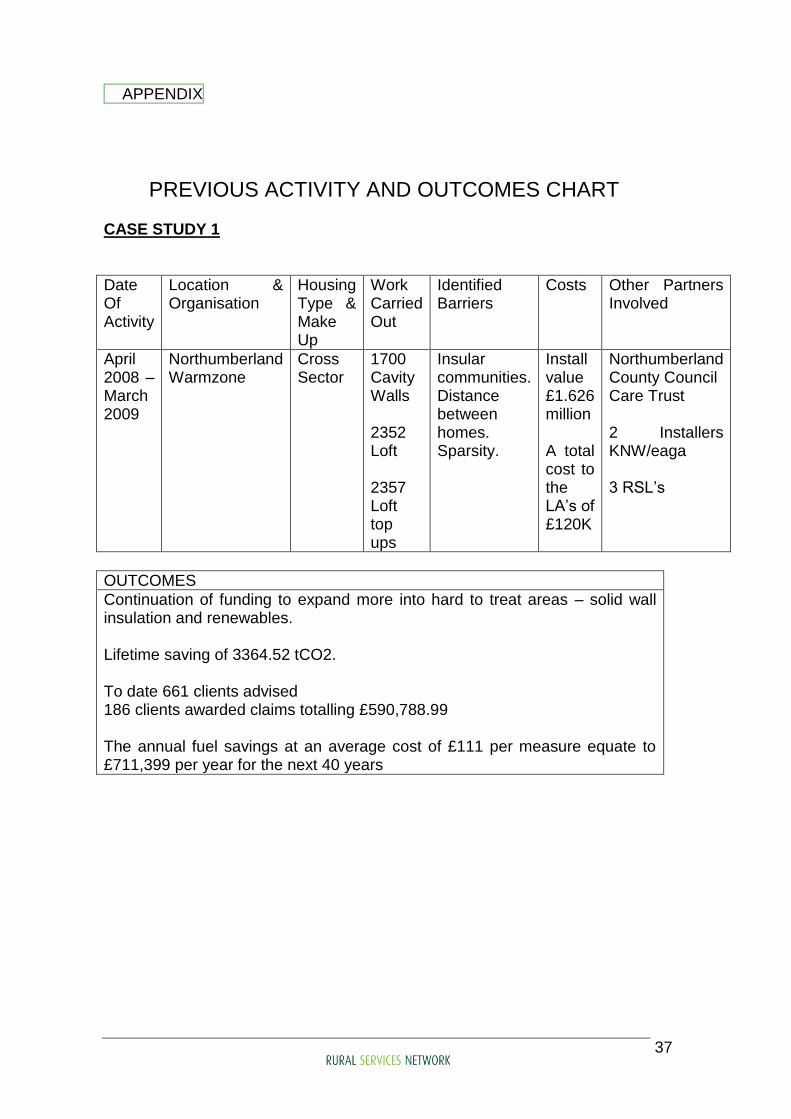
37
APPENDIX
PREVIOUS ACTIVITY AND OUTCOMES CHART CASE STUDY 1
Date Of Activity
Location & Organisation
Housing Type & Make Up
Work Carried Out
Identified Barriers
Costs Other Partners Involved
April 2008 – March 2009
Northumberland Warmzone
Cross Sector
1700 Cavity Walls 2352 Loft 2357 Loft top ups
Insular communities. Distance between homes. Sparsity.
Install value £1.626 million A total cost to the LA‟s of £120K
Northumberland County Council Care Trust 2 Installers KNW/eaga 3 RSL‟s
OUTCOMES
Continuation of funding to expand more into hard to treat areas – solid wall insulation and renewables. Lifetime saving of 3364.52 tCO2. To date 661 clients advised 186 clients awarded claims totalling £590,788.99 The annual fuel savings at an average cost of £111 per measure equate to £711,399 per year for the next 40 years
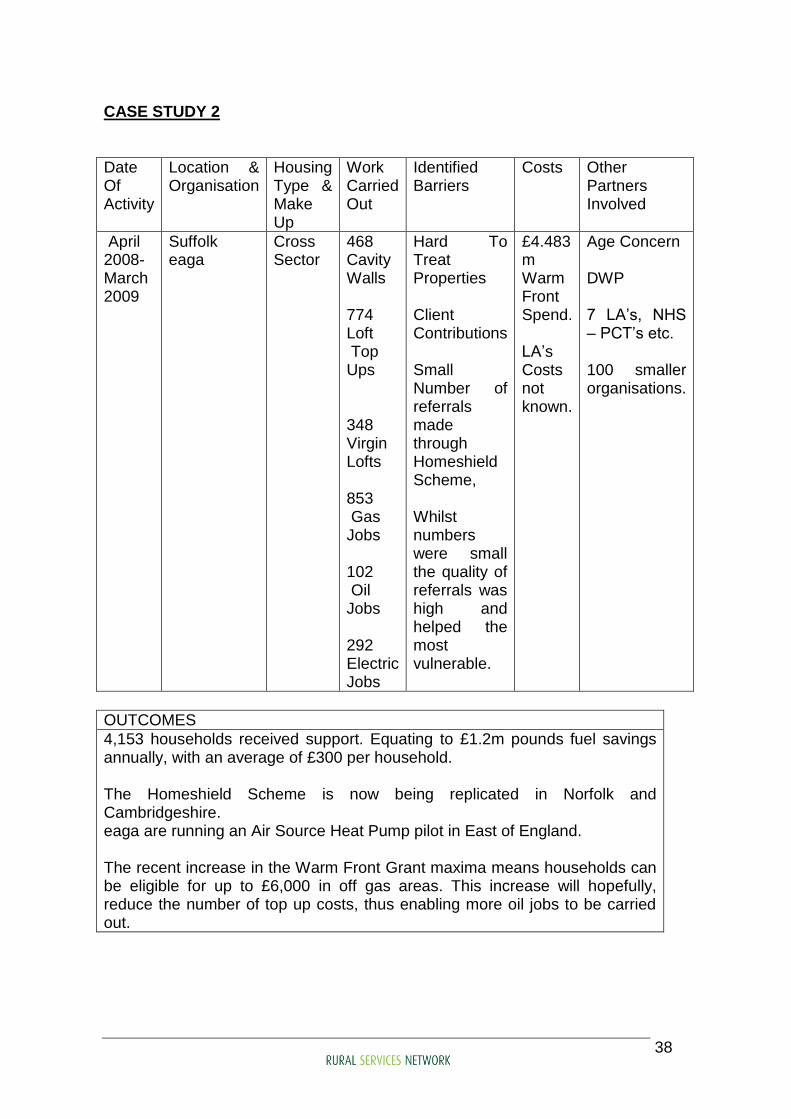
38
CASE STUDY 2
Date Of Activity
Location & Organisation
Housing Type & Make Up
Work Carried Out
Identified Barriers
Costs Other Partners Involved
April 2008-March 2009
Suffolk eaga
Cross Sector
468 Cavity Walls 774 Loft Top Ups 348 Virgin Lofts 853 Gas Jobs 102 Oil Jobs 292 Electric Jobs
Hard To Treat Properties Client Contributions Small Number of referrals made through Homeshield Scheme, Whilst numbers were small the quality of referrals was high and helped the most vulnerable.
£4.483 m Warm Front Spend. LA‟s Costs not known.
Age Concern DWP 7 LA‟s, NHS – PCT‟s etc. 100 smaller organisations.
OUTCOMES
4,153 households received support. Equating to £1.2m pounds fuel savings annually, with an average of £300 per household. The Homeshield Scheme is now being replicated in Norfolk and Cambridgeshire. eaga are running an Air Source Heat Pump pilot in East of England. The recent increase in the Warm Front Grant maxima means households can be eligible for up to £6,000 in off gas areas. This increase will hopefully, reduce the number of top up costs, thus enabling more oil jobs to be carried out.
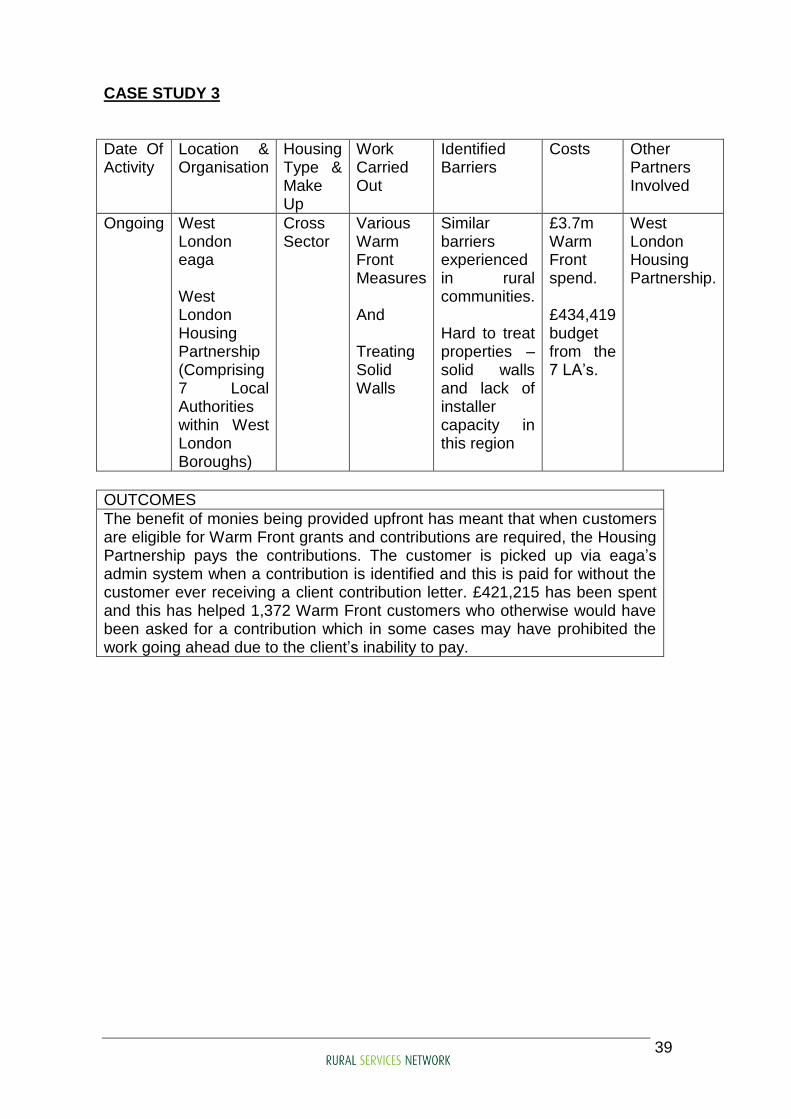
39
CASE STUDY 3
Date Of Activity
Location & Organisation
Housing Type & Make Up
Work Carried Out
Identified Barriers
Costs Other Partners Involved
Ongoing West London eaga West London Housing Partnership (Comprising 7 Local Authorities within West London Boroughs)
Cross Sector
Various Warm Front Measures And Treating Solid Walls
Similar barriers experienced in rural communities. Hard to treat properties – solid walls and lack of installer capacity in this region
£3.7m Warm Front spend. £434,419 budget from the 7 LA‟s.
West London Housing Partnership.
OUTCOMES
The benefit of monies being provided upfront has meant that when customers are eligible for Warm Front grants and contributions are required, the Housing Partnership pays the contributions. The customer is picked up via eaga‟s admin system when a contribution is identified and this is paid for without the customer ever receiving a client contribution letter. £421,215 has been spent and this has helped 1,372 Warm Front customers who otherwise would have been asked for a contribution which in some cases may have prohibited the work going ahead due to the client‟s inability to pay.
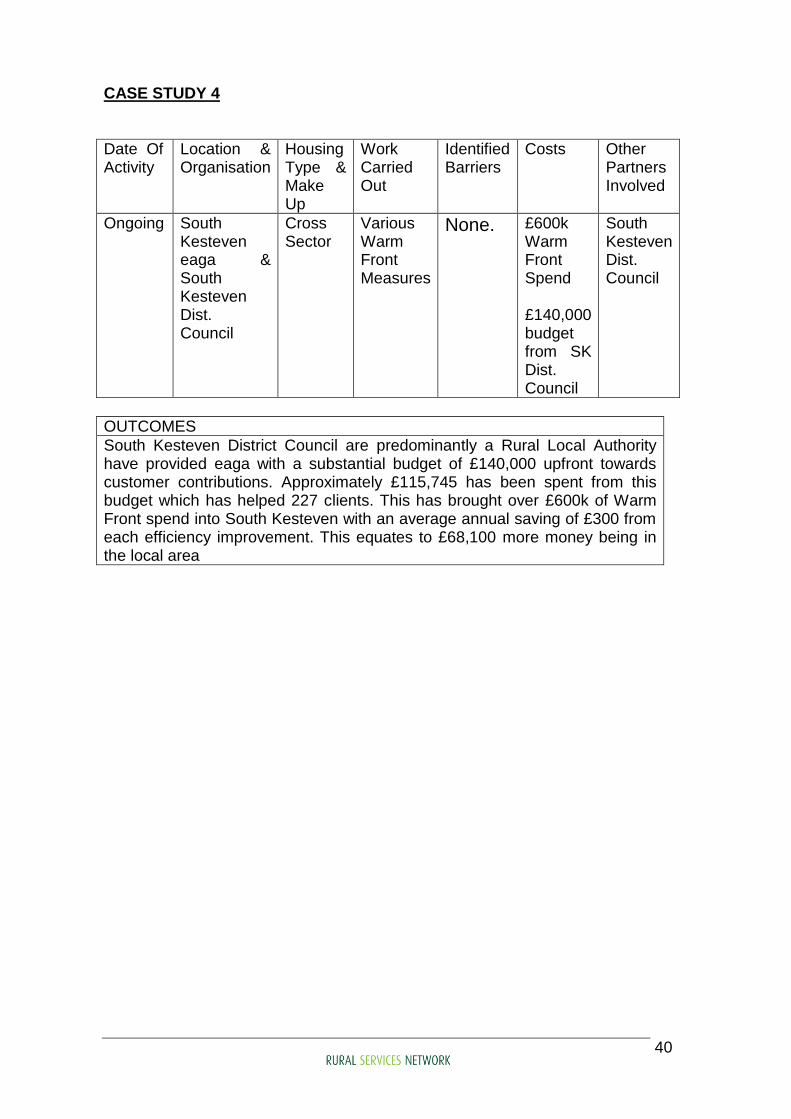
40
CASE STUDY 4
Date Of Activity
Location & Organisation
Housing Type & Make Up
Work Carried Out
Identified Barriers
Costs Other Partners Involved
Ongoing South Kesteven eaga & South Kesteven Dist. Council
Cross Sector
Various Warm Front Measures
None. £600k Warm Front Spend £140,000 budget from SK Dist. Council
South Kesteven Dist. Council
OUTCOMES
South Kesteven District Council are predominantly a Rural Local Authority have provided eaga with a substantial budget of £140,000 upfront towards customer contributions. Approximately £115,745 has been spent from this budget which has helped 227 clients. This has brought over £600k of Warm Front spend into South Kesteven with an average annual saving of £300 from each efficiency improvement. This equates to £68,100 more money being in the local area

41
CASE STUDY 5
Date Of Activity
Location & Organisation
Housing Type & Make Up
Work Carried Out
Identified Barriers
Costs Other Partners Involved
Ongoing Suffolk. eaga & Suffolk Coastal Dist. Council
Cross Sector
Various Warm Front Measures – Including Treating Hard To Treat Homes
None. £267,000 Warm Front Spend. £61,424 funds paid by Suffolk Coastal Dist. Council
eaga & Suffolk Coastal Dist. Council
OUTCOMES
Suffolk Coastal District Council is predominantly a Rural Local Authority. Whilst they have not issued funding into the eaga customer contribution process, they have approved jobs where the contribution is up to the value of £800 and as such have provided £61,424 pounds worth of assistance which has helped 99 customers. This has brought £267,000 of Warm Front spend into Suffolk Coastal region with energy savings of nearly £30k
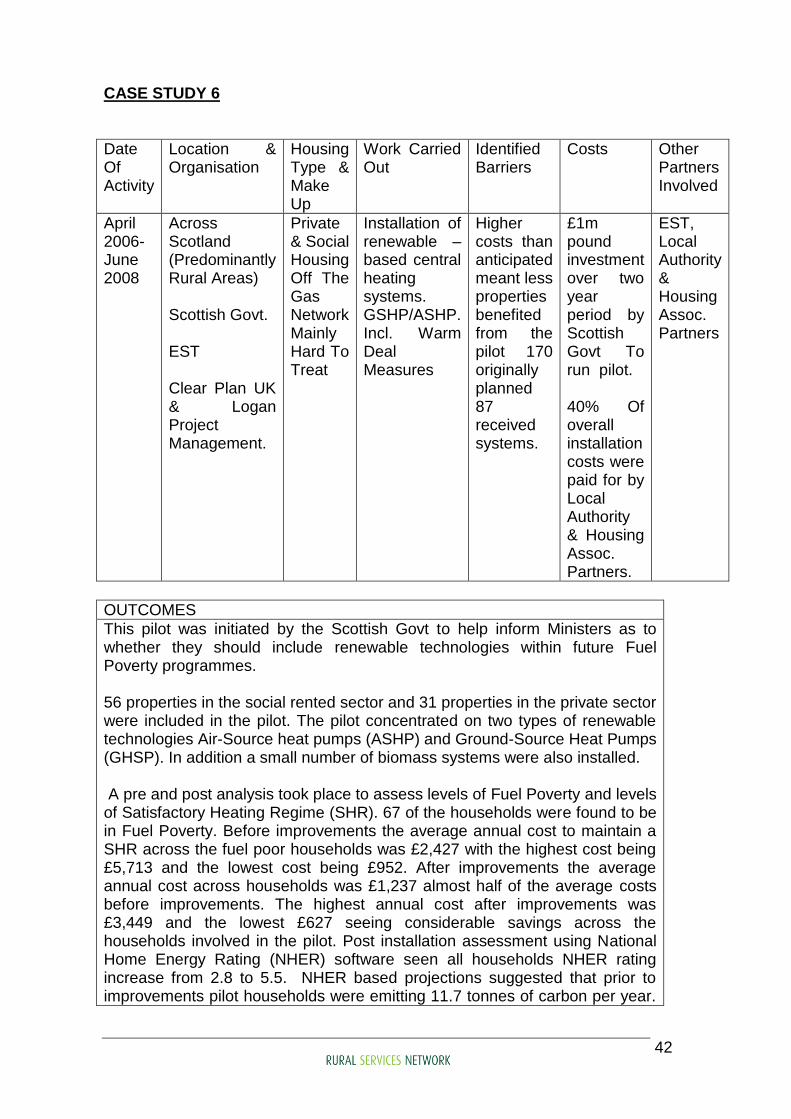
42
CASE STUDY 6
Date Of Activity
Location & Organisation
Housing Type & Make Up
Work Carried Out
Identified Barriers
Costs Other Partners Involved
April 2006- June 2008
Across Scotland (Predominantly Rural Areas) Scottish Govt. EST Clear Plan UK & Logan Project Management.
Private & Social Housing Off The Gas Network Mainly Hard To Treat
Installation of renewable –based central heating systems. GSHP/ASHP. Incl. Warm Deal Measures
Higher costs than anticipated meant less properties benefited from the pilot 170 originally planned 87 received systems.
£1m pound investment over two year period by Scottish Govt To run pilot. 40% Of overall installation costs were paid for by Local Authority & Housing Assoc. Partners.
EST, Local Authority & Housing Assoc. Partners
OUTCOMES
This pilot was initiated by the Scottish Govt to help inform Ministers as to whether they should include renewable technologies within future Fuel Poverty programmes. 56 properties in the social rented sector and 31 properties in the private sector were included in the pilot. The pilot concentrated on two types of renewable technologies Air-Source heat pumps (ASHP) and Ground-Source Heat Pumps (GHSP). In addition a small number of biomass systems were also installed. A pre and post analysis took place to assess levels of Fuel Poverty and levels of Satisfactory Heating Regime (SHR). 67 of the households were found to be in Fuel Poverty. Before improvements the average annual cost to maintain a SHR across the fuel poor households was £2,427 with the highest cost being £5,713 and the lowest cost being £952. After improvements the average annual cost across households was £1,237 almost half of the average costs before improvements. The highest annual cost after improvements was £3,449 and the lowest £627 seeing considerable savings across the households involved in the pilot. Post installation assessment using National Home Energy Rating (NHER) software seen all households NHER rating increase from 2.8 to 5.5. NHER based projections suggested that prior to improvements pilot households were emitting 11.7 tonnes of carbon per year.
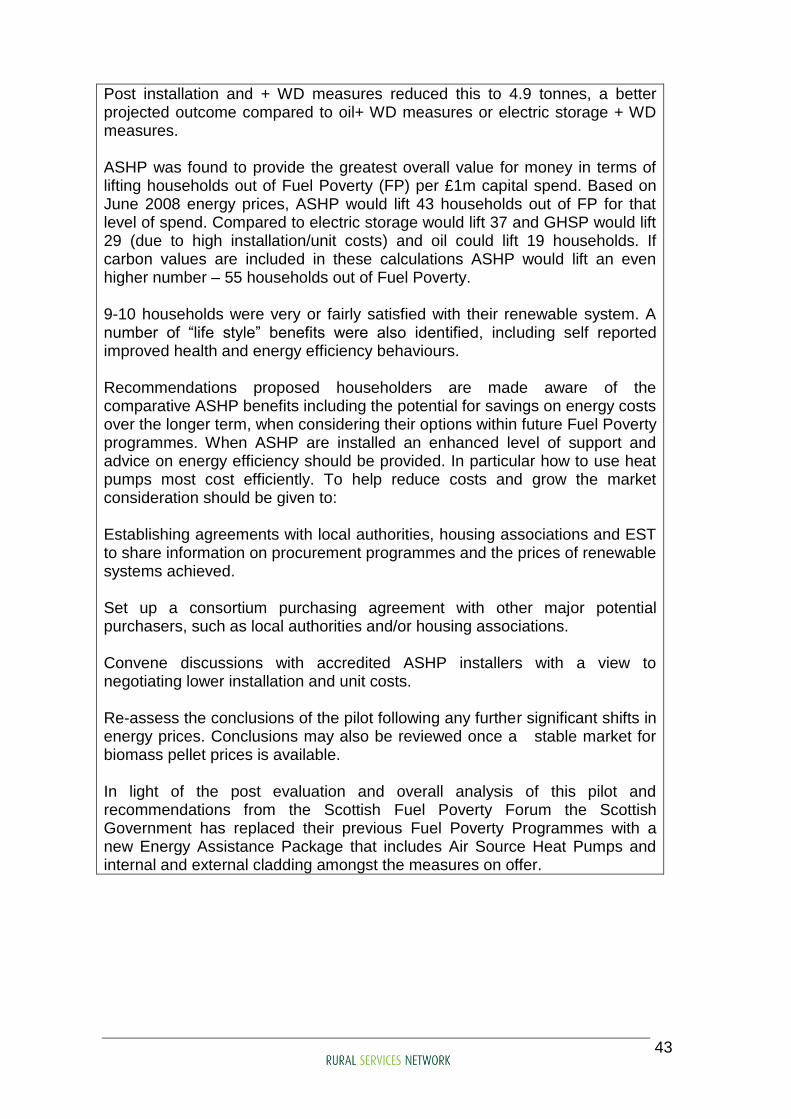
43
Post installation and + WD measures reduced this to 4.9 tonnes, a better projected outcome compared to oil+ WD measures or electric storage + WD measures. ASHP was found to provide the greatest overall value for money in terms of lifting households out of Fuel Poverty (FP) per £1m capital spend. Based on June 2008 energy prices, ASHP would lift 43 households out of FP for that level of spend. Compared to electric storage would lift 37 and GHSP would lift 29 (due to high installation/unit costs) and oil could lift 19 households. If carbon values are included in these calculations ASHP would lift an even higher number – 55 households out of Fuel Poverty. 9-10 households were very or fairly satisfied with their renewable system. A number of “life style” benefits were also identified, including self reported improved health and energy efficiency behaviours. Recommendations proposed householders are made aware of the comparative ASHP benefits including the potential for savings on energy costs over the longer term, when considering their options within future Fuel Poverty programmes. When ASHP are installed an enhanced level of support and advice on energy efficiency should be provided. In particular how to use heat pumps most cost efficiently. To help reduce costs and grow the market consideration should be given to: Establishing agreements with local authorities, housing associations and EST to share information on procurement programmes and the prices of renewable systems achieved. Set up a consortium purchasing agreement with other major potential purchasers, such as local authorities and/or housing associations. Convene discussions with accredited ASHP installers with a view to negotiating lower installation and unit costs. Re-assess the conclusions of the pilot following any further significant shifts in energy prices. Conclusions may also be reviewed once a stable market for biomass pellet prices is available. In light of the post evaluation and overall analysis of this pilot and recommendations from the Scottish Fuel Poverty Forum the Scottish Government has replaced their previous Fuel Poverty Programmes with a new Energy Assistance Package that includes Air Source Heat Pumps and internal and external cladding amongst the measures on offer.
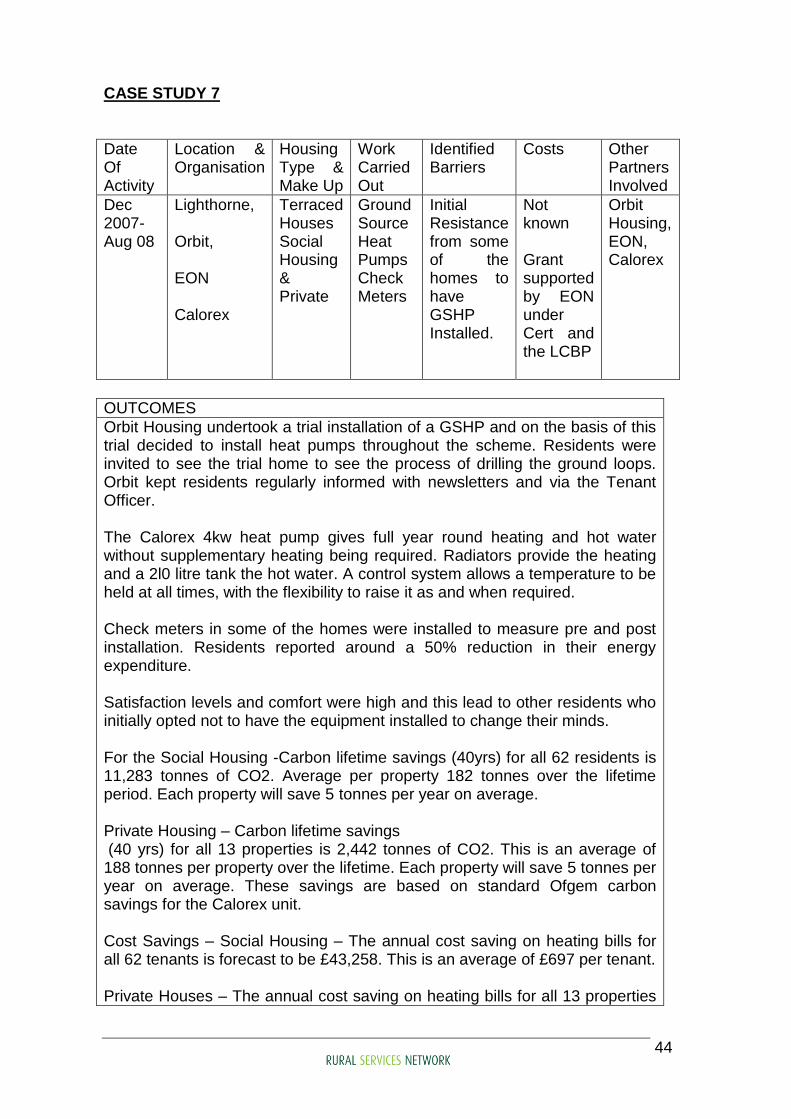
44
CASE STUDY 7
Date Of Activity
Location & Organisation
Housing Type & Make Up
Work Carried Out
Identified Barriers
Costs Other Partners Involved
Dec 2007- Aug 08
Lighthorne, Orbit, EON Calorex
Terraced Houses Social Housing & Private
Ground Source Heat Pumps Check Meters
Initial Resistance from some of the homes to have GSHP Installed.
Not known Grant supported by EON under Cert and the LCBP
Orbit Housing, EON, Calorex
OUTCOMES
Orbit Housing undertook a trial installation of a GSHP and on the basis of this trial decided to install heat pumps throughout the scheme. Residents were invited to see the trial home to see the process of drilling the ground loops. Orbit kept residents regularly informed with newsletters and via the Tenant Officer. The Calorex 4kw heat pump gives full year round heating and hot water without supplementary heating being required. Radiators provide the heating and a 2l0 litre tank the hot water. A control system allows a temperature to be held at all times, with the flexibility to raise it as and when required. Check meters in some of the homes were installed to measure pre and post installation. Residents reported around a 50% reduction in their energy expenditure. Satisfaction levels and comfort were high and this lead to other residents who initially opted not to have the equipment installed to change their minds. For the Social Housing -Carbon lifetime savings (40yrs) for all 62 residents is 11,283 tonnes of CO2. Average per property 182 tonnes over the lifetime period. Each property will save 5 tonnes per year on average. Private Housing – Carbon lifetime savings (40 yrs) for all 13 properties is 2,442 tonnes of CO2. This is an average of 188 tonnes per property over the lifetime. Each property will save 5 tonnes per year on average. These savings are based on standard Ofgem carbon savings for the Calorex unit. Cost Savings – Social Housing – The annual cost saving on heating bills for all 62 tenants is forecast to be £43,258. This is an average of £697 per tenant. Private Houses – The annual cost saving on heating bills for all 13 properties
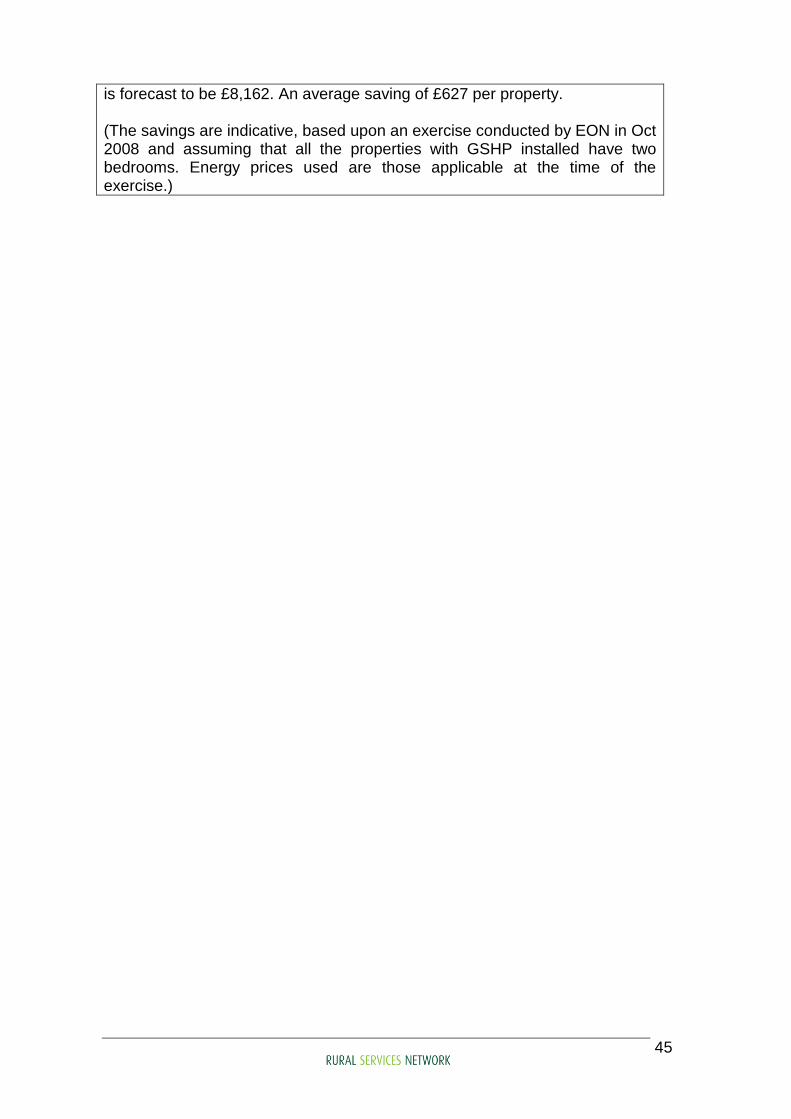
45
is forecast to be £8,162. An average saving of £627 per property. (The savings are indicative, based upon an exercise conducted by EON in Oct 2008 and assuming that all the properties with GSHP installed have two bedrooms. Energy prices used are those applicable at the time of the exercise.)
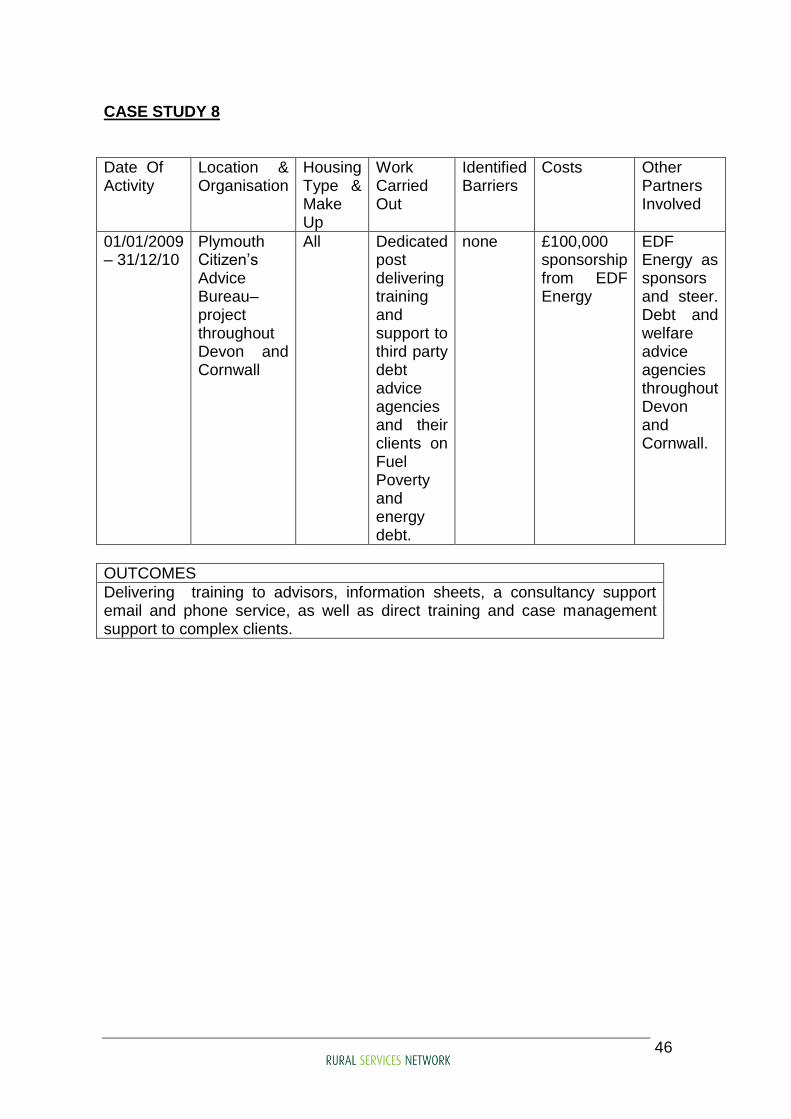
46
CASE STUDY 8
Date Of Activity
Location & Organisation
Housing Type & Make Up
Work Carried Out
Identified Barriers
Costs Other Partners Involved
01/01/2009 – 31/12/10
Plymouth Citizen‟s Advice Bureau– project throughout Devon and Cornwall
All Dedicated post delivering training and support to third party debt advice agencies and their clients on Fuel Poverty and energy debt.
none £100,000 sponsorship from EDF Energy
EDF Energy as sponsors and steer. Debt and welfare advice agencies throughout Devon and Cornwall.
OUTCOMES
Delivering training to advisors, information sheets, a consultancy support email and phone service, as well as direct training and case management support to complex clients.
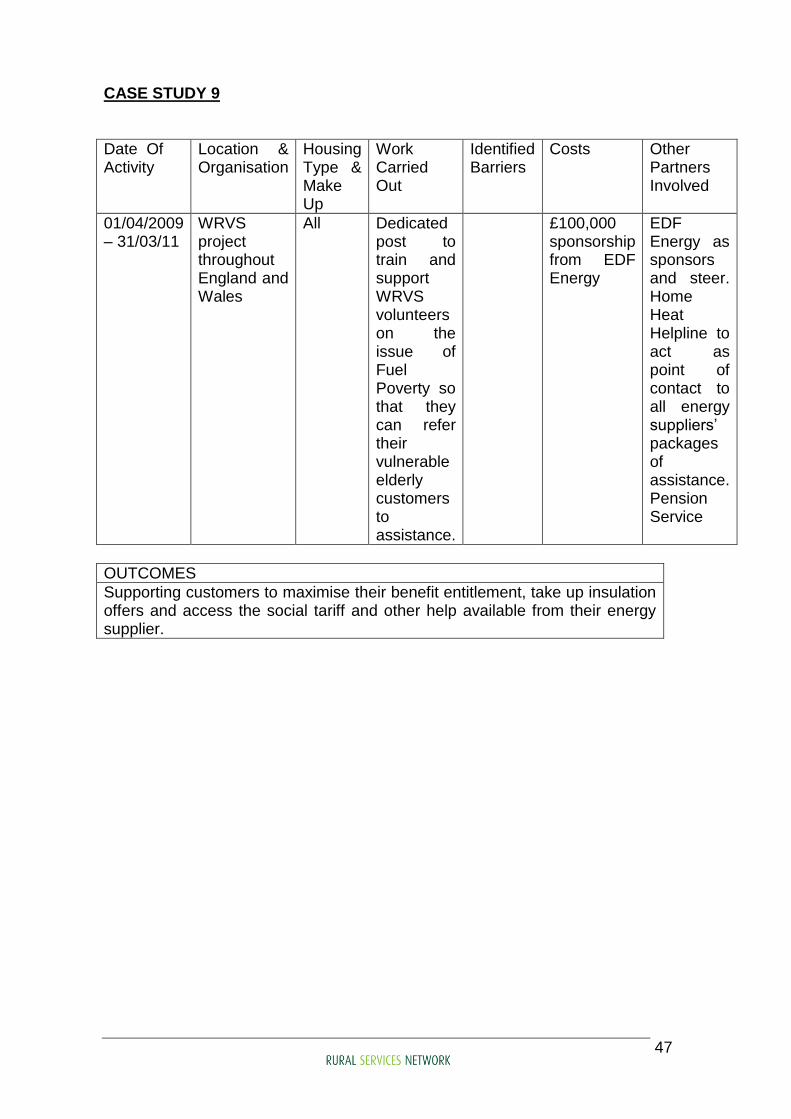
47
CASE STUDY 9
Date Of Activity
Location & Organisation
Housing Type & Make Up
Work Carried Out
Identified Barriers
Costs Other Partners Involved
01/04/2009 – 31/03/11
WRVS project throughout England and Wales
All Dedicated post to train and support WRVS volunteers on the issue of Fuel Poverty so that they can refer their vulnerable elderly customers to assistance.
£100,000 sponsorship from EDF Energy
EDF Energy as sponsors and steer. Home Heat Helpline to act as point of contact to all energy suppliers‟ packages of assistance. Pension Service
OUTCOMES
Supporting customers to maximise their benefit entitlement, take up insulation offers and access the social tariff and other help available from their energy supplier.