Embed Size (px)
Citation preview

Edirisa Nseera
Understanding the Prospective Local Content in the Petroleum Sector and the Potential Impact of High
Energy Prices on Production Sectors and Household Welfare in Uganda Welfare in Uganda
No 242 – September 2016
Editorial Committee Rights and Permissions
All rights reserved.
The text and data in this publication may be
reproduced as long as the source is cited.
Reproduction for commercial purposes is
forbidden.
The Working Paper Series (WPS) is produced by
the Development Research Department of the
African Development Bank. The WPS disseminates
the findings of work in progress, preliminary
research results, and development experience and
lessons, to encourage the exchange of ideas and
innovative thinking among researchers,
development practitioners, policy makers, and
donors. The findings, interpretations, and
conclusions expressed in the Bank’s WPS are
entirely those of the author(s) and do not
necessarily represent the view of the African
Development Bank, its Board of Directors, or the
countries they represent.
Copyright © 2016
African Development Bank
Headquarter Building
Rue Joseph Anoma
01 BP 1387, Abidjan 01
Côte d'Ivoire
E-mail: [email protected]
Working Papers are available online at
http:/www.afdb.org/
Shimeles, Abebe (Chair) Anyanwu, John C. Faye, Issa Ngaruko, Floribert Simpasa, Anthony Salami, Adeleke O. Verdier-Chouchane, Audrey
Coordinator
Salami, Adeleke O.
Correct citation: Nseera, Edirisa. (2016), Understanding the Prospective Local Content in the Petroleum Sector, and the
Potential Impact of High Energy Prices on production Sectors and Household Welfare in Uganda, Working Paper Series
N° 242 African Development Bank, Abidjan, Côte d’Ivoire.
Understanding the Prospective Local Content in the Petroleum Sector; and the Potential Impact of High Energy
Prices on Production Sectors and Household Welfare in Uganda
Edirisa Nseera1
1 Edirisa Nseera ([email protected]) is a Senior Country Economist, Southern Africa Regional
Resource Centre of the African Development Bank.
AFRICAN DEVELOPMENT BANK GROUP
Office of the Chief Economist
Working Paper No. 242
September 2016

Abstract
The objective of this study is: (a) understand the prospective local content of the petroleum (energy) sector based on its current linkage structure and (b) to understand the potential impact of energy prices on various sectors and on welfare of various household groups. The analysis is based on fixed price social accounting framework models. The results indicate that local content is lacking and the petroleum sector is considered weak in terms of backward and forward linkages. This suggests that the upstream and downstream sectors of petroleum industry are not well established which might undermine the prospective opportunities to maximize benefits from anticipated oil production. The government’s interest in policies that could establish local content in the potential supplying and consuming industries is highly justified. The results also show that the potential impact of high energy (crude oil) prices on
sectoral production costs, and consumption prices is negative but modest. The overall cost of living of households’ increase by a maximum of 3.7 percent. There is a spatial dimension in terms of impact as the brunt of energy price shock is larger for the rural household (rural non-farm and rural farm) compared to the urban households (urban farm and urban non-farm). Additionally, the induced effects of the energy price increase on the household groups tend to dominate meaning that the households are more highly affected by price feedbacks from consuming goods from energy intensive sectors than their direct energy consumption. In view of the foregoing, a well-designed and targeted energy policy to counteract the potential negative direct and indirect impact of higher energy prices on the vulnerable household groups is urgently needed.

5
1. Introduction
Following the discovery of oil and the enactment of the 1993 Petroleum Exploration and Production
Act, many Ugandans are predicating their future on the anticipated benefits from oil. Consistent with
this expectation, the goal of the 2008 oil policy is to use the country’s oil and gas resources towards
poverty eradication and creating lasting value to society. The ultimate objective of the oil and gas
policy is to develop the local content which is the transmission mechanism of the benefits from oil
activities to the local economy. Local content includes among others the development and transfer of
expertise to local companies, which allow optimum national participation in oil and gas transactions
and activities. The most important channel through which the economy benefits is through forward and
backward linkages. It is noteworthy that the country is not yet at a production stage, it is envisioned
that production will commence in 2020.
In view of this, the objective of the study is to understand the prospective local content of the
petroleum (energy) sector given the backward and forward linkages embedded in the available
economy wide data base, the 2007 Social Accounting Matrix (SAM). This is expected to facilitate the
understanding of what kind of local content policies should be designed and why. Another objective of
this study is to understand the potential impact of the projected increase in energy prices (crude oil
prices in this study) starting 2017 until 2018 on the intermediate costs of the various sectors and
welfare of various household groups. According to past studies, the impact can be significant
depending upon the economic structure and it is not conclusive whether household groups are
proportionately affected or not. In this study, the energy sector is synonymous with the petroleum
products sector; and gas and oil sector. The shocks from global crude oil prices (energy prices in this
study) enters the economy through this sector.
2. Background Information
The overarching goal of Uganda’s National Development Plan(NDP), 2015/2016 -2019/2020 is to
attain the status of a middle income country by 2020 through enhanced competitiveness while attaining
sustainable wealth creation, employment and inclusive growth. Among the objectives of the NDP is to
increase and sustain production; enhance productivity and value addition in the key growth
opportunities. Increasing manufacturing and raising per capita income from USD 788 to USD 1,033 by
2020 are among the focus areas of the plan. Agriculture; minerals, oil and gas; and tourism are the key
growth opportunities prioritized for investment by the NDP. In view of the above, the development
strategy is tailored towards an unbalanced growth path entailing focusing the available limited
resources on the three selected investment areas which include modernizing agriculture which is the
source of livelihood for majority of the population by creating strong link to industry. Manufacturing
(service inputs are now considered part of manufacturing), however, will be vital for promoting value
addition and competitiveness for various sectors. The coming on board of petroleum is expected to play
a catalytic role of providing the needed resources (big push) for increasing productivity in all sectors
through human capital development (including research and development), developing complementary
infrastructure needed by the private sector; and promoting industrial development; and manufacturing
for value addition.

6
Though not part of the objective of the study, let me highlight upfront the envisioned challenges of the
NDP strategy based on Table 2 in the subsequent sections. The challenge is that apart from
manufacturing (food processing) which has strong forward and backward linkages, agriculture, mining,
and tourism are backward orientated sectors with weak forward linkages; and the oil and gas sector is
considered weak at present. This means, as part of the intervention in the selected sectors, the forward
linkages would have to be established where they are lacking and enhanced where they are weak in
order for the investment in these sectors to have maximum impact on the rest of the economy. Human
capital features well given that education is revealed as one of the key sectors with strong backward
and forward linkages.
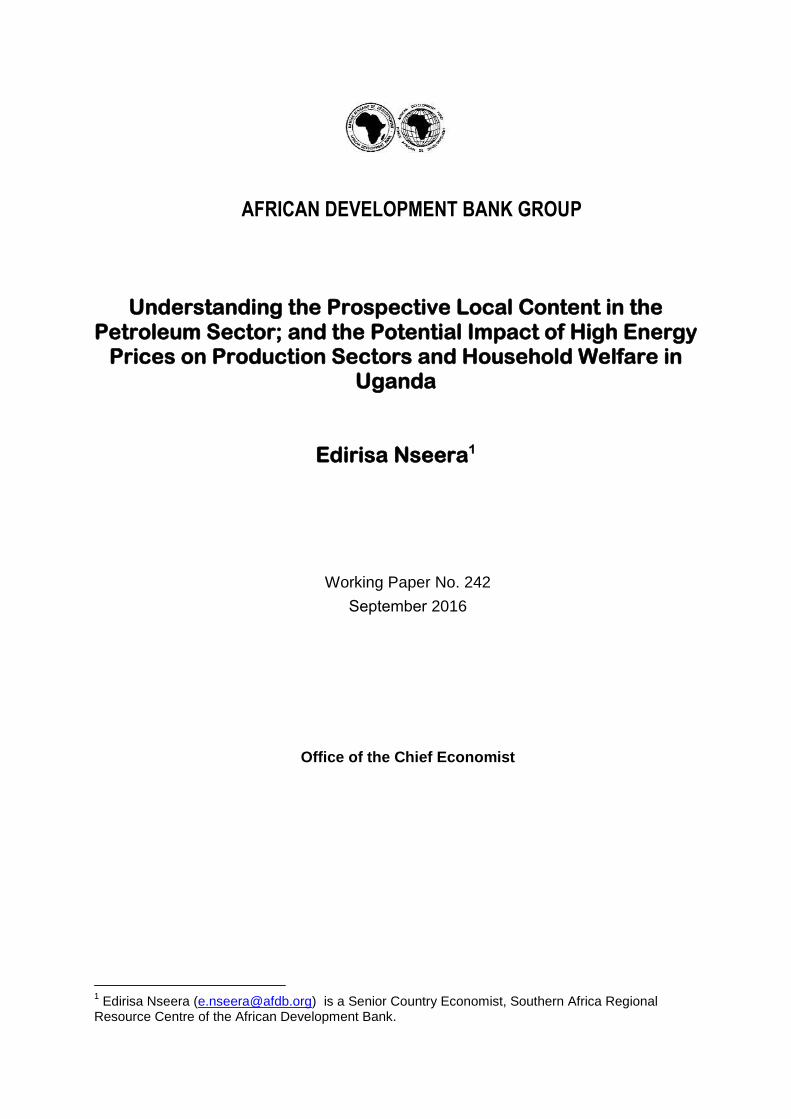
Following the rising oil prices in 2000s, Uganda witnessed an increase in the drive to explore
hydrocarbons leading to the award of the exploration license between 2001 and 2005. The prices had
increased by 57.0 percent a barrel from USD 24.4/B in 2001 to USD 38.3/B in 2005 and by the time of
the commercially viable discoveries in 2006 and 2007, the prices were promisingly high, hovering
around USD 65.3/B and USD 72.3/B respectively before reaching a maximum of USD 111.97/B in
2013. Beyond 2013, however, the international prices of energy are forecast to continue declining up to
2016. Thereafter, they are forecast to rise from USD 42.9/B in 2016 to USD 73.5/B in 2018 (Economist
Intelligence Unit (EIU), 2015). The key factors contributing to energy price shocks include scarce
supplies and buoyant demand. The energy prices are expected to remain elevated above USD71/B up to
2020. Compared to 2016, the increases are expected to be least dramatic in 2017 (39.9 percent) and
most dramatic in 2018 (71.3 percent). The declining oil prices during 2014-2015 created uncertainties
leading to the decision to delay planned oil refinery in 2018 to some future date, most likely 2020.
During this period, Uganda is expected to be a net importer of energy. The energy prices, however, are
expected to rise dramatically by an average annual increase of 31 percent (2017-2018). The rise in oil
prices will have important negative effects on the Ugandan economy.
The extent of the effect is expected to vary across sectors depending on intensiveness of their energy
use and linkages with non-energy sectors. Similarly, household welfare will also be disproportionately
affected depending on their consumption of energy and interaction with non-energy sectors. In terms of
98.9
52.4
42.9
60 73.5
72.8 71.4
0
20
40
60
80
100
120
2014 2015 2016 2017 2018 2019 2020
Figure 1: Trend in crude oil price 2014-2020 (Oil :Brent)
Source: EIU economic and commodity forecast, December 2015
USD/B
7
local content, the local content debate and work have mainly focused on whether the existing policy
and legal framework allows adequate participation of the local companies and citizen in the oil and gas
sector using desk review of experiences of other countries and contrasting this with existing
frameworks2. As a point of departure, this study strives to augment the previous studies by providing
some evidence on the prospective local content using an economy wide data on Uganda.
3. Theoretical perspective and review of relevant literature
The dearth of linkages between the oil sector and the other sectors of the economy remains a critical
developmental problem in many mineral rich countries. This is particularly critical for Uganda where
oil sector investment is dependent on foreign multinational companies. Thus, the relevancy of the study
objectives. The evidence on linkage effects points to the potent problem of the repatriation of value
added which reduces the beneficial effects of oil and gas to the domestic economy. The same studies
reveal that gas and oil sector with low linkage effects may in terms of access to finance and talented
workers crowd out the key sectors with stronger linkages. This creates a Dutch disease syndrome which
is a major distortion within the domestic economy (Oyejide and Adewuyi, 2011). This may further
stifle the linkage effects of domestic firms, in particular, the small and medium enterprises and enhance
the dominance of foreign companies with easy access to finance. This tends to distribute the benefits of
oil revenues towards rent and capital which is dominated by foreign owned companies. When the
Dutch disease effects are manifest, the studies recommend undertaking studies on determinants of
forward and backward linkages in the country with a view to fine-tuning the existing policies. In some
cases policies on ownership and joint ventures have been changed to encourage more local ownership
and participation in the oil and gas sector.
Another pertinent issue in the literature is related to drivers of linkages within the economy. One of the
important study in this area was conducted by Mathews (2002). He identified four important drivers of
linkages and these comprise transportation, infrastructure, ownership and skills. Notwithstanding the
above, he underscored the importance of policies and national system of information (includes
investing in managerial and entrepreneurial capacity building) as emphasized in the literature. The
importance of spreading economic opportunities through a variety of economic enterprises, training,
and business linkages enable local companies to access new technology, spread international business
standards and create a pool of local skills for the mutual benefit of both multinational companies and
local enterprises (Nelson, 2007). Freeman (1995) argues that national and regional systems of
innovation remain an essential domain of economic analysis. He underlined the fundamental role of the
national education system, industrial relations, technical and scientific institutions, government
policies, cultural traditions and any other national institutions in enhancing linkages. According to
UNCTAD (2010), key important linkages usually manifest in the oil and gas industry. These comprise
forward linkages between transnational companies (TNCs) and customers, backward linkages between
TNCs and suppliers; linkages among technological partners; and linkages that result from a spill-over
effect. In this respect taking advantages of these linkages entail carefully working out joint ventures or
various types, licensing agreements, and strategic alliances with local partners.
2 For studies in these areas see Gwayaka (2014) and Ministry of Energy and Mineral Development (2011).
3 Percent of total requirements computed from Macro SAM not presented here).
4 In the context of Uganda, it appears there are some well to do households in rural areas who purchase forestry products
including timber and furniture for various reasons. These may include for use in household and for trading purposes. In the
8
In terms of measurement of linkages, the building blocks are anchored on the work of Rasmussen
(1956) and Chenery and Watanabe (1958). The measurement of backward and forward links was
formalized by the former study based on the use of input-output tables. Chenery and Watanabe (1958)
concentrated on the immediate inputs into a sector (backward link) or immediate outputs provided to
other sectors (forward link). Rasmussen (1956), however, focused on the cumulative effect of the direct
links relating to sectors supplying the oil and gas sector. However, it is increasingly becoming
important to include the analysis on indirect links in particular on how supply sectors affect other
sectors.
The question of how positive oil shock would potentially impact on the various sectors and household
groups has been mentioned in the literature. While various approaches have been employed to provide
answers, the importance of linkage to the oil sector has been often emphasized. The extent of the
backward and forward linkages with the oil sector remains important. As demonstrated by Hanson,
Robinson and Schluter (1993), sectors with strong linkages with oil and gas, tend to experience higher
input costs, lower production, higher prices, and an uncertain effect on net sectoral income following
an initial increase in oil and gas prices. Huang et al. (1996) argue that oil prices are a key determinant
of production costs and thence affect firm dividends through profitability. In particular, rising oil prices
negatively impacts earnings of firms which use oil directly or indirectly in the production process. As
argued by the International Energy Agency (2006), firms tend to be more prone to absorb higher input
costs in production without increasing their output prices as the result of increased productivity and
investments in renewable energy sources. Nordhaus (2007), however, argues that wages tend to be
flexible owing to temporary conditions in the labour markets, thereby minimizing the effects of oil
price shocks. This makes the responses to an oil shock more neoclassical (based on factor substitution
in the context of full employment) and less Keynesian (based on demand-side effects like the “oil
tax”).
Globally, the distribution of benefits depends on whether a country is an oil producer or an oil
importer. The evidence indicates the positive effect of the high oil price shocks on the oil producing
countries and the negative effects on the oil importing countries ( Korhonen and Ledyaeva,2008 and
Abeysinghe, 2001). As indicated by Abyesinghe (2001) the impact of the oil shocks on growth may be
important on small open economies compared to large economies. This is particularly important given
that high oil prices potentially increase the producer cost of the oil intensive sectors and this
disproportionately increases the cost of living of various households, in particular, net consumers.
Fundamentally, we can think of the observed poverty and inequality in a given society as an outcome
of individual behavior subject to endowments and the institutions that govern social interaction.
As demonstrated by Karman et al (2008), the sectors with intensive use of energy contract when the
price of imported energy increases because the input cost increases. Other sectors with strong indirect
intermediate input use of energy also contract. Consequently, output responds to economy wide
changes induced by the world price shocks. As a result of the depreciation of the exchange rate, output
of non-tradable sectors such as services activities tend to decline.
The importance of national innovation has been underscored by some studies. Freeman (1995) argues
that national and regional systems of innovation remain an essential domain of economic analysis.
Their importance derives from the networks of relationships which are necessary for any firm to
innovate. Whilst external international connections are certainly of growing importance, the influence
9
of the national education system, industrial relations, technical and scientific institutions, government
policies, cultural traditions is equally important.
In terms of methodology, the Input output (IO) model assumes fixed coefficients in production but
ignores producers ‘responses to price changes, income feedbacks, and key resource constraints. The
SAM model extends the fixed coefficients assumption to the expenditure side of the economy as the IO
model ignores resource constraints. Comparison of results of Applied General Equilibrium (AGE) and
rest of the models in some of the studies, point to the fact that AGE models, when investment is fixed,
and its results may not be different from SAM and IO models (Valley , 2008b).
The importance of structural path analysis has been underlined in the literature (Defourny and
Thorbecke, 1984). This approach does not only identify the transmission channels of the shocks but
also identifies the impediments to the response mechanisms which are of particular significance to
policy makers. They also assert that embedded within the multi-sector social accounts of a Leontief
input-output model is the supply chain of each sector. Subsequently, using the global, total and direct
influence, Parra and Wodon (2010) introduced the concept of concentration, strength and speed of the
transmission channels. While an elementary path connects more than two poles, the direct influence
transmitted from pole along the path is equal to the product of the intensities of the arcs constituting the
path. The total influence is transmitted from origin to destination along the elementary path
encapsulating all indirect effects within the structure along that path (Para and Wodon, 2010). In this
respect, total influence captures the direct effects along the path and the indirect effects induced by the
circuits adjacent to this path. As indicated by Pyatt and Round (1979), the accounting and fixed price
multiplier remains a black box until it is decomposed, although this provides the first step of unearthing
the complex information embedded in endogenous variables. However, structural path analysis
founded on the concept of influence and its transmission to economic agents, provides a full set of
information on the endogenous interaction process which is more useful to policy makers (Lantner,
1974; Gazon, 1976).Isolating the accounting multiplier referred to as the global influence into total
influence allows policy makers to understand the response mechanism of the economic agents within a
complex network of structural relations embedded in the macroeconomic system.
4. Methodology
The SAM based general equilibrium framework is considered an appropriate approach to address the
study questions given its advantage of being able to capture the direct and indirect effects. In this
respect, the local content is captured by the backward and forward linkages while the second objective
on impact of energy prices is captured by a fixed price equilibrium model and structural path analysis.
It should be noted that the model is not dynamic.
The SAM price multiplier framework has been popularly used to analyze the economic impact of
energy prices on sub-Saharan African economies (Tlhalefang and Galebotswe, 2013; Ngunou et al,
2008; Parra and Wooden, 2008; Puskas, 2012). In this framework, the key assumptions include (a)
prices are determined independently of quantities; the input coefficients of producers as well as
consumption patterns of households are fixed; and (c) perfect price elasticity. What this means is that
no behavioural changes are expected and thence endogenous prices would only change owing to
changes in exogenous prices. The quantities supplied and demanded would also remain unaffected by
the changes. There are compelling reasons to believe that real output might not change in response to

10
the price shock. As indicated by Nordhaus (2007), in a world where technological change is exogenous,
there will be no response of multifactor productivity to price changes and hence the only response is
substitution along a given technological frontier. Using his example, if people continued driving,
flying, and using existing capital equipment at the same rate as before the price shock, all inputs and
outputs would be identical, and there would consequently be no productivity impact. In this respect, the
changes in endogenous variables would only stem from exogenous changes in the price of energy.
Additionally, the SAM based framework was preferred to computable general equilibrium model
(CGE) because of its ability to capture income distribution and households’ welfare in a much
simplified way. Additionally, the selected model was considered superior to Computable General
Equilibrium (CGE) in tracking the transmission mechanism of the energy shock to household groups
which would assist policy makers to locate policy impediments. For model details (see Para and
Wooden, 2008). The key model equations and insights are highlighted below:
From equation 1, denotes the matrix of average expenditure propensities. Equation 1 captures the
relationship between endogenous price and the exogenous shock (whose size is captured by ).
Equation 4 shows that the overall effect of a shock on each endogenous sector is a product of the price
multiplier and the size of the shock ( ). In this respect, the effect on prices of endogenous sectors
triggered by a unit change in the exogenous price in a given sector is determined by the price multiplier
(consistent with studies by Tlhalefang and Galebotswe, 2013; Ngunou et al., 2008; and Parra and
Wooden, 2008). In interpreting the results of the model, utilized the wisdom of Roland-Holst and
Sancho (1995). Provided that endogenous sectors include both activities and households, the price
multipliers on activities are interpreted as producer prices; and the price multipliers on households as
cost-of-living indices since they are computed as a weighted average of all the commodities and
services that households purchase plus the tax payments (Parra and Wooden, 2008). In this study, we
take note that linear models rule out elasticity of substitution and take due cognizance that perhaps
Input output and SAM models overestimate the effects of positive impacts in the short run, but they
give good clues of what may happen in the medium run even for large economies after labour and
capacity constraints are adjusted. In the short run, they may give good estimates when economy faces
negative shocks and factor prices adjust slowly.
Where is the SAM multiplier matrix or the inverse matrix which captures the direct and the indirect
effects of the exogenous shock ( ). In order to understand the structure as well as the mechanism
through which the external shock of size from the exogenous accounts affects the targeted
endogenous accounts, is decomposed (Para and Wooden, 2008; Thorbecke, 2000; Thorbecke and
11
Jung, 1996; Pansini, 2008 Cohen, 2013). Following the decomposition procedures prescribed in the
studies above, the final equation would be as follows:
Where is the transfer multiplier which captures the intra account effects of one variable to another
within the same production account. It is referred to as the Leontief multiplier. is a measure of the
open-loop effects which capture the effect of the exogenous shock or injection from one variable
belonging to one account to another belonging to a different account (refers to SAM accounts). It
captures the inter-account effects from the production account to factors and then to household. Finally,
measures the closed-loop effects which captures the circular flow of the injection from one account
walking its way through all the endogenous accounts.
5. Data
The data used in this study is based on a 2007 SAM for Uganda produced by Thurlow (2008). The
original SAM had 37 activities, 37 commodities, five factors and household groups; and nine other
accounts including savings-investment, enterprises and the rest of the world. The SAM represents an
open economy model of Uganda. The final SAM was balanced using entropy procedure which is
commonly used for this purpose to ensure consistence and equilibrium conditions. Table 1 gives us an
overall picture of the macroeconomic profile of the Ugandan economy. It is shown that 36.5 percent of
the costs of production for activities is accounted for by intermediate inputs, 17.9 percent by labor
payments, 6.7 percent by rent payment for land; and 38.9 percent by payments to capital. In terms of
total supply of commodities, production sectors spend 82.5 percent of total spending on marketed
domestic output including transport margins(satisfies 85.2 percent of total requirements) and 14.3
percent on imports(satisfies 14.8 percent of total requirements)3.
3 Percent of total requirements computed from Macro SAM not presented here).

12
Table 1: Technical coefficient matrix of the macro SAM for Uganda (in percent)
Activities Commodities Labor Land capital Household Enterprises Government Capital
account
Rest of
the
world
Activities 65.9
Commodities 36.5 16.5
89.8
42.6 98.8 51.8
Labor 17.9
Land 6.7
Capital 38.9
Households
100 100 1.8
96.7
Enterprises 98.2
Government
3.3
1.9 3.3 38
19
Capital
account 0 8.3 19.3 1.2 29.1
Rest of the
world 14.3
Source: Computed by author
Commodities spend 3.3 percent of their income in taxes. Labor and rental incomes are all used to pay
households for their own use. For the capital income, 1.8 percent go to households and the rest (98.2
percent) is transferred to enterprises where they have economic interests of generating a return on
income. The enterprises, however, eventually transfer 96.7 percent of their generated earnings to
households and use 3.3 percent to pay taxes. Households spend 89.8 percent of their income in final
consumption, 8.3 percent is deposited into a capital account (saving-investment) and the rest (1.9
percent) is used for payment of taxes. The government spends 42.6 percent of its income on recurrent
activities, 38.0 percent in transfers to its institutions and saving the rest (19.3 percent) on capital
account (savings-investment). In terms of total savings- investment, 98.8 percent is spent on producing
sectors (domestic borrowing), and the rest (1.2 percent) in capital account (saving-Investment). Foreign
exchange inflows from the rest of the world, 51.8 percent is generated by exports; 19.0 percent is grants
and loans to government; and 29.1 percent is foreign savings.
6. Empirical evaluation
6.1 Prospective local content in the energy sector
This subsection addresses the question of the prospective local content in the energy (petroleum) sector
which constitutes the first objective of this paper. The results show that energy sector (numbered 21) is
among the weak sectors of the economy with backward and forward linkages less than Unity (Figure 2
and Table 2 for code definitions). The low value of backward and forward link has important policy
relevance with regard to the opportunities for local content in the petroleum sector. It may explain in
part why governments are so interested in policies that could increase local content in supplying
industries. This means, the scope for increasing the participation (inputs from local firms) could be

13
substantial with a successful policy designed to improve backward link and the local content of the
sector. The low forward link suggests that the downstream of oil and gas sector is not well established
and hence the demand for output from this sector is low. This explains why the government is
interested in developing such sectors at home. This would allow beneficiation by creating value added
at home utilizing the domestic oil and gas sector. This may have the attendant benefit of gradually
eliminating the costs of international transportation. The recommended policies (upstream and
downstream), however, would have to be evaluated by their effectiveness and costs. Given that oil and
gas is a priority sector identified in the NDP, planned investment should also include costs for
establishing and or enhancing backward and forward linkage effects of the sector.
6.2 Sectoral impact of a rise in energy prices
The objective of this subsection is to understand the potential impact of the rise in the global energy
price in the petroleum sector on the prices of other sectors. The production of petroleum is not likely to
take place until 2020 and before this period the country will have to deal with the impact of high
energy prices. While the main focus of this study remains on an unconstrained model, the results of
constrained model are presented as a sensitivity analysis to alternative model specification. Under the
constrained multiplier analysis, the assumption of perfect price elasticity embedded in the
unconstrained price model is relaxed in the labour and capital markets (the price of skilled labour and
capital could be fixed in the short-run which could limit their response to external shock). For example
in an economy with staggered nominal wage contracts, the response of economic variables to
unexpected shocks varies with the sectoral labor intensity. Wages represent a bigger share of the
production cost for the labor-intensive sector. Nominal wages are fixed and an unexpected shock
affects the marginal cost in a limited way.

14
Table 2: Definition of codes in figure 2 and sector classification
Code 1 Sector Name Importance Forward and Backward Linkages
27 Trade services Key Sector Greater than 1
33 Real estate Key Sector Greater than 1
17 Food processing Key Sector Greater than 1
25 Construction Key Sector Greater than 1
35 Education Key Sector Greater than 1
29 Transport services Backward Oriented Sector Backward linkages greater than 1
26 Electricity and water Backward Oriented Sector Backward linkages greater than 1
6 Pulses and oil seeds Backward Oriented Sector Backward linkages greater than 1
5 Roots Backward Oriented Sector Backward linkages greater than 1
4 Cassava Backward Oriented Sector Backward linkages greater than 1
8 Matoke Backward Oriented Sector Backward linkages greater than 1
36 Health Backward Oriented Sector Backward linkages greater than 1
37 Other services Backward Oriented Sector Backward linkages greater than 1
15 Fish Backward Oriented Sector Backward linkages greater than 1
32 Business Services Backward Oriented Sector Backward linkages greater than 1
28 Hotel and catering Backward Oriented Sector Backward linkages greater than 1
19 Textile and clothing Backward Oriented Sector Backward linkages greater than 1
11 Coffee Backward Oriented Sector Backward linkages greater than 1
7 Horticulture Backward Oriented Sector Backward linkages greater than 1
3 Other Cereals Backward Oriented Sector Backward linkages greater than 1
1 Maize Backward Oriented Sector Backward linkages greater than 1
2 Rice Backward Oriented Sector Backward linkages greater than 1
9 Tobacco Backward Oriented Sector Backward linkages greater than 1
16 Mining Backward Oriented Sector Backward linkages greater than 1
14 Forestry Weak Sectors Both backward and forward linkages
less than 1
18 Beverage Weak Sectors Both backward and forward linkages
less than 1
30 Communications Weak Sectors Both backward and forward linkages
less than 1
31 Financial Services Weak Sectors Both backward and forward linkages
less than 1
22 Chemical Products Weak Sectors Both backward and forward linkages
less than 1
24 Other Manufacturing Weak Sectors Both backward and forward linkages
less than 1
23 Machinery Weak Sectors Both backward and forward linkages
less than 1
21 Petroleum Products(Energy) Weak Sectors Both backward and forward linkages
less than 1
34 Agricultural Services Weak Sectors Both backward and forward linkages
less than 1
10 Cotton Weak Sectors Both backward and forward linkages
less than 1
20 Wood and furniture Weak Sectors Both backward and forward linkages
less than 1
12 Other Crops Weak Sectors Both backward and forward linkages
less than 1

15
This assumption resulted into much lower increase in producer price index compared to an
unconstrained price model. Figure 3a reports the results from a simulation of a 31 percent (average
annual increases over the period 2017-2018) increase in global energy-price. Focusing on figure 3a, the
results suggest marked increase in the producer price index for transport services, communications,
forestry, horticulture, cereals, agricultural services, and trading sectors. The percentage increase in the
price index range from 1.55 percent to 3.47 percent. The overall producer price index increase by 3.68
percent suggesting that the effect is strong. Although oil imports constitute close to 8.4 percent of total
imports, the multiplier effects can be huge since all sectors are affected by energy prices directly and
indirectly (figure 3c). The implication of figure 3c is that there sectors with low direct energy
requirements which may still be highly affected by increased energy prices because they purchase
inputs from other sectors that use energy intensively(for example transport, and communication
sectors).
6.3 Impact on household welfare
In this section, we simulate the potential impact of a 31 percent increase in the prices of energy on the
cost of living for different types of households. This simulation reflects the average annual increase of
31 percent for the period 2017-2018 based on EIU annual price forecasts in 2015. The results suggest
that the impact of an oil price increase on household expenditure could range from 1.31 percent to 4.26
percent depending on the type of household group and price model (figure 4a and 4b). The overall cost
of living of households’ increases by 3.7 percent in an unconstrained price model and even much
slower (1.8 percent) in a constrained price model (with some factor price rigidities) in response to the
external energy shock. As indicated earlier, although the energy (petroleum) imports are not very large;
households spent 13.1 percent of their total income on direct oil consumption but the multiplier effects
are even higher due to path through effects to other sectors.

16
In this respect, intensive use of petroleum products in many of the production sectors which produce
consumption commodities demanded by households mean that the indirect price effects are important.
Given the structure of the economy, the effects of an oil price shock on households will be felt
primarily through the effects on prices of final goods and services that use refined petroleum products
as intermediate inputs. Indeed, expenditure on oil by production activities represented 5.7 percent of
total spending on intermediate consumption. Note that the welfare indicator implied by the model
employed in this paper is the consumer price index, where a rise in this measure indicates the amount
of additional income needed to purchase the original consumption basket. The losses in households’
welfare are largely due to open-loop effects. This is in view of the fact that the sector is classified as
weak with low forward and backward linkages.

17
Three findings stand out. The overall cost of living index for the rural and urban households rises by
3.94 and 3.81 percent respectively under the unconstrained price model. Similarly, the overall cost of
living index for the rural and urban household rise (though much less) by 1.87 and 2.04 percent
respectively under the constrained price model. The capital non-farm household which belongs to an
investment community is among the least affected by the price shock and its overall cost of living
index rise by 3.2 and 1.3 percent under unconstrained and constrained price model respectively. There
is a spatial dimension in terms of impact as the brunt of energy price shock is larger for the rural
household (rural nonfarm and rural farm) compared to the urban households (urban farm and urban
non-farm). However, the overall price impact will not only depend on direct consumption of petroleum
products but also on consumption of goods and services produced by high energy intensive sectors
(Figure 3c and later Table 3). The rural farm households are the most highly affected by these indirect
channels (section 6.4:-open-loop effects and 6.5 on indirect influences of cost of living). On aggregate,
urban households group’ spending on petroleum products is 30 percent of the spending by the rural
households group.
6.4 Price multiplier decomposition
Table 3 below shows the cost of living effect on the rural household groups of the price increase in the
petroleum products (CPETR). Across household groups, the close-loop (CL) effects tend to dominate
the open-loop (OL) effects. CL explain 59.3 percent (average) of the increase in the cost of living and
the rest is attributed to OL effects. Specifically, the CL effect range between 51.8 and 65.9 percent
while OL effects range between 36 and 48 percent. The dominance of CL over OL effects suggests that
the household groups are not highly dependent on the petroleum sector. However, rural non-farm and
the urban farm have a more balanced effect where the OL effects are slightly lower than the CL effects.
For example in the case of rural non-farm households, out of the 0.043 shilling (4.26 percent) increase

18
in the cost of living index following a 0.31 shilling (31 percent) exogenous cost increase in the price of
energy, 48.2 percent correspond to OL effects and the rest to CL effects. In contrast, for Rural farm,
capital non-farm, urban farm, Urban non-farm and enterprises, CL effects dominate the OL effects
suggesting that they are less dependent on direct energy consumption. Notwithstanding this, their
cost of living is highly affected by the indirect effects brought about by consuming commodities
produced by energy intensive sectors.
Table 3: Decomposing the price change
Source: Author’s computation
6.5 Path decomposition
As revealed by Table 4, in the presence of 0.31 (31 percent) price change in energy (CPETR), the cost
of living of the rural farm household group would rise by 0.036 (3.6 percent), largely attributed to the
direct path connecting the energy (petroleum) sector, which is 0.006 and this household group. As a
result of path multiplier, the direct influence is amplified to yield total price effect of 0.012 which is
equivalent to 32.5 percent of the overall price change in petroleum products4. This affirms the assertion
that large cost of living fluctuations in rural households is triggered by the changes in price of
petroleum products. Other important influences stem from the change in the cost of production for
forestry, education and transport services which affect rural household groups through high price of
forestry products; high payments for education services, and transport services. These indirect sectoral
path transmit 4.4, 3.5 and 3.4 percent of the price change respectively. Remember that these sectors are
among the top 5 consumers of petroleum products as already demonstrated in figure 2C).
4 In the context of Uganda, it appears there are some well to do households in rural areas who purchase forestry products
including timber and furniture for various reasons. These may include for use in household and for trading purposes. In the
detailed SAM rural non-farm spends 6 percent of their income on forestry products and rural non-farm spend 10 percent.
Origin of price increase Destination
Households
groups
Open-loop effects
(%)
Close-loop effects
(%)
Price change (%)
Petroleum products
(cPetr)
Rural farm 36.0 64.0 3.62
Rural non-farm 48.2 51.8 4.26
Capital non-farm 34.1 65.9 3.20
Urban farm 46.5 53.5 4.16
Urban non-farm 40.3 59.7 3.24
Enterprises 39.0 61.0 3.54

19
Table 4: Structural path analysis of the impact of global oil prices by household groups
Households
groups
Paths to destination household group (note:
c=consumption, a= production)
Global
(G)
Direct Path
multiplier
Total(T) T/G= (%)
Rural farm cpetr rural fam 0.036 0.006 1.873 0.012 32.529
cPetr afore cfore rural farm 0.036 0.001 1.944 0.002 4.378
cPetr aeduc ceduc rural farm 0.036 0.001 2.116 0.001 3.516
cPetr atran ctrans rural farm 0.036 0.001 1.947 0.001 3.367
Rural non-farm cpetr rural non-fam
0.043
0.013
1.226
0.016
38.1
cpetr afore cfore rural non-farm 0.043 0.001 1.315 0.002 4.1
Capital non-farm cpetr non-farm 0.320 0.004 1.281 0.005 15.3
cpetr acomm ccomm capital non-
farm
0.320 0.001 1.352 0.002 5.1
cpetr atran ctran capital non-farm 0.320 0.001 1.361 0.001 4.2
cpetr atran ctran capital non-farm 0.020 0.001 1.475 0.001 3.7
Urban farm cpetr urban farm 0.042 0.012 1.133 0.013 31.7
cpetr acomm ccomm urban farm 0.042 0.002 1.209 0.002 4.4
cpetr aeduc ceduc urban farm 0.042 0.001 1.319 0.002 3.7
Urban non-farm cpetr urban non-farm 0.035 0.006 1.133 0.006 18.3
cpetr acomm ccomm urban non-
farm
0.035 0.001 1.209 0.002 4.7
cpetr aeduc ceduc urban non-farm 0.035 0.001 1.319 0.001 4.0
Source: Author’s Computation
For the rural non-farm households, a 0.31 (31 percent) price change in energy (CPETR) increases the
cost of living of the rural non-farm household group by 0.045 (4.5 percent). As a result of path
multiplier, the direct influence is amplified to yield total price effect of 0.016 which is equivalent to
38.1 percent of the overall price change in petroleum products. Another important influence derives
from the change in the cost of production for forestry, affecting the rural household groups through
high price of forestry products. This indirect path transmits 4.1 percent of the overall price change.
Like the rural households, the cost of living for the urban households which comprise farm and non-
farm is directly influenced in more important ways by changes in energy prices. A 31 percent price
change directly increases the cost of living for the urban farm and urban non-farm by 4.2 and 3.5
percent respectively. The total price effect for the urban farm and urban non-farm represent 31.7 and
18.3 of the global price change respectively. The change in the cost of living urban farm and non-farm
20
is indirectly influenced by increases in the cost of communication services and payments for education
services which are respectively triggered by the adjustments in their respective costs of production as
prices of energy changes. The last column maps the total price effect in relation to the global price (in
percent). For the Urban farm households, the total price effect in relation to the global price change for
communication services is 4.4 percent and education is 3.7 percent. Compared to the urban farm
households which experience 4.4 and 3.7 percent effect from communication and education
respectively, the urban non-farm households experience a much higher effect, which is 4.7 and 4.0
percent respectively. Communication is an indirect transmitter of energy prices to capital non-farm
households (the total price effect of 5.1 percent in relation to global price). The direct path from energy
prices to the capital non-farm households, however, transmits 15.3 percent (total price effect) of the
global price change.
7. Policy discussion, recommendations and conclusions
The analysis has underpinned the issue of whether the pre oil economic structure exhibit signs of local
content within the energy sector as defined in this study. The findings have indicated that local content
is still a challenge as evidenced by the low backward and forward linkages of the energy sector (still a
weak sector). There is a clear justification for the government to seek for policies which are tailored
towards establishing and enhancing both the backward and forward linkages of this sector. The forward
linkages facilitate the setting up of forward processing of crude oil comprise its transformation to
produce gasoline, diesel, kerosene, and other by-products. In view of this, the forward linkages can
have a very large impact on development in form of establishment of downstream industrial activities.
Further downstream activities could include among others detergents, fertilizers, and fine chemicals.
Setting up of indigenous oil production could result in the establishment of refineries which could
facilitate the development of petrochemicals industries. In order to design well informed policies, it is
imperative that a follow up study on the determinants of linkages is conducted when important
activities in the energy sector start. This is expected to guide policy interventions. The crowding out
effects of the energy sector with respect to other key sectors of the economy in terms of access to
finance and talented workers should be closely monitored and avoided as this can easily cause a major
distortion within the economy. Given that oil and gas is a priority sector identified in the NDP, planned
investments should also include costs for establishing and or enhancing backward and forward linkage
effects of the sector. This would allow the prospective investment in oil and gas sector to have
maximum impact on the rest of the sectors in the economy. A similar recommendation would be
helpful for the rest of the priority investment sectors identified in the NDP but are still lacking in terms
of their linkage effects.
While we acknowledge that the results from our analysis should be treated with some caution owing to
some of the assumptions of the fixed price model which among others may overstate the impact of
price shocks due to its inability to fully take into account behavioral reactions to price increases, they
do provide some pointers as well as stylized facts that are important when implementing policies which
aim to counteract some of the negative impact of higher energy prices for the household groups. More
importantly, the results of the structural path analysis model is superior to even computable general
equilibrium models in tracking the transmission mechanism of the energy shock to household groups
which would assist policy makers to locate policy impediments. The results of the simulation of the 31
21
percent increase in the price of energy on production cost of various sectors suggest modest increase in
the producer price index for transport services, communications, forestry, horticulture, cereals,
agricultural services, and trading sectors. The percentage increase in the price index range from 1.55 to
3.47 percent. The overall producer price index increased by 3.68 percent suggesting that the effect is
modest. This is in view of the fact that energy imports constitute 8.4 percent of total imports. The
overall cost of living of households’ increases by 1.8 to 3.7 percent following a 31 percent increase in
the energy prices depending on the kind of fixed price model. The induced effects of the energy price
increase on the household groups tend to dominate meaning that the households are more highly
affected by price feedbacks from consuming goods produced by energy intensive sectors than direct
consumption of the energy products.
Structural path analysis of the movement of the global energy shock to the household groups has
revealed that 15 to 38 percent of the increase in the cost of living of the households is triggered by
direct consumption of energy products. The most highly affected by this path is the rural non-farm
followed by the rural farm and then the urban farm household groups (vulnerable household groups).
The least affected by this path are the urban non-farm and the Capital non-farm. A well designed and
targeted energy policy to counteract these effects, in particular, after identifying the kind of energy
products directly consumed by these household groups will have desirable positive effects on
protecting the welfare of the highly vulnerable household groups. Other influences on the cost living of
the most vulnerable groups stem from the change in the cost of production for forestry, education,
transport, and communication services triggered by energy prices. This affects vulnerable household
groups through high price of forestry products; transport, high payments for education, and
communication services. Energy triggered high prices for forestry products affects the rural farm and
non-farm household groups while energy triggered payments for education affects rural farm and urban
farm households. Energy triggered payments for high communication services largely affects the urban
farm households. A more detailed study is needed to allow a deeper understanding of these dynamics.
22
References
Abeysinghe, T. (2001), “Estimation of Direct and Indirect Impact of Oil Price on Growth”, Department of
Economics, National University of Singapore,
https://courses.nus.edu.sg/course/ecstabey/Tilak%20EL%20oil.pdf
Chenery, H. B. and Watanabe, T. (1958), "International comparisons of the structure of production",
Econometrica, vol. 26, 487-521.
Defourny, J. and Thorbecke.E. (1984), “Structural Path Analysis and Multiplier Decomposition within a Social
Accounting Matrix”, Economic Journal, 94: 111-136.
Economist Intelligence Units. (2015), “Economic and Commodity Forecast”, December.
Freeman, C. (1995), “The National System of Innovation in Historical Perspective”, Cambridge Journal of
Economics.
Gazon, J. (I976), 'Transmission de l'inftuence economique. Une approache structurale.' Collection de l'I.M.E.,
no. I3, Sirey, Paris in Oyejid, T. Ademola and Adewuye, O.Adeolu.(2011), Enhancing Linkages of Oil and
Gas Industry in the Nigerian economy”, Trade Policy Research and Training Programme (TPRTP),
Department of Economics, University of Ibadan, MMCP Discussion Paper No. 8.
Gwayaka, M.P. (2014), “Local Content in Oil and Gas Sector: An Assessment of Uganda’s Legal and
Policy Regimes”, ACODE Policy Briefing Paper Series No.28
Hanson, K., S. Robinson, and G. Schluter. (1993), “Sectoral Effects of a World Oil Price Shock: Economy wide
Linkages to the Agricultural Sector”, available at
https://core.ac.uk/download/files/153/6553645.pdf
Karman, Deniz et al.(2008), “Technical and Policy Implications of Transportation Biofuel Regulatory
Approaches”, Ottawa: Natural Resources Canada, July.
Korhonen and Ledyaeva . (2008), “Trade Linkages and Macroeconomic effects of the Price of Oil” BOFIT
Discussion Papers.
Mathews, J.A. (2002), ‘Competitive Advantages of the Latecomer Firm: A Resource Based Account of
Industrial Catch-up Strategies, Asia Pacific Journal of Management, nr 19, p. 467-488.
Ministry of Energy and Mineral Development. (2011), “Enhancing National Participation in the Oil and Gas
Industry in Uganda”, September.
Nelson, J. (2007, “Building Linkages for Competitive and Responsible Entrepreneurship”, Cambridge: UNIDO:
Harvard University. Available at
https://www.unido.org/fileadmin/user_media/Services/PSD/CSR/Building_Linkages_for_Competitive_and
_Responsible_Entrepreneurship.pdf.
Ngunou, J. P., C. Parra, and Q. Woden. (2008), “Oil Price Shocks, Poverty and Gender: A Social Accounting
Matrix Analysis for Kenya”, in Bussolo, Maurizio; De Hoyos, Rafael E. (2009), Gender Aspects of the
Trade and Poverty Nexus: A Macro-Micro Approach. Equity and Development; Washington, DC: World
Bank and Palgrave Macmillan. © World Bank.
Nordhaus, William D. (2007), “Who’s afraid of a big bad oil shock?”, Brookings Papers on Economic
Activity 2: 219-240.
Oyejid, T.Ademola and Adewuye, O.Adeolu. (2011), “Enhancing Linkages of Oil and Gas Industry in the
Nigerian economy”, Trade Policy Research and Training Programme (TPRTP), Department of Economics,
University of Ibadan, MMCP Discussion Paper No. 8.

23
Parra, J. C. and Q. Wodon. (2008), “Comparing the Impact of Food and Energy Price Shocks on Consumers: A
Social Accounting Matrix Analysis for Ghana”, World Bank, Policy Research Working Paper 4741
Parra,J.c. and Woodon,Q.(2010), “A tool for the analysis of input-output tables and social accounting
matrices”, the World Bank, October.
Puskas, P. 2012. Impact of Food-price Shocks on the Botswana Economy: A SAM-Price multiplier Model
Analysis, Bachelors Arts (economics) Project, Department of Economics, University of Botswana.
Pyatt, G., and J. Round (1979): “Accounting and Fixed Price Multipliers in a Social Accounting Matrix
Framework,” The Economic Journal, 89 (356), 850-873.
Pyatt, G. and Thorbecke, E.(1976), “Planning Techniques for a Better Future”, Geneva, ILO.
Pansini,V.R.(2008), “Multiplier Decomposition, Poverty and inequality in income distribution in SAM
framework: the Vietnamese Case”.
Tlhalefang, J. and Galebotswe, O.(2013), “Welfare Effects of Higher Energy and Food Prices in Botswana: A
SAM Price Multiplier Analysis”, Botswana Journal of Economics.
Thobecke, E. (2006), “Social Accounting Matrices in Modeling”, Cornell University.
Thobecke, E.(2000). “The Use of Social Accounting Matrices in Modeling”, Paper prepared for the Twenty
Sixth General Conference of the International Association for Research in Income and Wealth, Cracow,
Poland, August 27–September 2.
Thorbecke, Erik, and Hong-Sang Jung. (1996), “A Multiplier Decomposition Method to Analyze Poverty
Alleviation”, Journal of Development Economics 48 (2): 279–300.
Thurlow, J. 2008. "A 2007 Social Accounting Matrix for Uganda", International Food Policy Research Institute,
Washington, D.C.
Rasmussen, P.N. (1956), “Studies in Intersectorial Relations, Amsterdam, North-Holland P.C. Schultz S. (1977)
Approaches to Identifying Key Sectors Empirically by Means of Input-Output Analysis”, Journal of
Development Studies, 14.
UNCTAD/CALAG (2006) “Creating Local Linkages by Empowering Indigenous Entrepreneurs”, African Oil
and Gas Services Sector Survey, Vol 1-Nigeria. United Nations Conference on Trade and Development.
24
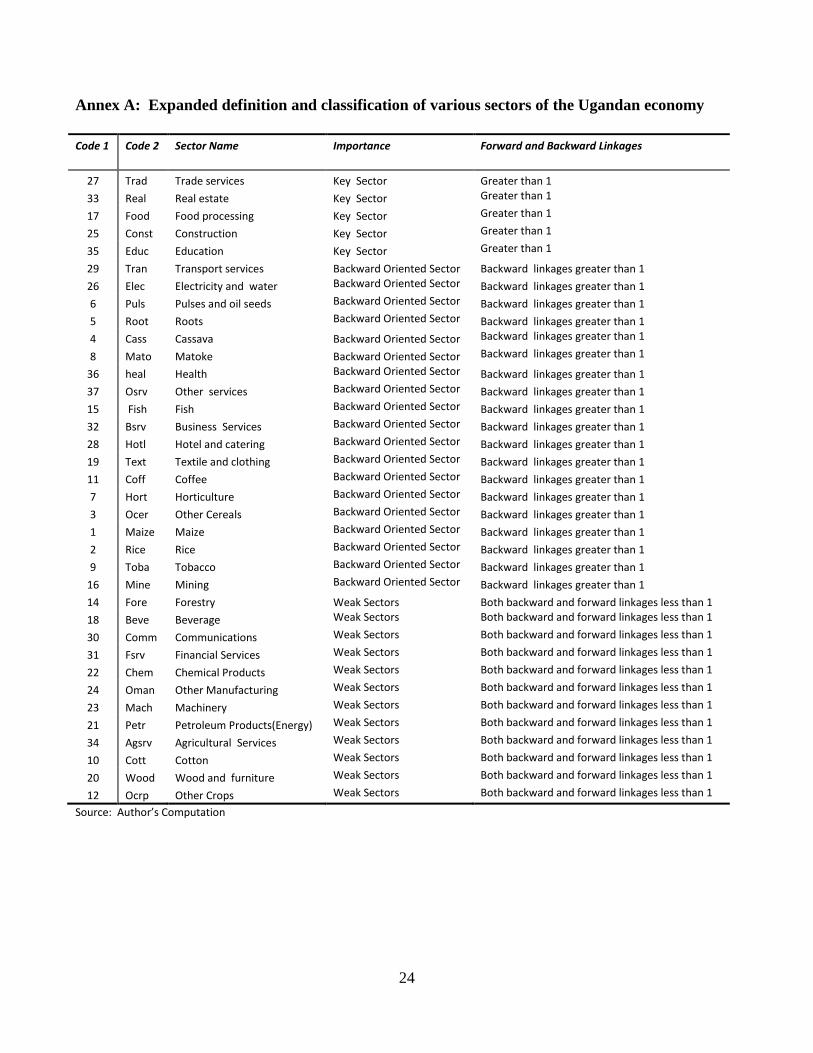
Annex A: Expanded definition and classification of various sectors of the Ugandan economy
Code 1 Code 2 Sector Name Importance Forward and Backward Linkages
27 Trad Trade services Key Sector Greater than 1
33 Real Real estate Key Sector Greater than 1
17 Food Food processing Key Sector Greater than 1
25 Const Construction Key Sector Greater than 1
35 Educ Education Key Sector Greater than 1
29 Tran Transport services Backward Oriented Sector Backward linkages greater than 1
26 Elec Electricity and water Backward Oriented Sector Backward linkages greater than 1
6 Puls Pulses and oil seeds Backward Oriented Sector Backward linkages greater than 1
5 Root Roots Backward Oriented Sector Backward linkages greater than 1
4 Cass Cassava Backward Oriented Sector Backward linkages greater than 1
8 Mato Matoke Backward Oriented Sector Backward linkages greater than 1
36 heal Health Backward Oriented Sector Backward linkages greater than 1
37 Osrv Other services Backward Oriented Sector Backward linkages greater than 1
15 Fish Fish Backward Oriented Sector Backward linkages greater than 1
32 Bsrv Business Services Backward Oriented Sector Backward linkages greater than 1
28 Hotl Hotel and catering Backward Oriented Sector Backward linkages greater than 1
19 Text Textile and clothing Backward Oriented Sector Backward linkages greater than 1
11 Coff Coffee Backward Oriented Sector Backward linkages greater than 1
7 Hort Horticulture Backward Oriented Sector Backward linkages greater than 1
3 Ocer Other Cereals Backward Oriented Sector Backward linkages greater than 1
1 Maize Maize Backward Oriented Sector Backward linkages greater than 1
2 Rice Rice Backward Oriented Sector Backward linkages greater than 1
9 Toba Tobacco Backward Oriented Sector Backward linkages greater than 1
16 Mine Mining Backward Oriented Sector Backward linkages greater than 1
14 Fore Forestry Weak Sectors Both backward and forward linkages less than 1
18 Beve Beverage Weak Sectors Both backward and forward linkages less than 1
30 Comm Communications Weak Sectors Both backward and forward linkages less than 1
31 Fsrv Financial Services Weak Sectors Both backward and forward linkages less than 1
22 Chem Chemical Products Weak Sectors Both backward and forward linkages less than 1
24 Oman Other Manufacturing Weak Sectors Both backward and forward linkages less than 1
23 Mach Machinery Weak Sectors Both backward and forward linkages less than 1
21 Petr Petroleum Products(Energy) Weak Sectors Both backward and forward linkages less than 1
34 Agsrv Agricultural Services Weak Sectors Both backward and forward linkages less than 1
10 Cott Cotton Weak Sectors Both backward and forward linkages less than 1
20 Wood Wood and furniture Weak Sectors Both backward and forward linkages less than 1
12 Ocrp Other Crops Weak Sectors Both backward and forward linkages less than 1
Source: Author’s Computation

Recent Publications in the Series
nº Year Author(s) Title
241 2016 Paul Christian and Brian Dillon Long term consequences of consumption seasonality
240 2016 Kifle Wondemu and David Potts The Impact of the Real Exchange Rate Changes on
Export Performance in Tanzania and Ethiopia
239 2016 Audrey Verdier-Chouchane and
Charlotte Karagueuzian
Concept and Measure of Inclusive Health across
Countries
238 2016
Sébastien Desbureaux, Eric
Nazindigouba Kéré and Pascale
Combes Motel
Impact Evaluation in a Landscape: Protected Natural
Forests, Anthropized Forested Lands and Deforestation
Leakages in Madagascar’s Rainforests
237 2016 Kifle A. Wondemu Decomposing sources of Productivity Change in Small
Scale Farming in Ethiopia
236 2016 Jennifer Denno Cissé and
Christopher B. Barrett
Estimating Development Resilience: A Conditional
Moments-Based Approach
235 2016 Daniel Ayalew Mekonnen, Nicolas
Gerber and Julia Anna Matz
Social networks, agricultural innovations, and farm
productivity in Ethiopia
234 2016 Megan Sheahan, Christopher B.
Barrett and Casey Goldvale
The unintended consequences of agricultural input
intensification: Human health implications of agro-
chemical use in Sub-Saharan Africa
233 2016 Adamon N. Mukasa
Technology Adoption and Risk Exposure among
Smallholder Farmers: Panel Data Evidence from
Tanzania and Uganda
232 2015 Linguère Mously Mbaye Remittances and Access to Rural Credit Markets:
Evidence from Senegal


![Global forced displacement has ... - [Revelation-Now]€¦ · Global forced displacement has increased in 2015, with record-high numbers. By the end of the year, 65.3 million individuals](https://img.pdfslide.us/doc/110x75/609e451e5da63e22597574bb/global-forced-displacement-has-revelation-now-global-forced-displacement.jpg)