Embed Size (px)
Citation preview

US PRODUCTIVITY GROWTH:THE COMPANY AND SECTOR STORY
CONFIDENTIAL AND PROPRIETARY
Any use of this material without specific permission of McKinsey & Company is strictly prohibited
UNDERSTANDING THE PRODUCTIVITY SLOWDOWN
PETERSON INSTITUTE FOR INTERNATIONAL ECONOMICS
OCTOBER 16, 2015
McKinsey & Company | 111
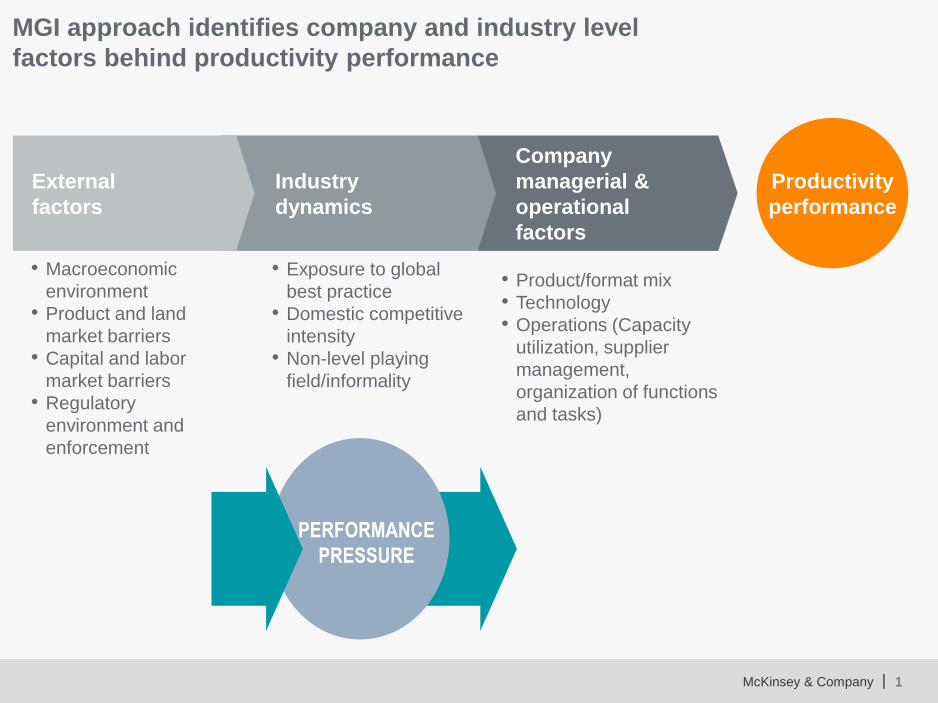
Company
managerial &
operational
factors
Industry
dynamics
Productivity
performance
• Exposure to global
best practice
• Domestic competitive
intensity
• Non-level playing
field/informality
• Product/format mix
• Technology
• Operations (Capacity
utilization, supplier
management,
organization of functions
and tasks)
External
factors
• Macroeconomic
environment
• Product and land
market barriers
• Capital and labor
market barriers
• Regulatory
environment and
enforcement
MGI approach identifies company and industry level
factors behind productivity performance
PERFORMANCE
PRESSURE
McKinsey & Company | 2
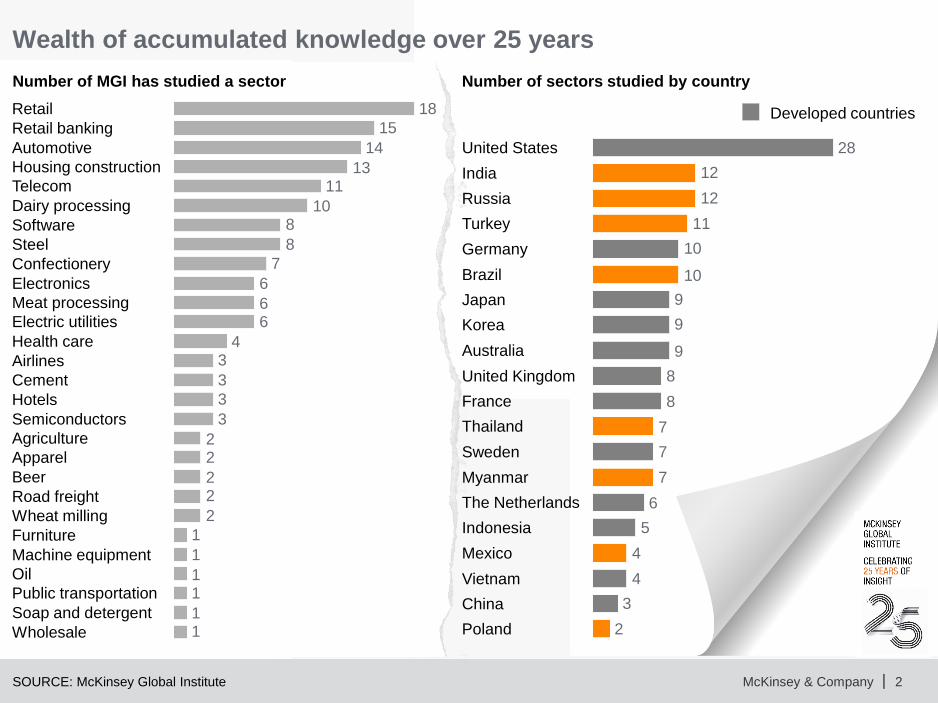
Wealth of accumulated knowledge over 25 years
11
11
1
1
2
22
22
3
3
3
34
66
6
7
8
810
1113
14
15
18
Retail banking
Retail
Automotive
Furniture
Oil
Beer
Machine equipment
Agriculture
Apparel
Road freight
Hotels
Cement
Wheat milling
Semiconductors
Steel
Software
Meat processing
Dairy processing
Telecom
Electric utilities
Housing construction
Health care
Electronics
Confectionery
Airlines
Soap and detergent
Public transportation
Wholesale
SOURCE: McKinsey Global Institute
Number of MGI has studied a sector Number of sectors studied by country
2
3
4
4
5
6
7
7
7
8
8
9
9
9
10
10
11
12
12
28
Sweden
France
United Kingdom
Mexico
Thailand
China
Vietnam
The Netherlands
Poland
Indonesia
Myanmar
Australia
Korea
Japan
Brazil
Turkey
Russia
India
Germany
United States
Developed countries

McKinsey & Company | 3
US productivity growth: the company and sector story
Productivity growth
is an evolving
sector story
There are large
opportunities across
all industries to
raise productivity
growth
What can catalyze
future productivity
growth spurts?

McKinsey & Company |
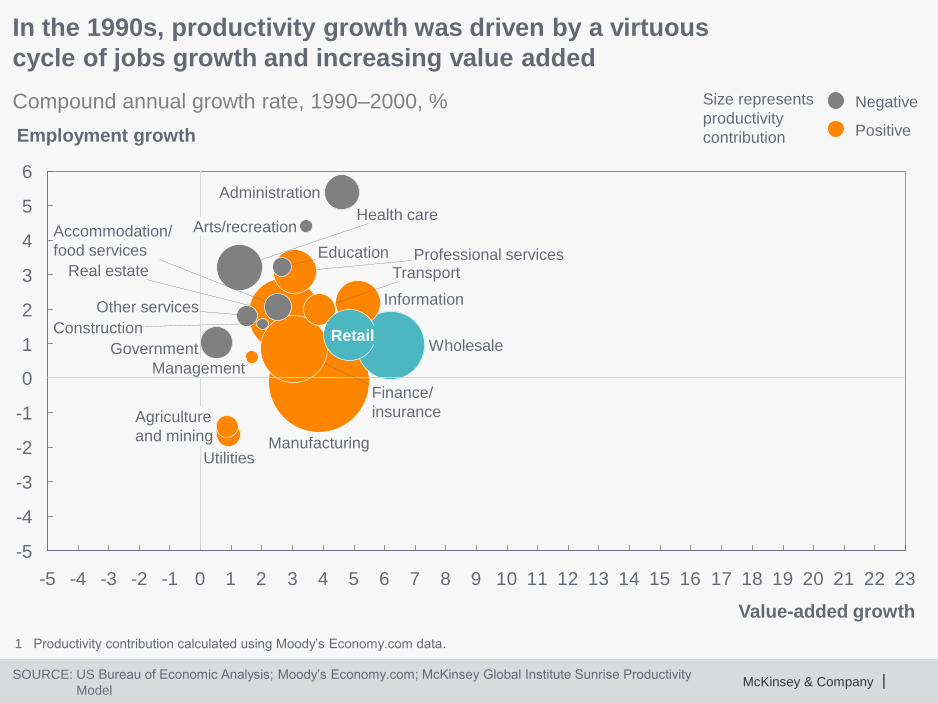
In the 1990s, productivity growth was driven by a virtuous
cycle of jobs growth and increasing value added
-5
-4
-3
-2
-1
0
1
2
3
4
5
6
-5 -4 -3 -2 -1 0 1 2 3 4 5 6 7 8 9 10 11 12 13 14 15 16 17 18 19 20 21 22 23
Professional services
Manufacturing
Agriculture
and mining
Wholesale
Utilities
Management
Government
Construction
Accommodation/
food services
Retail
Value-added growth
Employment growth
Real estate
Information
Administration
Finance/insurance
Other services
Transport
Health care
Education
Arts/recreation
Negative
Positive
Compound annual growth rate, 1990–2000, %
1 Productivity contribution calculated using Moody’s Economy.com data.
.
Size represents
productivity
contribution
SOURCE: US Bureau of Economic Analysis; Moody’s Economy.com; McKinsey Global Institute Sunrise Productivity
Model
McKinsey & Company |
In the 1990s, productivity growth was driven by a virtuous
cycle of jobs growth and increasing value added
-5
-4
-3
-2
-1
0
1
2
3
4
5
6
-5 -4 -3 -2 -1 0 1 2 3 4 5 6 7 8 9 10 11 12 13 14 15 16 17 18 19 20 21 22 23
Utilities
Transport
Education
Employment growth
Management
Professional servicesReal estate
Value-added growth
Government
Manufacturing
Construction
Finance/
insurance
Arts/recreation
Other services
RetailWholesale
Information
Health care
Agriculture
and mining
Administration
Accommodation/
food services
Negative
Positive
Compound annual growth rate, 1990–2000, %
1 Productivity contribution calculated using Moody’s Economy.com data.
Size represents
productivity
contribution
SOURCE: US Bureau of Economic Analysis; Moody’s Economy.com; McKinsey Global Institute Sunrise Productivity
Model
McKinsey & Company | 6
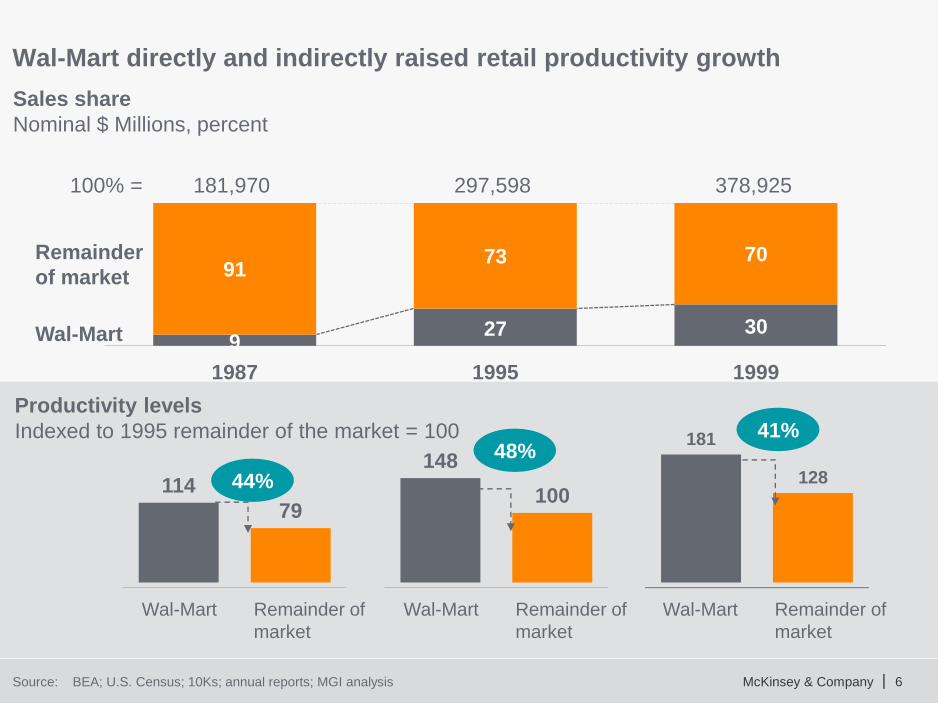
Wal-Mart directly and indirectly raised retail productivity growth
Source: BEA; U.S. Census; 10Ks; annual reports; MGI analysis
927 30
9173 70
1987 1995 1999
Wal-Mart
Remainder
of market
100% = 181,970 297,598 378,925
114
79
148
100
181
128
Wal-Mart Remainder of
market
Wal-Mart Remainder of
market
Wal-Mart Remainder of
market
Sales share
Nominal $ Millions, percent
Productivity levels
Indexed to 1995 remainder of the market = 100
44%
48%41%

McKinsey & Company |
Between 2000-2008, large productivity improvements came from
efficiency gains that often were accompanied by job losses
-5
-4
-3
-2
-1
0
1
2
3
4
5
6
-5 -4 -3 -2 -1 0 1 2 3 4 5 6 7 8 9 10 11 12 13 14 15 16 17 18 19 20 21 22 23
Value-added growth
Health care
Construction
Accommodation/
food services
Government
Real estate
Manufacturing
Finance/insurance
Other services
Information
Education
Arts/recreation
Agriculture
and mining
Management
Computers/
electronics
Professional services
AdministrationUtilities
Retail
Employment growth
Wholesale
Transport
Positive
NegativeCompound annual growth rate, 2000–08, % Size represents
productivity
contribution
SOURCE: US Bureau of Economic Analysis; Moody’s Economy.com; McKinsey Global Institute Sunrise
Productivity Model
1 Productivity contribution calculated using Moody’s Economy.com data.
McKinsey & Company | 8
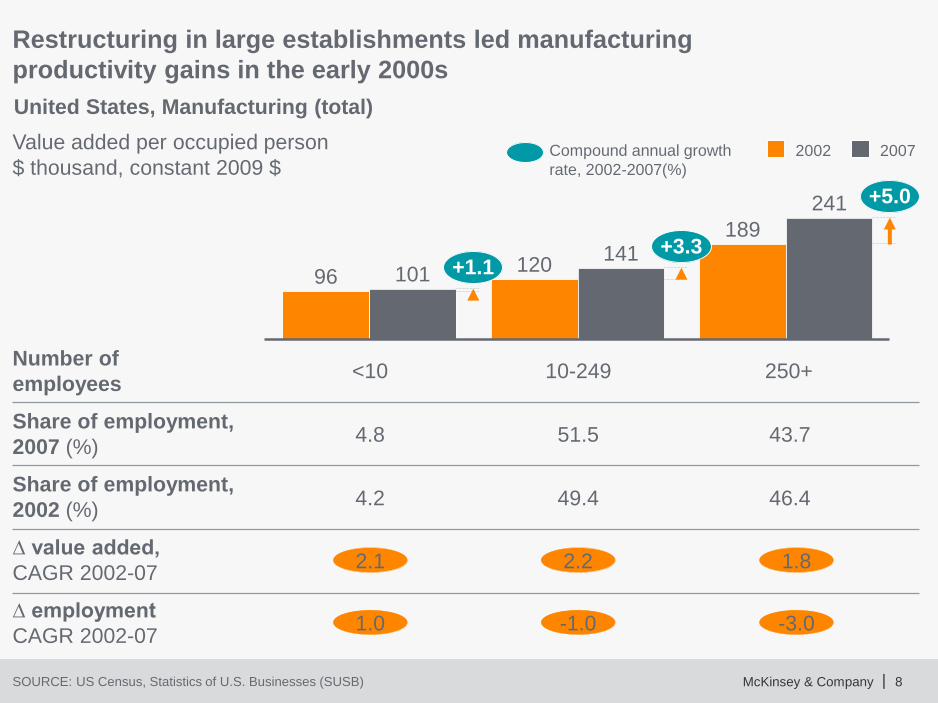
United States, Manufacturing (total)
Restructuring in large establishments led manufacturing
productivity gains in the early 2000s
+5.0
+3.3120+1.1
241
14110196
189
2002 2007
SOURCE: US Census, Statistics of U.S. Businesses (SUSB)
Value added per occupied person
$ thousand, constant 2009 $Compound annual growth
rate, 2002-2007(%)
Number of
employees<10 10-249 250+
Share of employment,
2007 (%)4.8 51.5 43.7
Share of employment,
2002 (%)4.2 49.4 46.4
∆ value added,
CAGR 2002-072.1 2.2 1.8
∆ employment
CAGR 2002-071.0 -1.0 -3.0

McKinsey & Company |
Most sectors contributed positively to productivity after the recession,
while employment contracted in most industries
-5
-4
-3
-2
-1
0
1
2
3
4
5
6
-5 -4 -3 -2 -1 0 1 2 3 4 5 6 7 8 9 10 11 12 13 14 15 16 17 18 19 20 21 22 23
Administration
Accommodation/
food services
Manufacturing
Professional services
Real estate
Transport
Retail
Information
Health care
Government
Finance/insurance
Education
Construction
Mining
Computers/electronics
Agriculture and forestry
Other services
Value-added growth
Employment growth
Wholesale
Negative
PositiveSize represents
productivity
contribution
Compound annual growth rate, 2008-2013, %
SOURCE: US Bureau of Economic Analysis; Moody’s Economy.com; McKinsey Global Institute
Sunrise Productivity Model
1 Productivity contribution calculated using Moody’s Economy.com data.
McKinsey & Company | 10
US productivity growth: the company and sector story
Productivity growth
is an evolving
sector story
There are large
opportunities across
all industries to
raise productivity
growth
What can catalyze
future productivity
growth spurts?
McKinsey & Company | 11
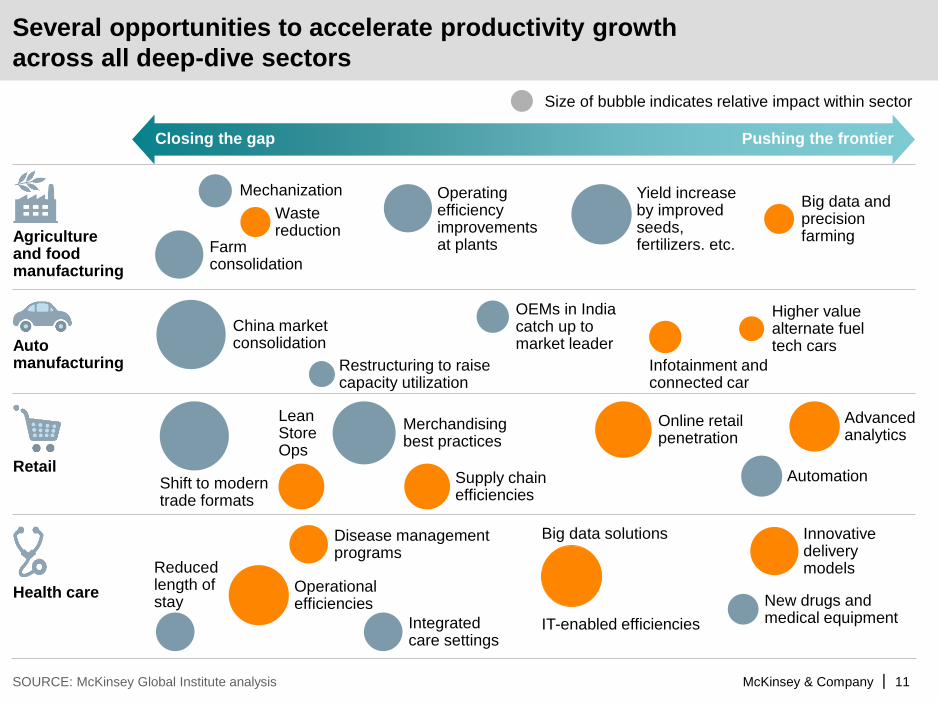
Several opportunities to accelerate productivity growth
across all deep-dive sectors
SOURCE: McKinsey Global Institute analysis
Pushing the frontierClosing the gap
Size of bubble indicates relative impact within sector
Mechanization Yield increase by improved seeds, fertilizers. etc.
Waste reduction
Farm consolidation
Big data and precision farming
Operating efficiency improvements at plants
Agriculture and food manufacturing
China market consolidation
Restructuring to raise capacity utilization
OEMs in India catch up to market leader
Infotainment and connected car
Higher value alternate fuel tech carsAuto
manufacturing
Shift to moderntrade formats
Lean Store Ops
Merchandisingbest practices
Supply chain efficiencies
Advanced analytics
Automation
Online retail penetration
Retail
Innovative delivery models
Operational efficiencies
Reduced length of stay
Disease management programs
IT-enabled efficiencies
Big data solutions
Integrated care settings
New drugs and medical equipment
Health care
McKinsey & Company | 12
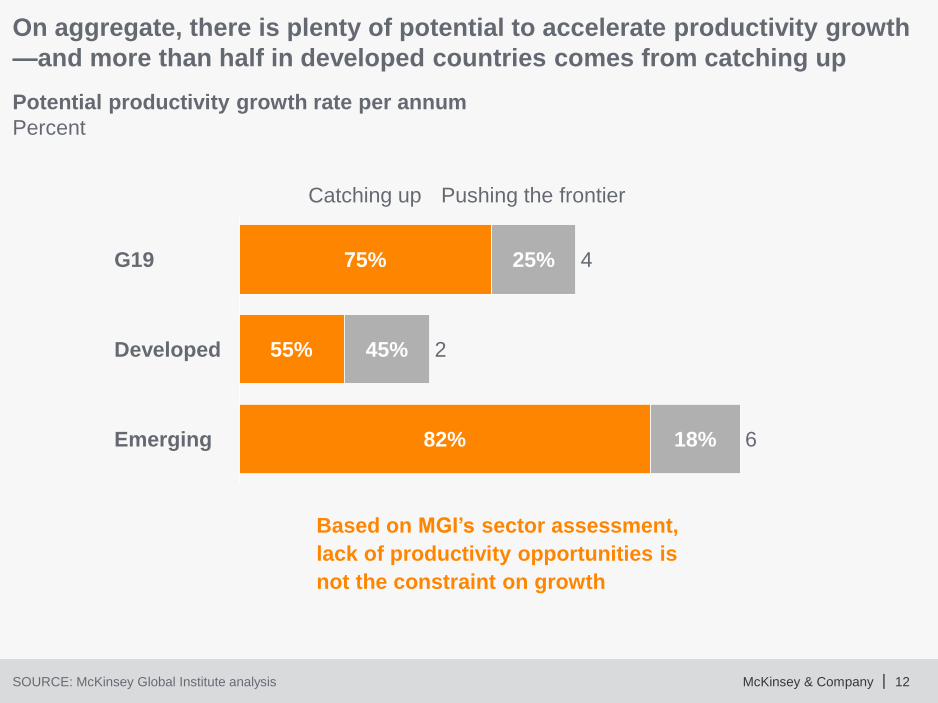
Pushing the frontier
6
Catching up
Emerging
475% 25%G19
82%
Developed
18%
45% 255%
On aggregate, there is plenty of potential to accelerate productivity growth
—and more than half in developed countries comes from catching up
SOURCE: McKinsey Global Institute analysis
Based on MGI’s sector assessment,
lack of productivity opportunities is
not the constraint on growth
Potential productivity growth rate per annum
Percent

McKinsey & Company | 13
US productivity growth: the company and sector story
Productivity growth
is an evolving
sector story
There are large
opportunities across
all industries to
raise productivity
growth
What can catalyze
future productivity
growth spurts?
McKinsey & Company | 14
Potential catalysts for productivity growth spurts
▪ Regulatory changes
▪ Technology-enabled
productivity growth
▪ Increased competition
▪ Other?
McKinsey & Company |
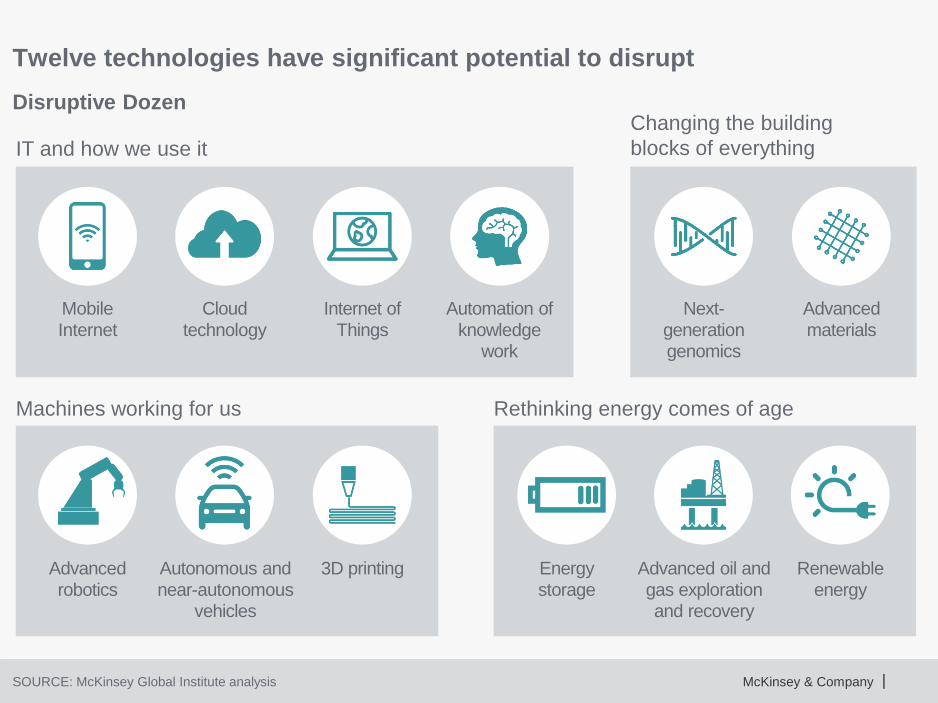
Twelve technologies have significant potential to disrupt
SOURCE: McKinsey Global Institute analysis
Disruptive Dozen
IT and how we use it
Mobile
Internet
Cloud
technology
Internet of
Things
Automation of
knowledge work
Changing the building
blocks of everything
Next-
generation genomics
Advanced
materials
Machines working for us
Autonomous and
near-autonomous vehicles
Advanced
robotics
3D printing
Rethinking energy comes of age
Advanced oil and
gas exploration and recovery
Energy
storage
Renewable
energy

@JaanaRemes
@McKinsey_MGI
DOWNLOAD MGI RESEARCH AT
WWW.MCKINSEY.COM./MGI