Embed Size (px)
Citation preview

Ocean Engineering ∎ (∎∎∎∎) ∎∎∎–∎∎∎
Contents lists available at ScienceDirect
Ocean Engineering
http://d0029-80
n CorrE-m
Pleasanaly
journal homepage: www.elsevier.com/locate/oceaneng
Understanding the power requirements of autonomous underwatersystems, Part I: An analytical model for optimum swimming speedsand cost of transport
A.B. Phillips a, M. Haroutunian b,n, A.J. Murphy b, S.W. Boyd a, J.I.R. Blake a, G. Griffiths c
a University of Southampton, Southampton, SO17 1BJ, UKb Newcastle University, Newcastle, NE1 7RU, UKc National Oceanography Centre, University of Southampton Waterfront Campus, Southampton SO14 3ZH, UK
a r t i c l e i n f o
Article history:Received 16 April 2015Accepted 7 December 2015
Keywords:BioinspirationAutonomous underwater vehiclesHydrodynamicsCost of transport
x.doi.org/10.1016/j.oceaneng.2015.12.01418/& 2015 The Authors. Published by Elsevie
esponding author. Tel.: þ0191 208 6104.ail address: [email protected] (M
e cite this article as: Phillips, A.B., etical model for optimum swimming
a b s t r a c t
Many marine species exhibit capabilities that would be desirable for manmade systems operating in themaritime environment. However, without detracting from the potential, if bioinspiration is to provebeneficial, it is important to have a consistent set of metrics that allow fair comparison, without bias,when comparing the performance of engineered and biological systems. In this study we focus onderiving an unbiased metric of performance applicable to marine animals and engineered subseavehicles for one of the most fundamental of properties; that of the energy cost of locomotion. We presenta rational analytical model of the physics behind the total energy cost of locomotion applicable to bothbiological and engineered autonomous underwater marine systems. This model proposes the use of anequivalent spheroid efficiency as a fair metric to compare engineered and biological systems. The modelis then utilised to identify how changes in mass, speed, spheroid efficiency and hotel load impact theperformance of the system.& 2015 The Authors. Published by Elsevier Ltd. This is an open access article under the CC BY license
(http://creativecommons.org/licenses/by/4.0/).
1. Introduction
Biologically inspired swimmers are flourishing with variousprototypes of a new generation of biomimicked vehicles beingbuilt. These include the “GhostSwimmer” which is being tested bythe US Navy (Telepraph, 2014), the “Mantabot” which mimickesthe swimming of a ray (Unmanned, 2012) and the Aqua Jelly(jellyfish) developed by Festo (Festo, 2013). Bioinspiration andbiomimetics have great potential to lead to new concepts in thedesign and implementation of engineered artefacts swimmingwithin the oceans (Bandyopadhyay, 2005). Therefore, it is techni-cally relevant to investigate the possible advantages of the sys-tematic design and build of bioinspired vehicles.
The routine activities or missions of both pelagic marine ani-mals and free swimming autonomous underwater vehicles (AUVs)require these systems to transit between multiple locations. Forboth biological and engineered systems there is an evolutionary ordesign driver towards reducing the total energy consumption ofthe system when completing these journeys.
r Ltd. This is an open access article
. Haroutunian).
t al., Understanding the powspeeds and cost of.... Ocean
AUVs are almost invariably deployed with a finite energy store;by reducing the energy cost per unit distance travelled the rangeof the vehicle may be enhanced (e.g. Furlong et al. (2007) andPhillips et al. (2012)). For pelagic species swimming is the onlyalternative for most animals to find food, escape predators andreproduce successfully (Videler, 1993). Averaged over a period, theamount of energy acquired by an individual through feeding mustexceed the amount of energy expended by daily activities, growthand reproduction. Based on optimal foraging theory, naturalselection should operate to maximise the ratio of energy income toenergy expenditure (Townsend and Winfield, 1985). Hence, thesolutions adopted by marine animals to reduce their energeticrequirements may provide inspiration to enhance the design ofthe next generation of free swimming AUVs.
Without detracting from the potential, if bioinspiration is toprove beneficial, it is important to have a consistent set of metricsthat allow fair comparison, without bias, when comparing theperformance of engineered and biological systems. However, suchan unbiased comparator can be elusive given the disparity in theforms of biological and engineered components, even for thosethat essentially perform the same functions.
For example propulsive efficiency is often quoted by bothengineers and biologists as a measure of the ratio of the effective
under the CC BY license (http://creativecommons.org/licenses/by/4.0/).
er requirements of autonomous underwater systems, Part I: AnEng. (2015), http://dx.doi.org/10.1016/j.oceaneng.2015.12.014i

Nomenclature
(1þk) Form factor (–)(1�t) Thrust Deduction (–)a Mass allometric scaling constant for in-water main-
tenance power (variable)A Wetted surface area (m2)As Wetted Surface Area of equivalent ellipsoid (m2)b Mass allometric scaling exponent for in-water main-
tenance power (–)CD Drag coefficient (–)Cf Skin friction coefficient (–)Cv Viscous drag coefficient (–)COT Cost of transport (J/kg/m)COTnet Net cost of transport (J/kg/m)COTopt Optimum Cost of Transport (J/kg/m)D Diameter (m)Ds Equivalent spheroid Diameter (m)E Gravimetric Specific Energy of Power Source (J/kg)L Length (m)L/Ds Slenderness ratio (–)m Mass (kg)
n Number of samples (–)PH In Water Maintenance power requirement (W)PP Propulsion power requirement (W)q Proportion of system mass devoted to energy
storage (–)R Range (m)Re Reynolds number (–)Rmax Maximum range (m)t Thrust deduction (–)U Forward speed (m/s)Uopt Optimum speed (m/s)α Re scaling constant for skin friction coefficient (–)β Re scaling exponent for skin friction coefficient (–)ɛ Spheroid eccentricity (–)ϕ Proportion of the system mass devoted to energy
storage (–)ζ Equivalent spheroid efficiency (–)ν Kinematic viscosity (m2/s)ρ Water density (kg/m3)τ Scale factor (–)ηa Actuator efficiency (–)ηp Propulsive efficiency (–)
A.B. Phillips et al. / Ocean Engineering ∎ (∎∎∎∎) ∎∎∎–∎∎∎2
power to the power delivered to the propulsion system
ηp ¼Ef f ective PowerDelivered Power
: ð1Þ
Numerous authors have quoted high propulsive efficiencies, ηp,for marine animals operating at turbulent Reynolds numbers usingcarangiform and thunniform type propulsion (high speed long-distance swimmers where virtually all movement is in the caudalfin). For example, the propulsive efficiencies of pseudo killerwhales at 0.9 (Fish, 1996), bottlenose dolphins at 0.81 (Fish, 1993)and fin whale at 0.85 (Bose and Lien, 1989) are high comparedwith those of a typical propeller (Wageningen B5-75) open waterefficiency of 0.5 to 0.7 (Carlton, 2007).
However, these results must be treated with caution. The actionof any propulsor, be it an oscillating foil, propeller or water jet, willlocally modify the flow around the individual. In turn modifyingthe resistance of a self-propelled individual compared to a towed(or passive) individual. There is inconsistency between the stan-dard methods for accounting for this change in resistance (typi-cally an increase) between biological and engineered systems.
For ships the increase in self-propelled resistance is included aspart of the propulsive efficiency rather than as an increment onthe drag. Thus the propulsive efficiency of an AUV is:
ηpðengineeringÞ ¼Towed Resitance� VelocityPropulsive Power to Shaft
: ð2Þ
While not universally accepted, in biology the influence of thepropulsor on the ‘drag’ is often considered as an added resistancefactor, λ, which is the ratio of the swimming thrust to passive drag:
λ¼ Swimming ThrustPassive Drag
: ð3Þ
The added resistance factor is highly dependent on propulsivemode and accounts for drag increases due to large-amplitudelateral body movements that modify the water flow in theboundary layer and around the body, resulting in increased fric-tional and form drag (Webb, 1975). Experimental data collected byWebb (1975) shows that the drag coefficient for fish swimming athigh Reynolds numbers can be up to four times that of a rigidlygliding fish. Importantly this added resistance is typically notincluded in the propulsive efficiency. Hence the propulsive
Please cite this article as: Phillips, A.B., et al., Understanding the powanalytical model for optimum swimming speeds and cost of.... Ocean
efficiency of a marine animal is often taken to be:
ηpðbiologyÞ ¼Swimming Thrust� Velocity
Power in wake: ð4Þ
There are sound reasons for the differing approaches due to themeasurement techniques available for engineered and biologicalsystems (Webb, 1975). However, the consequence is that directcomparison of quoted propulsive efficiencies between engineeredand biological systems is biased towards biological systems sincebiological values do not incorporate the added resistance due tothe movement of the body. To enable a fair comparison:
ηpðengineeringÞ ¼ηpðbiologyÞ
λ: ð5Þ
In this work a combination of reduced-complexity analyticalformulations and dimensional analysis is used to generate acomprehensive idealised analytical model of the cost of transportand optimum swimming speed of an individual, be it a biologicalor engineered system based on system metrics including equiva-lent spheroid efficiency. The analytical model provides enhancedunderstanding of the implications of propulsion and non-propulsion power requirements on the energetic performance ofindividuals. In Part II of this paper this understanding is used toexplain trends in collated published swimming performance data,where a number of recent biological studies on individual species(Behrens et al., 2006; Clark and Seymour, 2006; Fitzgibbon et al.,2007; Korsmeyer et al., 2002; Ohlberger et al., 2006; Otani et al.,2001; Palstra et al., 2008; Rosen and Trites, 2002; Steinhausenet al., 2005; Tanaka et al., 2001; Tudorache et al., 2011; Williamsand Noren, 2009) have allowed the creation of a significantly lar-ger data sets than considered by previous comparative studies, e.g.Videler (1993) and Videler and Nolet (1990).
2. Analytical model
Due to the limited availability of energetic data for marineanimals, empirical models have been previously proposed tosupplement and enhance our understanding. Previous studieshave developed equations for the optimum cost of transport and/or optimum swimming speed of marine animals using regression
er requirements of autonomous underwater systems, Part I: AnEng. (2015), http://dx.doi.org/10.1016/j.oceaneng.2015.12.014i

A.B. Phillips et al. / Ocean Engineering ∎ (∎∎∎∎) ∎∎∎–∎∎∎ 3
analysis (Videler, 1993; Videler and Nolet, 1990; Williams, 1999) orelse using combinations of dimensional analysis and other mod-elling techniques (Bejan and Marden, 2006; Hedenstrom, 2003;Watanabe et al., 2010; Weihs, 1973). While Williams (2010)developed a mission-specific model for the energy expenditureand range of AUVs, none of the existing approaches are suitable forcomparing biological and engineered systems. The model pre-sented here is a significant extension and generalisation of themodels of Watanabe et al. (2010) and Weihs (1973) to make itapplicable for laminar and turbulent flow and biological andengineered systems.
The approach is not intended to account for all forms of bio-logical or engineering variation; rather it is intended to provide aframework for understanding general tendencies and relation-ships, and to provide a means to explore potentially interestingareas, the incorporation of an equivalent spheroid efficiency isproposed to allow fair comparison between both engineered andbiological systems. For both biological and engineered systemstypically only limited data is available, consequently this isreflected in the set of key parameters.
2.1. Equivalent spheroid
Reduced complexity models are used in many areas of scienceto gain insight into what is important and what is not, beforemoving to more representative modelling. We reduce complexityin our model by assuming that the form of the biological orengineered system corresponds to that of an equivalent spheroid,defined as a neutrally buoyant prolate spheroid with the samelength and mass as the individual, the equivalent diameter can bedetermined from,
DS ¼ffiffiffiffiffiffiffiffiffi6mρπL
sð6Þ
while the surface area is determined from,
As ¼ 2πDS
2
41þ L
DSεsin �1ε
� �; ð7Þ
where
ε¼ffiffiffiffiffiffiffiffiffiffiffiffiffiffiffi1�DS
2
L2
sð8Þ
Such an assumption allows estimates to be made of key para-meters including diameter or wetted surface area, which, foranimals and engineered systems, are often not reported. Fig. 1illustrates the differences between the actual and the modelledparameters when displacement and length are constrained to beequal.
Delphin2 Length, L=1.96Displacement, mMax Diameter, DWetted Surface Slenderness Rat
Dolphin (Hui, 1Length, L=1.73Displacement, mMax Diameter, DWetted Surface Slenderness Rat
Fig. 1. Equivalent spheroid examples for an underwater vehicle (Delphin2 Phillips etillustrating the differences between the actual and the modelled parameters when disp
Please cite this article as: Phillips, A.B., et al., Understanding the powanalytical model for optimum swimming speeds and cost of.... Ocean
The assumption that the individual may be represented as aprolate spheroid allows predictions to be made regarding theenergetic costs of an individual. To make the analytical modelgeneric each equivalent spheroid will be defined by its mass andits slenderness ratio, L
Ds. Thus the length is given by,
L¼ cm1=3; ð9Þwhere,
c¼6 L
Ds
� �2ρπ
0B@
1CA
1=3
: ð10Þ
Note c is a constant for geometrically similar spheroids oper-ating in the same fluid. The wetted surface area can be approxi-mated by,
As � dm23; ð11Þ
where,
d¼ 1ρ
� �2=3
�0:0122LDS
� �2
þ0:5196LDS
þ4:2732
!: ð12Þ
Again d is a constant for geometrically similar spheroidsoperating in the same fluid. For 1.14L/DSo15 this approximationgives an error of less than 1% of the exact wetted surface areaderived from Eq. (7), this range of L/DS encompasses the majorityof pelagic marine animals and survey style AUVs (Murphy andHaroutunian, 2011).
2.2. In-water maintenance power
The total powering requirements of the idealised system can bederived be modelling the in-water maintenance costs and thepropulsion power requirements. The in water-maintenance costwill be represented by a power function,
PH ¼ amb; ð13Þwhere a is a constant of proportionality, m is the system mass andb is the allometric scaling exponent. Such a relationship is com-monly used to represent the relationship between body mass andenergy metabolism in animals (Heusner, 1985). It will be shown inSection 4.1 that such an assumption is also reasonable for engi-neered systems.
2.3. Propulsion power
Dimensional analysis and common engineering practice statethat the total propulsion power (i.e the power drawn by the entirepropulsion system including actuators) of a deeply submerged
=72=0.254
Area, A=1.42io, L/D=7.7
Equivalent SpheroidLength, L=1.96Displacement, m=72Diameter, Ds=0.262Wetted Surface Area, As=1.3Slenderness Ratio, L/Ds=7.5
987)
=59.2=0.31
Area, A=1.04io, L/D=5.6
Equivalent SpheroidLength, L=1.73Displacement, m=59.2Diameter, Ds=0.25Wetted Surface Area, As=1.06Slenderness Ratio, L/Ds=6.92
al. (2013) and Steenson et al. (2014)) and a marine mammal (picture by NOAA)lacement and length are constrained to be equal (Dolphin, Hui, 1987).
er requirements of autonomous underwater systems, Part I: AnEng. (2015), http://dx.doi.org/10.1016/j.oceaneng.2015.12.014i

A.B. Phillips et al. / Ocean Engineering ∎ (∎∎∎∎) ∎∎∎–∎∎∎4
individual can be determined from:
PP ¼ρ
2ηaηpCDAU
3 ð14Þ
where, ρ is the fluid density, CD is the drag coefficient of a towed(or passive) system, A is the wetted surface area of the system, ηais the actuator efficiency and ηp is the propulsive efficiency. Usinga similar argument the power requirement of a 100% efficientequivalent spheroid, PPS , may be calculated from
PPS ¼ρ2CDsAsU
3; ð15Þ
where CDS is the drag coefficient, and As the wetted surface area ofthe equivalent spheroid.
2.4. Equivalent spheroid efficiency
Defining the equivalent spheroid efficiency, ζ, as the ratio of thepower required to propel a 100% efficient equivalent spheroid tothe power required by a real individual at the same speed,
ζ ¼ PPS
PP¼ ηaηp
CDsAs
CDAð16Þ
ζ includes both hydrodynamic and actuator efficiency, it alsomakes allowance for the difference in drag coefficient and wettedsurface area between the real system and an equivalent spheroid.Thus the propulsion power can be represented by,
PP ¼ρ2ζ
CDsAsU3: ð17Þ
For this study we will assume that the equivalent spheroidefficiency is invariant to forward speed. We will also assume thatneither ρ or As have any dependency on the other variables con-sidered in this study. The use of equivalent spheroid efficiencyallows fair comparison between engineered and biological sys-tems, where only limited data is available. To calculate the onlysystem specific information required are length, mass and pro-pulsion power at a set speed.
2.5. Drag coefficient prediction
Based on the methodologies of Hughes developed for scaling ofdrag components of ships, the drag of a deeply submergedspheroid experiencing only viscous drag, Cv, may be representedby,
CDs ¼ Cv ¼ Cf ð1þkÞ ð18Þ
where Cf is the skin friction coefficient based on flat plate results,while the (1þk) is a form factor dependent on hull form toaccount for the viscous pressure resistance (Molland et al., 2011).The standard skin friction lines for laminar flow (Blasius line) andturbulent flow (von Karman line) past a flat plate are of the form,
Cf ¼ αReβ ; ð19Þ
where the constant, α; and the exponent, β; are flow regimedependent and, Re; is the length based Reynolds number. The formfactor ð1þkÞ of an spheroid can be predicted empirically fromHoerner (1965),
1þkð Þ ¼ 1þ1:5LDS
� ��3=2
þ7LDS
� ��3
: ð20Þ
Substituting Eqs. (19)–(21) into (18) the propulsion powerrequirement is given by
PP ¼eζαm
βþ 23 Uð3þβÞ; ð21Þ
Please cite this article as: Phillips, A.B., et al., Understanding the powanalytical model for optimum swimming speeds and cost of.... Ocean
where
e¼ ρ21þkð Þc
β
νβd: ð22Þ
e is constant for geometrically similar individuals operating inthe same fluid.
2.6. Optimum cost of transport
One widely accepted metric used to compare the energeticperformance of different animals is cost of transport, COT(Schmidt-Nielsen, 1972; Tucker, 1970; Videler, 1993). COT is anormalised measure of the energy required to transport the massm of an individual, over a unit distance at a speed U. The generalformulation of cost of transport for an individual is given by:
COT ¼ PHþPP
mU: ð23Þ
Where PH, is the power expended to operate or sustain theanimal’s non-propulsion systems, and PP is the power associatedwith propulsion. At this level of abstraction there is almost a one-to-one correspondence with engineered systems. For engineeredsystems the power expended on non-propulsion systems is oftenreferred to as the hotel load and is associated with poweringcomputers, hard drives and all the sensors required to providefunctions equivalent to those of an animal, such as knowingorientation and position, and condition monitoring. This isequivalent to the in-water maintenance cost of a marine animalwhile at rest associated with blood flow, respiration etc. However,the hotel load in an underwater vehicle can be defined to includethe power consumed by the instruments carried as payload, suchas those to make measurements of the environment. Payloadpower consumption can be similar to, or can exceed, the powerrequired for maintaining the vehicle’s core systems. Consequently,in this study, because there is no animal equivalent, payload powerconsumption is excluded.
The energetic costs of propulsion, PP, of an individual, animal orunderwater vehicle, is as a direct result of generating thrust toovercome fluid dynamic drag. The energy required is influenced bya variety of environmental factors, such as water temperature andsalinity, propulsion methods and associated efficiency as well asphysiological and morphological characteristics of the system(Allen et al., 2000; Hammer, 1995; Lighthill, 1969).
Substituting Eqs. (13) and (21) into Eq. (23) the cost of trans-port for an equivalent spheroid is:
COT ¼ PHþPP
mU¼ambþ e
ζαmβþ 23 Uð3þβÞ
mUð24Þ
COT versus swimming speed results in a ‘U’ shaped function,see Fig. 2, the optimum swimming speed, Uopt associated with theminimum cost of transport COTopt may be established by differ-entiating Eq. (24) with respect to U, then setting the result equal tozero to find the global minimum and then rearranging for Uopt ,
Uopt ¼aζ
2þβ� �
eα
! 13þ β
m3b� β� 29þ 3β ð25Þ
Multiplying out the brackets and gathering like terms,
Uopt ¼ a1
3þ β|ffl{zffl}I
� ζ1
3þ β|ffl{zffl}II
� e� 13þ β|fflffl{zfflffl}III
� α� 13þ β � ð2þβÞ� 1
3þ β|fflfflfflfflfflfflfflfflfflfflfflfflfflfflfflfflffl{zfflfflfflfflfflfflfflfflfflfflfflfflfflfflfflfflffl}IV
�m3b� β � 29þ 3β|fflfflfflffl{zfflfflfflffl}V
ð26Þ
With the equation in this form it is possible to identify how thekey model parameters influence the optimum swimming speed. Inthe preceding equation, term I shows that Uopt varies with a (themass coefficient used in determining the in-water maintenancecost) raised to the power 1
3þβ. This exponent will thus vary
er requirements of autonomous underwater systems, Part I: AnEng. (2015), http://dx.doi.org/10.1016/j.oceaneng.2015.12.014i
A.B. Phillips et al. / Ocean Engineering ∎ (∎∎∎∎) ∎∎∎–∎∎∎ 5
depending on the flow regime. For laminar flow β¼ �0:5, whilefor turbulent flow β¼ �0:2; thus Uopt will be more slightly moresensitive to variations in a and thus in-water propulsion require-ments when operating in a turbulent flow regime than in alaminar one. Similar arguments can be made for terms II and III.Term IV is only dependent on flow regime. Term V demonstrateshow the scaling exponent on m is dependent on the allometricmass scaling exponent b as well as the flow regime.
Note that by differentiating Eq. (24) with respect to speed it canbe shown that the propulsion power at the optimum swimmingspeed can be related to the non-propulsion power requirement by,
PH ¼ amb ¼ 2þβ� �e
ζαm
β þ 23 Uopt
3þβð Þ ¼ ð2þβÞPPU ¼ Uoptð27Þ
This ratio is independent of all other parameters, thus thepower consumption at the optimum speed is a function of in-water maintenance power requirements, PH , and the exponent onReynolds number for the skin friction calculation, β. For vehiclesoperating in the same flow regime (laminar or turbulent) thepropulsion power, PP ; at Uopt is only a function of the in-water
Fig. 2. Idealised cost of transport curve. The net cost of transport, COTnet, is oftendefined as the component of the cost of transport associated with propulsion.
Table 1Key results from analytical model.
Laminar flowskin friction li
In water maintenance power, PHSkin friction coefficient, Cf 1:327Re�1=2
Propulsion power, PP 1:327eζm1=2U5=
Geometric and fluid constants e¼ ρ
21þkð Þc
�1
ν�1
Cost of transport, COT ambþ1:327eζm
mU
Optimum speed, Uopt aζ1:9905e
� �2=5
m
Optimum cost of transport, COTopt2:195a
35
eζ
� �25
m
Propulsion power at optimum speed, PPu ¼ uoptPH
1:5
Maximum range, Rmax0:455Eϕa� 3
5ζ
e
�
Please cite this article as: Phillips, A.B., et al., Understanding the powanalytical model for optimum swimming speeds and cost of.... Ocean
propulsion power requirement. Thus the optimum cost of trans-port becomes,
COTopt ¼PHþPPU ¼ Uopt
mUopt¼
1þ 12þβ
� �PH
mUopt: ð28Þ
Substituting the result for Uopt Eq. (25) into Eq. (28), the opti-mum cost of transport is given by:
COTopt ¼ a 1þ 12þβ
� �2þβ� �
eαaζ
� � 13þ β
m6bþ 3bβ� 2β� 7
9þ 3β : ð29Þ
2.7. Maximum range
For AUVs with a finite energy store or marine animals whichmigrate without feeding, the maximum range, Rmax, can bedetermined as,
Rmax ¼Eϕm
mCOTopt; ð30Þ
where E is the specific energy of the power source in (J/kg) and ϕis the proportion of the system mass devoted to energy storage(0 corresponds to 0% of the mass while 1 corresponds to 100%).
2.8. Operation at non-optimum speeds
While the optimum swimming speed is energetically optimum,other mission constraints may lead the individual to operate atspeeds above or below the optimum i.e. sprinting to overcomingcurrents or to capture prey, or slowing to a stop to interact withthe environment. The impact of operating at speeds other thanUopt can be derived relative to the optimum values, let τ¼ U=Uopt ,
COT ¼ COTopt2þβþτð3þβÞ
ð3þβÞτ ; ð31Þ
model (Blasiusne)
Turbulent flow model(Prandtl–Von Kármán skin friction line)
amb (13)(34) 0:072Re�1=5 (35)
2 (36) 0:072eζm3=5U2:8 (37)
=2
=2d (38) e¼ ρ
21þkð Þc
�1=5
ν�1=5d (39)
c¼ 6 LD
� �2ρπ
!1=3
(10)
d¼ 1ρ
� �23
�0:0122LDS
� �2
þ0:5196LDS
þ4:2732
!(12)
1þkð Þ ¼ 1þ1:5LDS
� ��3=2
þ7LDS
� ��3
(20)
1=2U5=2
(40)ambþ0:072e
ζm3=5U2:8
mU(41)
2b� 15 (42)
aζ0:1296e
� �1=2:8
mb� 3=52:8 (43)
3b� 45 (44) 0:750a
914
eζ
� � 514
m9b� 11
14 (45)
(46)PH
1:8(47)
�25
m4� 3b
5 (48) 1:334Eϕa� 914
ζ
e
� � 514
m11� 9b
14 (49)
er requirements of autonomous underwater systems, Part I: AnEng. (2015), http://dx.doi.org/10.1016/j.oceaneng.2015.12.014i

Table 2Proportionality relationships between key model parameters and COTopt , Rmax andUopt , values in brackets are for laminar flow.
Parameter In-water main-tenance power,PH
Equivalentspheroid effi-ciency, ζ
Mass and allo-metric scalingexponent, mand b
Totalstoredenergy,Eϕ
Optimum costof transport,COTopt
PH9=14 ζ5=14 m
9b� 1114 �
PH3=5
� �ζ2=5� �
m3b� 4
5
� � �
Maximumrange Rmax
PH�9=14 ζ�5=14 m
11� 9b14 Eϕ
PH�3=5
� �ζ�2=5� �
m4� 3b
5
� � ðEϕÞ
Optimum speedUopt
PH5=14 ζ�5=14 m
b� 0:62:8 �
PH2=5
� �ζ�2=5� �
mb� 0:52:5
� � �
Fig. 3. Impact of variations in in-water maintenance cost or propulsion power requiremescale for the turbulent flow case. (a) Impact of doubling in-water maintenance cost oefficiency (doubling propulsion power) over the speed range on an individual’s power reqof transport, (d) impact of halving equivalent spheroid efficiency (doubling propulsiontenance cost on an individual’s range, (f) impact of halving equivalent spheroid efficien
A.B. Phillips et al. / Ocean Engineering ∎ (∎∎∎∎) ∎∎∎–∎∎∎6
Please cite this article as: Phillips, A.B., et al., Understanding the powanalytical model for optimum swimming speeds and cost of.... Ocean
R¼ Rmaxð3þβÞτ
2þβþτð3þβÞ; ð32Þ
PP ¼PHτð3þβÞ
2þβ: ð33Þ
2.9. Transition from laminar to turbulent flow
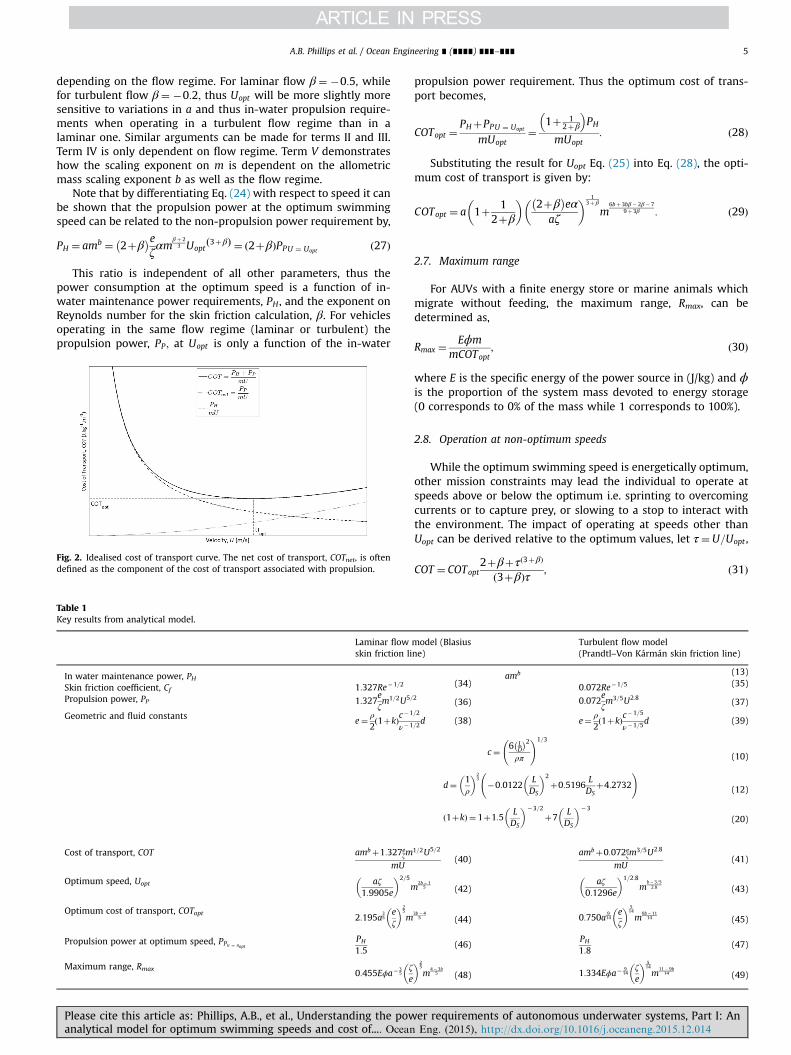
For this study we will consider two skin friction lines: theBlasius skin friction line for laminar flow and the Prandtl–VonKármán skin friction line for turbulent flows (Comstock, 1977), thekey results using these relationships are tabulated in Table 1.
The transition from laminar flow to turbulent flow is a complexphenomenon which will not be discussed in detail here. For thepurposes of this study we have assumed that laminar flow isprevalent up to Reynolds numbers of 500,000 and that fully tur-bulent flow is developed after Reynolds numbers of 1,000,000. For
nt on optimum cost of transport optimum speed and maximum range. Figures are ton an individual’s power requirements, (b) impact of halving equivalent spheroiduirements, (c) impact of doubling in-water maintenance cost on an individual’s costpower) on an individual’s cost of transport, (e) impact of doubling in-water main-cy (doubling propulsion power) on an individual’s range.
er requirements of autonomous underwater systems, Part I: AnEng. (2015), http://dx.doi.org/10.1016/j.oceaneng.2015.12.014i

A.B. Phillips et al. / Ocean Engineering ∎ (∎∎∎∎) ∎∎∎–∎∎∎ 7
500,000oReo1,000,000 we have used a linear function tosmooth between the results for the laminar and turbulent models.
Fig. 4. Impact of mass scaling exponent for the in water maintenance powerrequirements (for turbulent flow).
3. Analytical model findings
The analytical model allows the relative importance of eachparameter on the energy expenditure of an autonomous underwatersystem. By definition a is proportional to in-water maintenance costand ζ is a measure of the hydrodynamic and propulsion efficiency ofthe individual, the impact of changes in these variables on COTopt , Rmax
and Uopt may be explored. Table 2 highlights the key results of thisanalysis for laminar and turbulent flow, showing the relative impor-tance of the key parameters and their influence on the measures ofCOTopt , Rmax and Uopt .
The impact of doubling the systems in-water maintenance costor the equivalent spheroid efficiency over the speed range areconsidered in Fig. 3.
For turbulent flow, doubling the in-water maintenance costsresults in the cost of transport rising by a factor of 29=14 (56%),while the maximum range is reduced by 2�9=14 (36%). The opti-mum swimming speed rises by a factor of 25=14 (28%). At theoptimum swimming speed the ratio of the in water maintenanceload and propulsion load is constant (Eq. (27)), therefore as the inwater maintenance load doubles so does the propulsion power atthe optimum swimming speed.
Doubling the propulsion power requirements over the speedrange results in the optimum swimming speed reducing by afactor of 2�5=14 (22%), the reduction in optimum speed is such thatthe propulsion power at the optimum speed is constant for bothcases. While the power consumption is constant, the reduction inthe optimum swimming speed increases the optimum cost oftransport, rising by a factor of 25=14 (28%), while the maximumrange is reduced by 2�5=14 (22%).
3.1. Influence of system mass on optimum cost of transport
It is convention to present optimum cost of transport andoptimum swimming speed versus mass when comparing differentindividuals. To examine how optimum swimming speed varieswith respect to mass, partially differentiate Eq. (25) with respect tomass,
∂Uopt
∂m¼ 3b−β−2
9þ3β
� �aζ
2þβð Þeα
� �1
3þ β � m3b−β−39þ 3β : ð50Þ
For geometrically similar systems with the same equivalentspheroid efficiency this may be approximated by an equation ofthe form ∂Uopt
∂m ¼ fmg where f is a positive constant. Consequently,the sign of the gradient of the Uopt versus mass line is governed bythe value of scaling exponent in Eq. (50) which is dependent onthe maintenance power allometric scaling exponent, b and scalingexponent on Reynolds number to determine the skin frictioncoefficient β. For laminar flow β¼ �0:5:
∂Uopt
∂m¼
40 f or b41=20 f or b¼ 1=2o0 f or bo1=2
:
8><>: ð51Þ
While for turbulent flow β¼ �0:2 giving the result is
∂Uopt
∂m¼
40 f or b43=50 f or b¼ 3=5o0 f or bo3=5
:
8><>: ð52Þ
Similarly the impact of b on the gradient of the optimum cost oftransport versus mass curve is also highly informative, by
Please cite this article as: Phillips, A.B., et al., Understanding the powanalytical model for optimum swimming speeds and cost of.... Ocean
differentiating Eq. (29) with respect to mass for laminar flow
∂COTopt
∂m¼
40 f or b412=90 f or b¼ 12=9o0 f or bo12=9
:
8><>: ð53Þ
While for turbulent flow the result is
∂COTopt
∂m¼
40 f or b411=90 f or b¼ 11=9o0 f or bo11=9
:
8><>: ð54Þ
The above results are illustrated in Fig. 4, for turbulent flow.Dependent on the value of b, three cases can be identifiedassuming that the system transits at its optimum speed:
� Case 1: bo3/5 for turbulent flow and bo1/2 for laminar flow –
Optimum swimming speed reduces with increasing mass whileoptimum cost of transport reduces with increasing mass. Moremassive systems will swim slower but have lower energeticcosts per unit mass.
� Case 2: 3=5obo119 for turbulent flow and 0:5obo12=9 for
laminar flow – Optimum swimming speed increases withincreasing mass while optimum cost of transport reduces withincreasing mass. More massive individuals will swim faster buthave lower energetic costs per unit mass.
� Case 3: b411=9 for turbulent flow and b412=9 for laminarflow – Optimum swimming speed reduces with increasing masswhile optimum cost of transport reduces with increasing mass.More massive systems will swim faster and have higher ener-getic costs per unit mass.
While it has been argued that an allometric scaling exponent b,of 3/4 is valid for all animals (Smil, 2000), other authors argue for avalue of 2/3 (White and Seymore, 2003). Agutter and Wheatley(2004) review the proposed justifications for the different values.The limitations of the universal scaling law are discussed in detailin Glazier (2005). For pelagic marine species Glazier (2006) arguesthat the interspecific and intraspecific scaling exponent is variablelying in the range (1/2obo11/10).
For marine animals one might hypothesis that Case 2 providesan evolutionary driver for marine animals to grow more massive,
er requirements of autonomous underwater systems, Part I: AnEng. (2015), http://dx.doi.org/10.1016/j.oceaneng.2015.12.014i

A.B. Phillips et al. / Ocean Engineering ∎ (∎∎∎∎) ∎∎∎–∎∎∎8
since they may achieve higher optimum swimming velocities for alower energetic cost per unit mass. Most of the values for b pro-posed in the studies and reviews fall into this case.
Case 3 would restrict the evolutionary advantage of increasingmass, since the energetic cost per unit mass would increase for ananimal swimming at its optimum speed. None of the animal stu-dies suggest b values sufficiently high to fall into this case. Case1 provides an energetic advantage, yet assuming pelagic animalschoose to swim at their optimum speed, more massive animalswould swim more slowly eventually reaching planktonic speeds(unable to overcome natural currents). The range of b valuesproposed by Glazier (2006) suggest that b can be low enough tofall into this case.
4. Conclusion
For pelagic marine animals and underwater vehicles, mini-mising their cost of transport by swimming at their optimumspeed allows them to maximise their range given a finite store ofenergy. Marine animals with low cost of transport have developeda combined morphology and kinematics of swimming that maylead to the design of bioinspired long range underwater vehicleswith enhanced performance. However, given that there areinherent difficulties when seeking to compare engineered andbiological systems, there must be a rational basis for selectingwhich characteristics and which animals to use as the basis forinspiration. In this paper we present a well rationalised analyticalmodel of the physics behind the total energetic cost of locomotionapplicable to both biological and engineered autonomous under-water marine systems. The model incorporates the use of anequivalent spheroid efficiency as a fair metric to compare engi-neered and biological systems. This can be readily calculated fromtypically available data. To calculate equivalent spheroid efficiencythe only system specific information required are length, mass andpropulsion power at a set speed. Results from the model are usedto provide useful insights into the scaling of common performancemetrics with respect to system mass, such as cost of transport andmaximum range. The analysis in this work are based uponswimming speeds and energy consumption. Therefore, the scalingconsiders a combination of drag, thrust and “hull” efficiency as acomplete system. As a result it would be possible to make a jud-gement on the performance of a swimming system. In addition,the analytical model provides a physics-based selection tool tohelp with selecting candidate marine animal species for bioin-spiration, and biologists can use this approach to help understandthe observed performance of marine animals.
In Part II we demonstrate how engineers can use the model tofacilitate an understanding of biological systems to improveengineered vehicles by comparing the in-service implications ofdesign choices for vehicles.
Acknowledgements
This research was supported by the EPSRC through Grantnumber EP/F066767/1 entitled “Nature in Engineering for Mon-itoring the Oceans (NEMO)” a joint project between the Universityof Southampton, Newcastle University and the National Oceano-graphy Centre. The overall aim of this project was to find andsynthesise novel design and implementation concepts for deep-diving and agile unmanned underwater vehicles (UUV) to meetoffshore industry, environmental monitoring and scientific researchneeds based on inspiration from marine organisms to achieve
Please cite this article as: Phillips, A.B., et al., Understanding the powanalytical model for optimum swimming speeds and cost of.... Ocean
increased functionality, lower weight and energy requirements andlower capital and operational costs.
References
Agutter, P.S., Wheatley, D.N., 2004. Metabolic scaling: consensus or controversy?Theor. Biol. Med. Model. 1, 1–13.
Allen, B., Vorus, W.S., Prestero, T., 2000. Propulsion system performance enhance-ments on REMUS AUVs, OCEANS 2000 MTS/IEEE Conference and ExhibitionProvidence. RI, USA.
Bandyopadhyay, P.R., 2005. Trends in biorobotic autonomous undersea vehicles.Ocean. Eng. 30 (1), 109–139.
Behrens, J.W., Præbel, K., Steffensen, J.F., 2006. Swimming energetics of the BarentsSea capelin (Mallotus villosus) during the spawning migration period. J. Exp.Mar. Biol. Ecol. 331, 208–216.
Bejan, A., Marden, J.H., 2006. Unifying constructal theory for scale effects in run-ning, swimming and flying. J. Exp. Biol. 209, 238–248.
Bose, N., Lien, J., 1989. Propulsion of a fin whale (Balaenoptera physalus): why thefin whale is a fast swimmer. Proc. R. Soc. Lond. Ser. B, Biol. Sci. 237 (1287),175–200.
Carlton, J., 2007. Marine Propellers and Propulsion. Butterworth-Heinemann,Oxford.
Clark, T.D., Seymour, R.S., 2006. Cardiorespiratory physiology and swimmingenergetics of a high-energy-demand teleost, the yellowtail kingfish (Seriolalalandi). J. Exp. Biol. 209, 3940–3951.
Comstock, J.P., 1977. Principles of Naval Architecture, 4th Edition ed. SNAME, NewYork.
Festo, 2013. AquaJellies 2.0 – Autonomous behaviour in a collective.Fish, F.E., 1993. Power output and propulsive efficiency of swimming bottlenose
dolphins (Tursiops truncatus). J. Exp. Biol. 185, 179–193.Fish, F.E., 1996. Transitions from drag-based to lift-based propulsion in mammalian
swimming. Am. Zool. 36, 628–641.Fitzgibbon, Q.P., Strawbridge, A., Seymour, R.S., 2007. Metabolic scope, swimming
performance and the effects of hypoxia in the mulloway, Argyrosomus japo-nicus (Pisces: Sciaenidae). Aquaculture 270, 358–368.
Furlong, M.E., McPhail, S.D., Stevenson, P., 2007. A concept sesign for an ultra-long-range survey class AUV, Oceans 07, Aberdeen.
Glazier, D.S., 2005. Beyond the ‘3/4-power law’: variation in the intra- and inter-specific scaling of metabolic rate in animals. Biol. Rev. 80 (4), 611–662.
Glazier, D.S., 2006. The 3/4-power law is not universal: evolution of isometric,ontogenetic metabolic scaling in pelagic animals. BioScience 56 (4), 325–332.
Hammer, C., 1995. Fatigue and exercise tests with fish. Comp. Biochem. Physiol. PartA: Physiol. 112 (1), 1–20.
Hedenstrom, A., 2003. Scaling migration speed in animals that run, swim and fly.J. Zool., Lond. 259, 155–160.
Heusner, A.A., 1985. Body size and energy metabolism. Annu. Rev. Nutr. 5, 267–293.Hoerner, S.F., 1965. Fluid-Dynamic Drag, 2nd Edition ed Published by the Author.Hui, C.A., 1987. Power and Speed of swimming dolphins. J. Mammal. 68 (1),
126–132.Korsmeyer, K.E., Steffensen, J.F., Herskin, J., 2002. Energetics of median and paired
fin swimming, body and caudal fin swimming, and gait transition in parrotfish(Scarus schlegeli) and triggerfish (Rhinecanthus aculeatus). J. Exp. Biol. 205,1253–1263.
Lighthill, M.J., 1969. Hydromechanics of aquatic animal propulsion. Annu. Rev. FluidMech. 1, 413–446.
Molland, A.F., Turnock, S.R., Hudson, D.H., 2011. Ship Resistance and Propulsion.Cambridge University Press, Cambridge.
Murphy, A.J., Haroutunian, M., 2011. Using bio-inspiration to improve the cap-abilities of underwater vehicles. In: Proceeding of the 17th InternationalSymposium on Unmanned Untethered Submersible Technology (UUST).Portsmouth, Massachusetts, USA.
Ohlberger, J., Staaks, G., Hölker, F., 2006. Swimming efficiency and the influence ofmorphology on swimming costs in fishes. J. Comp. Physiol. B: Biochem. Syst.,Environ. Physiol. 176 (1), 17–25.
Otani, S., Naito, Y., Kato, A., Kawamura, A., 2001. Oxygen consumption and swimspeed of the harbor porpoise Phocoena phocoena. Fish. Sci. 67, 894–898.
Palstra, A., van Ginneken, V., van den Thillart, G., 2008. Cost of transport andoptimal swimming speed in farmed and wild European silver eels (Anguillaanguilla). Comp. Biochem. Physiol. Part A: Mol. Integr. Physiol. 151 (1), 37–44.
Phillips, A.B., Haroutunian, M., Man, S.K., Murphy, A.J., Boyd, S.W., Blake, J.I.R.,Griffiths, G., 2012. Nature in engineering for monitoring the oceans: compar-ison of the energetic costs of marine animals and AUVs. In: Roberts, G.N.,Sutton, R. (Eds.), Further Advances in Unmanned Marine Vehicles. IET,pp. 373–405.
Phillips, AB., Steenson, LV., Rogers, E., Turnock, SR., Harris, CA., Furlong, M.E., 2013.Delphin2: an over actuated autonomous underwater vehicle for manoeuvringresearch. Int. J. Marit. Eng. 155, 171–180.
Rosen, D.S., Trites, A., 2002. Cost of transport in steller sea lions, Eumetopiasjubatus. Mar. Mammal. Sci. 18 (2), 513–524.
Schmidt-Nielsen, K., 1972. Locomotion: energy cost of swimming, flying, and run-ning. Science 177 (4045), 222–228.
Smil, V., 2000. Laying down the law Every living thing obeys the rules of scalingdiscovered by Max Kleiber. Nature 403, 597.
er requirements of autonomous underwater systems, Part I: AnEng. (2015), http://dx.doi.org/10.1016/j.oceaneng.2015.12.014i

A.B. Phillips et al. / Ocean Engineering ∎ (∎∎∎∎) ∎∎∎–∎∎∎ 9
Steenson, LV., Turnock, SR., Phillips, AB., Harris, C., Furlong, ME., Rogers, E., Wang, L.,Bodles, K., Evans, D.W., 2014. Model predictive control of a hybrid autonomousunderwater vehicle with experimental verification. In: Proceedings of theInstitution of Mechanical Engineers. Part M: Journal of Engineeringfor the Maritime Environment 228 (2), 166–179, http://dx.doi.org/10.1177/1475090213506185.
Steinhausen, M.F., Steffensen, J.F., Andersen, N.G., 2005. Tail beat frequency as apredictor of swimming speed and oxygen consumption of saithe (Pollachiusvirens) and whiting (Merlangius merlangus) during forced swimming. Mar.Biol. 148, 197–204.
Tanaka, H., Takagi, Y., Naito, Y., 2001. Swimming speeds and buoyancy compensa-tion of migrating adult chum salmon Oncorhynchus keta revealed by speed/depth/acceleration data logger. J. Exp. Biol. 204, 3895–3904.
Telepraph, 2014. GhostSwimmer: US Navy trials underwater shark robot.Townsend, C.R., Winfield, I.J., 1985. The application of optimal foraging theory to
feeding behaviour in fish. In: Tyler, P., Calow, P. (Eds.), Fish Energetics: NewPerspectives. Johns Hopkins University Press, Baltimore, Maryland, pp. 67–98.
Tucker, V.A., 1970. Energetic cost of locomotion in animals. Comp. Biochem. Physiol.34 (4), 841–846.
Tudorache, C., O’Keefe, R.A., Benfey, T.J., 2011. Optimal swimming speeds reflectpreferred swimming speeds of brook charr (Salvelinus fontinalis Mitchill, 1874).Fish. Physiol. Biochem. 37, 307–315.
Unmanned, 2012. University Engineers Developing Mantabot Ray AUV.
Please cite this article as: Phillips, A.B., et al., Understanding the powanalytical model for optimum swimming speeds and cost of.... Ocean
Videler, J.J., 1993. Fish Swimming. Springer, New York.Videler, J.J., Nolet, B.A., 1990. Costs of swimming measured at optimum speed: Scale
effects, differences between swimming styles, taxonomic groups and sub-merged and surface swimming. Comp. Biochem. Physiol. Part A: Physiol. 97 (2),91–99.
Watanabe, Y.Y., Sato, K., Watanuki, Y., Takahashi, A., Mitani, Y., Amano, M., Aoki, K.,Narazaki, T., Iwata, T., Minamikawa, S., Miyazaki, N., 2010. Scaling of swimspeed in breath-hold divers. J. Anim. Ecol. 80 (1), 57–68.
Webb, P.W., 1975. Hydrodynamics and energetics of fish propulsion. Bull. Fish. Res.Board Can. 190, 1–158.
Weihs, D., 1973. Optimal fish cruising speed. Nature 245, 48–50.White, C.R., Seymore, R.S., 2003. Mammalian basal metabolic rate is proportional to
body mass2/3. Proc. Natl. Acad. Sci. USA 100 (7), 4046–4049.Williams, C.D., 2010. A hydrodynamic basis for estimating the endurance of
autonomous vehicles for mission planning. J. Ocean. Technol. 5 (3), 70–94.Williams, R., Noren, D.P., 2009. Swimming speed, respiration rate, and estimated
cost of transport in adult killer whales. Mar. Mammal. Sci. 25 (2), 327–350.Williams, T.M., 1999. The evolution of cost efficient swimming in marine mammals:
limits to energetic optimization. Philos. Trans. R. Soc. B: Biol. Sci. 354 (1380),193–201.
er requirements of autonomous underwater systems, Part I: AnEng. (2015), http://dx.doi.org/10.1016/j.oceaneng.2015.12.014i


![Policy B5: Medical - Queen Margaretsqueenmargarets.com/wp-content/uploads/2015/04/Policy-B5-Medical... · [QUEEN MARGARETS, YORK] Policy B5 Policy B5: Medical 1 Policy B5: Medical](https://img.pdfslide.us/doc/110x75/5b8a500b7f8b9a655f8e0e3f/policy-b5-medical-queen-mar-queen-margarets-york-policy-b5-policy-b5.jpg)