Embed Size (px)
Citation preview
1
5
10
15
20
25
30
35
40
45
50
Soft Matter c1sm05554b
PAPER
Molecular and surface interactions between two model
1
5
10
15
20
25
30
35
40
45
1
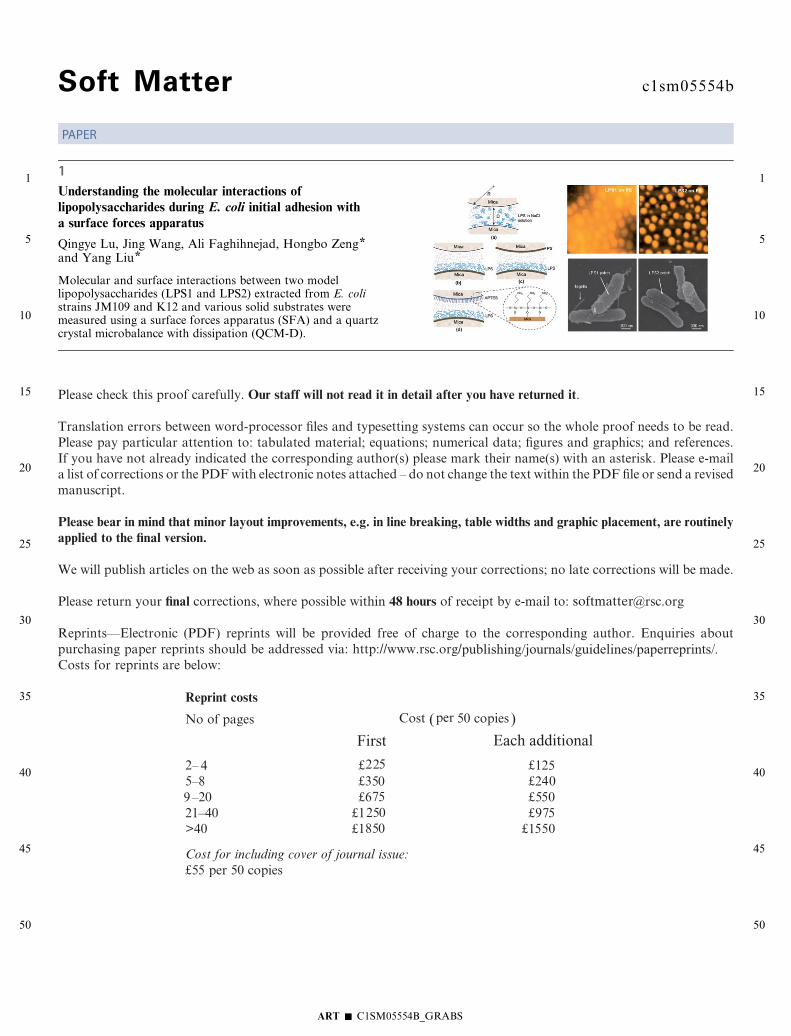
Understanding the molecular interactions of
lipopolysaccharides during E. coli initial adhesion with
a surface forces apparatus
Qingye Lu, Jing Wang, Ali Faghihnejad, Hongbo Zeng*
and Yang Liu*
lipopolysaccharides (LPS1 and LPS2) extracted from E. colistrains JM109 and K12 and various solid substrates weremeasured using a surface forces apparatus (SFA) and a quartzcrystal microbalance with dissipation (QCM-D).
ART � C1SM0555
4B_GRABS50
1 ons of lipopolysaccharides during E.ce
e
ega
bstr
E.
fro
pr
pyl
ce f
to
nifi
ch
get
nti
1
5
10
15
20
25
30
35
40
45
50
1
5
10
15
20
25
30
35
40
45
50
Dynamic Article LinksC<Soft Matter
Understanding the molecular interacticoli initial adhesion with a surface for
Qingye Lu,ab Jing Wang,a Ali Faghihnejad,a Hongbo Z
Received 30th March 2011, Accepted 28th July 2011
DOI: 10.1039/c1sm05554b
Lipopolysaccharides (LPS) occupy 75% of the surface of Gram-n
investigates the role of LPS during bacterial adhesion to solid su
lipopolysaccharides, LPS1 and LPS2, were examined. LPS1 from
consisting of lipid A, core polysaccharides, and O-antigen; LPS2
without the O-antigen portion. Interactions between an LPS layer
three different substrates (mica, PS-coated mica, and 3-aminopro
functionalized mica) in 0.1 M NaCl were measured using a surfa
supported LPS showed strong adhesion to APTES, weak adhesion
substrate. Electrostatic interaction and steric effects contribute sig
the LPS and different substrates. The presence of long O-antigen
adhesion to various substrates because of the presence of an ener
process, which is caused by the affinity of hydrophilic neutral O-a
entropic barrier of LPS chains on the cell membrane surface.
1. Introduction
Bacterial adhesion to solid surfaces is the first and essential step
for bacterial colonization and formation of a biofilm. Under-
standing bacterial initial adhesion is very important for the
control and application of bacterial adhesion and biofilms in the
engineering, environmental, and biomedical industries.1–3 It is
believed that bacterial adhesion is dependent on various inter-
molecular and surface interactions such as electrostatic, van der
Waals, hydrophobic forces, hydrogen bonding and covalent
bonding.4 These forces are influenced by the physicochemical
properties of the substratum and the bacterial surface. The
molecular mechanism of bacterial adhesion is complicated and
remains unclear.
Cell surface structures such as lipopolysaccharides (LPS),
extracellular polymeric substances (EPS), and bacterial nano-
fibers contribute to bacterial adhesion.2,5 LPS occupy 75% of the
surface of Gram-negative bacteria and may play a large role in
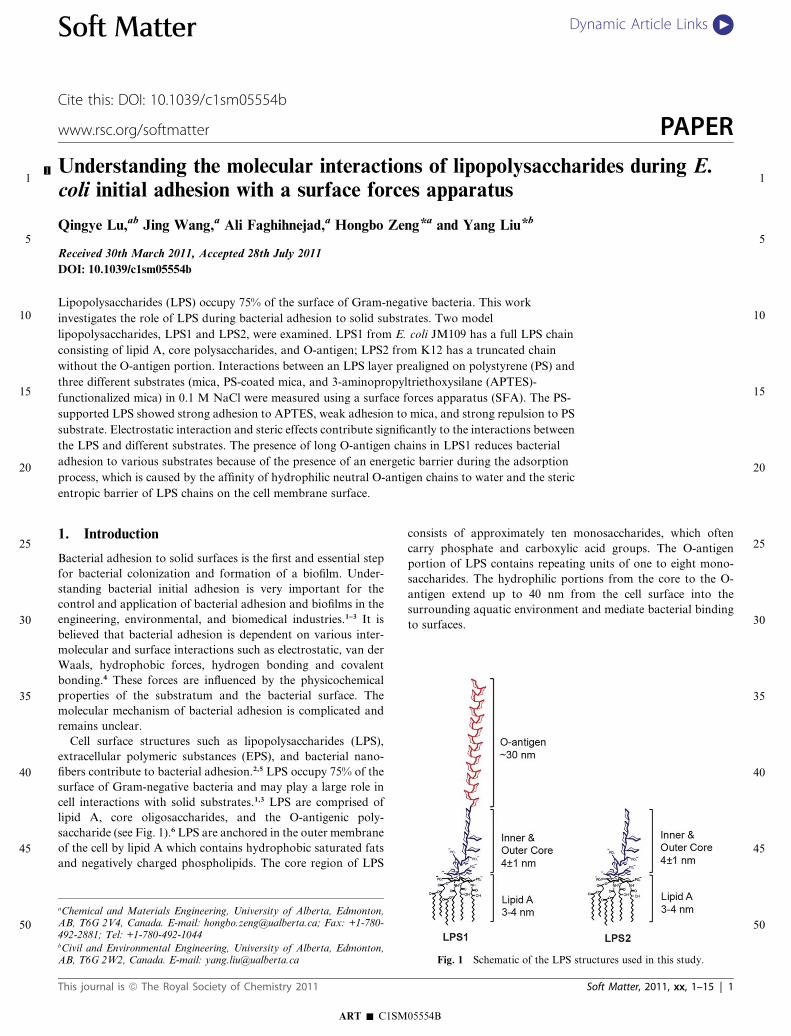
cell interactions with solid substrates.1,3 LPS are comprised of
lipid A, core oligosaccharides, and the O-antigenic poly-
saccharide (see Fig. 1).6 LPS are anchored in the outer membrane
of the cell by lipid A which contains hydrophobic saturated fats
and negatively charged phospholipids. The core region of LPS
aChemical and Materials Engineering, University of Alberta, Edmonton,AB, T6G 2V4, Canada. E-mail: [email protected]; Fax: +1-780-492-2881; Tel: +1-780-492-1044bCivil and Environmental Engineering, University of Alberta, Edmonton,AB, T6G 2W2, Canada. E-mail: [email protected]
Cite this: DOI: 10.1039/c1sm05554b
www.rsc.org/softmatter
ART � C1SM
This journal is ª The Royal Society of Chemistry 2011
PAPER
s apparatus
ng*a and Yang Liu*b
tive bacteria. This work
ates. Two model
coli JM109 has a full LPS chain
m K12 has a truncated chain
ealigned on polystyrene (PS) and
triethoxysilane (APTES)-
orces apparatus (SFA). The PS-
mica, and strong repulsion to PS
cantly to the interactions between
ains in LPS1 reduces bacterial
ic barrier during the adsorption
gen chains to water and the steric
consists of approximately ten monosaccharides, which often
carry phosphate and carboxylic acid groups. The O-antigen
portion of LPS contains repeating units of one to eight mono-
saccharides. The hydrophilic portions from the core to the O-
antigen extend up to 40 nm from the cell surface into the
surrounding aquatic environment and mediate bacterial binding
to surfaces.
Fig. 1 Schematic of the LPS structures used in this study.
05554B
Soft Matter, 2011, xx, 1–15 | 1
1
5
10
15
20
25
30
35
40
45
50
55
1
5
10
15
20
25
30
Studies of the impact of LPS on cell adhesion and transport,
especially for E. coli, have led to controversial results3,7 based on
the approach used. Macroscopic adhesion experiments estimate
the number of attached cells and provide qualitative evaluations
of bacterial adhesion efficiency. Atomic force microscopy (AFM)
measures intermolecular interaction forces between bacteria and
substrates to determine interaction mechanisms. Three E. coli
bacteria with various LPS chain lengths (JM109: full LPS chain;
D21: LPS without O-antigen; D21f2: truncated LPS chain con-
taining only lipid A and KDO (3-Deoxy-D-manno-oct-2-ulo-
sonic acid) groups) have been studied. Some studies showed that
bacterial adhesion capacity increased with LPS chain length (i.e.,
JM109 > D21 > D21f2) on negatively charged hydrophilic
surfaces,8 while others presented a different relationship as
(JM109 > D21f2$D21).9,10 It has also been reported that a long
O-antigen layer decreases bacterial adhesion to hydrophobic
surfaces.11 In another study, adhesion of JM109 to hydrophilic
negatively charged surfaces decreased after LPS was removed
with EDTA.12 To elucidate the molecular interaction mechanism
and predict bacterial adhesion, several groups performed AFM
measurements on intermolecular interaction forces between the
AFM tip (a probe used to scan specimen surfaces) and isolated
bacteria,9,12–15 between a bacteria-coated AFM tip and different
substrate surfaces,16 or between an AFM tip and a bacterial
lawn.17 Adhesion forces were observed to be positively correlated
with LPS chain length.12,14,16,17 It was reported that hydrogen
bonding dominates adhesion of bacteria expressing O-antigen,
and electrostatic and hydrophobic forces dominate adhesion of
bacteria without O-antigen expression.14,15However, AFM failed
to distinguish LPS length effects in some studies. Identical
repulsion forces between bacteria and the AFM Si3N4 tip were
obtained for three strains of E. coli bacteria (JM109, D21,
D21f2).9,13 Therefore, the impact of LPS chains during bacterial
adhesion is unclear.
The surface forces apparatus (SFA)18–20 measures a force (F) 35
40
45
as a function of absolute surface separation (D) between two
interacting surfaces. The force sensitivity is �1 nN with an
absolute distance resolution of 0.1 nm. Both attractive and
repulsive forces can be measured at short- or long-range
distances. The SFA technique is similar to using an atomic force
microscope (AFM) to measure interactions between an AFM tip
and a surface, but the SFA is more suited for measuring surface-
surface interactions because the SFA collects information from
tens to thousands of molecules that typically determine cell-
substrate interactions. In addition, the SFA has been applied to
measure lubrication and friction forces, interactions between
lipid bilayer membranes, receptor-ligand interactions, and other
dynamic interactions and time-dependent interfacial effects.
In this study, surface force measurements were compared with
50
55
macroscopic bacterial adhesion experiments to investigate the
impact of LPS chains during E. coli initial adhesion. To facilitate
SFA measurements, LPS samples extracted from E. coli strains
JM109 and K12 were adsorbed to polystyrene (PS) surfaces by
hydrophobic interactions through lipid A to mimic molecules in
the bacterial outer membrane. The adsorption of LPS on PS
surfaces was characterized and confirmed by a quartz crystal
microbalance with dissipation (QCM-D), contact angle
measurements, AFM, and SFA measurements. The interactions
between LPS and three different substrates with typical surface
ART � C1SM
2 | Soft Matter, 2011, xx, 1–15
properties (i.e., hydrophilic and negatively-charged mica,
hydrophobic PS-coated mica, and positively-charged 3-amino-
propyltriethoxysilane (APTES)-functionalized mica), were
studied by SFA exclusively. The interaction force measurements
and macroscopic bacterial adhesion results provided direct
evaluation of the LPS contribution to bacterial initial adhesion.
2. Materials and methodology
2.1 Chemicals
Two LPS samples were obtained from Invivogen (Montr�eal,
Qu�ebec, Canada): ultrapure LPS from E. coli JM109 (LPS1) and
ultrapure LPS from E. coli K12 (LPS2). Structures of LPS1 and
LPS2 are shown in Fig. 1. PS (MW � 106, Mw/Mn � 1.10) was
purchased from Polysciences (Warrington, PA, USA). 3-Ami-
nopropyltriethoxysilane (APTES) (98%) was purchased from
Alfa Aesar (a Johnson Matthey Company, MA, USA). Sodium
chloride (NaCl,$99.5%) was purchased from Sigma-Aldrich (St.
Louis, MO, Canada). Mica sheets (ruby mica blocks, grade 1)
were obtained from S&J Trading Inc. (Floral park, NY, USA).
Aqueous solutions were prepared in 18.2 MU deionized water
(Millipore, Mississauga, ON, Canada) and filtered through 0.2
mm filters (Nalgene, Rochester, NY, USA) prior to use. PS was
dissolved in toluene (Fisher Scientific, Ottawa, Ontario, Canada)
and filtered through 0.2 mm PTFE filters (Fisher Scientific,
Ottawa, Ontario, Canada).
2.2 Substrate preparation
Three different substrates: mica, PS-coated mica, and APTES-
coated mica were prepared for bacterial adhesion experiments
and characterized through contact angle measurements and
AFM imaging. Mica substrates (2 cm � 2 cm and �200 mm
thick) were freshly cleaved in the laminar hood (Forma Laminar
Airflow Workstation, Thermo Electron Corporation, Waltham,
Massachusetts, USA). PS-coated mica was prepared by spin-
coating and vacuum dried at 23 �C overnight. APTES-coated
substrates were prepared by exposing freshly-cleaved mica to
APTES vapor in an evaporation chamber.21 Briefly, APTES
droplets were put in a small glass vial which was placed near
a mica substrate in an evaporation chamber. The chamber was
first evacuated for a few minutes and then closed for more than
three hours to allow surface deposition and reaction of APTES
with the mica.
Four different surfaces: mica, PS-coated mica, APTES-coated
mica, and LPS-coated PS were prepared for SFA experiments. A
detailed procedure for preparing substrates for SFA experiments
has been reported elsewhere.19,22 Briefly, a thin and back-silvered
mica sheet of 1–5 mm was glued onto a cylindrical silica disk (of
radius R ¼ 2 cm) and the exposed mica surface was treated with
different chemicals. The LPS layer was coated as follows: firstly,
one mica surface was spin-coated with PS and vacuum dried;
secondly, 40 mg mL�1 LPS in 0.1 M NaCl solution were dropped
on the PS-coated mica for more than one hour for deposition in
a water vapor saturated chamber; and lastly, the surface was
rinsed with 0.1 M NaCl. PS-coated and APTES-coated mica
surfaces were prepared using the procedures described above.
05554B
This journal is ª The Royal Society of Chemistry 2011
2.3 Surface characterization
Contact angle measurement. The water contact angles of LPS-
coated PS, freshly cleaved mica, spin-coated PS on mica, and
APTES-coated mica were characterized by a contact angle
goniometer (KRUSS DSA 10, Germany) using the sessile drop
method. Water droplets of 2 mL were placed on the sample
surfaces. Images were captured and analyzed with the goniom-
eter at room temperature (23 �C). The contact angle was
measured and given by the goniometer based on the shape of the
sessile drop, and the measurement was repeated for at least three
samples of the same material with three tests for each sample.
Streaming potential measurement. The surface potentials of
mica, APTES-coated mica, and PS-coated mica were determined
using a streaming potential measurement apparatus with the
scheme reported previously.23,24 Two sample sheets placed on
Teflon blocks separated by a Teflon gasket were subjected to
a flow of 0.1 M NaCl. The streaming potential (DE) was
measured under regulated and constant hydrostatic pressure
(DP) of the electrolyte. Zeta potentials were calculated based on
the Helmholtz-Smoluchowski equation.25
Atomic force microscopy (AFM) imaging. AFM (Agilent
Technologies 5500, Agilent, Santa Barbara, CA, USA) imaging
was carried out to characterize the surface structures and
roughness of three substrates (mica, PS-coated mica, and
APTES-coated mica), and LPS-coated PS surfaces. LPS-depos-
ited surfaces were rinsed with water and dried in air prior to
Bacteria were grown in Luria-Bertani (LB) broth (Miller) at 37�C on a rocking incubator (Excella E24 incubator shaker series,
New Brunswick Scientific, Edison, New Jersey, USA) for 20 h.
Cells were harvested by centrifugation (Avanti J-20I, Beckman
Coulter, CA, USA) at 3000 g at 4 �C for 10 min. The growth
medium was decanted and pellets were vortexed (Genie 2, Fisher
Scientific Inc., IL, USA) and resuspended in 0.l M NaCl. The
centrifugation-resuspension process was repeated three times to
remove traces of growth media. Prior to bacterial adhesion tests,
cell suspensions in 0.1 MNaCl were diluted to approximately 108
CFU/mL as determined by an optical density (OD) of 0.1 using
a UV/visible spectrophotometer (Varian, Inc., CA, USA) at
a wavelength of 600 nm.
2.6 Scanning electron microscope (SEM) imaging
An SEM (Hitachi S2500, Japan) was used to examine bacterial
surface structure. Harvested bacteria suspended in 0.1 M NaCl
were fixed with 2.5% glutaraldehyde for 30 min and further fixed
with 1% OsO4 for 30 min. After fixation, bacteria were dehy-
drated in 50%, 70%, 90%, and 100% ethanol, followed by critical
point drying at 31 �C for 5 min. The samples were sputter-coated
with gold (Edwards, Model S150B, U.K.) to a targeted thickness
of 30 nm, and examined with the SEM at an accelerating voltage
of 8 kV.
2.7 Bacterial adhesion
Bacterial initial adhesion was examined with a static soaking
surfaces were acquired using a surface force apparatus (Surforce
1
5
10
15
20
25
30
35
40
45
50
55
1
5
10
15
20
25
30
35
40
45
50
AFM measurements. Samples were imaged with a silicon tip
(AppNANO, ACT-200, Si, N-type, tip radius <10 nm, resonant
frequency of 318 kHz) operating in the tapping mode in air. At
least three samples and more than three positions per sample
were imaged to characterize each substrate.
2.4 Quartz crystal microbalance with dissipation (QCM-D)
Adhesion of LPS to PS surfaces was studied using a QCM-D (Q-
sense E4, Biolin Scientific, Sweden). The PS coating was
prepared by spin-coating the Au sensors with three drops of PS
solution (0.5% in toluene) at 2000 rpm (Spin Coater WSW-400A-
6NPP/LITTE, Laurell Technologies Corporation, North Wales,
PA, USA) and vacuum dried. Prior to each experiment, the PS-
coated sensor was equilibrated by pumping LPS free background
0.1 M NaCl solution. 10 mg mL�1 LPS in 0.1 M NaCl solutions
were then injected to assess the LPS adhesion behavior.
Following the LPS injection, sensors were eluted with back-
ground 0.1 M NaCl to assess LPS adhesion stability.
2.5 Bacterial culture
Two kinds of E. coli strains were examined. E. coli JM109
55
expresses a full LPS chain that consists of lipid A, core poly-
saccharides, and O-antigen (LPS1). E. coli K12 produces
a truncated LPS chain that extends from lipid A to the outer core
polysaccharides (LPS2). The structures of LPS1 and LPS2 are
shown in Fig. 1. E. coli JM109 was kindly provided by Dr
Mavanur Suresh (Faculty of Pharmacy and Pharmaceutical
Sciences, University of Alberta, Canada).
ART � C1SM
This journal is ª The Royal Society of Chemistry 2011
method by putting targeted substrates in a bacterial suspension.
Each substrate was soaked in 3 mL of an E. coli JM109 or K12
suspension (108 CFU/mL in 0.1 M NaCl) for 30 min at 23 �C.Then the substrates were removed and dipped in 0.1 M NaCl to
remove unbound cells. Substrates with attached bacteria were
treated with Syto� 9 (5 mM, Invitrogen, Burlington, ON, Can-
ada) for 15 min to stain bacteria. After staining, the attached cells
were counted within one hour under a fluorescence microscope
(Leica DMRXA microscope, Nikon Digital Camera – DXM
1200, Nikon ACT-1 software 2.70). Five images, each corre-
sponding to a surface area of 0.00348 cm2, were taken randomly
from different positions for each substrate. The number of
adhered cells was obtained by counting the bright spots on the
fluorescence images and normalized to the surface area. Bacterial
adhesion experiments were repeated for at least four times.
2.8 Surface force measurement
Interaction forces and normal force–distance profiles between
LLC, Santa Barbara, CA) to elucidate the intermolecular inter-
action mechanism.19 The detailed setup for SFA experiments has
been reported.18–20 A schematic of the setup for studying LPS
interactions is shown in Fig. 2. Two thin mica sheets (1–5 mm)
were glued onto cylindrical silica disks (radius R ¼ 2 cm), and
surfaces were mounted in the SFA chamber in a crossed-cylinder
configuration. The interaction force F between the curved mica
surfaces was measured as a function of absolute surface sepa-
ration distance D. The absolute surface separation was moni-
tored in real-time using multiple beam interferometry employing
fringes of equal chromatic order (FECO). The forces measured
05554B
Soft Matter, 2011, xx, 1–15 | 3
1
5
10
15
20
25
30
35
40
45
50
55
1
5
10
tio
rted
and
15
20
25
30
35
40
roughly correspond to a sphere of radius R approaching a flat
surface based on the Derjaguin approximation: F(D) ¼ 2pRW
(D), where F(D) is the force between the two curved surfaces and
W(D) is the interaction energy per unit area between two flat
surfaces.22 The measured adhesion or ‘‘pull-off’’ force Fad is
related to the adhesion energy per unit area Wad by Fad ¼2pRWad for rigid (undeformable) surfaces with weakly adhesive
interactions, and by Fad ¼ 1.5pRWad (used in this study) for soft
deformable surfaces with strong adhesive contact.26
To evaluate intermolecular interaction mechanisms, two SFA
configurations were tested. Symmetrical configuration experi-
ments were carried out by injecting 10 mg mL�1 LPS in 0.1 M
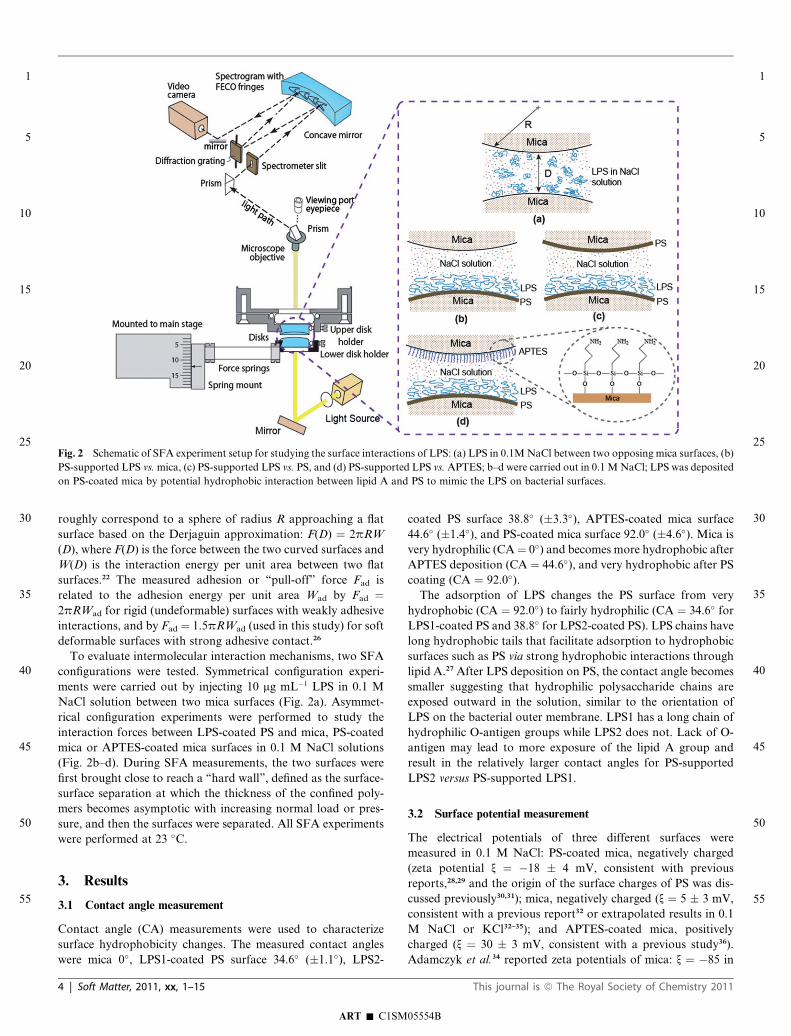
Fig. 2 Schematic of SFA experiment setup for studying the surface interac
PS-supported LPS vs.mica, (c) PS-supported LPS vs. PS, and (d) PS-suppo
on PS-coated mica by potential hydrophobic interaction between lipid A
NaCl solution between two mica surfaces (Fig. 2a). Asymmet-
rical configuration experiments were performed to study the
interaction forces between LPS-coated PS and mica, PS-coated
mica or APTES-coated mica surfaces in 0.1 M NaCl solutions
(Fig. 2b–d). During SFA measurements, the two surfaces were
first brought close to reach a ‘‘hard wall’’, defined as the surface-
surface separation at which the thickness of the confined poly-
mers becomes asymptotic with increasing normal load or pres-
sure, and then the surfaces were separated. All SFA experiments
were performed at 23 �C.
3. Results
3.1 Contact angle measurement
Contact angle (CA) measurements were used to characterize
surface hydrophobicity changes. The measured contact angles
were mica 0�, LPS1-coated PS surface 34.6� (�1.1�), LPS2-
ART � C1SM
4 | Soft Matter, 2011, xx, 1–15
45
50
55
coated PS surface 38.8� (�3.3�), APTES-coated mica surface
44.6� (�1.4�), and PS-coated mica surface 92.0� (�4.6�). Mica is
very hydrophilic (CA¼ 0�) and becomes more hydrophobic after
APTES deposition (CA ¼ 44.6�), and very hydrophobic after PS
coating (CA ¼ 92.0�).The adsorption of LPS changes the PS surface from very
hydrophobic (CA ¼ 92.0�) to fairly hydrophilic (CA ¼ 34.6� forLPS1-coated PS and 38.8� for LPS2-coated PS). LPS chains have
long hydrophobic tails that facilitate adsorption to hydrophobic
surfaces such as PS via strong hydrophobic interactions through
lipid A.27 After LPS deposition on PS, the contact angle becomes
smaller suggesting that hydrophilic polysaccharide chains are
exposed outward in the solution, similar to the orientation of
LPS on the bacterial outer membrane. LPS1 has a long chain of
hydrophilic O-antigen groups while LPS2 does not. Lack of O-
antigen may lead to more exposure of the lipid A group and
result in the relatively larger contact angles for PS-supported
LPS2 versus PS-supported LPS1.
3.2 Surface potential measurement
The electrical potentials of three different surfaces were
measured in 0.1 M NaCl: PS-coated mica, negatively charged
(zeta potential x ¼ �18 � 4 mV, consistent with previous
reports,28,29 and the origin of the surface charges of PS was dis-
cussed previously30,31); mica, negatively charged (x ¼ 5 � 3 mV,
consistent with a previous report32 or extrapolated results in 0.1
M NaCl or KCl32–35); and APTES-coated mica, positively
charged (x ¼ 30 � 3 mV, consistent with a previous study36).
Adamczyk et al.34 reported zeta potentials of mica: x ¼ �85 in
ns of LPS: (a) LPS in 0.1MNaCl between two opposing mica surfaces, (b)
LPS vs.APTES; b–d were carried out in 0.1MNaCl; LPS was deposited
PS to mimic the LPS on bacterial surfaces.
05554B
This journal is ª The Royal Society of Chemistry 2011
0.001 M NaCl and �38 mV in 0.01 M NaCl, leading to an
extrapolated x value around zero or slightly positive in 0.1 M
NaCl. Previous studies have shown that the ionic strength of the
media has a significant impact on the zeta potential of mica, and
most studies were performed in ionic strengths (10�5 to 10�2 M)
relatively lower than the biological condition. Streaming poten-
tial measurements at higher ionic strengths (>0.01 M) become
less reliable as a result of increasing electric conductivity of the
electrolyte in the stream potential flow cell; however, our
measurements were consistent with the previous results and
predictions.32–35
3.3 QCM-D measurement
a considerable amount of water coupled to the long chain of
hydrophilic O-antigen groups) than that obtained with LPS2.
It should be noted that the thickness of LPS adsorbed layers
on PS-coated sensors are shorter than the full length for the
corresponding LPS. Estimated according to the LPS components
on the bacterial surface, the maximum stretched full lengths for
free LPS are 38 nm for LPS1 and 8 nm for LPS2 (Fig. 1).6,8,9,39,40
This observation can be attributed to the conformational change
of LPS in aqueous solution. Previous studies showed that poly-
saccharides can change their conformation due to bacterial
growth conditions and solution chemistry, and form coiled or
other compact structures.14,15,40,41 O-antigen repeat units can also
vary on bacterial surfaces,42 leading to large variations in the LPS
chain length.14,15 In this study, it is reasonable to consider the
adsorbed LPS layer on PS as a single layer.
3.4 AFM measurement
AFMwas used to provide information on surface roughness and
surface structure. As shown in Fig. 4, the root mean square (rms)
roughness values for mica, APTES-coated mica, and PS-coated
mica were all less than 0.5 nm, indicating very smooth surfaces
1
5
10
15
20
25
30
35
40
45
50
55
1
5
10
15
20
QCM-D is an advanced technology for the study of surface
interactions. It can provide sensitivity to nanograms of mass and
can be applied to in situ structural arrangements.37,38 Frequency
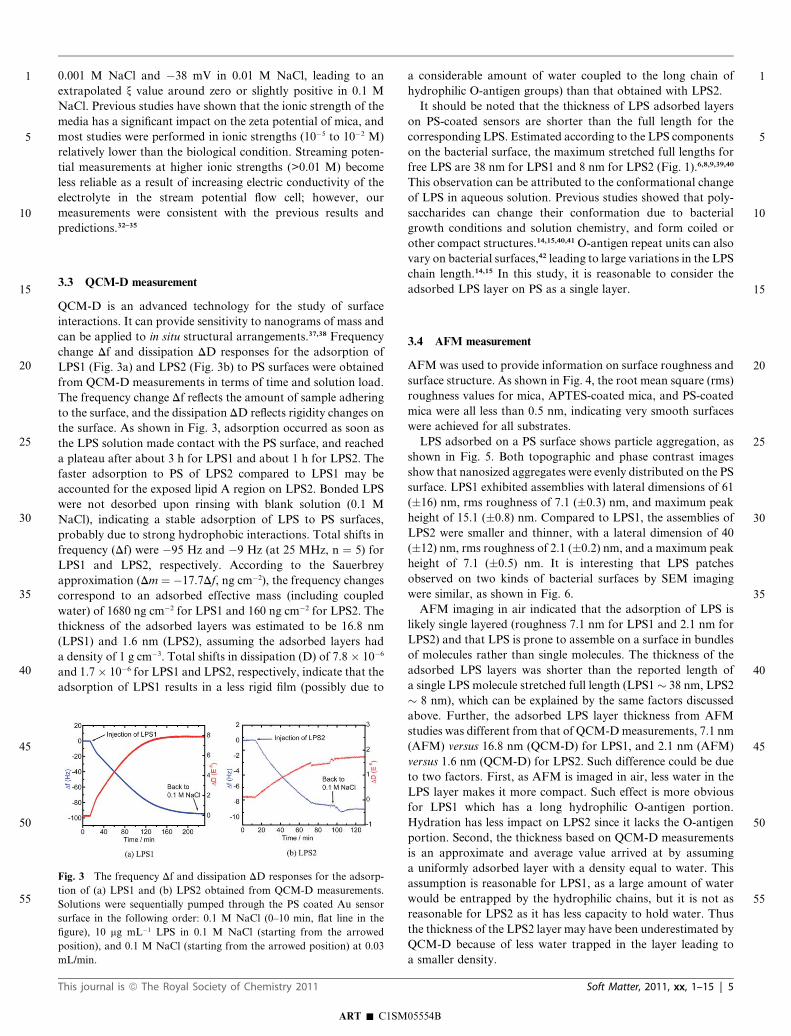
change Df and dissipation DD responses for the adsorption of
LPS1 (Fig. 3a) and LPS2 (Fig. 3b) to PS surfaces were obtained
from QCM-D measurements in terms of time and solution load.
The frequency change Df reflects the amount of sample adhering
to the surface, and the dissipation DD reflects rigidity changes on
the surface. As shown in Fig. 3, adsorption occurred as soon as were achieved for all substrates.
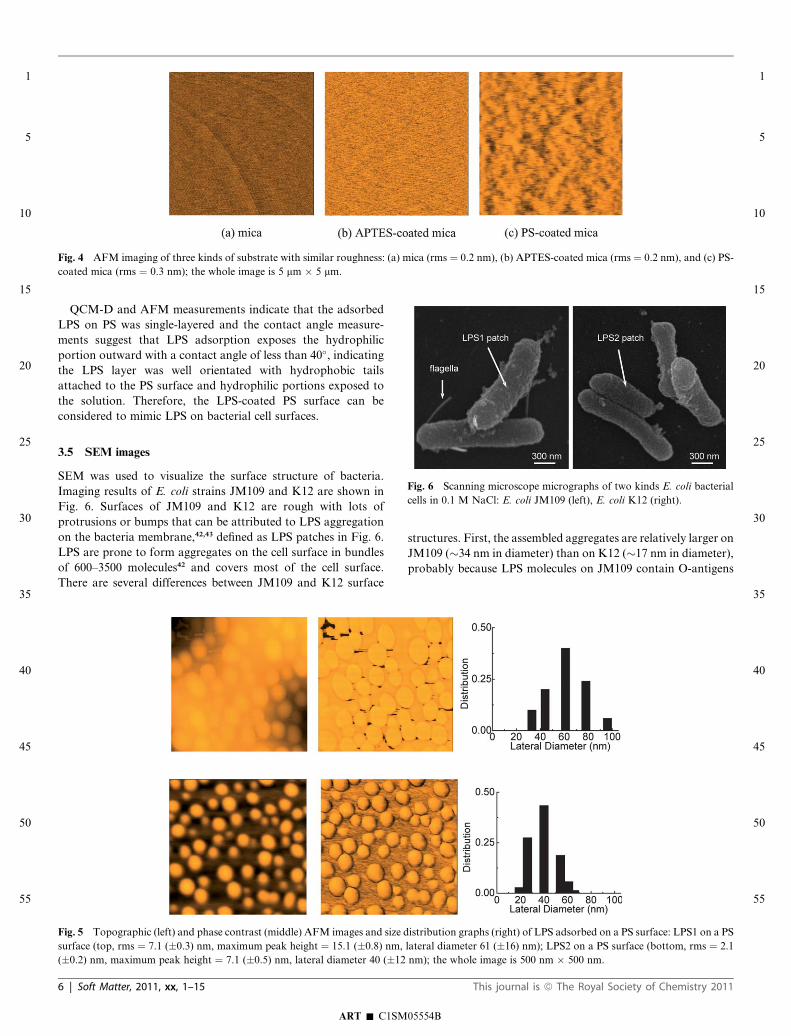
LPS adsorbed on a PS surface shows particle aggregation, as
shown in Fig. 5. Both topographic and phase contrast images
show that nanosized aggregates were evenly distributed on the PS
surface. LPS1 exhibited assemblies with lateral dimensions of 61
(�16) nm, rms roughness of 7.1 (�0.3) nm, and maximum peak
height of 15.1 (�0.8) nm. Compared to LPS1, the assemblies of
observed on two kinds of bacterial surfaces by SEM imaging
25
30
the LPS solution made contact with the PS surface, and reached
a plateau after about 3 h for LPS1 and about 1 h for LPS2. The
faster adsorption to PS of LPS2 compared to LPS1 may be
accounted for the exposed lipid A region on LPS2. Bonded LPS
were not desorbed upon rinsing with blank solution (0.1 M
NaCl), indicating a stable adsorption of LPS to PS surfaces,
probably due to strong hydrophobic interactions. Total shifts in
frequency (Df) were �95 Hz and �9 Hz (at 25 MHz, n ¼ 5) for
LPS1 and LPS2, respectively. According to the Sauerbrey
approximation (Dm ¼ �17.7Df, ng cm�2), the frequency changes
correspond to an adsorbed effective mass (including coupled
water) of 1680 ng cm�2 for LPS1 and 160 ng cm�2 for LPS2. The
thickness of the adsorbed layers was estimated to be 16.8 nm
(LPS1) and 1.6 nm (LPS2), assuming the adsorbed layers had
a density of 1 g cm�3. Total shifts in dissipation (D) of 7.8 � 10�6
and 1.7� 10�6 for LPS1 and LPS2, respectively, indicate that the
adsorption of LPS1 results in a less rigid film (possibly due to
Fig. 3 The frequency Df and dissipation DD responses for the adsorp-
tion of (a) LPS1 and (b) LPS2 obtained from QCM-D measurements.
Solutions were sequentially pumped through the PS coated Au sensor
surface in the following order: 0.1 M NaCl (0–10 min, flat line in the
figure), 10 mg mL�1 LPS in 0.1 M NaCl (starting from the arrowed
position), and 0.1 M NaCl (starting from the arrowed position) at 0.03
mL/min.
ART � C1SM
This journal is ª The Royal Society of Chemistry 2011
LPS2 were smaller and thinner, with a lateral dimension of 40
(�12) nm, rms roughness of 2.1 (�0.2) nm, and a maximum peak
height of 7.1 (�0.5) nm. It is interesting that LPS patches
were similar, as shown in Fig. 6.
AFM imaging in air indicated that the adsorption of LPS is
likely single layered (roughness 7.1 nm for LPS1 and 2.1 nm for
LPS2) and that LPS is prone to assemble on a surface in bundles
of molecules rather than single molecules. The thickness of the
adsorbed LPS layers was shorter than the reported length of
a single LPS molecule stretched full length (LPS1� 38 nm, LPS2
� 8 nm), which can be explained by the same factors discussed
above. Further, the adsorbed LPS layer thickness from AFM
studies was different from that of QCM-Dmeasurements, 7.1 nm
(AFM) versus 16.8 nm (QCM-D) for LPS1, and 2.1 nm (AFM)
versus 1.6 nm (QCM-D) for LPS2. Such difference could be due
to two factors. First, as AFM is imaged in air, less water in the
LPS layer makes it more compact. Such effect is more obvious
for LPS1 which has a long hydrophilic O-antigen portion.
Hydration has less impact on LPS2 since it lacks the O-antigen
portion. Second, the thickness based on QCM-D measurements
is an approximate and average value arrived at by assuming
a uniformly adsorbed layer with a density equal to water. This
assumption is reasonable for LPS1, as a large amount of water
would be entrapped by the hydrophilic chains, but it is not as
reasonable for LPS2 as it has less capacity to hold water. Thus
the thickness of the LPS2 layer may have been underestimated by
QCM-D because of less water trapped in the layer leading to
a smaller density.
05554B
Soft Matter, 2011, xx, 1–15 | 5
35
40
45
50
55
a) m
1
5
10
15
20
25
30
35
40
45
50
55
1
5
10
15
20
QCM-D and AFM measurements indicate that the adsorbed
LPS on PS was single-layered and the contact angle measure-
ments suggest that LPS adsorption exposes the hydrophilic
portion outward with a contact angle of less than 40�, indicatingthe LPS layer was well orientated with hydrophobic tails
attached to the PS surface and hydrophilic portions exposed to
the solution. Therefore, the LPS-coated PS surface can be
considered to mimic LPS on bacterial cell surfaces.
Fig. 4 AFM imaging of three kinds of substrate with similar roughness: (
coated mica (rms ¼ 0.3 nm); the whole image is 5 mm � 5 mm.
ize d
m,
12 nm); the whole image is 500 nm � 500 nm.
25
30
35
40
45
50
55
3.5 SEM images
SEM was used to visualize the surface structure of bacteria.
Imaging results of E. coli strains JM109 and K12 are shown in
Fig. 6. Surfaces of JM109 and K12 are rough with lots of
protrusions or bumps that can be attributed to LPS aggregation
on the bacteria membrane,42,43 defined as LPS patches in Fig. 6.
LPS are prone to form aggregates on the cell surface in bundles
of 600–3500 molecules42 and covers most of the cell surface.
There are several differences between JM109 and K12 surface
Fig. 5 Topographic (left) and phase contrast (middle) AFM images and s
surface (top, rms ¼ 7.1 (�0.3) nm, maximum peak height ¼ 15.1 (�0.8) n
(�0.2) nm, maximum peak height ¼ 7.1 (�0.5) nm, lateral diameter 40 (�
ART � C1SM
6 | Soft Matter, 2011, xx, 1–15
structures. First, the assembled aggregates are relatively larger on
JM109 (�34 nm in diameter) than on K12 (�17 nm in diameter),
probably because LPS molecules on JM109 contain O-antigens
ica (rms ¼ 0.2 nm), (b) APTES-coated mica (rms ¼ 0.2 nm), and (c) PS-
istribution graphs (right) of LPS adsorbed on a PS surface: LPS1 on a PS
lateral diameter 61 (�16) nm); LPS2 on a PS surface (bottom, rms ¼ 2.1
Fig. 6 Scanning microscope micrographs of two kinds E. coli bacterial
cells in 0.1 M NaCl: E. coli JM109 (left), E. coli K12 (right).
05554B
This journal is ª The Royal Society of Chemistry 2011

while K12 LPS lack O-antigens. Second, the ‘‘dark’’ features
were observed for both types of bacteria in Fig. 6. Similar ‘‘dark’’
features on bacterial surfaces have been observed by Kotra
et al.,42 who suggested the ‘‘dark’’ spots may represent void
spaces among LPS patches where other surface components
could exist. In our study, there were more visible ‘‘dark’’ spots on
K12 compared to JM109, which may imply more exposure to the
surrounding solution of other surface structures on K12 bacteria,
such as outer membrane proteins. It should be noted that
although SEM has been widely used to visualize microbial
surface structures at high resolution and the bacterial surface
structures observed in SEM evolve from naturally present
structures of living bacterial surfaces,44 sample pre-treatment
may cause certain changes on cell surface morphology.44,45 For
instance, it has been reported that the SEM fixation reagent
glutaraldehyde can generate cross-links on cell outer
membranes.46,47 Third, the SEM image shows nanofiber struc-
tures on JM109 but not on K12. The nanofibers are �40 nm in
width and �400 nm in length, and are most likely flagella,7
arrowed in Fig. 6. The growth of flagella on E. coli is dependent
on environmental conditions.48 Our SEM results agree with
previous studies that concluded that K12 bacteria lack surface
flagella.49
3.6 Surface forces measurements
SFA experiments (Fig. 2) were carried out to investigate the
intermolecular interaction mechanism between LPS and
different substrates during bacterial adhesion. The surface
interaction force (F/R) vs. distance (D) profiles obtained during
the SFA approach and separation processes are shown in Fig. 7–
9. The discontinuities of the data points during the retraction
processes were due to the jump-out of the two surfaces from each
other when the pulling force slightly exceeded the adhesion
force.19
For the symmetrical configuration, 10 mg ml�1 LPS in 0.1 M
NaCl was injected between twomica surfaces (Fig. 2a). For LPS1
on mica is possibly different from that of LPS1. For LPS2, the
hard wall was only 1 nmwhich is much smaller than the stretched
full length of LPS2, suggesting that LPS2 molecules were lying
on the mica, confined by the external pressure. The adsorption of
LPS2 to mica was weak and the adhesion force measured was
mainly due to a bridging effect.26
During asymmetrical experiments, LPS was deposited on the
PS-coated mica by hydrophobic interaction to mimic the LPS on
bacterial surface and the interactions between LPS-coated PS
and one of the mica, PS-coated mica, and APTES-coated mica
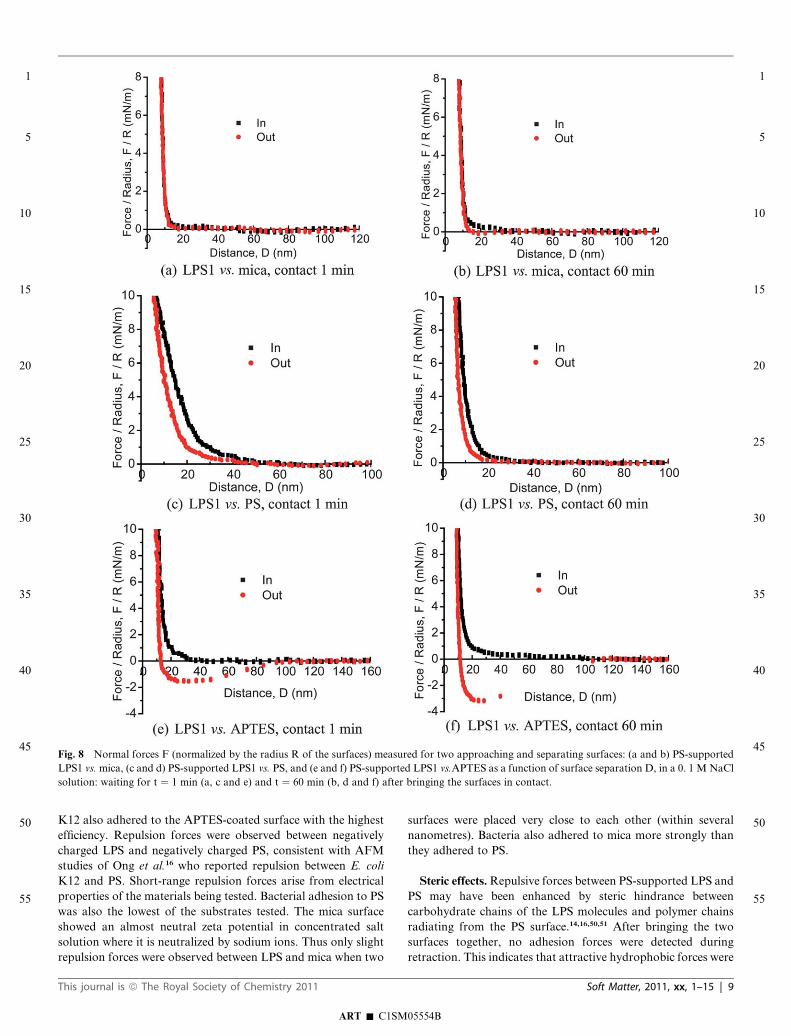
surfaces were studied (Fig. 2c–d). No adhesion or repulsion
forces were measured between LPS1 and mica and a hard wall of
10 (�1) nm was reached on close approach of the samples
(Fig. 8a). The force–distance profiles did not show obvious
change with increasing the contact time from 1 min to 60 min
(Fig. 8b). Repulsion forces were observed in interactions between
PS-supported LPS1 and PS, as shown in Fig. 8c; repulsion forces
decreased with increasing contact time from 1 min to 60 min
(Fig. 8d). A strong adhesion force Fad/R ¼ �1.50 (�0.08) mN
m�1 (interaction energy Wad ¼ Fad/1.5pR ¼ �0.32 mJ m�2) was
obtained between LPS1 and APTES (Fig. 8e), and the adhesion
force increased to Fad/R¼ �3.1 (�0.07) mN m�1 (Wad ¼ 0.66 mJ
m�2) when contact time increased from 1 min to 60 min (Fig. 8f).
The hard wall distances for the above measurements were all 10
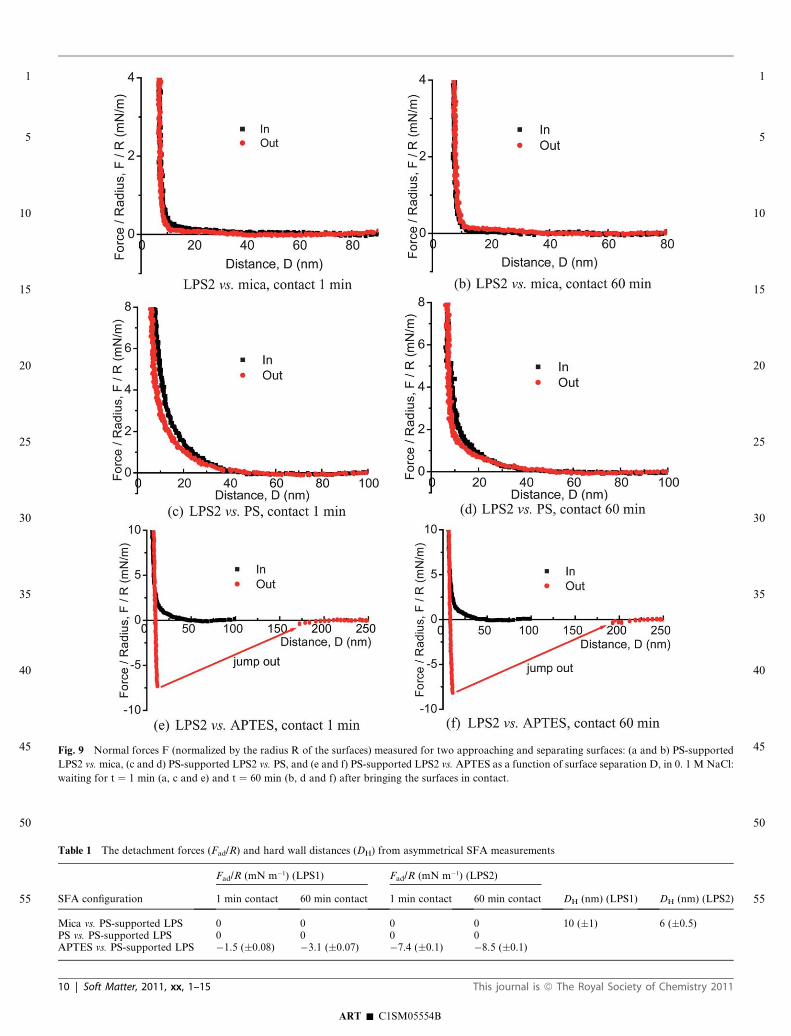
(�1) nm. As shown in Fig. 9a–f, similar trends were obtained for
LPS2. The adhesion force of LPS2 was the lowest on PS, and
highest on APTES. The hard wall distance for LPS2 was 6.0
(�0.5) nm, smaller than for LPS1. Adhesion forces between PS-
supported LPS2 and APTES were Fad/R ¼ �7.4 (�0.1) mN m�1
(Wad ¼ 1.57 mJ m�2) and Fad/R ¼ �8.5 (�0.1) mN m�1 (Wad ¼1.80 mJ m�2) at contact times 1 min and 60 min, respectively,
stronger than those between PS-supported LPS1 and APTES.
The detachment forces and hard wall distances for asymmetrical
experiments were listed in Table 1.
SFA experiments showed that the hard wall distances of
adsorbed LPS layers on PS were 10 nm and 6 nm for LPS1 and
LPS2, respectively. Compared to the thickness values obtained
and the estimated stretched full length (LPS1 38 nm, LPS2 8 nm)9,39,40
1
5
10
15
20
25
30
35
40
45
50
55
1
5
10
15
20
25
30
35
40
45
50
55
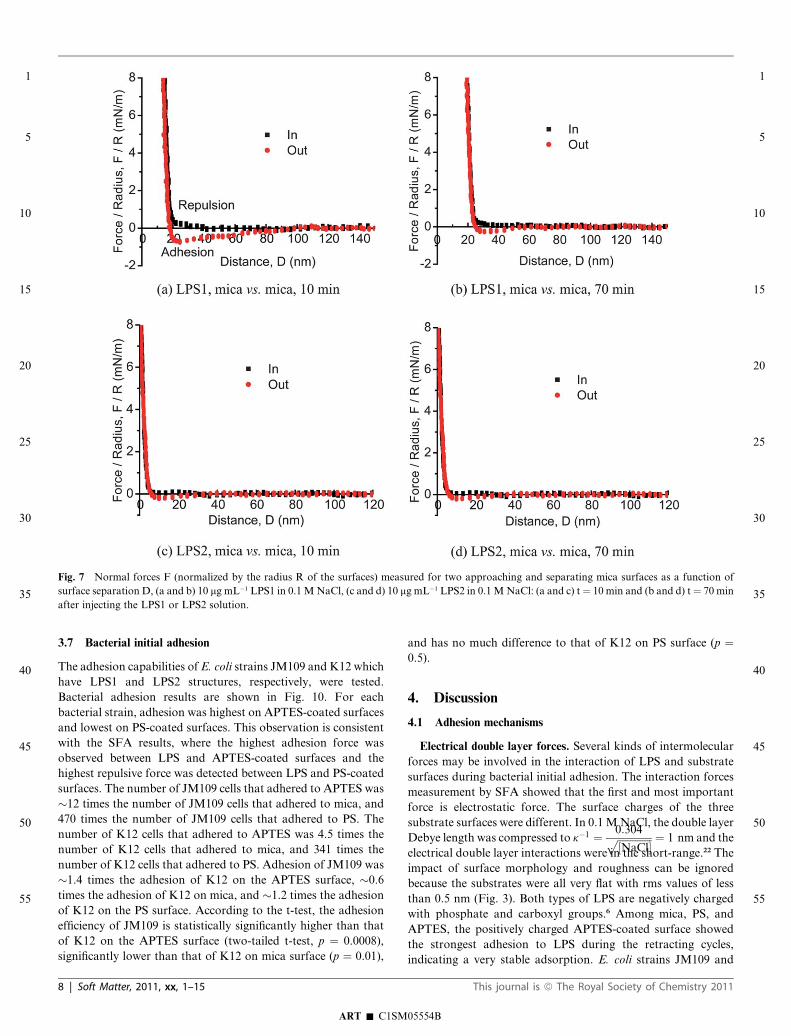
solution, the initial force measurement was taken �10 min after
injecting the solution, and an adhesion force of Fad/R ¼ �0.70
(�0.04) mN m�1 was measured during the separation, as shown
in Fig. 7a. Successive measurements showed smaller adhesion
forces than the first measurement, possibly due to conformation
changes of LPS1 after the previous measurement. The hard wall
distance shifted from �12 nm for the initial measurement to �20
nm after 70 min adsorption with the adhesion force decreased to
Fad/R ¼ �0.30 (�0.02) mN m�1 as shown in Fig. 7a and 7b. For
LPS2, an adhesion force of�0.20 (�0.02) mNm�1 was measured
after 10 min adsorption, as shown in Fig. 7c. The hard wall (1
nm) did not change after 70 min with a similar adhesion force
(Fig. 7d).
According to observations in the symmetrical experiments,
LPS1 adhered to mica more strongly than LPS2; adhesion forces
were �0.7 mN m�1 (LPS1) and �0.2 mN m�1 (LPS2). When the
adsorption time increased (to 70 min), LPS1 adsorption to mica
increased while LPS2 adsorption did not. LPS has many nega-
tively charged functional groups that will repel the negatively
charged mica surface. The large O-antigen groups on LPS1 will
shield the negative charges. As a result, adhesion of LPS1 to mica
is more favorable than adsorption of LPS2. The layout of LPS2
ART � C1SM
This journal is ª The Royal Society of Chemistry 2011
from other methods, e.g., QCM-D (16.8 nm for LPS1, and 1.6
nm for LPS2), AFM (7.1 nm for LPS1, and 2.1 nm for LPS2),
reported previously, the values obtained from SFA
measurements are within the same range and can be considered
quite consistent. The variations may be attributed to confor-
mational changes of LPS in solution and on the supporting
substrates, and the surface coverage of LPS deposition on PS-
coated mica. First, all the experimental thicknesses were less than
the maximum stretched full length; impacts of LPS assembly,
growth conditions, solution chemistry, and changes in LPS
conformation can lead to smaller effective LPS length. The SFA
results further confirmed that LPS were adsorbed in a single
layer. Second, SFA provides important information that
complements AFM and QCM-D measurements about the
conformation and molecular interactions of the LPS layer. AFM
was operated in air which gave smaller values for LPS thickness
compared to solution conditions, while the thickness estimated
from QCM-D measurement was based on the Sauerbrey
approximation, assumption of uniform surface coverage and
density.
05554B
Soft Matter, 2011, xx, 1–15 | 7
3.7 Bacterial initial adhesion
The adhesion capabilities of E. coli strains JM109 and K12 which
have LPS1 and LPS2 structures, respectively, were tested.
Bacterial adhesion results are shown in Fig. 10. For each
bacterial strain, adhesion was highest on APTES-coated surfaces
and lowest on PS-coated surfaces. This observation is consistent
with the SFA results, where the highest adhesion force was
observed between LPS and APTES-coated surfaces and the
highest repulsive force was detected between LPS and PS-coated
surfaces. The number of JM109 cells that adhered to APTES was
�12 times the number of JM109 cells that adhered to mica, and
and has no much difference to that of K12 on PS surface (p ¼0.5).
4. Discussion
4.1 Adhesion mechanisms
Electrical double layer forces. Several kinds of intermolecular
forces may be involved in the interaction of LPS and substrate
surfaces during bacterial initial adhesion. The interaction forces
measurement by SFA showed that the first and most important
Fig. 7 Normal forces F (normalized by the radius R of the surfaces) measured for two approaching and separating mica surfaces as a function of
surface separation D, (a and b) 10 mg mL�1 LPS1 in 0.1MNaCl, (c and d) 10 mg mL�1 LPS2 in 0.1MNaCl: (a and c) t¼ 10 min and (b and d) t¼ 70 min
after injecting the LPS1 or LPS2 solution.
1
5
10
15
20
25
30
35
40
45
50
55
1
5
10
15
20
25
30
35
40
45
50
55
470 times the number of JM109 cells that adhered to PS. The
number of K12 cells that adhered to APTES was 4.5 times the
number of K12 cells that adhered to mica, and 341 times the
number of K12 cells that adhered to PS. Adhesion of JM109 was
�1.4 times the adhesion of K12 on the APTES surface, �0.6
times the adhesion of K12 on mica, and �1.2 times the adhesion
of K12 on the PS surface. According to the t-test, the adhesion
efficiency of JM109 is statistically significantly higher than that
of K12 on the APTES surface (two-tailed t-test, p ¼ 0.0008),
significantly lower than that of K12 on mica surface (p ¼ 0.01),
ART � C1SM
8 | Soft Matter, 2011, xx, 1–15
force is electrostatic force. The surface charges of the three
substrate surfaces were different. In 0.1MNaCl, the double layer
Debye length was compressed to k�1 ¼ 0:304ffiffiffiffiffiffiffiffiffiffiffiffiffiffi½NaCl�p ¼ 1 nm and the
electrical double layer interactions were in the short-range.22 The
impact of surface morphology and roughness can be ignored
because the substrates were all very flat with rms values of less
than 0.5 nm (Fig. 3). Both types of LPS are negatively charged
with phosphate and carboxyl groups.6 Among mica, PS, and
APTES, the positively charged APTES-coated surface showed
the strongest adhesion to LPS during the retracting cycles,
indicating a very stable adsorption. E. coli strains JM109 and
05554B
This journal is ª The Royal Society of Chemistry 2011
K12 also adhered to the APTES-coated surface with the highest
efficiency. Repulsion forces were observed between negatively
charged LPS and negatively charged PS, consistent with AFM
studies of Ong et al.16 who reported repulsion between E. coli
K12 and PS. Short-range repulsion forces arise from electrical
properties of the materials being tested. Bacterial adhesion to PS
was also the lowest of the substrates tested. The mica surface
showed an almost neutral zeta potential in concentrated salt
solution where it is neutralized by sodium ions. Thus only slight
repulsion forces were observed between LPS and mica when two
surfaces were placed very close to each other (within several
nanometres). Bacteria also adhered to mica more strongly than
they adhered to PS.
Steric effects.Repulsive forces between PS-supported LPS and
PS may have been enhanced by steric hindrance between
carbohydrate chains of the LPS molecules and polymer chains
radiating from the PS surface.14,16,50,51 After bringing the two
surfaces together, no adhesion forces were detected during
retraction. This indicates that attractive hydrophobic forces were
Fig. 8 Normal forces F (normalized by the radius R of the surfaces) measured for two approaching and separating surfaces: (a and b) PS-supported
LPS1 vs.mica, (c and d) PS-supported LPS1 vs. PS, and (e and f) PS-supported LPS1 vs.APTES as a function of surface separation D, in a 0. 1 M NaCl
solution: waiting for t ¼ 1 min (a, c and e) and t ¼ 60 min (b, d and f) after bringing the surfaces in contact.
ART � C1SM05554B
This journal is ª The Royal Society of Chemistry 2011 Soft Matter, 2011, xx, 1–15 | 9
1
5
10
15
20
25
30
35
40
45
50
55
1
5
10
15
20
25
30
35
40
45
50
55
sured for two approaching and separating surfaces: (a and b) PS-supported
rted LPS2 vs. APTES as a function of surface separation D, in 0. 1 M NaCl:
ng the surfaces in contact.
m asymmetrical SFA measurements
Fad/R (mN m�1) (LPS2)
DH (nm) (LPS1) DH (nm) (LPS2)1 min contact 60 min contact
0 0 10 (�1) 6 (�0.5)0 0�7.4 (�0.1) �8.5 (�0.1)
1
5
10
15
20
25
30
35
40
45
50
55
1
5
10
15
20
25
30
35
40
45
50
55
Fig. 9 Normal forces F (normalized by the radius R of the surfaces) mea
LPS2 vs.mica, (c and d) PS-supported LPS2 vs. PS, and (e and f) PS-suppo
waiting for t ¼ 1 min (a, c and e) and t ¼ 60 min (b, d and f) after bringi
Table 1 The detachment forces (Fad/R) and hard wall distances (DH) fro
SFA configuration
Fad/R (mN m�1) (LPS1)
1 min contact 60 min contact
Mica vs. PS-supported LPS 0 0PS vs. PS-supported LPS 0 0APTES vs. PS-supported LPS �1.5 (�0.08) �3.1 (�0.07)
ART � C1SM
10 | Soft Matter, 2011, xx, 1–15
05554B
This journal is ª The Royal Society of Chemistry 2011
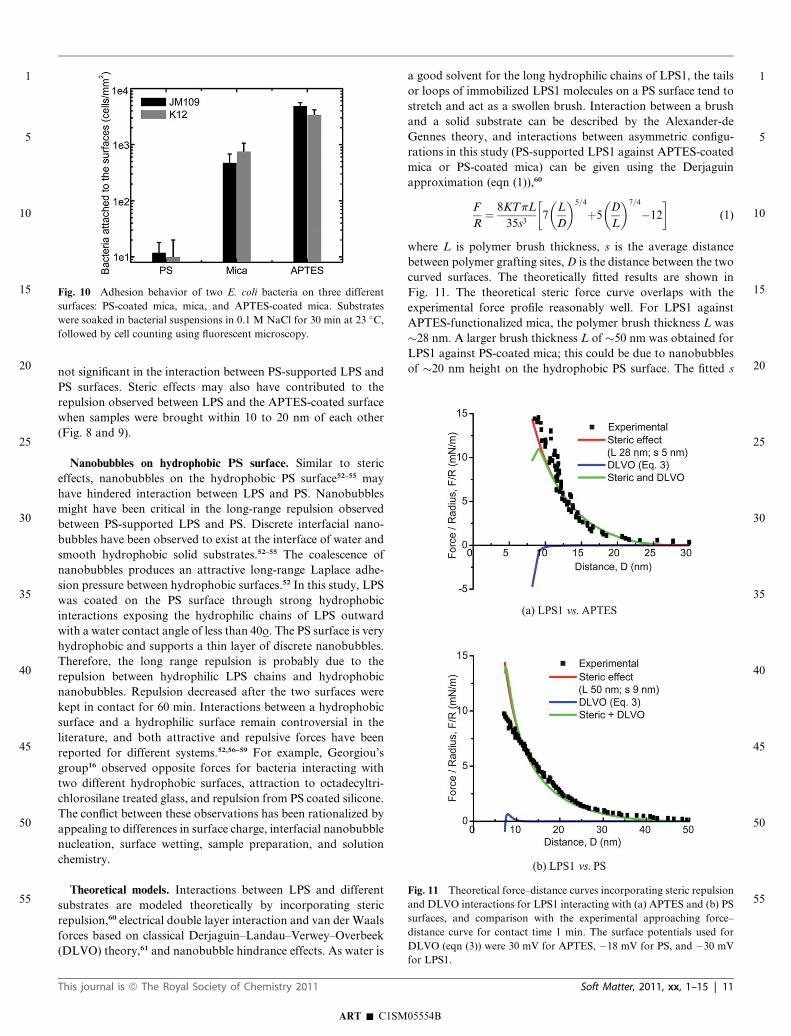
Fig. 11. The theoretical steric force curve overlaps with the
1
5
10
15
20
25
30
35
40
45
50
55
1
5
10
15
20
25
30
35
40
45
50
55
not significant in the interaction between PS-supported LPS and
PS surfaces. Steric effects may also have contributed to the
repulsion observed between LPS and the APTES-coated surface
when samples were brought within 10 to 20 nm of each other
(Fig. 8 and 9).
Nanobubbles on hydrophobic PS surface. Similar to steric
effects, nanobubbles on the hydrophobic PS surface52–55 may
have hindered interaction between LPS and PS. Nanobubbles
might have been critical in the long-range repulsion observed
between PS-supported LPS and PS. Discrete interfacial nano-
bubbles have been observed to exist at the interface of water and
smooth hydrophobic solid substrates.52–55 The coalescence of
nanobubbles produces an attractive long-range Laplace adhe-
sion pressure between hydrophobic surfaces.52 In this study, LPS
was coated on the PS surface through strong hydrophobic
interactions exposing the hydrophilic chains of LPS outward
with a water contact angle of less than 40o. The PS surface is very
hydrophobic and supports a thin layer of discrete nanobubbles.
Therefore, the long range repulsion is probably due to the
repulsion between hydrophilic LPS chains and hydrophobic
nanobubbles. Repulsion decreased after the two surfaces were
kept in contact for 60 min. Interactions between a hydrophobic
surface and a hydrophilic surface remain controversial in the
literature, and both attractive and repulsive forces have been
reported for different systems.52,56–59 For example, Georgiou’s
group16 observed opposite forces for bacteria interacting with
two different hydrophobic surfaces, attraction to octadecyltri-
chlorosilane treated glass, and repulsion from PS coated silicone.
The conflict between these observations has been rationalized by
appealing to differences in surface charge, interfacial nanobubble
nucleation, surface wetting, sample preparation, and solution
chemistry.
Theoretical models. Interactions between LPS and different
substrates are modeled theoretically by incorporating steric
repulsion,60 electrical double layer interaction and van der Waals
forces based on classical Derjaguin–Landau–Verwey–Overbeek
(DLVO) theory,61 and nanobubble hindrance effects. As water is
Fig. 10 Adhesion behavior of two E. coli bacteria on three different
surfaces: PS-coated mica, mica, and APTES-coated mica. Substrates
were soaked in bacterial suspensions in 0.1 M NaCl for 30 min at 23 �C,followed by cell counting using fluorescent microscopy.
ART � C1SM
This journal is ª The Royal Society of Chemistry 2011
a good solvent for the long hydrophilic chains of LPS1, the tails
or loops of immobilized LPS1 molecules on a PS surface tend to
stretch and act as a swollen brush. Interaction between a brush
and a solid substrate can be described by the Alexander-de
Gennes theory, and interactions between asymmetric configu-
rations in this study (PS-supported LPS1 against APTES-coated
mica or PS-coated mica) can be given using the Derjaguin
approximation (eqn (1)),60
F
R¼ 8KTpL
35s3
�7
�L
D
�5=4
þ5
�D
L
�7=4
�12
�(1)
where L is polymer brush thickness, s is the average distance
between polymer grafting sites,D is the distance between the two
curved surfaces. The theoretically fitted results are shown in
experimental force profile reasonably well. For LPS1 against
APTES-functionalized mica, the polymer brush thickness L was
�28 nm. A larger brush thickness L of �50 nm was obtained for
LPS1 against PS-coated mica; this could be due to nanobubbles
of �20 nm height on the hydrophobic PS surface. The fitted s
Fig. 11 Theoretical force–distance curves incorporating steric repulsion
and DLVO interactions for LPS1 interacting with (a) APTES and (b) PS
surfaces, and comparison with the experimental approaching force–
distance curve for contact time 1 min. The surface potentials used for
DLVO (eqn (3)) were 30 mV for APTES, �18 mV for PS, and �30 mV
for LPS1.
05554B
Soft Matter, 2011, xx, 1–15 | 11
1
5
10
15
20
25
30
35
40
45
50
55
1
5
10
15
20
25
30
35
40
45
50
55
values of the LPS1 deposited on PS were 5 nm and 9 nm based on
LPS1 vs. APTES and LPS1 vs. PS force–distance profiles,
respectively, and the s difference might be due to the presence of
the nanobubbles on the hydrophobic PS substrate which makes
the fitting deviate from the brush model. An average distance s�5 nm between the ‘‘grafting’’ sites of LPS1 indicates that the
coated layer of lipopolysaccharides with long hydrophilic O-
antigen chains behaves similarly to a dense brush layer in water.
The double-layer interaction energy for the interactions
between two planar surfaces of different materials in a 1 : 1
electrolyte (e.g., NaCl) can be approximated by the ‘‘Hogg-
Healy-Fuerstenau’’ (HHF) equation (eqn (2)). Thus the DLVO
interaction forces, including an electrostatic double layer inter-
action (through the Derjaguin approximation) and van der
Waals interactions for two curved surfaces, are given by eqn
(3),13,61
WDLðDÞ ¼ 303ke�kD
�j21e
�kD þ j22e
�kD � 2j1j2
e�2kD � 1
�(2)
F
R¼ 2p303ke
�kD�j2
1e�kD þ j2
2e�kD � 2j1j2
e�2kD � 1
� � A123
6D2(3)
where D is the separation distance, j1 and j2 are the surface
potentials, R is the surface radius, k is the inverse Debye length,
30 and 3 are the permittivity of a vacuum and the relative
dielectric permittivity of water, respectively, and A123 is the
Hamaker constant for two surfaces 1 and 3 interacting in
medium 2. The Debye length was 1 nm in 0.1 M NaCl and the
electrical double layer interactions were in the short-range.22
DLVO forces become significant only when the two surfaces are
brought very close together, a situation shown in Fig. 11 and
based on eqn (3). The Hamaker constant A123 is given by
A123zð ffiffiffiffiffiffiffiffiA11
p � ffiffiffiffiffiffiffiffiA22
p Þð ffiffiffiffiffiffiffiffiA33
p � ffiffiffiffiffiffiffiffiA22
p Þ,62 where A11, A22and A33
are the Hamaker constants for LPS1, water, and substrates (PS
or APTES), respectively, in vacuum, and A11 z (5–7) � 10�20 J,
A22 ¼ 3.7 � 10�20 J, and A33 z (5–7) � 10�20 J, which gives A123
z (3–4) � 10�21J. In high salt concentrations the surface
potentials used in eqn (3) were approximated by measured zeta
potentials: 30 mV for APTES, �18 mV for PS, and �30 mV for
LPS1,8,9 where the zeta potential of LPS1 was approximated by
the zeta potential of JM109.8,9 Overall, the theoretical steric force
curve fits reasonably well with the experimental approaching
force–distance profile. The electrostatic double layer interaction
and van der Waals interactions can take effect in the close
separation distance, which is not obviously shown in the exper-
imental approaching profile. Thus the repulsion forces measured
are mainly due to the steric effects at large separation, while the
adhesion is normally detected during the retracting process.26 It
should be noted that when the separation distance was reduced
to below 10 nm, deviation of the experimental data from the
model predictions was observed in Fig. 11. This deviation may be
attributed to the presence of other forces, e.g., hydration forces,
hydrophobic interaction and hydrogen bonding, at short sepa-
ration distances.
Other mechanisms. Surface interactions between the LPS layer
and the APTES surface were time-dependent and increased with
contact time as shown in Fig. 8 and 9. The increase in adhesion
was possibly due to rearrangement of the local LPS molecules in
ART � C1SM
12 | Soft Matter, 2011, xx, 1–15
contact with the APTES surface, resulting in more interfacial
adhesive ‘‘bonds’’ (electrostatic adhesion, hydrogen bonds, van
der Waals adhesion, etc.) with time.
Adhesion of JM109 to APTES was slightly higher than that of
K12 as shown in Fig. 10, while adhesion of LPS1 with APTES
was lower than that of LPS2 from the SFA measurement (Fig. 7
and 8). These results suggest that LPS was not the only
component contributing to bacterial initial adhesion. Extracel-
lular polymeric substances (EPS), membrane-bound proteins,
and flagella, may contribute to adhesion. Previous research
found that nanofibers on a bacterial cell surface can contribute to
the adhesion.2,63 The higher adhesion of JM109 compared with
K12 on APTES may be due to flagella on the JM109 surface
(shown in the SEM image in Fig. 6).
4.2 Molecular interactions of LPS1 and LPS2
The molecular structure differences between LPS1 and LPS2 are
shown in Fig. 1. Both types of LPS have saccharide sections,
which are easily hydrated in aqueous solutions. These hydrated
saccharide segments contribute to the repulsive steric force and
may also shield the surface charges of the deposited LPS layer
leading to hydration force. The major structural difference
between the two LPS is the long hydrated neutral O-antigen
chain on LPS1 which shields the negative charges on the poly-
saccharides. Electrostatic interactions between LPS (or bacteria)
and substrate surfaces decrease as the length of the neutral O-
antigen increases. The presence of long O-antigen chains in LPS
can reduce the adhesive capability of bacteria to substrates
because the affinity of hydrophilic O-antigen chains to water and
the steric entropic barrier of LPS chains on the bacterial surface
increase the energy of the adsorption process. These factors can
explain our SFA results. Adhesion to APTES was stronger for
LPS2 than for LPS1 because of the stronger electrostatic
attractions between APTES and LPS2. On the negatively
charged PS surface, repulsion forces were slightly stronger for
LPS2 than that for LPS1, this might be due to the more exposure
of negative charges on LPS2 in addition to the nanobubble
effects on the PS substrate. Mica is nearly neutral in 0.1 M NaCl,
which leads to weak electrostatic interactions between mica and
LPS, thus no obvious adhesion force difference was observed
between LPS1 and LPS2.
In terms of bacteria, LPS with an O-antigen also lead to less
exposure of other components (e.g., EPS and membrane-bound
proteins) on bacterial surface. Although the interaction forces
were almost the same for the two kinds of LPS against mica, the
bacterial adhesion efficiency is higher for K12 than JM109 on
mica. This observation can be explained by the presence of other
components such as EPS and membrane-bound proteins, which
may play more significant roles in bacteria with shorter LPS
chains. LPS plus O-antigen can lead to less exposure of other
components on bacterial surfaces than LPS alone. Previous
studies showed that the exposure degree of surface proteins
depends on LPS composition, and decreases with longer LPS
chains.10,64 SEM imaging showed that K12 has more exposed
‘‘dark’’ features or void spaces between LPS patches, which
would likely lead to more exposure of other surface components,
such as outer membrane proteins.42,43 In addition, the presence of
flagella on JM109 surfaces may impact JM109 adhesion and lead
05554B
This journal is ª The Royal Society of Chemistry 2011
1
5
10
15
20
25
30
35
40
45
50
55
1
5
10
to the higher adhesion capacity of JM109 compared with K12 on
APTES surfaces.
4.3 Techniques for bacterial adhesion studies
Molecular interaction mechanisms of bacterial initial adhesion
are affected by many factors, including substrate properties,
EPS, LPS, and solution chemistry. Macroscopic adhesion tech-
niques provide qualitative evaluation of bacterial initial adhe-
sion. Force probe techniques such as AFM and SFA can
measure intermolecular interactions during bacterial initial
adhesion. Although the SFA has been widely applied to inves-
tigate molecular interactions in bilayers, membranes and
proteins, few studies have addressed bacterial adhesion and
biofilm formation using this technique. SFA can provide precise
distance information in situ and in real time during the force
measurement. Surface-surface interactions measured by an SFA
can be compared between artificial and natural systems, e.g.,
a bacterial surface interacting with a substrate can be modeled by
SFA measurements of PS-supported LPS adherence to the
substrate. Our present study of LPS adhesion to several
substrates suggests that macroscopic and microscopic adhesion
characterization techniques can be well combined with molecular
and nanoscale force probe techniques to elucidate the contribu-
tion of various surface components and environmental factors to
bacterial adhesion.
5. Conclusions
Molecular and surface interactions between two model lipo-
polysaccharides (LPS1 and LPS2) extracted from E. coli strains
JM109 and K12 and three different substrates (mica, PS, and
APTES) were measured using an SFA and a QCM-D. Due to
strong hydrophobic interactions between lipid A and PS, a layer
of LPS was successfully coated onto PS substrates forming
a model surface to mimic the LPS on bacterial surfaces. AFM,
QCM-D, and contact angle measurements confirmed the
adsorption of LPS to PS surfaces. LPS was shown to play an
important and positive role in bacterial initial adhesion. A PS-
supported LPS layer adhered strongly to APTES, weakly to
mica, and was repelled by a PS substrate. Electrostatic interac-
tions and steric effects contributed significantly to LPS and
bacterial adhesion to the substrates. Although LPS has been
shown to play a major role, the SFA force measurements
together with the macroscopic bacterial adhesion tests indicate
that components other than LPS contribute to bacterial
adhesion.
Acknowledgements
The authors thank Dr Ming Chen for supporting SEM charac-
terization. Q. Lu, J. Wang, A. Faghihnejad and H. Zeng
appreciate the support of an NSERC (Natural Sciences and
Engineering Research Council of Canada) Discovery Grant
Award and RTI Award.
References
1 J. Palmer, S. Flint and J. Brooks, J. Ind. Microbiol. Biotechnol., 2007,34, 577–588.
ART � C1SM
This journal is ª The Royal Society of Chemistry 2011
15
2 K. Hori and S. Matsumoto, Biochem. Eng. J., 2010, 48, 424–434.3 T. A. Camesano, Y. T. Liu and M. Datta, Adv. Water Resour., 2007,30, 1470–1491.
4 H. J. Busscher and A. H. Weerkamp, FEMS Microbiol. Lett., 1987,46, 165–173.
5 S. Tsuneda, H. Aikawa, H. Hayashi, A. Yuasa and A. Hirata, FEMSMicrobiol. Lett., 2003, 223, 287–292.
6 M. Caroff and D. Karibian, Carbohydr. Res., 2003, 338, 2431–2447.7 L. S. Dorobantu and M. R. Gray, Scanning, 2010, 32, 74–96.8 B. K. Li and B. E. Logan, Colloids Surf., B, 2004, 36, 81–90.9 G. A. Burks, S. B. Velegol, E. Paramonova, B. E. Lindenmuth,J. D. Feick and B. E. Logan, Langmuir, 2003, 19, 2366–2371.
10 S. L. Walker, J. A. Redman and M. Elimelech, Langmuir, 2004, 20,7736–7746.
11 M. B. Salerno, B. E. Logan and D. Velegol, Langmuir, 2004, 20,10625–10629.
12 N. I. Abu-Lail and T. A. Camesano, Environ. Sci. Technol., 2003, 37,2173–2183.
13 S. B. Velegol and B. E. Logan, Langmuir, 2002, 18, 5256–5262.
14 J. Strauss, N. A. Burnham and T. A. Camesano, J. Mol. Recognit.,2009, 22, 347–355.15 J. Strauss, A. Kadilak, C. Cronin, C. M. Mello and T. A. Camesano,
Colloids Surf., B, 2010, 75, 156–164.16 Y. L. Ong, A. Razatos, G. Georgiou and M. M. Sharma, Langmuir,
1999, 15, 2719–2725.17 A. Razatos, Y. L. Ong, M. M. Sharma and G. Georgiou, Proc. Natl.
Acad. Sci. U. S. A., 1998, 95, 11059–11064.18 D. Leckband, Nature, 1995, 376, 617–618.19 J. Israelachvili, Y. Min, M. Akbulut, A. Alig, G. Carver, W. Greene,
K. Kristiansen, E. Meyer, N. Pesika, K. Rosenberg and H. Zeng,Rep.Prog. Phys., 2010, 73.
20 H. Zeng, Y. Tian, T. H. Anderson, M. Tirrell and J. N. Israelachvili,Langmuir, 2008, 24, 1173–1182.
21 Z. Liu, Z. Li, H. Zhou, G. Wei, Y. Song and L. Wang, J. Microsc.,2005, 218, 233–239.
22 J. N. Israelachvili, Intermolecular and surface forces, 2nd edn,Academic Press Ltd., London, 1992.
23 E.-S. Kim, Y. Liu and M. G. El-Din, J. Hazard. Mater., 2011,submitted.
24 R. A. Vanwagenen and J. D. Andrade, J. Colloid Interface Sci., 1980,76, 305–314.
25 M. D. Afonso, G. Hagmeyer and R. Gimbel, Sep. Purif. Technol.,2001, 22–23, 529–541.
26 H. Zeng, D. S. Hwang, J. N. Israelachvili and J. H. Waite, Proc. Natl.Acad. Sci. U. S. A., 2010, 107, 12850–12853.
27 J. M. Peula-Garcia, J. A. Molina-Bolivar, J. Velasco, A. Rojas andF. Galisteo-Gonzalez, J. Colloid Interface Sci., 2002, 245, 230–236.
28 C. C. Dupont-Gillain, Y. Adriaensen, S. Derclaye and P. G. Rouxhet,Langmuir, 2000, 16, 8194–8200.
29 B. J. Kirby and E. F. Hasselbrink, Electrophoresis, 2004, 25, 203–213.30 J. C. Ma and D. A. Dougherty, Chem. Rev., 1997, 97, 1303–1324.31 V. Tandon, S. K. Bhagavatula, W. C. Nelson and B. J. Kirby,
Electrophoresis, 2008, 29, 1092–1101.32 R. M. Pashley, Clays Clay Miner., 1985, 33, 193–199.33 J. S. Lyons, D. N. Furlong and T. W. Healy, Aust. J. Chem., 1981, 34,
1177–1187.34 Z. Adamczyk, M. Zembala, P. Warszynski and B. Jachimska,
Langmuir, 2004, 20, 10517–10525.35 M. Zembala and Z. Adamczyk, Langmuir, 2000, 16, 1593–1601.36 Y. C. Lin, B. Y. Yu, W. C. Lin, Y. Y. Chen and J. J. Shyue, Chem.
Mater., 2008, 20, 6606–6610.37 E. Casero, L. Vazquez, A. M. Parra-Alfambra and E. Lorenzo,
Analyst, 2010, 135, 1878–1903.38 K. A. Marx, Biomacromolecules, 2003, 4, 1099–1120.39 M. T. Madigan, J. M. Martinko and J. Parker, Brock Biology of
Microorganisms, 9th edn, Prentice-Hall, New Jersey, 1997.40 X. Li and B. E. Logan, Langmuir, 2004, 20, 8817–8822.41 S. E. Harding, in Polysaccharides 1: Structure, Characterization and
Use, Editon edn, 2005, vol. 186, pp. 211–254.42 L. P. Kotra, D. Golemi, N. A. Amro, G. Y. Liu and S. Mobashery, J.
Am. Chem. Soc., 1999, 121, 8707–8711.43 N. A. Amro, L. P. Kotra, K. Wadu-Mesthrige, A. Bulychev,
S. Mobashery and G. Y. Liu, Langmuir, 2000, 16, 2789–2796.44 D. Greif, D. Wesner, J. Regtmeier and D. Anselmetti,
Ultramicroscopy, 2010, 110, 1290–1296.
05554B
Soft Matter, 2011, xx, 1–15 | 13
20
25
30
35
40
45
50
55

1
5
10
15
20
25
30
35
40
45
50
55
1
45 S. Schadler, C. Burkhardt and A. Kappler, Geomicrobiol. J., 2008, 25,228–239.55 R. Steitz, T. Gutberlet, T. Hauss, B. Klosgen, R. Krastev,S. Schemmel, A. C. Simonsen and G. H. Findenegg, Langmuir,
46 V. Vadillo-Rodriguez, T. J. Beveridge and J. R. Dutcher, J. Bacteriol., 2003, 19, 2409–2418.
5
10
2008, 190, 4225–4232.47 V. Vadillo-Rodriguez, S. R. Schooling and J. R. Dutcher, J.
Bacteriol., 2009, 191, 5518–5525.48 J. Adler and B. Templeto, J. Gen. Microbiol., 1967, 46, 175.49 J. F. Jones, J. D. Feick, D. Imoudu, N. Chukwumah, M. Vigeant and
D. Velegol, Appl. Environ. Microbiol., 2003, 69, 6515–6519.50 T. A. Camesano and B. E. Logan, Environ. Sci. Technol., 2000, 34,
3354–3362.51 E. S. Taylor and S. K. Lower,Appl. Environ.Microbiol., 2008, 74, 309–
56 E. Kokkoli and C. F. Zukoski, J. Colloid Interface Sci., 2000, 230,176–180.
57 L. Meagher and R. M. Pashley, Langmuir, 1995, 11, 4019–4024.58 J. L. Parker and P. M. Claesson, Langmuir, 1994, 10, 635–639.59 Y. H. Tsao, D. F. Evans and H. Wennerstrom, Langmuir, 1993, 9,
779–785.60 T. L. Kuhl, D. E. Leckband, D. D. Lasic and J. N. Israelachvili,
Biophys. J., 1994, 66, 1479–1488.61 T. H. Anderson, Y. J. Min, K. L. Weirich, H. Zeng, D. Fygenson and
J. N. Israelachvili, Langmuir, 2009, 25, 6997–7005.62 H. Zeng, Y. Tian, B. Zhao, M. Tirrell and J. Israelachvili,
311.52 E. E. Meyer, K. J. Rosenberg and J. Israelachvili, Proc. Natl. Acad.
03, 15739–15746.53 muir,54 atte
Macromolecules, 2007, 40, 8409–8422.mbar ne, Envi
64 B. A. Jucker, H. Harms, S. J. Hug and A. J. B. Zehnder, Colloids
14
Sci. U. S. A., 2006, 1W. A. Ducker, LangV. S. J. Craig, Soft M
| Soft Matter, 2011, xx,
2009, 25, 8907–8910.r, 2011, 7, 40–48.
63 C. Prigent-Coand C. Dorel
, 9, 3
ART � C1SM05554B
1–15 This jou
et, G. Prensier, T. T. Le Thi, O. Vidal, P. Lejeuron. Microbiol., 2000, 2, 450–464.
31–343. 15
Surf., B, 199720
25
rnal is ª The Royal Society of Chemistry 2011
30
35
40
45
50
55
Authors Queries
Journal: SM
Paper: c1sm05554b
Title: Understanding the molecular interactions of lipopolysaccharides during E. coli initial adhesion with a surfaceforces apparatus
Editor’s queries are marked like this... 1 , and for your convenience line numbers are inserted like this... 5
Query
ReferenceQuery Remarks
1
[INFO-1] For your information: You can cite this
paper before the page numbers are assigned with:(authors), Soft Matter, DOI: 10.1039/c1sm05554b.
2Ref. 19: Please provide the following details: pagenumber(s).
3
Ref. 23: Can this reference be updated yet? Pleasesupply details to allow readers to access the
reference (for references where page numbers are
not yet known, please supply the DOI).
ART � C1SM05554B
This journal is ª The Royal Society of Chemistry 2011 Soft Matter, 2011, xx, 1–15 | 15
1
5
10
15
20
25
30
35
40
45
50
55
1
5
10
15
20
25
30
35
40
45
50
55