Embed Size (px)
Citation preview
Health Care Coverage in America:Understanding the Issuesand Proposed Solutions
Alliance for Health ReformUpdated March 2008
This publication is designed to help you become an active participant indiscussions nationally and in your state about how we can secure health carecoverage—private or public—for more Americans and help insured Americanskeep the coverage they have.
Health coverage for children was at the top of the health care agenda on CapitolHill and elsewhere in 2007. While a longer-term reauthorization failed, currentfunding levels for the successful State Children’s Health Insurance Program wereextended until March 2009.
The following guide shows how a lack of health coverage has real consequences fora person’s health and financial status. You will learn more about how people gethealth coverage, why so many don’t have it and who these people are.
Finally, you will learn about several approaches to reducing the ranks of theuninsured and how to make sense of these proposals.
3 INTRODUCTION
4 WHY THE STRONG INTEREST IN THE UNINSURED?
4 WHY IS HEALTH COVERAGE SO IMPORTANT?
6 WHO IS UNINSURED?
7 HOW DO AMERICANS GET COVERED?
13 APPROACHES TO COVERING THE UNINSURED
17 QUESTIONS TO ASK ABOUT ANY HEALTH COVERAGE PROPOSAL
17 GLOSSARY
17 SOME SPECIFIC PROPOSALS
19 END NOTES
1010 Wisconsin Avenue N.W. • Suite 800 • Washington, DC 20007 • 202.572.2928 • [email protected]
www.CoverTheUninsured.org
Prepared for Cover the Uninsured by the Alliance for Health Reform, Washington, DC with assistance from the Employee BenefitResearch Institute.Alliance for Health Reform, www.allhealth.orgEmployee Benefit Research Institute, www.ebri.org
Health Care Coverage in America: Understanding the Issues and Proposed Solutions 3
IntroductionLike other things we value, health insurance is appreciated most when wedon’t have it.
That’s the situation faced by the nearly47 million people in the United Stateswho do not have health care coverage.1
They come from every age group andevery income level. And 8.7 million ofthem are children.
The United States has an incrediblycomplex and convoluted system forfinancing and delivering health care.Americans get coverage through theirjobs, the federal government, themilitary, state programs or on theirown. At the same time, they pay forcoverage through their employers,through state and federal taxes, and outof their own pocket.
Several times since the 1940s,Americans have engaged in nationwidediscussions about how to providehealth insurance to those who don’thave it and how to help people keeptheir health insurance.
We are in the midst of another suchdiscussion now. Government officials,political candidates, employers, unions,community leaders and ordinarycitizens are saying the nation’s healthcare system should be improved and itsbenefits should be made more widelyavailable. The search goes on for waysto cover the tens of millions ofAmericans who fall through thesystem’s cracks each year.
Many say that we can do better andrefer to the following facts:
� About one in six people in the United States—nearly 47 million—lacked insurance for all of 2006,according to the U.S. CensusBureau.2 That’s an increase of 8.5million since 2000.3
� In 2006, 8.7 million children were
uninsured, up from 8 million in2005.4 This was the third year in arow that the number of uninsuredchildren had risen.
� The percentage of the U.S.population without health coveragehas also grown, up from 13.7 percentin 2000 to 15.8 percent in 2006.5
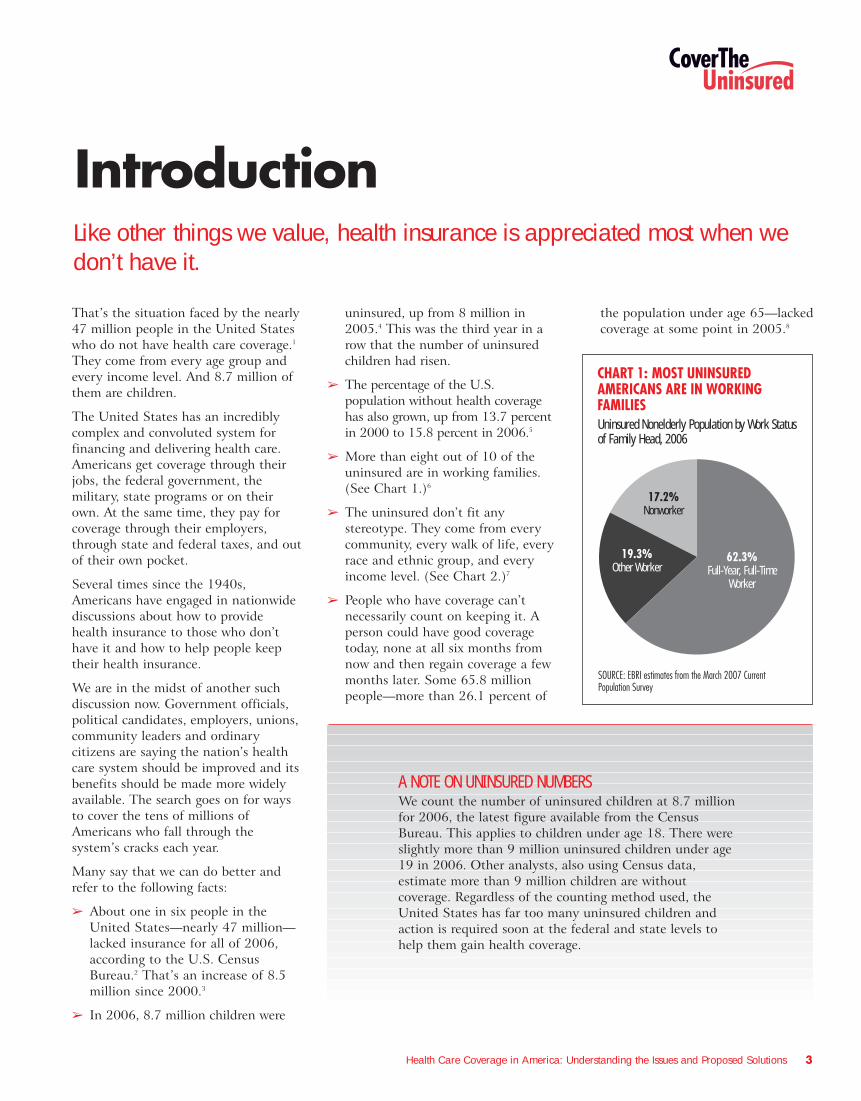
� More than eight out of 10 of theuninsured are in working families.(See Chart 1.)6
� The uninsured don’t fit anystereotype. They come from everycommunity, every walk of life, everyrace and ethnic group, and everyincome level. (See Chart 2.)7
� People who have coverage can’tnecessarily count on keeping it. Aperson could have good coveragetoday, none at all six months fromnow and then regain coverage a fewmonths later. Some 65.8 millionpeople—more than 26.1 percent of
the population under age 65—lackedcoverage at some point in 2005.8
CHART 1: MOST UNINSURED AMERICANS ARE IN WORKING FAMILIESUninsured Nonelderly Population by Work Status of Family Head, 2006
SOURCE: EBRI estimates from the March 2007 Current Population Survey
19.3%Other Worker
17.2%Nonworker
62.3%Full-Year, Full-Time
Worker
A NOTE ON UNINSURED NUMBERSWe count the number of uninsured children at 8.7 millionfor 2006, the latest figure available from the CensusBureau. This applies to children under age 18. There wereslightly more than 9 million uninsured children under age19 in 2006. Other analysts, also using Census data,estimate more than 9 million children are withoutcoverage. Regardless of the counting method used, theUnited States has far too many uninsured children andaction is required soon at the federal and state levels tohelp them gain health coverage.
Health Care Coverage in America: Understanding the Issues and Proposed Solutions 4
Why the Strong Interest in the Uninsured?There are several reasons for the stronginterest in making sure all Americanshave health care coverage. For one,individuals and employers are growingincreasingly concerned about the risingcost of health care and health insurance.Employees in particular are justifiablyconcerned that as health coverage getsmore expensive, they may not be able toafford their share of the cost of coverageoffered on the job—if they are offeredcoverage at all. They know that if theylose their job, they might also loseaccess to affordable health coverage andhealth care—a prospect discussed inmore detail later.
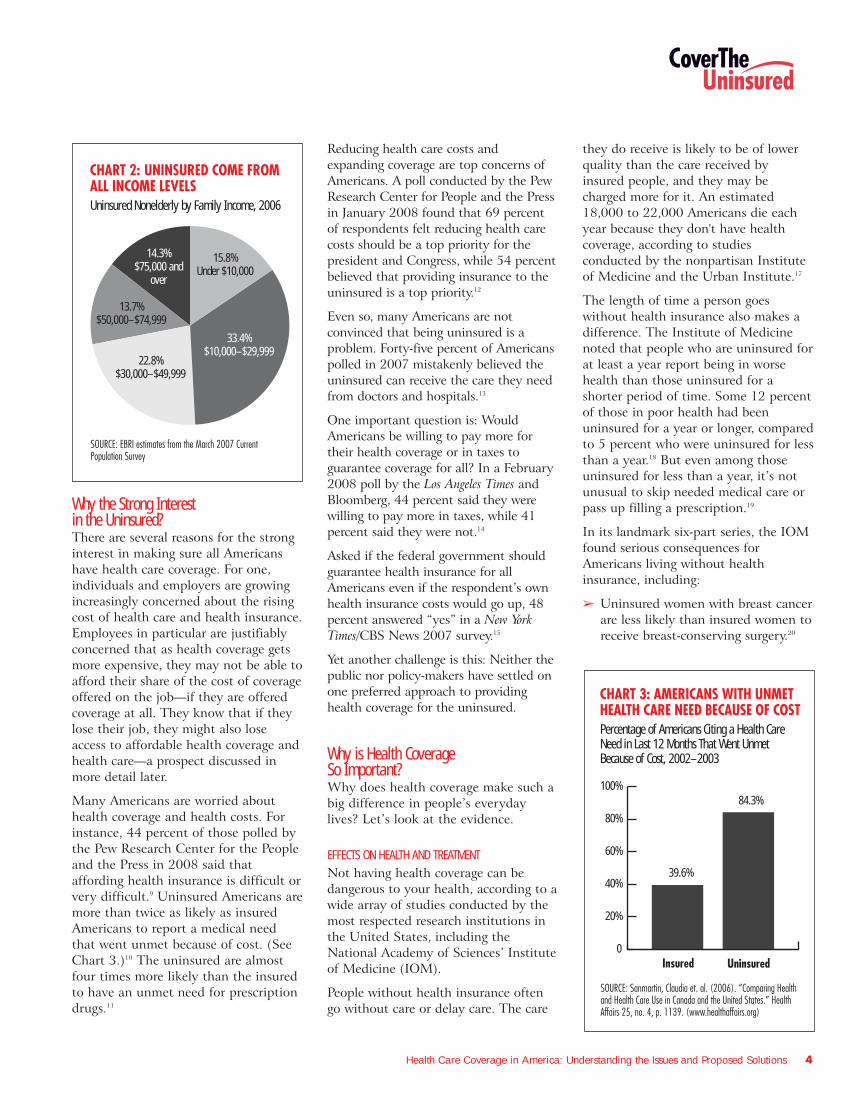
Many Americans are worried abouthealth coverage and health costs. Forinstance, 44 percent of those polled bythe Pew Research Center for the Peopleand the Press in 2008 said thataffording health insurance is difficult orvery difficult.9 Uninsured Americans aremore than twice as likely as insuredAmericans to report a medical needthat went unmet because of cost. (SeeChart 3.)10 The uninsured are almostfour times more likely than the insuredto have an unmet need for prescriptiondrugs.11
Reducing health care costs andexpanding coverage are top concerns ofAmericans. A poll conducted by the PewResearch Center for People and the Pressin January 2008 found that 69 percentof respondents felt reducing health carecosts should be a top priority for thepresident and Congress, while 54 percentbelieved that providing insurance to theuninsured is a top priority.12
Even so, many Americans are notconvinced that being uninsured is aproblem. Forty-five percent of Americanspolled in 2007 mistakenly believed theuninsured can receive the care they needfrom doctors and hospitals.13
One important question is: WouldAmericans be willing to pay more fortheir health coverage or in taxes toguarantee coverage for all? In a February2008 poll by the Los Angeles Times andBloomberg, 44 percent said they werewilling to pay more in taxes, while 41percent said they were not.14
Asked if the federal government shouldguarantee health insurance for allAmericans even if the respondent’s ownhealth insurance costs would go up, 48percent answered “yes” in a New YorkTimes/CBS News 2007 survey.15
Yet another challenge is this: Neither thepublic nor policy-makers have settled onone preferred approach to providinghealth coverage for the uninsured.
Why is Health Coverage So Important?Why does health coverage make such abig difference in people’s everydaylives? Let’s look at the evidence.
EFFECTS ON HEALTH AND TREATMENTNot having health coverage can bedangerous to your health, according to awide array of studies conducted by themost respected research institutions inthe United States, including theNational Academy of Sciences’ Instituteof Medicine (IOM).
People without health insurance oftengo without care or delay care. The care
they do receive is likely to be of lowerquality than the care received byinsured people, and they may becharged more for it. An estimated18,000 to 22,000 Americans die eachyear because they don't have healthcoverage, according to studiesconducted by the nonpartisan Instituteof Medicine and the Urban Institute.17
The length of time a person goeswithout health insurance also makes adifference. The Institute of Medicinenoted that people who are uninsured forat least a year report being in worsehealth than those uninsured for ashorter period of time. Some 12 percentof those in poor health had beenuninsured for a year or longer, comparedto 5 percent who were uninsured for lessthan a year.18 But even among thoseuninsured for less than a year, it’s notunusual to skip needed medical care orpass up filling a prescription.19
In its landmark six-part series, the IOMfound serious consequences forAmericans living without healthinsurance, including:
� Uninsured women with breast cancerare less likely than insured women toreceive breast-conserving surgery.20
CHART 3: AMERICANS WITH UNMET HEALTH CARE NEED BECAUSE OF COSTPercentage of Americans Citing a Health Care Need in Last 12 Months That Went Unmet Because of Cost, 2002–2003
SOURCE: Sanmartin, Claudia et. al. (2006). “Comparing Health and Health Care Use in Canada and the United States.” Health Affairs 25, no. 4, p. 1139. (www.healthaffairs.org)
0
20%
40%
60%
80%
100%84.3%
39.6%
UninsuredInsured
CHART 2: UNINSURED COME FROM ALL INCOME LEVELSUninsured Nonelderly by Family Income, 2006
SOURCE: EBRI estimates from the March 2007 Current Population Survey
14.3%$75,000 and
over
13.7%$50,000–$74,999
22.8%$30,000–$49,999
33.4%$10,000–$29,999
15.8%Under $10,000
Health Care Coverage in America: Understanding the Issues and Proposed Solutions 5
� Hospitalized patients without healthinsurance receive fewer neededservices and lower-quality care andhave a greater risk of dying in thehospital or shortly after dischargethan patients with insurance.21
� The uninsured are less likely toreceive care even when they haveserious symptoms.22
� Uninsured trauma victims are lesslikely to be admitted to the hospitalor receive the full range of neededservices. Uninsured victims withtrauma due to an auto crash are 37 percent more likely to die of their injuries.23
� Uninsured adults with HIV wait toreceive new, highly effective drugtherapies an average of four monthslonger than patients who haveinsurance. Among adults infectedwith HIV, having insurance reducesmortality by 71 percent to 85percent over a six-month period.24
The Institute of Medicine concluded:“Health insurance is associated withbetter health outcomes for adults andwith their receipt of appropriate careacross a range of preventive, chronicand acute care services. Adults withouthealth insurance coverage experiencegreater declines in health status anddie sooner than do adults withcontinuous coverage.”25
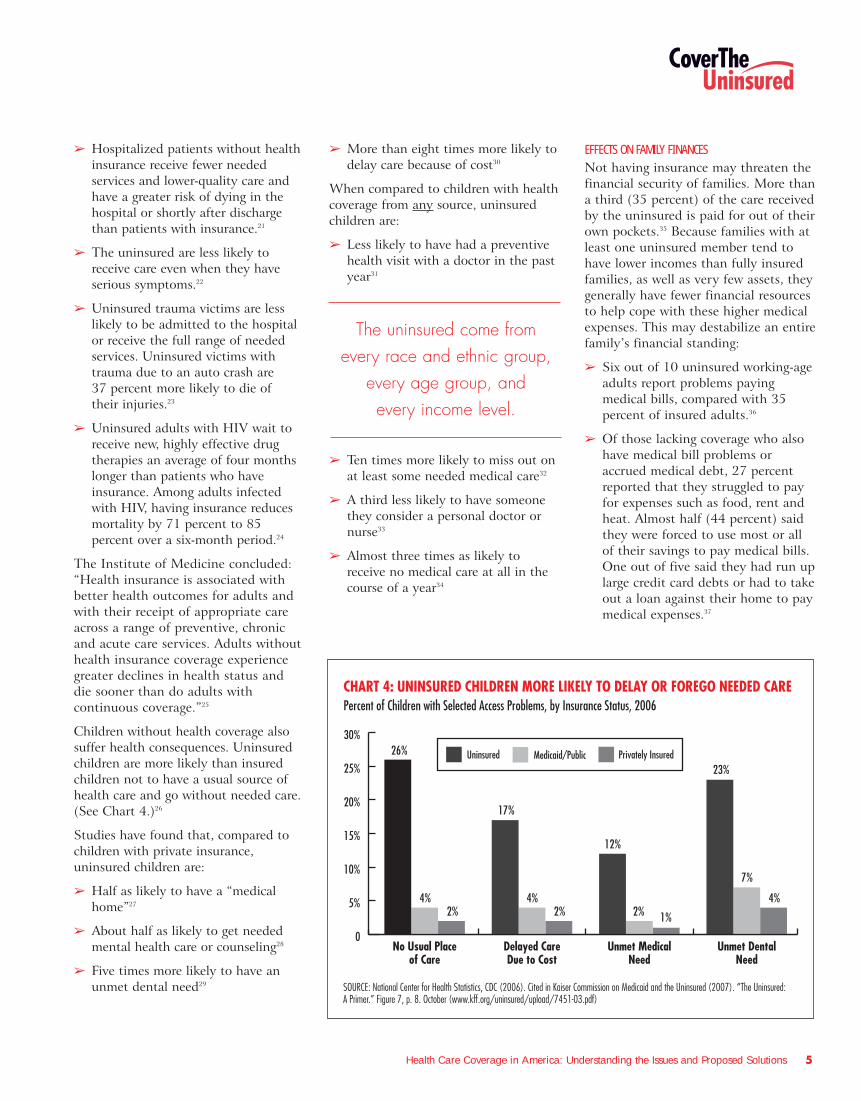
Children without health coverage alsosuffer health consequences. Uninsuredchildren are more likely than insuredchildren not to have a usual source ofhealth care and go without needed care.(See Chart 4.)26
Studies have found that, compared tochildren with private insurance,uninsured children are:
� Half as likely to have a “medicalhome”27
� About half as likely to get neededmental health care or counseling28
� Five times more likely to have anunmet dental need29
� More than eight times more likely todelay care because of cost30
When compared to children with healthcoverage from any source, uninsuredchildren are:
� Less likely to have had a preventivehealth visit with a doctor in the pastyear31
� Ten times more likely to miss out onat least some needed medical care32
� A third less likely to have someonethey consider a personal doctor ornurse33
� Almost three times as likely toreceive no medical care at all in thecourse of a year34
EFFECTS ON FAMILY FINANCESNot having insurance may threaten thefinancial security of families. More thana third (35 percent) of the care receivedby the uninsured is paid for out of theirown pockets.35 Because families with atleast one uninsured member tend tohave lower incomes than fully insuredfamilies, as well as very few assets, theygenerally have fewer financial resourcesto help cope with these higher medicalexpenses. This may destabilize an entirefamily’s financial standing:
� Six out of 10 uninsured working-ageadults report problems payingmedical bills, compared with 35percent of insured adults.36
� Of those lacking coverage who alsohave medical bill problems oraccrued medical debt, 27 percentreported that they struggled to payfor expenses such as food, rent andheat. Almost half (44 percent) saidthey were forced to use most or allof their savings to pay medical bills.One out of five said they had run uplarge credit card debts or had to takeout a loan against their home to paymedical expenses.37
CHART 4: UNINSURED CHILDREN MORE LIKELY TO DELAY OR FOREGO NEEDED CAREPercent of Children with Selected Access Problems, by Insurance Status, 2006
SOURCE: National Center for Health Statistics, CDC (2006). Cited in Kaiser Commission on Medicaid and the Uninsured (2007). “The Uninsured: A Primer.” Figure 7, p. 8. October (www.kff.org/uninsured/upload/7451-03.pdf)
26%
0
5%
10%
15%
20%
25%
30%
Unmet DentalNeed
Unmet MedicalNeed
Delayed CareDue to Cost
No Usual Placeof Care
4%2%
17%
4%2%
12%
2% 1%
23%
7%
4%
Privately InsuredMedicaid/PublicUninsured
The uninsured come fromevery race and ethnic group,
every age group, andevery income level.
Health Care Coverage in America: Understanding the Issues and Proposed Solutions 6
Who is Uninsured?The number of people in the UnitedStates who lack health insurance hasbeen rising slowly over time. In 2006,nearly 47 million people in the UnitedStates lacked health coverage, including8.7 million children. Adults areuninsured more frequently thanchildren: One in five adults age 18 to64 was uninsured in 2006. Bycomparison, one in nine children waswithout coverage that year.38
The uninsured come from every raceand ethnic group, every age group, and every income level. Compared tothe general population, however,people who lack health insurance areyounger, have lower incomes, and aremore likely to be a member of aminority group.39
Nonelderly adults who lack insuranceare also concentrated in certain states.According to the Kaiser FamilyFoundation, the largest percentages ofuninsured can be found in Texas (30percent) and Florida (27 percent), twoof the 20 states in which at least 20percent of the population between theages of 19 and 64 are uninsured.Another 14 states have uninsuredpopulations between 16 and 20percent. Only 17 states have uninsuredpopulations of 15 percent or less. Thelowest percentage can be found inMinnesota (11 percent).
A common misconception is that thosewho are uninsured are also out of thejob market. In fact, more than eight of10 of those who lack insurance are inworking families. (See Chart 1.)41
More than six of 10 were in familieswhere the household head worked fulltime all year.42 The majority ofuninsured workers (62 percent) are inservice occupations and wholesale andretail trade jobs, according to theEmployee Benefit Research Institute.43
The key point is this: Theoverwhelming majority of uninsuredAmericans are from families actively inthe labor force.
Americans living in households withannual incomes below $25,000 have ahigher incidence of uninsurance—24.9percent being uninsured in 2006compared to 15.8 percent of the totalpopulation.44 For 2008, the povertylevel is $21,200 for a family of four inevery state except Alaska and Hawaii.(See box, “What Does ‘Federal PovertyLevel’ Mean?”)45 According to theCensus Bureau, 19.3 percent ofchildren living below the poverty line in2005 were uninsured.46
There are also key differences ininsurance coverage among racial andethnic groups. Hispanics are far morelikely than any other ethnic group to beuninsured. In 2006, 34.1 percent ofHispanics were uninsured for the entireyear, compared to 20.5 percent ofblacks, 15.5 percent of Asian andPacific Islanders, and 10.8 percent ofnon-Hispanic whites.47
In addition, 22.1 percent of Hispanicchildren were uninsured in 2006,compared to 14.1 percent of black
children, 11.4 percent of AsianAmerican children, and 7.3 percent ofnon-Hispanic white children.48
The Hispanic community encountersdifficulties in securing coverage in partbecause so many members are recentimmigrants who earn modest incomes.In 2006, 66.6 percent of foreign-born,non-citizen Hispanics with less than 10years of U.S. residency were uninsured.Among Hispanics who are naturalizedcitizens and in the United States forthe same length of time, 39 percentlacked coverage.49
Like other uninsured Americans,uninsured Hispanics are often in low-wage service jobs that don’t offerhealth coverage. In addition, manylow-income new immigrants, evenwhen in the United States legally, arenot eligible for public programs such asMedicaid, although their children aresometimes eligible.
One often-overlooked aspect of theuninsured population is that while thenumber of uninsured is relatively stable
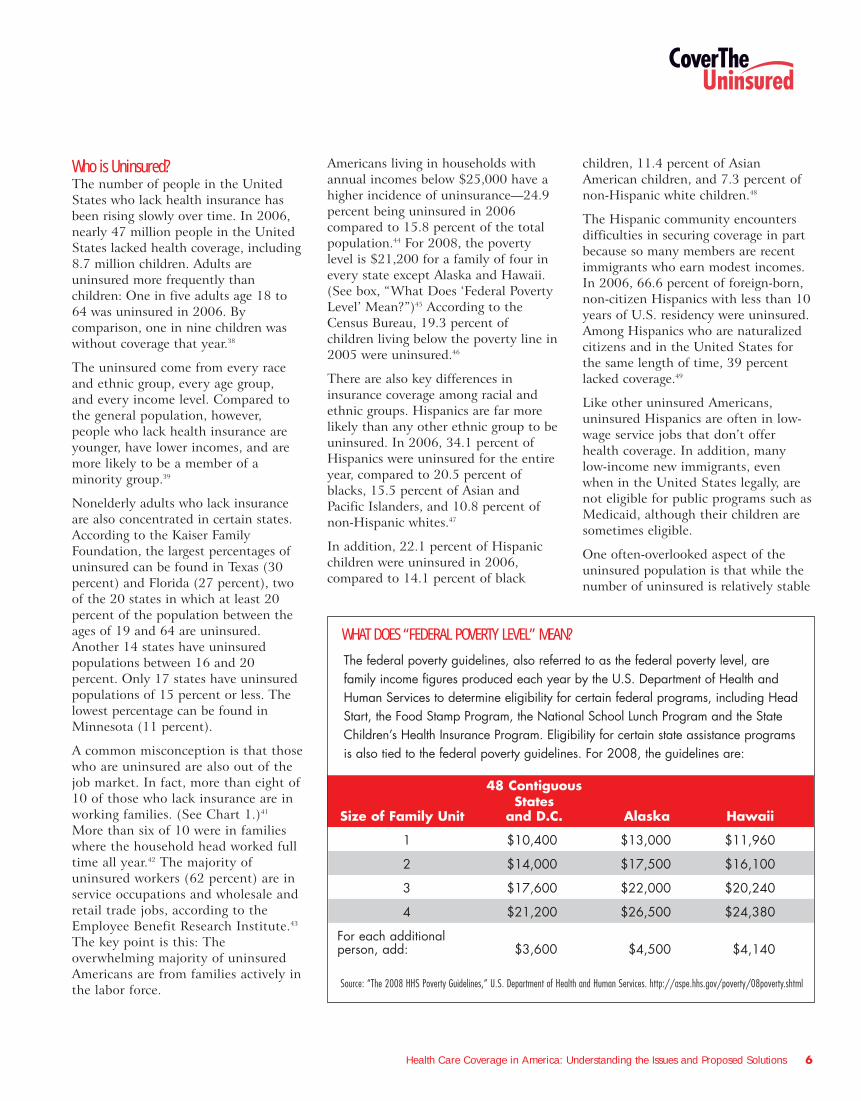
48 Contiguous States
Size of Family Unit and D.C. Alaska Hawaii
1 $10,400 $13,000 $11,960
2 $14,000 $17,500 $16,100
3 $17,600 $22,000 $20,240
4 $21,200 $26,500 $24,380
For each additional person, add: $3,600 $4,500 $4,140
Source: “The 2008 HHS Poverty Guidelines,” U.S. Department of Health and Human Services. http://aspe.hhs.gov/poverty/08poverty.shtml
WHAT DOES “FEDERAL POVERTY LEVEL” MEAN?
The federal poverty guidelines, also referred to as the federal poverty level, arefamily income figures produced each year by the U.S. Department of Health andHuman Services to determine eligibility for certain federal programs, including HeadStart, the Food Stamp Program, the National School Lunch Program and the StateChildren’s Health Insurance Program. Eligibility for certain state assistance programsis also tied to the federal poverty guidelines. For 2008, the guidelines are:
Health Care Coverage in America: Understanding the Issues and Proposed Solutions 7
from month to month, it is not thesame individuals who are uninsuredfrom month to month and year to year.Hundreds of thousands of Americanslose coverage over the course of a year,and similar numbers regain it afterlacking coverage for relatively shortperiods of time.
The dynamic nature of the uninsuredpopulation has implications for whatstrategies might be used to deal withthe problem. A Commonwealth Fundstudy found that if every person withpublic or private insurance at thebeginning of a given year retained itthrough the next 12 months, thenumber of uninsured, low-incomechildren would decline by nearly 40percent and the number of uninsuredadults would decline by more than 25 percent.50
Moreover, barriers prevent people fromjoining public or private insuranceplans. Such barriers include waitingperiods before a worker can sign up foran employer plan and complexenrollment and renewal procedures thatdiscourage people from applying forpublic insurance and keeping it oncethey get it.
How Do Americans Get Covered?EMPLOYER-SPONSORED COVERAGE
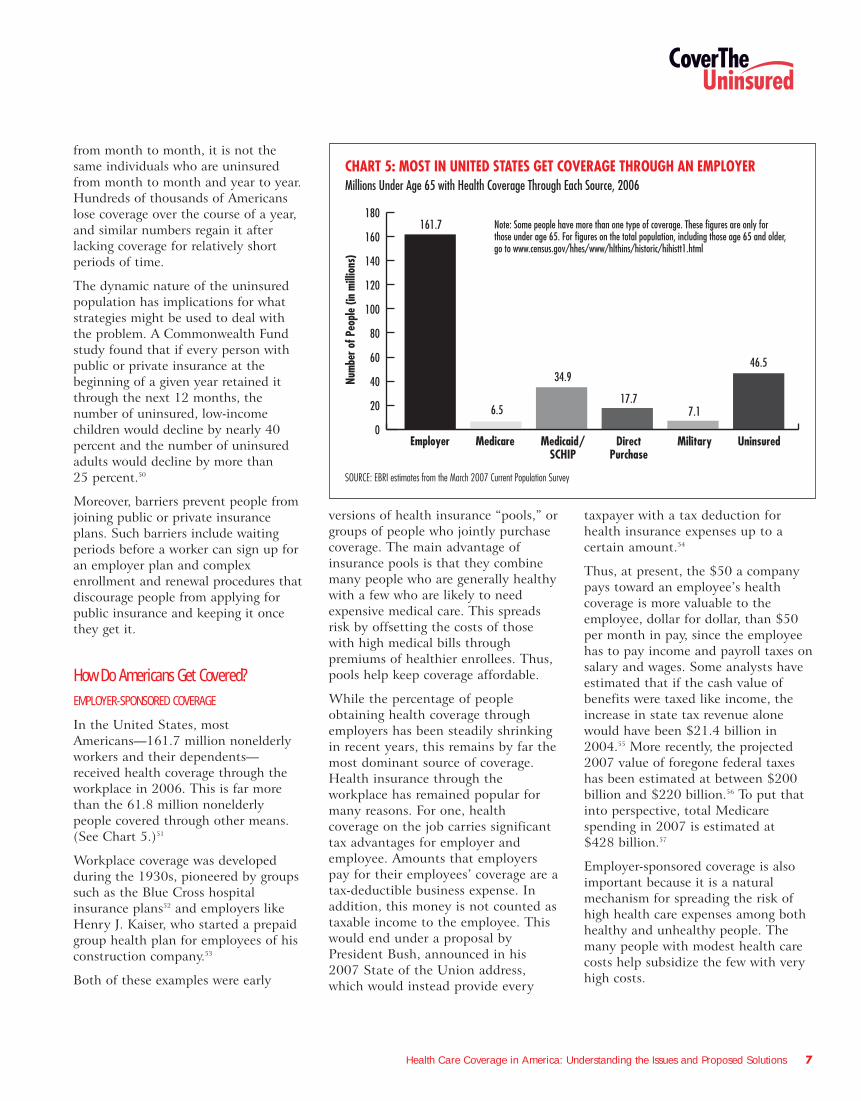
In the United States, mostAmericans—161.7 million nonelderlyworkers and their dependents—received health coverage through theworkplace in 2006. This is far morethan the 61.8 million nonelderlypeople covered through other means.(See Chart 5.)51
Workplace coverage was developedduring the 1930s, pioneered by groupssuch as the Blue Cross hospitalinsurance plans52 and employers likeHenry J. Kaiser, who started a prepaidgroup health plan for employees of hisconstruction company.53
Both of these examples were early
versions of health insurance “pools,” orgroups of people who jointly purchasecoverage. The main advantage ofinsurance pools is that they combinemany people who are generally healthywith a few who are likely to needexpensive medical care. This spreadsrisk by offsetting the costs of thosewith high medical bills throughpremiums of healthier enrollees. Thus,pools help keep coverage affordable.
While the percentage of peopleobtaining health coverage throughemployers has been steadily shrinkingin recent years, this remains by far themost dominant source of coverage.Health insurance through theworkplace has remained popular formany reasons. For one, healthcoverage on the job carries significanttax advantages for employer andemployee. Amounts that employerspay for their employees’ coverage are atax-deductible business expense. Inaddition, this money is not counted astaxable income to the employee. Thiswould end under a proposal byPresident Bush, announced in his2007 State of the Union address,which would instead provide every
taxpayer with a tax deduction forhealth insurance expenses up to acertain amount.54
Thus, at present, the $50 a companypays toward an employee’s healthcoverage is more valuable to theemployee, dollar for dollar, than $50per month in pay, since the employeehas to pay income and payroll taxes onsalary and wages. Some analysts haveestimated that if the cash value ofbenefits were taxed like income, theincrease in state tax revenue alonewould have been $21.4 billion in2004.55 More recently, the projected2007 value of foregone federal taxeshas been estimated at between $200billion and $220 billion.56 To put thatinto perspective, total Medicarespending in 2007 is estimated at $428 billion.57
Employer-sponsored coverage is alsoimportant because it is a naturalmechanism for spreading the risk ofhigh health care expenses among bothhealthy and unhealthy people. Themany people with modest health carecosts help subsidize the few with veryhigh costs.
CHART 5: MOST IN UNITED STATES GET COVERAGE THROUGH AN EMPLOYERMillions Under Age 65 with Health Coverage Through Each Source, 2006
SOURCE: EBRI estimates from the March 2007 Current Population Survey
161.7
34.9
6.517.7
7.1
46.5
0
20
40
60
80
100
120
140
160
180
UninsuredMilitaryDirectPurchase
Medicaid/SCHIP
MedicareEmployer
Num
ber o
f Peo
ple
(in m
illio
ns)
Note: Some people have more than one type of coverage. These figures are only for those under age 65. For figures on the total population, including those age 65 and older, go to www.census.gov/hhes/www/hlthins/historic/hihistt1.html
Health Care Coverage in America: Understanding the Issues and Proposed Solutions 8
EMPLOYER-SPONSORED COVERAGE HAS SOMEDOWNSIDES TOO
Despite its advantages, employer-sponsored health coverage has anumber of disadvantages:
� Millions of working Americans don’thave the opportunity to get it. In
2005, 20.1 percent of “wage andsalary” workers aged 18-64 workedfor an employer that did not offercoverage to any workers, and 17.9percent were not eligible for thehealth plan that was offered by theirown employer.58
� Even if employees are offeredcoverage on the job, they can’talways afford their portion of thepremiums. Almost three out of fouruninsured workers who chose not toparticipate in their employer’shealth plan in 2002 said the planwas too costly.59
� Losing a job or quitting voluntarilycan mean losing affordablecoverage—not only for the workerbut also for their entire family.
� A person’s link to employer-sponsored coverage can also be cutby a change from full-time to part-time work or self-employment,retirement or divorce.
� Most employers offer a smallnumber of health insurance plans foremployees to choose from, andsometimes only one.
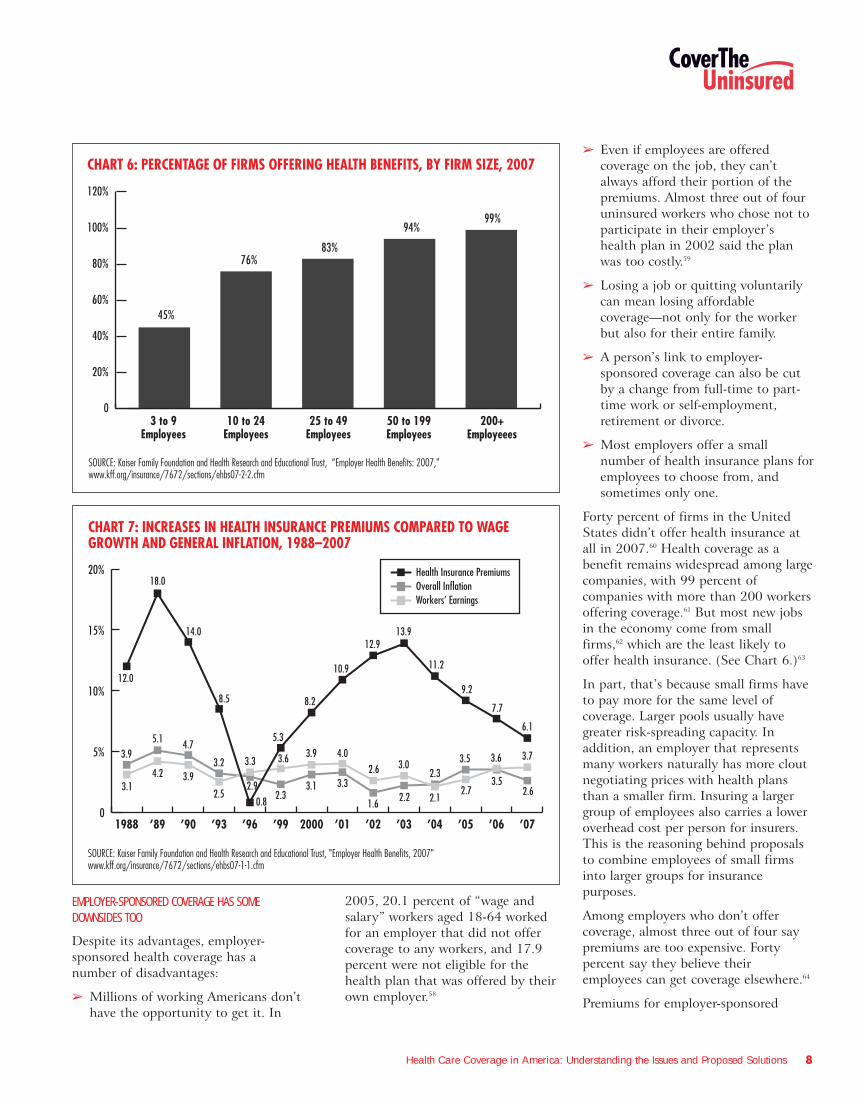
Forty percent of firms in the UnitedStates didn’t offer health insurance atall in 2007.60 Health coverage as abenefit remains widespread among largecompanies, with 99 percent ofcompanies with more than 200 workersoffering coverage.61 But most new jobsin the economy come from smallfirms,62 which are the least likely tooffer health insurance. (See Chart 6.)63
In part, that’s because small firms haveto pay more for the same level ofcoverage. Larger pools usually havegreater risk-spreading capacity. Inaddition, an employer that representsmany workers naturally has more cloutnegotiating prices with health plansthan a smaller firm. Insuring a largergroup of employees also carries a loweroverhead cost per person for insurers.This is the reasoning behind proposalsto combine employees of small firmsinto larger groups for insurancepurposes.
Among employers who don’t offercoverage, almost three out of four saypremiums are too expensive. Fortypercent say they believe theiremployees can get coverage elsewhere.64
Premiums for employer-sponsored
CHART 6: PERCENTAGE OF FIRMS OFFERING HEALTH BENEFITS, BY FIRM SIZE, 2007
SOURCE: Kaiser Family Foundation and Health Research and Educational Trust, “Employer Health Benefits: 2007," www.kff.org/insurance/7672/sections/ehbs07-2-2.cfm
83%76%
94%99%
200+Employeees
50 to 199Employees
25 to 49Employees
10 to 24Employees
3 to 9Employees
0
20%
40%
60%
80%
100%
120%
45%
CHART 7: INCREASES IN HEALTH INSURANCE PREMIUMS COMPARED TO WAGE GROWTH AND GENERAL INFLATION, 1988–2007
0
5%
10%
15%
20%
’07’06’05’04’03’02’012000’99’96’93’90’891988
18.0
12.0
14.0
8.5
5.3
8.2
10.9
12.913.9
11.2
9.2
7.7
6.1
3.94.75.1
3.2 3.3
3.14.2 3.9
2.5 2.6
3.73.6
3.52.7
3.5
2.1
2.33.0
2.2
2.6
1.6
4.0
3.33.1
3.9
2.3
3.6
2.9
SOURCE: Kaiser Family Foundation and Health Research and Educational Trust, "Employer Health Benefits, 2007" www.kff.org/insurance/7672/sections/ehbs07-1-1.cfm
0.8
Health Insurance PremiumsOverall InflationWorkers’ Earnings
Health Care Coverage in America: Understanding the Issues and Proposed Solutions 9
health coverage are rising much fasterthan workers’ earnings and inflation.(See Chart 7.) Between spring 2006and spring 2007, premiums forcoverage offered by employers acrossthe United States increased by 6.1percent—more than twice the growth inthe Consumer Price Index (CPI). Thisincludes amounts paid for coverage byboth employer and employee.65
Employers with three to 199 workerssaw an average increase of 5.5 percent;firms larger than that had an averageincrease of 6.4 percent.66
Employers expect health premiums torise an average of 5.7 percent in 2008,according to a survey by MercerHuman Resources Consulting.67 Incontrast, the CPI is expected to growby 2.9 percent.68
In response to these steady premiumhikes, many companies are asking theiremployees to cover some of the newcosts. For instance, workers takingsingle coverage through an employerpaid 11.5 percent more for their
coverage in 2007 than in 2006—$58monthly vs. $52. Premiums for a familyof four paid by workers increased by 10percent from 2006 to 2007—from$248 per month to $273.69
But in a counter trend, some employersare giving employees free prescriptiondrugs to help them manage conditionssuch as diabetes, high blood pressure,asthma and depression.70
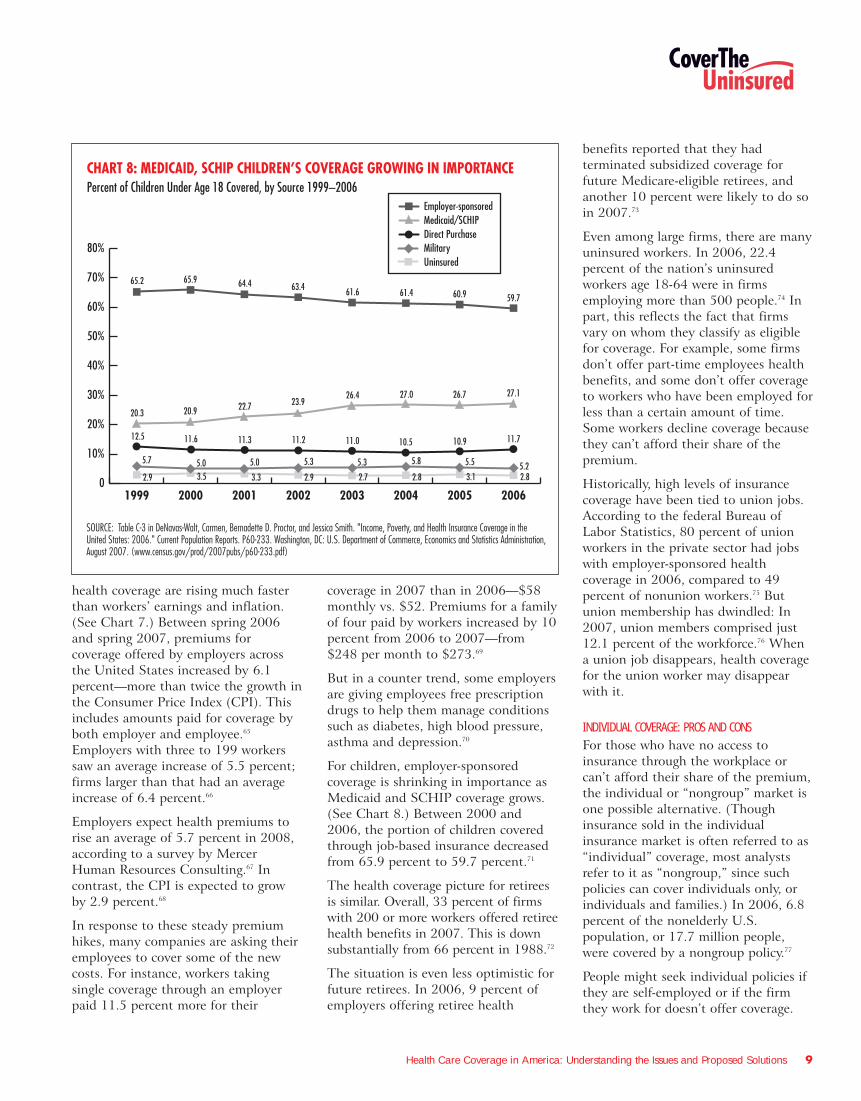
For children, employer-sponsoredcoverage is shrinking in importance asMedicaid and SCHIP coverage grows.(See Chart 8.) Between 2000 and2006, the portion of children coveredthrough job-based insurance decreasedfrom 65.9 percent to 59.7 percent.71
The health coverage picture for retireesis similar. Overall, 33 percent of firmswith 200 or more workers offered retireehealth benefits in 2007. This is downsubstantially from 66 percent in 1988.72
The situation is even less optimistic forfuture retirees. In 2006, 9 percent ofemployers offering retiree health
benefits reported that they hadterminated subsidized coverage forfuture Medicare-eligible retirees, andanother 10 percent were likely to do soin 2007.73
Even among large firms, there are manyuninsured workers. In 2006, 22.4percent of the nation’s uninsuredworkers age 18-64 were in firmsemploying more than 500 people.74 Inpart, this reflects the fact that firmsvary on whom they classify as eligiblefor coverage. For example, some firmsdon’t offer part-time employees healthbenefits, and some don’t offer coverageto workers who have been employed forless than a certain amount of time.Some workers decline coverage becausethey can’t afford their share of thepremium.
Historically, high levels of insurancecoverage have been tied to union jobs.According to the federal Bureau ofLabor Statistics, 80 percent of unionworkers in the private sector had jobswith employer-sponsored healthcoverage in 2006, compared to 49percent of nonunion workers.75 Butunion membership has dwindled: In2007, union members comprised just12.1 percent of the workforce.76 Whena union job disappears, health coveragefor the union worker may disappearwith it.
INDIVIDUAL COVERAGE: PROS AND CONSFor those who have no access toinsurance through the workplace orcan’t afford their share of the premium,the individual or “nongroup” market isone possible alternative. (Thoughinsurance sold in the individualinsurance market is often referred to as“individual” coverage, most analystsrefer to it as “nongroup,” since suchpolicies can cover individuals only, orindividuals and families.) In 2006, 6.8percent of the nonelderly U.S.population, or 17.7 million people,were covered by a nongroup policy.77
People might seek individual policies ifthey are self-employed or if the firmthey work for doesn’t offer coverage.
CHART 8: MEDICAID, SCHIP CHILDREN’S COVERAGE GROWING IN IMPORTANCEPercent of Children Under Age 18 Covered, by Source 1999–2006
65.965.2
SOURCE: Table C-3 in DeNavas-Walt, Carmen, Bernadette D. Proctor, and Jessica Smith. "Income, Poverty, and Health Insurance Coverage in the United States: 2006." Current Population Reports. P60-233. Washington, DC: U.S. Department of Commerce, Economics and Statistics Administration, August 2007. (www.census.gov/prod/2007pubs/p60-233.pdf)
0
10%
20%
30%
40%
50%
60%
70%
80%
20062005200420032002200120001999
64.4 63.4 61.6 61.4 60.9 59.7
20.920.322.7 23.9
26.4 27.0 26.7 27.1
11.612.5 11.3 11.2 11.0 10.5 10.9 11.7
5.05.7 5.0 5.3 5.3 5.8 5.5 5.23.52.9 3.3 2.9 2.7 2.8 3.1 2.8
Employer-sponsoredMedicaid/SCHIPDirect PurchaseMilitaryUninsured
Health Care Coverage in America: Understanding the Issues and Proposed Solutions 10
(As noted, 40 percent of firms didn’toffer coverage in 2007.) Layoffs,divorce, the death of a spouse or achild’s growing too old to be on aparent’s policy could lead someone toturn to the individual market. One2004 study estimated that the 20percent of Americans not eligible forgroup or public insurance find theironly coverage options in the individualmarket.78
For some, the nongroup insurancemarket offers a wider array of healthplans to choose from than if they buycoverage through an employer. Andsince such insurance is not tied to anemployer, it is portable. A person canchange jobs, move from full-time topart-time work or start their ownbusiness without losing their coverage.
Individual policies usually cost moreand may cover less than those obtainedthrough an employer. By definition,insurers and their agents sell individualpolicies one at a time, rather than aspart of a group. This means theinsurer’s administrative costs for anindividual policy are higher than forgroup policies.
These higher costs are reflected in thepremiums charged for individualpolicies. More than half of adults withcoverage through the individual marketpay $3,000 or more in premiums eachyear, compared with one in five adultscovered by employer-sponsored plans.79
Also, because people who shop in theindividual market often have highhealth care costs, insurers can chargehigh premiums to these insuranceseekers or deny coverage altogether inmost states. This practice is called“medical underwriting.”
If they are denied coverage, individualsusually have few places to turn. Theycan try another company or turn totheir state’s high-risk insurance pool ifthey live in a state that has one. Thesepools offer health insurance to peoplewho can’t get it elsewhere, usuallybecause of a pre-existing medicalcondition. But the premium cost may
be out of reach, and in a few states thepool is closed to new people. (Forinformation about your state, go towww.healthinsuranceinfo.net, a Website maintained by GeorgetownUniversity’s Health Policy Institute.)
For all these reasons, a person lookingfor an individual insurance policy mayor may not find one. In one 2004study, high prices were recognized asthe dominant factor for lowparticipation in the individual market.80
HSAS AND HIGH-DEDUCTIBLE HEALTH PLANSHealth savings accounts (HSAs) are arelatively new model of healthinsurance coverage. Individuals canonly contribute to an HSA if they arealso covered by a qualified high-deductible health plan. In 2008, theseplans must have an annual deductibleof at least $1,100 for self-only coverageand $2,200 for family coverage, and amaximum out-of-pocket limit of $5,600for self-only coverage and $11,200 forfamily coverage.81 According toAmerica’s Health Insurance Plans, atrade association representing manytypes of health plans, 4.5 millionpeople were covered by an HSA-qualified high-deductible health plan asof January 2007.82
HSAs are a trustee account holding pre-tax dollars from workers and employersthat individuals can draw from topurchase health services. They wereestablished by the MedicareModernization Act of 2003. In 2008,the maximum amount that can becontributed to an HSA is $2,900 forself-only coverage and $5,800 forfamily coverage.83 HSA contributionscan be made by individuals, theiremployers or both.
This coverage carries with it certainpreferences in tax treatment.Contributions to an HSA are taxdeductible for individuals who purchasetheir own coverage, but do not reduceincome subject to payroll tax. Earningson the funds kept in HSA accountsaccumulate tax free, balances can berolled over year to year and withdrawalsfrom the accounts are tax-free if madefor qualified medical expenses.84
Analysts and policy-makers are activelydebating many questions about HSAs:What impact will they have on theindividual and group health insurancemarkets? Will they concentrate orspread the health risks of the populationreceiving coverage in the privatemarket? How might HSAs affect overallhealth spending over time? Whatimpact are HSAs likely to have on thenumber of uninsured Americans duringthe next several years?
President Bush has long been aproponent of HSAs. He signed theoriginal legislation creating HSAs in2003, then signed another bill in late2006 encouraging the use of thismodel.85 In his 2007 State of the Unionaddress, the president called for furtherexpansion of HSAs.86
HSA proponents argue that expandingthe role of the consumer and providingequivalent tax preferences in theindividual market will improve theoverall health care system. They notethat a high-deductible policy pairedwith an HSA allows individuals toassume responsibility for paying formany of their own services rather thanhaving them paid by an insurer or agovernment program. They argue thatthis has the potential for bothrestraining the cost growth in thoseplans and making individuals moreaware of the quality of care they arereceiving. People are more prudent,they assert, when spending what theyperceive as their “own” money.87
However, some analysts doubt thatHSAs will do much to lower the numberof uninsured in the United States.88
If they are denied coverage,individuals usually have few
places to turn.
Health Care Coverage in America: Understanding the Issues and Proposed Solutions 11
They argue that HSAs will mainly serveto concentrate healthy people withmore disposable income in high-deductible health plans, causing themto drop out of the conventional groupmarket. This, they say, could causeadverse selection—the concentration ofsicker people with more modestincomes—in traditional low-deductiblehealth plans that have long been thecornerstone of the group market, andcause sharp premium increases thatmake such coverage unaffordable overtime for many people.
In a February 2007 report, the federalNational Health Statistics Group saidthat estimates of health spendingreductions resulting from HSAs coupledwith high-deductible health plans are“fairly modest.”89
Time will tell how popular HSAs willbecome and how they will evolve. Forinstance, America’s Health InsurancePlans has called on Congress to allowmore generous contributions into HSAsif someone in the family is enrolled in adisease management or carecoordination program for a chroniccondition. The organization alsosuggests that early retirees could beallowed to use HSA funds to buyretiree health coverage.90
MEDICAID The Medicaid program offers arelatively generous package of benefitsfor low-income mothers and children,people with disabilities, and certainseniors. Some 60.9 million people werecovered by Medicaid at some pointduring fiscal year 2007, according tothe Department of Health and HumanServices.91 This is the number acceptedby most health services researchers.The U.S. Census Bureau, based on itssurvey of households, puts the numberat 38.3 million covered for the non-institutionalized population in 2006.92
Medicaid enrollment has grown eachyear since 1998.93 Without this growth,the number of uninsured in those yearswould have been even higher.
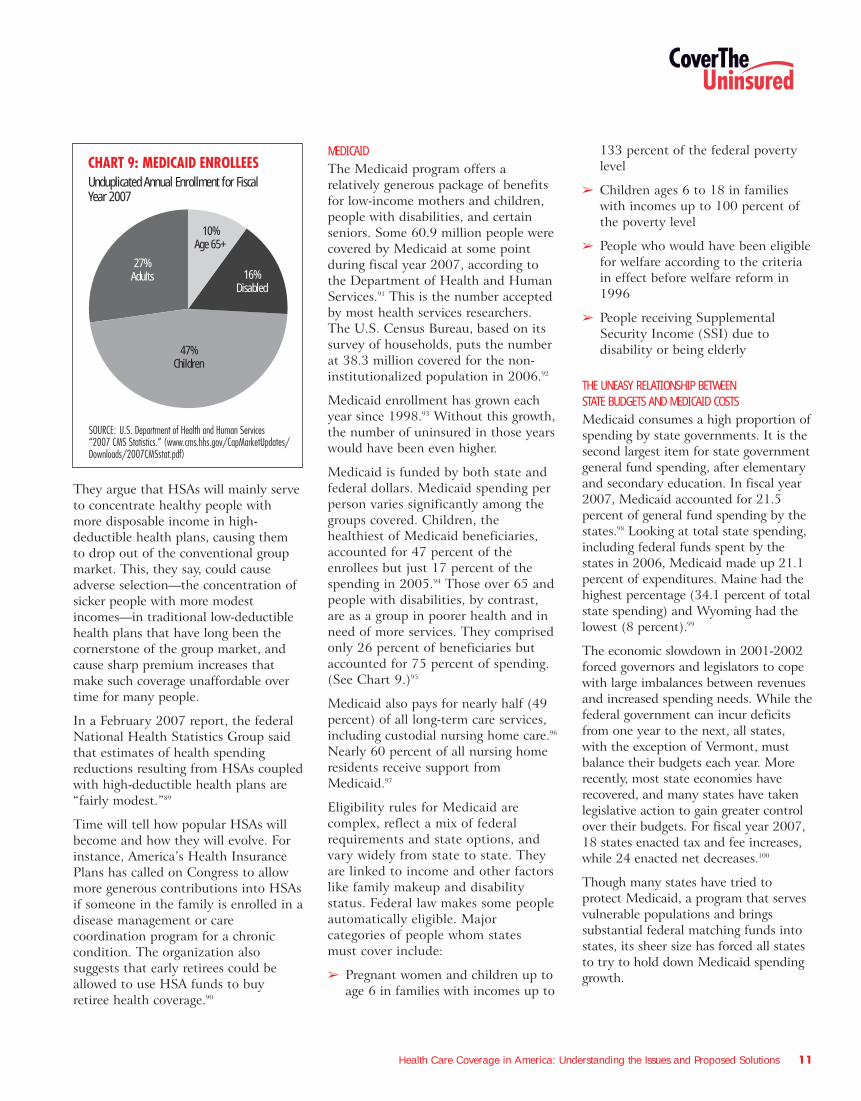
Medicaid is funded by both state andfederal dollars. Medicaid spending perperson varies significantly among thegroups covered. Children, thehealthiest of Medicaid beneficiaries,accounted for 47 percent of theenrollees but just 17 percent of thespending in 2005.94 Those over 65 andpeople with disabilities, by contrast,are as a group in poorer health and inneed of more services. They comprisedonly 26 percent of beneficiaries butaccounted for 75 percent of spending.(See Chart 9.)95
Medicaid also pays for nearly half (49percent) of all long-term care services,including custodial nursing home care.96
Nearly 60 percent of all nursing homeresidents receive support fromMedicaid.97
Eligibility rules for Medicaid arecomplex, reflect a mix of federalrequirements and state options, andvary widely from state to state. Theyare linked to income and other factorslike family makeup and disabilitystatus. Federal law makes some peopleautomatically eligible. Majorcategories of people whom states must cover include:
� Pregnant women and children up toage 6 in families with incomes up to
133 percent of the federal povertylevel
� Children ages 6 to 18 in familieswith incomes up to 100 percent ofthe poverty level
� People who would have been eligiblefor welfare according to the criteriain effect before welfare reform in1996
� People receiving SupplementalSecurity Income (SSI) due todisability or being elderly
THE UNEASY RELATIONSHIP BETWEEN STATE BUDGETS AND MEDICAID COSTSMedicaid consumes a high proportion ofspending by state governments. It is thesecond largest item for state governmentgeneral fund spending, after elementaryand secondary education. In fiscal year2007, Medicaid accounted for 21.5percent of general fund spending by thestates.98 Looking at total state spending,including federal funds spent by thestates in 2006, Medicaid made up 21.1percent of expenditures. Maine had thehighest percentage (34.1 percent of totalstate spending) and Wyoming had thelowest (8 percent).99
The economic slowdown in 2001-2002forced governors and legislators to copewith large imbalances between revenuesand increased spending needs. While thefederal government can incur deficitsfrom one year to the next, all states,with the exception of Vermont, mustbalance their budgets each year. Morerecently, most state economies haverecovered, and many states have takenlegislative action to gain greater controlover their budgets. For fiscal year 2007,18 states enacted tax and fee increases,while 24 enacted net decreases.100
Though many states have tried toprotect Medicaid, a program that servesvulnerable populations and bringssubstantial federal matching funds intostates, its sheer size has forced all statesto try to hold down Medicaid spendinggrowth.
CHART 9: MEDICAID ENROLLEESUnduplicated Annual Enrollment for Fiscal Year 2007
SOURCE: U.S. Department of Health and Human Services“2007 CMS Statistics.” (www.cms.hhs.gov/CapMarketUpdates/Downloads/2007CMSstat.pdf)
27%Adults
47%Children
16%Disabled
10%Age 65+
Health Care Coverage in America: Understanding the Issues and Proposed Solutions 12
Some of the options for restrainingMedicaid spending are politicallypainful. For example, states can cutpayments to providers and plans, restrictbenefits, and curtail eligibility. To saveeven more money, some states have alsoreduced their outreach and enrollmentcampaigns that inform the public aboutwho is eligible and how to sign up forMedicaid benefits.
States were projected to get a shortrespite in the steep upward trend ofMedicaid spending. In fact, Medicaidspending growth declined for the firsttime in the program’s 40-plus yearhistory in 2006.101 This is largelybecause beginning in January 2006,states were no longer liable for theprescription drug expenses of “dualeligibles”—those who are eligible forboth Medicare and Medicaid. Instead,states now make payments equal toabout 5 percent of state Medicaidexpenses to the federal government,
which is paying these drug expensesthrough Medicare.
But the Medicaid spending “breather”will be short lived. Recent projectionssuggest that health care spending willcontinue to rise at an average annualrate of 8 percent through fiscal year2017.102 Medicaid accounts for 22percent of state budgets, so rising costswill continue to put pressure on states.103
STATE CHILDREN’S HEALTH INSURANCE PROGRAMMore than 20 million children underage 18 were covered by Medicaid orthe State Children’s Health InsuranceProgram (SCHIP) in 2006, accordingto the Census Bureau.104
Congress created SCHIP in 1997.Financed jointly by the federal andstate governments, the program isintended for children whose parentsearn too much to qualify for Medicaidyet too little to afford private
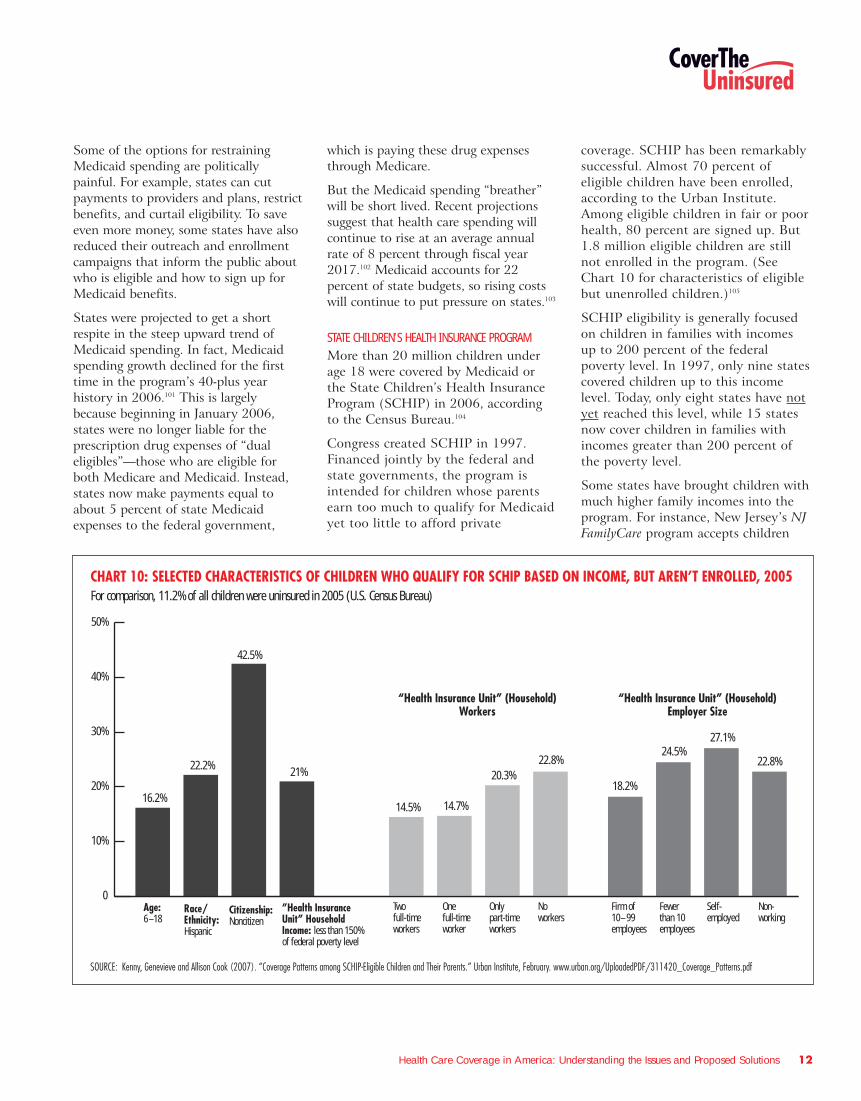
coverage. SCHIP has been remarkablysuccessful. Almost 70 percent ofeligible children have been enrolled,according to the Urban Institute.Among eligible children in fair or poorhealth, 80 percent are signed up. But1.8 million eligible children are stillnot enrolled in the program. (SeeChart 10 for characteristics of eligiblebut unenrolled children.)105
SCHIP eligibility is generally focusedon children in families with incomesup to 200 percent of the federalpoverty level. In 1997, only nine statescovered children up to this incomelevel. Today, only eight states have notyet reached this level, while 15 statesnow cover children in families withincomes greater than 200 percent ofthe poverty level.
Some states have brought children withmuch higher family incomes into theprogram. For instance, New Jersey’s NJFamilyCare program accepts children
CHART 10: SELECTED CHARACTERISTICS OF CHILDREN WHO QUALIFY FOR SCHIP BASED ON INCOME, BUT AREN’T ENROLLED, 2005For comparison, 11.2% of all children were uninsured in 2005 (U.S. Census Bureau)
SOURCE: Kenny, Genevieve and Allison Cook (2007). “Coverage Patterns among SCHIP-Eligible Children and Their Parents.” Urban Institute, February. www.urban.org/UploadedPDF/311420_Coverage_Patterns.pdf
0
10%
20%
30%
40%
50%
”Health Insurance Unit” Household Income: less than 150% of federal poverty level
Citizenship:Noncitizen
Race/Ethnicity:Hispanic
Age:6–18
“Health Insurance Unit” (Household)Workers
“Health Insurance Unit” (Household)Employer Size
16.2%
22.2%
42.5%
21%
14.5% 14.7%
20.3%22.8%
18.2%
24.5%27.1%
22.8%
Non-working
Self-employed
Fewerthan 10employees
Firm of10–99 employees
Onlypart-timeworkers
Onefull-timeworker
Twofull-timeworkers
Noworkers
with family incomes as high as 350percent of the federal poverty level,which in 2007 amounts to more than$72,000 for a family of four.
The federal government authorized $48billion over 10 years for SCHIP. Thefinancing of SCHIP during the last 10years has provided states with apowerful inducement to cover morechildren because they can use federalfunds, while putting up fewer of theirown dollars than is required underMedicaid.
Across all states, the average federalmatching rate for SCHIP in 2007 was70 percent, meaning that for every 30cents in revenue raised by states for theprogram, the federal governmentprovided 70 cents. By comparison, theaverage federal matching rate forMedicaid was 60 percent.106
States have considerable flexibility inthe use of SCHIP money. Some stateshave established an independentChildren’s Health Insurance Program(CHIP), while others have chosen toexpand their Medicaid program toinclude children in families with higherhousehold incomes. Still other stateshave adopted a combination of bothapproaches. Currently, 16 states have aseparate program for children, 16 haveexpanded their Medicaid program and19 have combination programs.Children applying for a separate stateprogram or a combination programmust first be screened to make surethey are not eligible for Medicaid. Thisis because no child who is eligible forMedicaid can be enrolled in SCHIP—arule that is designed to discouragestates from claiming the more generousSCHIP matching dollars for Medicaid-eligible children.
The federal legislation that createdSCHIP in 1997 was scheduled to expirein September 2007. When consideringhow to extend the program, lawmakersneeded to decide how much money thefederal government would provide.Keeping the current level of federalfunding, roughly $5 billion per year,
would result in 1.6 million to 1.9million children losing coverage between2006 and 2012.107 To keep enrollment atcurrent levels would require addinganywhere from $8 billion to $15 billionover the next five years. Reaching thealmost 2 million children who areeligible but not enrolled would cost anestimated $40 billion to $60 billion overfive years.108
Some advocates proposed extending theprogram to additional groups, includingparents of eligible children. Such anexpansion would further increaseprojected costs. Under specialpermission from the federal government,eight states already cover some parents.Four states cover some childless adults,and 11 states use SCHIP funds to coversome pregnant women.109
Last fall, two separate versions of a newSCHIP bill were passed by the Houseand Senate but President Bush vetoedboth of them. In December 2007,Congress passed legislation that extendedthe program through March 31, 2009,with enough funding for states tomaintain their current enrollmentthrough that date. President Bush signedthe bill on December 29, 2007.
Many people wonder if the SCHIPdebate provided a preview of broaderconversations about ways to reconfigurethe nation’s public-private healthsystem in order to extend regularmedical care to tens of millions ofuninsured adults, whose primary sourceof health services may be an emergencyroom or a public health clinic.
MEDICAREVirtually everyone over 65 is eligible forMedicare, along with certain individualswho have permanent disabilities and
those with end-stage renal disease(ESRD). Eligibility for Medicare doesnot depend on a person’s income orassets. This sets it apart from manyother government health care financingprograms, which are restricted to thosewith limited finances.
Medicare, which is financed by thefederal government and beneficiaries,had an average monthly enrollment of43.9 million people in 2007, about 16percent of whom are under the age of65 and qualified for the program on thebasis of permanent disability.110
Individuals of any age who have ESRDalso qualify for Medicare coverage111 andaccount for less than 1 percent ofMedicare enrollment.112
Medicare has occasionally been part ofdiscussions about the uninsured. Forexample, it has been recommended as aplatform for providing coverage to earlyretirees between the ages of 55 and 64.(See the section on public programexpansions below.) Because it has onlysporadically been part of the debate, itis not covered in detail in this guide.General information about Medicare isavailable at www.medicare.gov.
Approaches to Covering the UninsuredWhile the current system of coveringAmericans has many advantages, the factthat tens of millions of people each yearare uninsured suggests that we could bedoing a better job in making health carecoverage accessible to everyone. Indeed,policy-makers in Washington have beentrying to do this for more than a halfcentury. More recently, we have seen aflurry of interest among state legislaturesand governors’ offices.
Certainly, there is no shortage ofopinion about how to expand coverage.Politicians, academics, policy-makersand others have considered a widerange of policies to cover theuninsured. Proposals differ in terms ofpolitical philosophy, cost, the numberof people who will be insured andmany other factors.
Health Care Coverage in America: Understanding the Issues and Proposed Solutions 13
More recently, we have seena flurry of interest among
state legislatures andgovernors’offices.
Health Care Coverage in America: Understanding the Issues and Proposed Solutions 14
As with most complex public policyissues, there is no agreed-upon “best”way to expand health coverage to morepeople. Proposals differ about whetherwe should cover only a portion of thosewho lack coverage; all Americans,whether insured or uninsured; or somevariation in between.
In order to better understand the rangeof policy options available tolawmakers, it’s helpful to look at aseries of general approaches to coveringthe uninsured, ranging from makingprogress step by step to a wholesaleoverhaul of our system. It is importantto remember that the following isn’t anexhaustive list of options but rather arepresentative selection of approaches.
You can find more helpful informationat the Cover the Uninsured Web site,www.CoverTheUninsured.org.
Below is a summary of some of themajor approaches that have beendiscussed and debated by researchers,legislators, health industry stakeholdersand advocates. This section is basedprincipally on the Covering Americaproject of the former Economic andSocial Research Institute, supported bythe Robert Wood Johnson Foundation.113
EXPANSION OF EXISTING EMPLOYER-BASED POOLS AND CREATION OF NEW POOLS During the 1990s and continuingtoday, Congress has taken an activeinterest in debating proposals designedto improve access and affordability inthe small group insurance market (foremployers with 50 or fewer workers)and the individual insurance market.As discussed above, this interest hastaken the form of legislation thatcreated health savings accounts (HSAs)and legislation that proposes to createassociation health plans (AHPs) andsimilar entities.
The 1996 Health Insurance Portabilityand Accountability Act created newfederal requirements to temper theeffect of medical underwriting (e.g.,exclusions for individuals with certaincostly pre-existing medical conditions)in the small group and individual
markets. But these reforms are nowwidely acknowledged to have hadlimited impact on the affordability ofand access to coverage for manycompanies and individuals in thesemarkets, where monthly premiums andannual deductibles have remained high.
One idea that has been carefullyconsidered by experts and policy-makers of diverse viewpoints is thepossibility of allowing individuals andemployers to buy into an existing largepool. This would spread risk and lowerpremiums.
One such pool is the FederalEmployees Health Benefits Program(FEHBP), which is for federalemployees and their dependents.FEHBP is community rated, meaningthat federal workers who have amedical history of illness cannot becharged more than those who do not.
Advocates of this approach point outthat it takes advantage of existingeconomies of scale and risk pooling.Opponents claim that costs for FEHBPwould rise if a large number ofindividuals in poor health were allowedto join.
Another pooling approach isassociation health plans. Passed severaltimes in the U.S. House ofRepresentatives, legislation to createAHPs has always faltered in theSenate. Such plans would help smallemployers purchase health coveragethrough trade associations. Proponentsnote that by grouping together theiremployees in such plans, smallemployers could gain the economies ofscale—and the lower per-personpremiums—enjoyed by largeremployers. Critics object to the factthat AHPs would be exempt from statemandates that require health insurersto cover specific diseases or treatmentsand forbid them from refusing to coverolder or sicker individuals or chargethem higher premiums.
EMPLOYER CONTRIBUTION REQUIREMENTSEmployer contribution requirements,better known as employer mandates,
would require employers to eitherprovide insurance to their workers orfinance coverage through a tax coveringall or most of the cost of providinginsurance to their workers under newlycreated public plans, or insurance pools.Such proposals are often referred to aspay or play.
Proponents argue that such arequirement would treat all employersfairly, since employers could not gain acompetitive advantage by refusing tocover their workers, as they can now. Allemployees and their dependents wouldbe guaranteed access to health coverage.
Opponents counter that pay or play isunwise because it would create a neweconomic burden for lower-wage firmsthat don’t currently offer healthinsurance to their workers. Theseemployers often oppose legislation thatwould require providing health coverage,arguing that it is most appropriate forthem to make decisions about thebenefits packages they offer in order toattract the most suitable workers. Byadding to the cost of employment, theysay, this approach would discouragebusinesses from hiring more workers.
INDIVIDUAL MANDATES Individual mandates would requireeveryone to have some basic form ofhealth insurance. Such insurance couldbe provided by employers, the publicsector or private insurers. Theindividual mandate is akin toautomobile insurance—every driver hasto buy at least the legally requiredminimum amount of coverage.
Proponents say that if everyone isrequired to have insurance, insurerswould provide a range of policies withvarying benefits in order to attract newbusiness. Doing so would lower theprice of coverage, they contend, due toincreased competition among carriersand the addition of millions ofrelatively healthy, low-cost people tothe health insurance market.
Opponents believe that requiringindividuals to have coverage wouldn’tnecessarily mean that everyone would
Health Care Coverage in America: Understanding the Issues and Proposed Solutions 15
get it. Compliance is far from universalin the automobile insurance market. Infact, 14.5 percent of drivers in stateswhere insurance is compulsory violatethe law, according to the InsuranceResearch Council.
The primary reason that someindividuals might not sign up for healthcoverage is that doing so could createfinancial hardships. This is why someexperts argue that to make anindividual mandate effective, substantialpublic subsidies would be needed tooffset costs for lower-wage workers. Inaddition, fear of being deported amongthe immigrant population could meanthat some of these individuals wouldnot purchase coverage.
STATE AND LOCAL COVERAGE INITIATIVES State and local coverage initiatives haveshaped highly diverse policy approachesthat attempt to provide healthinsurance for populations that typicallyfind it difficult to access affordablehealth insurance. In doing so, theyborrow concepts and models from boththe public and private sectors.
In October 2006, the PennsylvaniaLegislature approved funding for CoverAll Kids, a program allowing familieswith incomes above the SCHIP eligibilitylevel to purchase health insurance fortheir children on a sliding scale based onincome. In early 2007, PennsylvaniaGovernor Ed Rendell unveiled hisPrescription for Pennsylvania plan toassist uninsured adults and smallbusinesses in obtaining basic coveragethrough private insurers. Costs ofpremiums are shared between businessesthat join the program and theiremployees and are subsidized with stateand federal monies that pay the balanceof the premium. However, in earlyMarch of this year the state House ofRepresentatives passed a bill meant toreplace the Governor’s proposal thatwould instead expand eligibility in thestate’s adultBasic program. The stateSenate has yet to vote on the bill but isalso crafting their own measure thatwould help adults obtain affordablecoverage from a private insurer.
At the end of October last year, NewMexico Governor Bill Richardsonunveiled his HealthSOLUTIONS NewMexico proposal, in which stateresidents would be required to purchasecoverage. Residents with lower incomeswould be eligible for subsidies from thestate to offset their costs. The planwould require employers to contributeto a fund to help pay for the proposal,with employers receiving a credit fortheir current contributions toward theiremployees’ health coverage.
Also in 2006, Vermont passed legislationthat created a new health coverageprogram for the uninsured calledCatamount Health, which providesassistance with paying premiums basedon a sliding scale, as well as cost sharingunder private health insurance plans.The state estimates that as many as25,000 of the 60,000 uninsuredVermont residents may enroll in thisprogram. If coverage goals are notreached by 2010, the Legislature mayconsider coverage mandates.
The state of Massachusetts enactedlegislation in 2006 establishing amandate for individuals to have healthinsurance. On July 1, 2007, the statebegan enforcing the law to require allresidents to obtain health insurance orpay a penalty. Massachusetts alsoestablished a premium subsidy programthat offers subsidized insurance toadults who otherwise lack access tohealth care coverage through anemployer, Medicaid, Medicare or theVeterans Administration. In addition,employers are required to make a “fairand reasonable” contribution to thecost of coverage for their employees. Asof December 2007, the programcovered close to 160,000 previouslyuninsured individuals.
In California, Governor ArnoldSchwarzenegger had proposed a similarplan that failed to gain enough supportin the State Senate to get on the 2008ballot. Everyone in the state would berequired to have coverage, with thestate offering premium subsidies forpeople with low incomes. Employerswould have to provide coverage to theiremployees or pay a fee to the stateequal to 4 percent of employeeearnings, which would be used tosubsidize coverage.
Maine began a new health careinitiative called Dirigo Health in 2005.The voluntary program seeks to ensureaccess to health care for all of thestate’s 1.3 million residents over a five-year period. It offers health coveragethrough private insurers to thosewithout access to employer-sponsoredcoverage, employees of small businesseswho work 15 or more hours per week,and self-employed people, as well astheir dependents. Participatingemployers pay at least 60 percent ofthe total premiums for theirparticipating workers. For those makingless than 300 percent of the federalpoverty level, premium charges are on asliding scale based on ability to pay.
A county- and city-based approach wasundertaken by San Francisco, whichestablished the San Francisco HealthAccess Program (SFHAP) in 2006 toprovide accessible and affordable healthcare services for all uninsured residentsof San Francisco, regardless of income,immigration status or medical condition.While the program does not providehealth coverage, it provides access toaffordable medical services that theuninsured would not get otherwise.Enrollment is voluntary and premiumcosts are based on income. Paid for inpart with city funds, the plan issupplemented with an employer healthcontribution mandate—the WorkerHealth Care Security Ordinance(WHCSO). WHCSO, which went intoeffect in January, requires localbusinesses with more than 20 employeesto either provide health care for theirworkers or make an annual contribution
State and local coverageinitiatives have shaped highlydiverse policy approaches.
Health Care Coverage in America: Understanding the Issues and Proposed Solutions 16
to SFHAP. However, some smallbusinesses in the city do not like thefinancial burden it has placed on them.The Golden Gate RestaurantAssociation has filed suit against the cityto end the requirement and is scheduledto present its case in court in April.
EXPANSION OF MEDICAID, SCHIP AND THER PUBLIC PROGRAMS Expanding public programs is yetanother approach to covering theuninsured. Some policy expertssuggest that these programs, withappropriate adjustments, can bereadily expanded to cover a largerpercentage of the uninsured. They alsoargue that public programs wouldmore easily be able to provide servicesfor lower-income people, whoseconnection to the job market andstable income may be more tenuous.
Such expansions, they note, can befinanced through a variety ofmechanisms, including state, local andfederal tax revenue, as well as taxincreases on private insurers. They canalso be tailored to require participants topick up a significant share of the costs.For example, a proposal advanced duringthe late 1990s that was popularly knownas the Medicare “buy-in” bill would haveallowed retired workers under age 65 withno other source of health insurance tojoin Medicare by paying a monthlypremium.114
Opponents of public-sector expansionsargue that current programs are poorlyorganized and frequently fail to enrollmillions who are eligible. Moreover,they say, large annual federal deficitsare likely to make securing funds forexpansions politically difficult. In thecase of public programs that arefinanced with matching contributions,such as Medicaid and SCHIP, it isbelieved that some states would resistlarge-scale expansions based onbudgetary concerns.
TAX PROPOSALS Tax proposals seek to make privatehealth insurance more affordable by
allowing individuals and employers touse pre-tax dollars to pay for insurancepremiums, usually through a credit onthe amount they owe in income taxesor by granting a tax deduction forpremium expenses. The credits couldbe designed as a fixed dollar amountor as a percentage of the premium.They can be made refundable forthose who owe no income taxes andadvanceable at the time the person isactually paying the premiums insteadof having to wait until April 15.
Granting a tax deduction for premiumexpenses while treating employer-sponsored coverage as taxable incomewould erase the tax disadvantage peopleface when they buy nongroup coverage.
Proponents of tax incentives arguethat this approach enhancesaffordability while retaining choice ofvarious plans in the private marketand encourages people to takeresponsibility for their health carecosts. They argue this would makeconsumers more price-conscious whenchoosing a health plan and, therefore,restrain health care inflation. Intheory, restraining costs would make iteasier to expand coverage.
Opponents say that individuals andemployers often don’t have theinformation they need to make “bestvalue” choices of quality providers,services and treatments nor thepurchasing clout to get good prices.Another problem cited is that manyproposals offer tax credits that are toomodest—when compared to the actualcost of insurance—to persuade asignificant number of uninsured peopleto buy coverage.
A FULLY TAX-FINANCED HEALTH CARE SYSTEM The current public-private health caresystem in the United States could bereplaced with one where employers,individuals and other private entitieswould all be responsible for paying forhealth care coverage through taxespaid to the government. The mostcommonly advocated tax-financedsystem is the single-payer approach.
Under such a system, health careproviders would remain private, butthe government would administerpayments for health care services—similar to the Canadian model.Proponents argue that a tax-financedsystem is the likeliest way to getvirtually everyone covered and wouldbe more efficient, since administrativecosts could be significantly reduced. Inaddition, the potential exists for moreeffective control of costs, if thegovernment uses its full clout innegotiating prices with doctors,hospitals, drug companies and otherhealth care providers.
Opponents of this approach contendthat a government-organized health caresystem would radically change the wayAmericans receive health care and createtoo great a role for government vis-à-visthe private sector. They also say the costto the public treasury would beunacceptably high, choices of health careproviders and services could diminish,and development of new healthtechnology and treatments would suffer.What’s more, they argue that whengovernment is the sole buyer, it does notnegotiate prices; it sets them.
CONCLUSIONOur current system of healthinsurance—a patchwork of publicprograms, employer-based coverage andindividual policies sold in the nongroupmarket—covers the majority ofAmericans. But far too many are leftwithout the resources necessary topurchase and keep dependablecoverage. Despite congressional effortsthat span much of the 20th centuryand the start of the 21st, history showsit has been difficult to agree on large-scale solutions that can solve thepersistent problem of uninsurance.
There is no ideal or easy solution to theproblem of the uninsured. Mostproposals combine coverage expansionwith other objectives, such as limitinggrowth in total national health carespending, limiting the amount of newfederal dollars spent, targeting new
Health Care Coverage in America: Understanding the Issues and Proposed Solutions 17
spending to the previously uninsuredonly or increasing consumer choice.Such goals cannot all be achievedsimultaneously. Decision-makers mustbalance these objectives and maketrade-offs among them, and citizensneed to understand these trade-offs andbecome involved in public discussions.
It is our hope that this guide will helpmake those discussions more informedand more focused on finding aconsensus for action.
PERSONAL STORIES OF THE UNINSUREDTo read personal stories about thosewho are uninsured, told in their ownwords, visitwww.CoverTheUninsured.org/stories.
Questions to Ask About Any HealthCoverage Proposal� How many uninsured people will
likely gain coverage?
� How much new spending of anykind will be necessary to cover eachnewly insured person?
� Who will be asked to pay the addedcosts needed? Government?Employers? Individuals?
� What is the likelihood that thosewho are newly covered will be ableto keep their coverage for more thana few months?
� What is the chance that someinsured people will lose theircoverage as a result of the proposalbeing implemented? How manymight lose their coverage?
� Is funding for the proposalpermanent? Can it be sustained overmany years?
If the proposal is adopted, howmight other “players” react, such asphysicians, hospitals, insurancecompanies and employers?
What help does the proposal offer to
those with special situations, such asunusually high medical expenses?
� Does the proposal help keep medicalexpenses in check for those presentlypaying for coverage, includinggovernments, employers andindividuals?
GLOSSARYFor a glossary of health insuranceterms, go to the Cover the Uninsured Web sitewww.CoverTheUninsured.org/glossaryor the Alliance for Health Reform sitewww.allhealth.org/sourcebookcontent.asp?CHID=25.
SOME SPECIFIC PROPOSALSPrivate-sector coalitions, members ofCongress and President Bush haveweighed in with proposals to help theuninsured. For more information onand comparisons of proposed legislativesolutions, visitwww.CoverTheUninsured.org/legislation. Here is a representativeselection:
White House Proposal – In his 2007State of the Union address, PresidentBush proposed tax breaks to makeprivate health coverage more affordableto those who lack it. The president'splan would allow families to deduct$15,000 from their taxable income anduse the resulting tax savings to help payfor coverage. Those filing as individualscould deduct $7,500. The tax breakwould be paid for by counting the valueof employer-sponsored coverageexceeding the deduction as regularincome. For more, go towww.whitehouse.gov/stateoftheunion/2007/initiatives/healthcare.html.
Citizens’ Health Care WorkingGroup – This congressionallymandated group held town meetingsaround the country for 15 months,conducted surveys, and solicited
KEY FACTS ABOUT THE UNINSURED
� Nearly 47 million people inthe United States—in everyage group and at everyincome level—were uninsuredfor all of 2006.115
� More than eight out of 10 ofthe uninsured are in workingfamilies.116
� During all of 2006, 8.7million children wereuninsured, up from 7.7 millionin 2004.117
� Uninsured children are muchmore likely than children withinsurance to lack a usualsource of care, delay care orhave unmet medical needs.118
� Almost 70 percent of childreneligible for the State Children’sHealth Insurance Program areenrolled. However, 1.8 millioneligible children are notenrolled.119
� An estimated 18,000 to22,000 adults die each yearbecause they are uninsuredand can’t get appropriatehealth care.120
� The majority of those polled inFebruary 2008 by the LosAngeles Times and BloombergNews said they would bewilling to pay more in taxes toprovide health insurance forevery American.121
Health Care Coverage in America: Understanding the Issues and Proposed Solutions 18
comments from individual citizens andorganizations. The recommendations itsubmitted to Congress and PresidentBush would provide affordable corehealth benefits to all Americans,guarantee financial protection againstvery high health care costs, andimprove the quality and efficiency ofcare, among other goals. To learn more,go to www.citizenshealthcare.gov.
Health Coverage Coalition for theUninsured – The proposal from thisgroup, which represents health careproviders, insurers and consumers,focuses first on getting coverage forthe nation’s uninsured childrenthrough expanded public programs, afamily tax credit for the purchase ofchildren’s coverage and grants to allowstates to experiment with newapproaches to expanding coverage.Phase two will aim at expandedpublic- and private-sector coverage foruninsured adults. For details, go towww.coalitionfortheuninsured.org.
Divided We Fail – This coalitionannounced that it will be working “tofind broad-based, bi-partisan solutionsto the most compelling domestic issuesfacing the nation—health care and thelong-term financial security ofAmericans.” Comprised of AARP,Business Roundtable, The NationalFederation of Independent Businessand Service Employees InternationalUnion, the coalition represents 50million members. (AARP is also part ofthe Health Coverage Coalition for theUninsured.) To learn more, go towww.dividedwefail.org.
America’s Health Insurance Plans(AHIP) – AHIP’s proposal aims tocover 40 million uninsured Americansby expanding eligibility for publicprograms, enabling all consumers topurchase health insurance with pre-taxdollars, providing financial assistance tohelp working families afford coverage,and encouraging states to develop andimplement access proposals. For details,go to www.ahipbelieves.com.
Federation of American Hospitals –The federation’s Health Care Passportplan aims to insure 98 percent ofAmericans, primarily through anexpansion of private-sector coverage.Everyone in the United States wouldbe required to have coverage either onthe job or through direct purchase.Subsidies would be provided for lower-income uninsured people. Medicaidwould be expanded to cover alluninsured adults below the federalpoverty level. For more, go towww.fahs.org/passport.
Healthy Americans Act – Introducedby U.S. Senator Ron Wyden (D-Oregon) and Senator Bob Bennett (R-Utah), this bill is designed to "ensureevery American can afford a high-quality, private health plan that iscomparable to what Members ofCongress enjoy now." After two years,all employers would be required togradually raise employees' pay to helpthem buy private coverage. Allindividuals would be required to buycoverage for themselves and anydependent children. Insurers would berequired to cover anyone who applies,regardless of health circumstances,without raising prices because of anenrollee’s preconditions. To learn more,go to www.wyden.senate.gov.
State Grants – A bipartisan group oflawmakers has introduced legislation inboth the House and Senate to createexperimental grants to states to testhealth reform strategies. The grantscould be used for tax credits, expandingMedicaid or the State Children’sHealth Insurance Program, or healthsavings accounts. Program proposalswould be submitted to a bipartisanState Health Innovation Commission,which then would present the proposalsto Congress for review and funding. Toaccess a news story about this proposalin the Kaisernetwork Daily HealthPolicy Report, go towww.kaisernetwork.org/daily_reports/rep_index.cfm?DR_ID=42324.
Health Care Coverage in America: Understanding the Issues and Proposed Solutions 19
1 DeNavas-Walt C, Proctor BD and Smith J. "Income,Poverty, and Health Insurance Coverage in the UnitedStates: 2006." Current Population Reports. P60-233.Washington, DC: U.S. Department of Commerce,Economics and Statistics Administration, August 2007.(www.census.gov/prod/2007pubs/p60-233.pdf)
2 DeNavas-Walt et al.
3 DeNavas-Walt et al.
4 DeNavas-Walt et al.
5 DeNavas-Walt et al.
6 Fronstin P. “Sources of Health Insurance andCharacteristics of the Uninsured: Analysis of the March2007 Current Population Survey.” Employee BenefitResearch Institute, October 2007, p. 12, figure 9.(www.ebri.org/pdf/briefspdf/EBRI_IB_10-20073.pdf)
7 DeNavas-Walt et al.
8 Medical Expenditure Panel Survey. “Statistical Brief #169.The Uninsured in America, 1996–2006: Estimates for theU.S. Civilian Noninstitutionalized Population Under Age65.” Agency for Healthcare Research and Quality, June2007, pp.1-2.(www.meps.ahrq.gov/mepsweb/data_files/publications/st169/stat169.pdf)
9 Pew Research Center for the People and the Press poll.Conducted January 9–13, 2008. (http://people-press.org/reports/display.php3?ReportID=395)
10 Sanmartin C et al. "Comparing Health and Health CareUse in Canada and the United States." Health Affairs25(4): 1139-1140, 2006. (www.healthaffairs.org)
11 Sanmartin et al.
12 Pew Research Center for the People and the Press poll.Conducted January 9–13, 2008. (http://people-press.org/reports/display.php3?ReportID=395)
13 Henry J. Kaiser Family Foundation poll. Conducted May31–June 5, 2007. (www.kff.org/kaiserpolls/upload/7656.pdf)
14 Los Angeles Times/Bloomberg poll. Conducted February21–25, 2008. (www.calendarlive.com/media/acrobat/2008-02/36146938.pdf)
15 Toner R and Elder J. “Most Support U.S. Guarantee ofHealth Care.” New York Times, March 2, 2007, pp. A1,A15. (www.nytimes.com/2007/03/02/washington/02poll.html)
16 Blendon RJ, Benson JM and DesRoches CM. “Americans’Views of the Uninsured: An Era for Hybrid Proposals.”Health Affairs, Web exclusive, August 27, 2003, p. 6,exhibit 4. (www.healthaffairs.com)
17 Institute of Medicine. “Insuring America’s Health:Principles and Recommendations.” News release, January14, 2004. (www.iom.edu/CMS/3809/4660/17632.aspx);Dorn S. “Uninsured and Dying Because of It. Updatingthe Institute of Medicine Analysis on the Impact ofUninsurance on Mortality.” 2008.(http://www.urban.org/url.cfm?ID=411588)
18 Ayanian JZ, Weissman JS, Schneider EC, Ginsburg JA andZaslavsky AM. “Unmet Health Needs of Uninsured Adultsin the United States.” Journal of the American MedicalAssociation, 284(16): 2062, table 1, October 25, 2000.(http://jama.ama-assn.org)
19 Collins SR et al. “The Affordability Crisis in U.S. HealthCare: Findings From the Commonwealth Fund BiennialHealth Insurance Survey.” The Commonwealth Fund,March 2004, p. 11.(www.cmwf.org/usr_doc/collins_biennial2003_723.pdf)
20 Institute of Medicine. “Report Brief: Care WithoutCoverage: Too Little, Too Late.” May 2002, p. 3.(www.iom.edu/Object.File/Master/4/160/Uninsured2FINAL.pdf)
21 Institute of Medicine. “Report Brief: Care WithoutCoverage: Too Little, Too Late.” May 2002, p. 5.(www.iom.edu/Object.File/Master/4/160/Uninsured2FINAL.pdf)
22 Baker DW et al. “Health Insurance and Access to Care forSymptomatic Conditions.” Archives of Internal Medicine,160: 1272, May 8, 2000. (http://archinte.ama-assn.org/cgi/content/short/160/9/1269)
23 Institute of Medicine. “Report Brief: Care WithoutCoverage: Too Little, Too Late.” May 2002, p. 5.(www.iom.edu/Object.File/Master/4/160/Uninsured2FINAL.pdf)
End Notes
Health Care Coverage in America: Understanding the Issues and Proposed Solutions 20
24 Institute of Medicine. “Report Brief: Care WithoutCoverage: Too Little, Too Late.” May 2002, p. 5.(www.iom.edu/Object.File/Master/4/160/Uninsured2FINAL.pdf)
25 Institute of Medicine. “Report Brief: Care WithoutCoverage: Too Little, Too Late.” May 2002, p. 6.(www.iom.edu/Object.File/Master/4/160/Uninsured2FINAL.pdf)
26 Kaiser Commission on Medicaid and the Uninsured. “TheUninsured: A Primer.” October 2006, p. 6.(www.kff.org/uninsured/upload/7451-021.pdf)
27 Having a “medical home” means having “at least onepreventive visit in the past year, had little or no problemwith access to specialty care, and reported having apersonal doctor or nurse who usually or always spentenough time and communicated clearly with families,provided telephone advice or urgent care when needed,and followed up with the family after the child’s specialtycare visits.” Described in U.S. Department of Health andHuman Services, Health Resources and ServicesAdministration, Maternal and Child Health Bureau; “TheHealth and Well-Being of Children: A Portrait of Statesand the Nation 2005: Medical Home.” 2005. DownloadedFebruary 20, 2007.(www.mchb.hrsa.gov/thechild/1child/2care/7medical.htm)
28 National Survey of Children’s Health: Data ResourceCenter. “The Health and Well-Being of Children: APortrait of States and the Nation 2005: Mental HealthCare.” 2005. Downloaded February 20, 2007.(www.mchb.hrsa.gov/thechild/1child/2care/5mental.htm)
29 Kaiser Commission on Medicaid and the Uninsured. “TheUninsured: A Primer.” October 2006, p. 7, figure 7.(www.kff.org/uninsured/upload/7451-021.pdf)
30 Kaiser Commission on Medicaid and the Uninsured. “TheUninsured: A Primer.” October 2006, p. 7, figure 7.(www.kff.org/uninsured/upload/7451-021.pdf)
31 National Survey of Children’s Health: Data ResourceCenter. “The Health and Well-Being of Children: APortrait of States and the Nation 2005: Preventive HealthCare Visits.” Downloaded February 20, 2007.(www.mchb.hrsa.gov/thechild/1child/2care/3rprevhc.htm)
32 The State Health Access Data Assistance Center and theUrban Institute. “Going Without: America’s UninsuredChildren.” Robert Wood Johnson Foundation, August
2005, p. 11. Downloaded on February 20, 2007.(http://coveringkidsandfamilies.org/press/docs/2005BTSResearchReport.pdf)
33 The State Health Access Data Assistance Center and theUrban Institute. “Going Without: America’s UninsuredChildren.” Robert Wood Johnson Foundation, August2005, p. 12. Downloaded on February 20, 2007.(http://coveringkidsandfamilies.org/press/docs/2005BTSResearchReport.pdf)
34 The State Health Access Data Assistance Center and theUrban Institute. “Going Without: America’s UninsuredChildren.” Robert Wood Johnson Foundation, August2005, p. 11. Downloaded on February 20, 2007.(http://coveringkidsandfamilies.org/press/docs/2005BTSResearchReport.pdf)
35 Kaiser Commission on Medicaid and the Uninsured. “TheUninsured: A Primer.” Kaiser Family Foundation. October2007, p. 9. (www.kff.org/uninsured/upload/7451-03.pdf)
36 Doty M, Edwards JN and Holmgren A. “Seeing Red:Americans Driven Into Debt by Medical Bills.” TheCommonwealth Fund, August 2005, p. 4.(www.cmwf.org/usr_doc/837_Doty_seeing_red_medical_debt.pdf)
37 Collins SR, Doty MM, Davis K, Schoen C, Holmgren ALand Ho A. “The Affordability Crisis in U.S. Health Care:Findings From the Commonwealth Fund Biennial HealthInsurance Survey.” The Commonwealth Fund, March2004, p. 18.(www.cmwf.org/usr_doc/collins_biennial2003_723.pdf)
38 DeNavas-Walt et al.
39 DeNavas-Walt et al.
40 Statehealthfacts.org. “Health Insurance Coverage of Adults19–64, states (2005–2006), U.S. (2006).” Kaiser FamilyFoundation. (www.statehealthfacts.org)
41 Fronstin P, p. 12, figure 9.
42 Fronstin P, p. 12, figure 9.
43 Fronstin P, p. 12, figure 9.
Health Care Coverage in America: Understanding the Issues and Proposed Solutions 21
44 DeNavas-Walt et al.
45 U.S. Department of Health and Human Services. “The2008 HHS Poverty Guidelines.” 2008.(http://aspe.hhs.gov/poverty/08poverty.shtml)
46 DeNavas-Walt et al.
47 DeNavas-Walt et al.
48 DeNavas-Walt et al.
40 U.S. Census Bureau. “Table HI09A. Health InsuranceCoverage Status by Nativity, Citizenship, and Duration ofResidence for Hispanic Population: 2006.” August 28,2007.(http://pubdb3.census.gov/macro/032007/health/h09a_000.htm)
50 Ku L and Ross DC. “Staying Covered: The Importance ofRetaining Health Insurance for Low-Income Families.” TheCommonwealth Fund, December 2002, p.1.(www.cmwf.org/usr_doc/ku_stayingcovered_586.pdf)
51 Fronstin P, p. 5, figure 1.
52 Anderson GF and Hussey PS. “The Blues: A History ofthe Blue Cross and Blue Shield System”; “…And thePursuit of National Health: The Incremental StrategyToward National Health Insurance in the United States ofAmerica.” Bulletin of the History of Medicine, 74(4): p. 868-870, 2000.
53 The Oregon History Project. “Oregon Biographies: HenryJ. Kaiser.” The Oregon Historical Society, 2002.(www.ohs.org/education/oregonhistory/Oregon-Biographies-Henry-Kaiser.cfm)
54 White House. “Affordable, Accessible, and Flexible HealthCoverage.” January 23, 2007.(www.whitehouse.gov/stateoftheunion/2007/initiatives/healthcare.html)
55 Sheils J and Haught R. “The Cost of Tax-Exempt HealthBenefits in 2004.” Health Affairs, Web exclusive, February25, 2004, p. 4.(http://content.healthaffairs.org/cgi/reprint/hlthaff.w4.106v1)
56 Reinhardt UE. “Is the President’s Plan Dead Even BeforeArrival?” British Medical Journal, 334:238, February 3, 2007.(www.allhealth.org/publications/Uninsured/Uwe_Reinhardt_on_President_Bushs_plan_49.pdf)
57 Congressional Budget Office. “The Budget and EconomicOutlook: Fiscal Years 2008 to 2017: Spending Outlook.”January 2007, p. 55, table 3-3.(www.cbo.gov/ftpdocs/77xx/doc7731/01-24-BudgetOutlook.pdf)
58 Fronstin P, p. 7, figure 4.
59 Fronstin P, p. 7, figure 4.
60 Kaiser Family Foundation/HRET. “Employer HealthBenefits 2007 Annual Survey.” September 2007, exhibit2.1. (www.kff.org/insurance/7672/sections/ehbs07-2-1.cfm)
61 Kaiser Family Foundation/HRET. “Employer HealthBenefits 2007 Annual Survey.” September 2007, exhibit2.2. (www.kff.org/insurance/7672/sections/ehbs07-2-2.cfm)
62 U.S. Small Business Administration. “Frequently AskedQuestions: How Important Are Small Businesses to theU.S. Economy?” 2007.(app1.sba.gov/faqs/faqindex.cfm?areaID=24)
63 Kaiser Family Foundation/HRET. “Employer HealthBenefits 2007 Annual Survey.” September 2007, exhibit2.2. (www.kff.org/insurance/7672/sections/ehbs07-2-2.cfm)
64 Kaiser Family Foundation/HRET. “Employer HealthBenefits 2007 Annual Survey.” September 2007, exhibit2.8. (www.kff.org/insurance/7672/sections/ehbs07-2-8.cfm)
65 Kaiser Family Foundation/HRET. “Employer HealthBenefits 2007 Annual Survey.” September 2007, exhibit1.1. (www.kff.org/insurance/7672/sections/ehbs07-1-1.cfm)
66 Kaiser Family Foundation/HRET. “Employer HealthBenefits 2007 Annual Survey.” September 2007, exhibit1.4. (www.kff.org/insurance/7672/sections/ehbs07-1-4.cfm)
67 Mercer Human Resources Consulting. “U.S. Employers’Health Benefit Cost Continues to Rise at Twice InflationRate, Mercer Survey Finds.” News release, November 19,2007.(www.mercer.com/pressrelease/details.jhtml?idContent=1287790)
Health Care Coverage in America: Understanding the Issues and Proposed Solutions 22
68 Congressional Budget Office. “The Budget and EconomicOutlook: Fiscal Years 2008 to 2018: Spending Outlook.”January 2008, p. 22, table 2.1.(www.cbo.gov/ftpdocs/89xx/doc8917/01-23-2008_BudgetOutlook.pdf)
69 Kaiser Family Foundation/HRET. “Employer HealthBenefits 2007 Annual Survey.” September 2007, exhibit6.2. (www.kff.org/insurance/7672/sections/ehbs07-6-2.cfm)
70 Freudenheim M. “Some Employers Are Offering FreeDrugs.” New York Times, February 21, 2007.(www.nytimes.com)
71 DeNavas-Walt et al, table C-3.
72 Kaiser Family Foundation/HRET. “Employer HealthBenefits 2007 Annual Survey.” September 2007, exhibit11.1. (www.kff.org/insurance/7672/sections/ehbs07-11-1.cfm)
73 Kaiser Family Foundation and Hewitt Associates. “RetireeHealth Benefits Examined: Findings From theKaiser/Hewitt 2006 Survey on Retiree Health Benefits.”December 2006, exhibits 18 and 19.(www.kff.org/medicare/upload/7587.pdf)
74 Fronstin P, p. 14, figure 11.
75 AFL-CIO. “The Union Difference: Union Workers HaveBetter Health Care and Pensions.” Downloaded February21, 2007.(www.aflcio.org/joinaunion/why/uniondifference/uniondiff6.cfm)
76 U.S. Bureau of Labor Statistics. “Union Membership in2007.” 2008. (www.bls.gov/news.release/union2.nr0.htm)
77 Fronstin P, p. 5, figure 1.
78 Buntin MB, Marquis MS and Yegian JM. “The Role of theIndividual Health Insurance Market and Prospects forChange.” Health Affairs. 23(6): 80, November/December2004. (www.healthaffairs.com)
79 Collins SR et al. “Squeezed: Why Rising Exposure toHealth Care Costs Threatens the Health and FinancialWell-Being of American Families.” The CommonwealthFund, September 2006.(www.cmwf.org/publications/publications_show.htm?doc_id=402531)
80 Buntin M, p. 84.
81 U.S. Department of the Treasury. “2008 HSA IndexedAmounts.” Downloaded on February 6, 2008.(www.ustreas.gov/offices/public-affairs/hsa/pdf/rp-2007-36.pdf)
82 America’s Health Insurance Plans. “4.5 Million Enrolled inHealth Savings Account Plans.” Press release, April 2, 2007.(www.ahip.org/content/pressrelease.aspx?docid=19314)
83 U.S. Department of the Treasury. “2008 HSA IndexedAmounts.” Downloaded on February 6, 2008.(www.ustreas.gov/offices/public-affairs/hsa/pdf/rp-2007-36.pdf)
84 Congressional Research Service. “Health Savings Accounts:Rules for 2006.” January 31, 2006.(www.opencrs.com/rpts/RL33257_20060131.pdf)
85 U.S. Department of the Treasury. “President Bush SignsBill to Make Health Care More Affordable, Accessible.”News release, December 20, 2006. Downloaded February22, 2007. (www.ustreas.gov/press/releases/hp209.htm)
86 White House. “President Bush Delivers State of the UnionAddress.” Transcript, January 23, 2007.(www.whitehouse.gov/news/releases/2007/01/20070123-2.html)
87 Young DA and Wildsmith TF. “Expanding Coverage:Maintaining a Role for the Individual Market.” HealthAffairs, Web exclusive, October 23, 2002.(http://content.healthaffairs.org/cgi/content/full/hlthaff.w2.391v1/DC1)
88 Stanford University School of Medicine. “StanfordEconomists Voice Doubts About Potential Health-CareProposal.” News release, January 27, 2006.(http://mednews.stanford.edu/releases/2006/january/HSA.html);Employee Benefit Research Institute. “Consumer-DrivenHealth Plans Slow to Catch On, 2nd Annual SurveyFinds.” News release, December 7, 2006.(www.cmwf.org/usr_doc/PR_755_07Dec06.pdf)
89 Poisal JA et al. “Health Spending Projections Through2016: Modest Changes Obscure Part D’s Impact.” HealthAffairs, Web exclusive, February 21, 2007.(www.healthaffairs.org)
Health Care Coverage in America: Understanding the Issues and Proposed Solutions 23
90 America’s Health Insurance Plans. “Ignagni UrgesLawmakers to Build on the Success of HSAs.” Newsrelease, June 28, 2006.(www.ahip.org/content/pressrelease.aspx?docid=16886)
91 Department of Health and Human Services. “2007 CMSStatistics.” 2007, table 11.(www.cms.hhs.gov/CapMarketUpdates/Downloads/2007CMSstat.pdf)
92 DeNavas-Walt et al.
93 DeNavas-Walt et al.
94 Department of Health and Human Services. “2007 CMSStatistics.” Table 34.(www.cms.hhs.gov/CapMarketUpdates/Downloads/2007CMSstat.pdf)
95 Department of Health and Human Services. “2007 CMSStatistics.” Table 34.(www.cms.hhs.gov/CapMarketUpdates/Downloads/2007CMSstat.pdf)
96 Smith D. “The Future of Long-Term Care and Medicaid.”Testimony before the U.S. House Committee on SmallBusiness. Centers for Medicare and Medicaid Services,July 10, 2006.(www.cms.hhs.gov/apps/media/press/testimony.asp?Counter=1893)
97 Kaiser Commission on Medicaid and the Uninsured. “TheMedicaid Program at a Glance.” January 2005, p. 2.(www.kff.org/medicaid/upload/The-Medicaid-Program-at-a-Glance-Fact-Sheet.pdf)
98 National Association of State Budget Officers. “The FiscalSurvey of the States.” December 2007, p. 1.(www.nasbo.org/Publications/PDFs/Fiscal%20Survey%20of%20the%20States%20December%202007.pdf)
99 National Association of State Budget Officers. “StateExpenditure Report: Fiscal Year 2006.” Fall 2007, p. 50,table 29. (www.nasbo.org/Publications/PDFs/fy2006er.pdf)
100 National Association of State Budget Officers. “The FiscalSurvey of States.” December 2007, p. viii.(www.nasbo.org/Publications/PDFs/Fiscal%20Survey%20of%20the%20States%20December%202007.pdf)
101 “Medicaid and Enrollment Spending Trends,” KaiserCommission on Medicaid and the Uninsured, October2007. (www.kff.org/medicaid/upload/7523_02.pdf)
102 “The Fiscal Survey of States,” National GovernorsAssociation and Association of State Budget Officers,December 2007.
103 Ibid.
104 DeNavas-Walt et al.
105 Robert Wood Johnson Foundation. “1.8 Million ChildrenAre Eligible for State Children’s Health InsuranceProgram.” News release, February 9, 2007.(www.rwjf.org/newsroom/newsreleasesdetail.jsp?id=10471)
106 Broaddus, Matt and Edwin Park (2007). “Freezing SCHIPFunding in Coming Years Would Reverse Recent Gains inChildren’s Health Coverage.” P. 7. Center on Budget andPolicy Priorities. Feb. 22. (www.cbpp.org/6-5-06health.pdf)
107 Broaddus, Matt and Edwin Park (2007). “Freezing SCHIPFunding in Coming Years Would Reverse Recent Gains inChildren’s Health Coverage.” P. 8. Center on Budget andPolicy Priorities, Feb. 22. (www.cbpp.org/6-5-06health.pdf)
108 Reichard J. “Cutting Care for Old People to Pay for KidsCoverage?” CQ Healthbeat, February 27, 2007.Department of Health and Human Services. “2007 CMSStatistics.” Table 34.(www.cms.hhs.gov/CapMarketUpdates/Downloads/2007CMSstat.pdf)
109 Kaiser Commission on Medicaid and the Uninsured.“State Children’s Health Insurance Program (SCHIP) at aGlance.” January 2007, p. 1. Centers for Medicaid andMedicare Services. “Overview.” U.S. Department ofHealth and Human Services, 2005.(www.cms.hhs.gov/MedicareGenInfo)(www.kff.org/medicaid/upload/7610.pdf)
110 Medicare Payment Advisory Commission. “A Data Book:Healthcare Spending and the Medicare Program.” June2004, p. 3. (www.medpac.gov) Department of Health andHuman Services. “2007 CMS Statistics.” Table 34.(www.cms.hhs.gov/CapMarketUpdates/Downloads/2007CMSstat.pdf)
Health Care Coverage in America: Understanding the Issues and Proposed Solutions 24
111 The Economic and Social Research Institute ceasedoperation in 2006, but resource materials from theCovering America project are still available atwww.esresearch.org/covering_america.php. Centers for Medicaidand Medicare Services. “Overview.” U.S. Department ofHealth and Human Services, 2005.(www.cms.hhs.gov/MedicareGenInfo)
112 Congressional Research Service. “Medicare Expansion:President Clinton’s Proposals to Allow Coverage Before Age65.” March 31, 1998, 98-73 EPW.Medicare PaymentAdvisory Commission. “A Data Book: Healthcare Spendingand the Medicare Program.” June 2004, p. 3.(www.medpac.gov)
113 Congressional Research Service. “Medicare Expansion:President Clinton’s Proposals to Allow Coverage Before Age65.” March 31, 1998, 98-73 EPW.The Economic andSocial Research Institute ceased operation in 2006, butresource materials from the Covering America project arestill available at www.esresearch.org/covering_america.php.
114 Congressional Research Service. “Medicare Expansion:President Clinton’s Proposals to Allow Coverage Before Age65.” March 31, 1998, 98-73 EPW.
115 DeNavas-Walt et al.
116 Fronstin P, p. 12, figure 9.
117 DeNavas-Walt et al.
118 Kaiser Commission on Medicaid and the Uninsured. “TheUninsured: A Primer.” October 2006, p. 6.(www.kff.org/uninsured/upload/7451-021.pdf)
119 Robert Wood Johnson Foundation. “1.8 Million ChildrenAre Eligible for State Children’s Health InsuranceProgram.” News release, February 9, 2007.(www.rwjf.org/newsroom/newsreleasesdetail.jsp?id=10471)
120 Institute of Medicine. “Insuring America’s Health:Principles and Recommendations.” News release, January14, 2004. (www.iom.edu/CMS/3809/4660/17632.aspx); DornS. “Uninsured and Dying Because of It. Updating theInstitute of Medicine Analysis on the Impact ofUninsurance on Mortality.” 2008.(www.urban.org/url.cfm?ID=411588)
121 Los Angeles Times/Bloomberg poll. Conducted February21–25, 2008. (www.calendarlive.com/media/acrobat/2008-02/36146938.pdf)