Embed Size (px)
Citation preview
Seton Hall UniversityeRepository @ Seton HallSeton Hall University Dissertations and Theses(ETDs) Seton Hall University Dissertations and Theses
Spring 5-14-2016
Understanding the Engagement of TransferStudents in Four-year Institutions: A national studyMartina [email protected]
Follow this and additional works at: https://scholarship.shu.edu/dissertations
Part of the Higher Education Commons
Recommended CitationGhusson, Martina, "Understanding the Engagement of Transfer Students in Four-year Institutions: A national study" (2016). SetonHall University Dissertations and Theses (ETDs). 2162.https://scholarship.shu.edu/dissertations/2162
UNDERSTANDING THE ENGAGEMENT OF TRANSFER STUDENTS IN FOUR-YEAR
INSITUTIONS: A NATIONAL STUDY
BY
MARTINA GHUSSON
Dissertation Committee
Rong Chen, Ph.D. Mentor
Martin J. Finkelstein, Ph.D. Committee Member Robert Kelchen, Ph.D. Committee Member
Submitted in partial fulfillment of the requirements for the degree
Doctor of Philosophy Department of Education Leadership, Management and Policy
Seton Hall University
2016

ii
© 2016 Martina Ghusson
iii
iv
ABSTRACT
The purpose of this study is to examine whether transfer status and type matter for
student engagement and if so, what student characteristics affect this relationship. Data from
senior students at four-year institutions across the United States who completed the National
Survey for Student Engagement (NSSE) in 2009 were used. Descriptive statistics and multiple
regression were employed to explore the relationship between transfer type, student
characteristics and student engagement by benchmark.
The findings of this study suggest that with the exception of academic challenge, native
students show higher levels of student engagement on the active and collaborative learning,
student-faculty interaction, enriching educational experiences and supportive campus
environment. Within the student population subgroups, overall native students are more engaged
than horizontal and vertical transfers. Student characteristics, such as race, gender, GPA, and
major are all found to be associated with student engagement.
v
ACKNOWLEDGMENTS
This dissertation could have not been possible without the support and dedication of my
committee. First, Dr. Rong Chen, thank you for your patience and tireless work through the last
several years. Your guidance and encouragement have been instrumental to finishing this study.
Dr. Robert Kelchen and Dr. Martin Finkelstein, your feedback has been very helpful and I am
very fortunate to have had the privilege to have you on my committee. Thank you!

vi
DEDICATION
I would like to dedicate this dissertation to my mother, Maria Danailova, whose unconditional
love and support have given me the confidence to reach all goals, this one included. Thank you
mom for believing in me.
vii
TableofContents
ABSTRACT.........................................................................................................................iv
ACKNOWLEDGMENTS.....................................................................................................v
DEDICATION......................................................................................................................vi
LIST OF TABLES.................................................................................................................x
LIST OF FIGURES..............................................................................................................xi
CHAPTER I..........................................................................................................................1
INTRODUCTION.................................................................................................................1BenefitofHigherEducation..............................................................................................................2CollegeStudents:EnrollmentPatternsandEngagement..................................................................3ConditionsofStudentEngagement..................................................................................................6ImportanceofStudentEngagement.................................................................................................7TrendsandIssuesfortheTransferPopulation..................................................................................8ConcernsabouttheTransferStudentExperienceandEngagement................................................10ResearchonTransferStudents’Engagement..................................................................................12
Limited Understanding of Student Engagement................................................................................12Lack of Research Differentiating the Types of Transfer Students and Their Engagement................12Issues with Measuring Student Engagement.....................................................................................15
OverviewofThisStudy...................................................................................................................16SignificanceoftheStudy................................................................................................................17OrganizationoftheDissertation.....................................................................................................20
CHAPTER II.......................................................................................................................21
LITERATURE REVIEW....................................................................................................21DefiningandMeasuringStudentEngagement................................................................................22DefiningandMeasuringTransferStatus.........................................................................................26
Vertical Versus Horizontal Transfer..................................................................................................27Reverse Transfer Versus Swirling Transfer.......................................................................................28
TransferStudentCharacteristicsandEffectsoftheTransfer...........................................................28ReviewofConceptualFrameworkofStudentEngagementResearch..............................................31StudentEngagementTheory:TheoreticalConstruct.......................................................................32
Quality of Effort................................................................................................................................33Astin’s Student Involvement Theory.................................................................................................34Pascarella’s Model for Assessing Student Change............................................................................39Tinto’s Integration Theory, Student Departure and Engagement......................................................40
viii
ReviewofLiterature:TransferandStudentEngagement................................................................45Transfer Status...................................................................................................................................45
ReviewofLiterature:OtherDeterminantsofStudentEngagement................................................50StudentCharacteristics..................................................................................................................51
Gender...............................................................................................................................................51Race/Ethnicity...................................................................................................................................51Enrollment Status..............................................................................................................................53GPA...................................................................................................................................................54Employment Status............................................................................................................................55Residential Status..............................................................................................................................56Other Factors.....................................................................................................................................58
InstitutionalCharacteristics............................................................................................................60Institutional Control, Classification, and Size...................................................................................60
ReviewoftheLiterature:EngagementastheOutcomeVariable....................................................61SummaryandCritiqueofTheories.................................................................................................62SummaryandCritiqueofPriorResearch........................................................................................64ProposedFramework.....................................................................................................................65
Conclusion...........................................................................................................................67
Chapter III..........................................................................................................................70
RESEARCH DESIGN.........................................................................................................70ResearchModel.............................................................................................................................70DataSource....................................................................................................................................71Sample...........................................................................................................................................72ValidityandReliability...................................................................................................................73ResearchVariables.........................................................................................................................74
Dependent Variables-NSSE Engagement Benchmarks.....................................................................74Independent Variable: Transfer Status...............................................................................................76Control Variables...............................................................................................................................77Institutional characteristics................................................................................................................78Data Analysis.....................................................................................................................................79Limitations.........................................................................................................................................81
CHAPTER IV.....................................................................................................................85
RESULTS............................................................................................................................85DescriptiveStatistics......................................................................................................................85ResearchQuestion1......................................................................................................................91MultipleRegression.......................................................................................................................98ResearchQuestion2....................................................................................................................107ResearchQuestion3....................................................................................................................119Summary......................................................................................................................................122
ix
CHAPTER V.....................................................................................................................124
CONCLUSIONS AND IMPLICATIONS.........................................................................124SummaryofFindingsandConclusions..........................................................................................126ImplicationforPolicyandPractice...............................................................................................131ImplicationsforFutureResearch..................................................................................................133ConcludingComments..................................................................................................................135
REFERENCES..................................................................................................................136
APPENDIX A: National Survey of Student Engagement 2009 (Paper Version)...............158
APPENDIX B: Description of NSSE items and list of the components items...................162
x
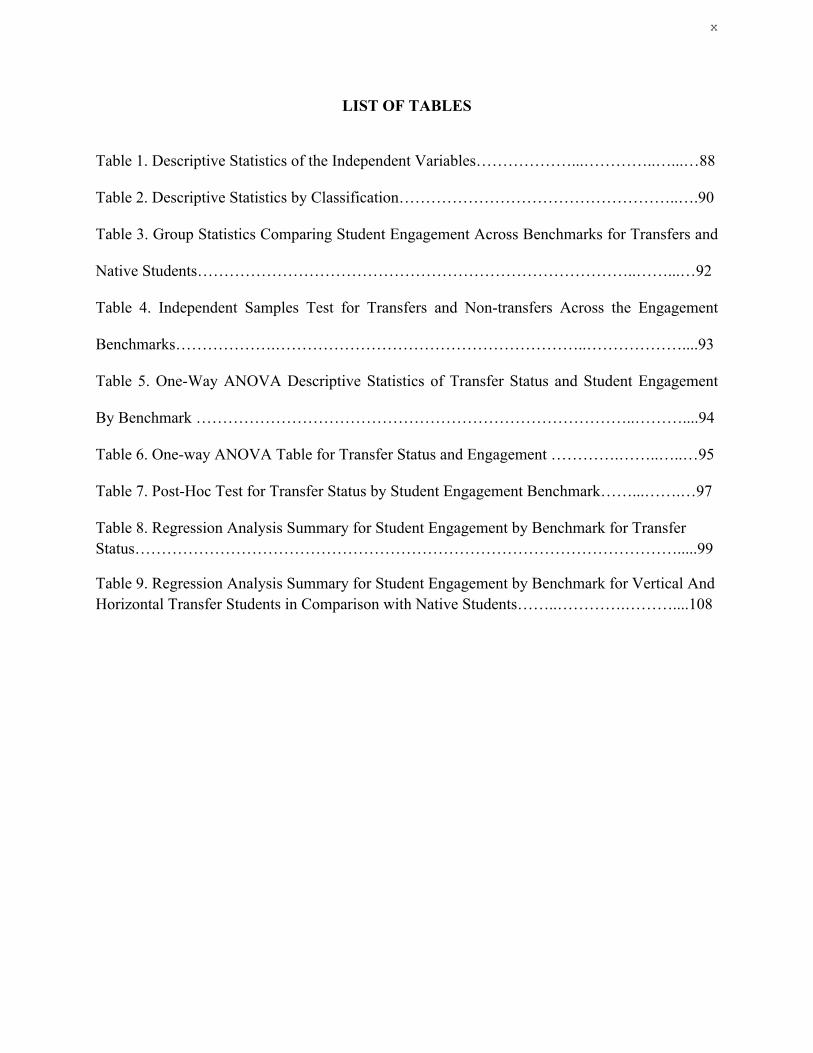
LIST OF TABLES
Table 1. Descriptive Statistics of the Independent Variables………………...…………..…...…88 Table 2. Descriptive Statistics by Classification……………………………………………..….90 Table 3. Group Statistics Comparing Student Engagement Across Benchmarks for Transfers and
Native Students………………………………………………………………………..……...…92
Table 4. Independent Samples Test for Transfers and Non-transfers Across the Engagement
Benchmarks……………….…………………………………………………..………………....93
Table 5. One-Way ANOVA Descriptive Statistics of Transfer Status and Student Engagement
By Benchmark ………………………………………………………………………..………....94
Table 6. One-way ANOVA Table for Transfer Status and Engagement ………….……..…..…95
Table 7. Post-Hoc Test for Transfer Status by Student Engagement Benchmark……...…….…97
Table 8. Regression Analysis Summary for Student Engagement by Benchmark for Transfer Status………………………………………………………………………………………….....99
Table 9. Regression Analysis Summary for Student Engagement by Benchmark for Vertical And Horizontal Transfer Students in Comparison with Native Students……..………….………....108

xi
LIST OF FIGURES
Figure 1. Concept map…………………………………………………………………………66
1
CHAPTER I
INTRODUCTION
As the United States faces a plethora of economic and social challenges today, economic
inequality between the racial and social classes remains a challenge (Baum, Ma, & Payea, 2013).
It is increasingly clear that the U.S. higher education system must continue to evolve and
improve the human condition in light of the social and economic context. Enrollment patterns,
further facilitated by the transfer function of the U.S. higher education system, indicate that
Americans recognize the value of investment in higher education. Benefits of higher education
extend to individuals as well as the society and provide a chance to reduce economic inequality.
However, low completion rates show that there are still challenges ahead. But despite the
increased enrollment levels, completion rates remain low, and this suggests that there is a
fundamental problem hindering student success and academic achievement (National Center for
Public Policy and Higher Education, 2011).
The cost of students leaving college without a bachelor’s degree is great for individuals
and society alike. Student engagement has shown great promise in alleviating the issue of low
retention and graduation rates (Price & Tovar, 2014). While the college experience varies for
everyone, research suggests a positive link between student engagement and academic
performance regardless of student type (Carini, Kuh, & Klein 2006; Pascarella & Terenzini,
1991, 2005). The more actively engaged students are in their education, with faculty and staff,
with their peers, and with their studies the more likely they are to learn, remain in school, and
attain their education goals.
2
Benefit of Higher Education
While a college degree does not necessarily guarantee a certain quality of life, financial
independence, or even employment post-graduation, evidence overwhelmingly suggests that the
personal and societal benefits of a bachelor’s degree far outweigh those of a high school diploma
for most people. For example, researchers have examined this very relationship between college
education and overall quality of life and the findings support that earnings are significantly
higher for college graduates: $21,100 over the course of 1 year, than the median earnings of
high-school graduates and earnings rise more rapidly for college graduates over time (Baum, Ma,
& Payea, 2013). The benefits of higher education also extend to society at large. For example,
state and federal governments collect increased tax revenues from college graduates and spend
less on income support programs, adults with a college degree have been found to be more likely
to receive health insurance through their employer, and college graduates have been found to be
more active citizens who vote and volunteer in their communities (Baum, Ma, & Payea, 2013).
The national policy agenda is also aligned with the benefit of higher education, with a
particular focus on the community college, since close to half of all college students choose
community colleges as their entry point to higher education (AACC, 2014). Recently, President
Obama expressed a commitment to make community college “as free and universal as high
school” (State of the Union Address 2015); an indication of shifting priorities in the funding of
education and the idea that college education is not a privilege for those who can afford it, but
rather a right for all. There was, however, no mention of how the federal initiative could help
students succeed once they are in college, how to keep them engaged and interested in their
education, and what programs and services will lead to academic success. The President’s
3
proposal, which is yet to gain the approval of Congress, is only the first step in helping all
Americans compete in the global economy. This initiative is likely to increase the numbers of
college students across the social and racial classes and benefit students from lower socio-
economic backgrounds because it will allow students to earn the first half of a bachelor’s degree
and skills needed at the workforce at no cost, which has been an obstacle for many low and
middle income families (Holland, 2015).
The financial crisis in 2008 and the recovery efforts thereafter showed that higher
education must change in order to meet the needs of society of taking best advantage of human
and physical resources by training and educating a work force that can effectively respond to
new economic challenges. The face of the college student has certainly changed. More women,
minorities, and individuals who return to higher education later in life are looking for
opportunities to better their lives and those of future generations, and the ability to start at the
community college and later transfer to another institution on their path to a college degree
allows them to do so at optimal cost and best institutional fit. For example, community colleges
serve as an entry point for many historically underrepresented groups in higher education and
enroll 51% of all Latino and 41% of all African American college students in the country (Crisp
& Nunez, 2014) and a number of them successfully transition into 4-year insinuations.
College Students: Enrollment Patterns and Engagement
Access to higher education has improved significantly in recent years. Between 1992 and
2002 enrollment in degree-granting institutions increased by 15%; between the years 2002 and
2012 it increased another 24% growing from 16 million to 20.6 million students, most of whom
are enrolled on full-time basis, and are women and minorities (U.S Department of Education,
4
NCES, 2015a). These enrollment patterns support the show that many Americans perceive
higher education as a chance for upward mobility.
Furthermore, the transfer feature of the American higher education system has made it
easier for a lot of students to expand their choices of institutions and educational experiences.
Transferring from one college to another has become an increasingly important trend, and recent
data suggest that, for the 2013-2014 academic year, as many as 46% of graduates at 4-year
institutions were previously enrolled at 2-year institutions (National Student Clearinghouse,
2015).
As 2 and 4-year institutions expand post-secondary capacity and choice, student
engagement has found a place in the dialogue on institutional effectiveness, precisely because it
evaluates direct student behavior as well as the impact of the educational environment as
institutions look for way to improve the education experience. Research suggests that student
involvement in college shapes student learning outcomes: “What students do in college counts
even more in terms of what they learn and whether they persist in college than who they are or
even where they go to college” (Kuh et al., 2005, p.8). Therefore, institutions continuously seek
ways to create favorable conditions for engagement, such as curricular and co-curricular
activities, tailoring programs and services according to student needs, and improving
environmental factors that foster student engagement and academic success, as defined not only
by GPA, but retention and graduation rates and other quantitative measures.
Student engagement is, simply put, the amount of time, energy, and effort students invest
in their education, and it is the single best predictor of learning and personal development (Astin,
1993; Pascarella & Terenzini, 1991; Pace, 1980). Recent research has focused on establishing the
relationship between student engagement, academic success, and other positive educational
5
outcomes since student engagement has been found to positively affect retention, grades and
GPA, self-reported gains in learning and personal development, and gains on other liberal
education outcomes (Kuh, Cruce, Shoup, Kinzie & Gonyea 2008; McCormack, Pike, Kuh, &
Chen 2009; Pascarella & Terenzini, 2005; Pascarella, Seifert, & Blaich, 2008; Pike, 2006).
Studies like these are important not only because they define and explain student development,
but also because they suggest ways for institutions to foster opportunities for student success and
highlight the importance of student engagement for academic success and social integration. This
line of research has suggested that a positive relationship between student engagement and
student success exists despite background factors. However, due to the differences in college
choice and path to a bachelor’s degree and differences of student engagement levels between
transfers and native students, further research is needed to examine the roles of transfer status
and background factors student engagement, since transfer students continue to lag behind in
graduation rates and face certain issues such as transfer shock and drop out.
The concept of transfer shock refers to the academic engagement of transfer students.
The term was coined by Hills (1965), who analyzed the transition of junior or community college
students, to 4-year institutions. He found that the majority of these students experienced a dip in
their GPA after the transfer. Hills referred to this phenomenon as transfer shock, because after
the initial decline the grades improved as students persisted. Other studies have also supported
the notion of transfer shock, and the findings of these studies were that students who transferred
from smaller institutions were more likely to face academic difficulties and be placed on
academic probation (Cejda, Kaylor & Rewey, 1998; Lannan, 2001).
6
Conditions of Student Engagement
Kuh (2009a) defined student engagement as the amount of time and effort students apply
to educationally purposeful activities that promote their learning and development. Engagement
also refers to efforts institutions intentionally create to foster learning and development (Kuh,
2009a; McClenney, Marti, & Adkins, 2007). Therefore, in addition to student effort, student
engagement requires certain environmental conditions. Institutions strive to provide rich learning
experiences that develop critical thinking and writing, creativity, social and academic
engagement, and help students to become global citizens. The Association of American
Colleges and Universities (Kuh, 2008) outlined several concrete, effective educational high-
impact practices that have since gained public attention. Among these practices are first-year
seminars, writing-intensive courses, learning communities, collaborative assignments and
projects, internships, and capstone projects and courses. Kuh (2008) reported strong positive
effects on student experience as a result of participation in high-impact activities. More
specifically, historically underserved students experienced “compensatory effects or a “boost” in
grades and retention during their first year of college as a result of taking part in these activities
(Kuh, 2008, p. 17). Others (Chickering & Gamson, 1987; Pascarella & Terenzini, 2005) have
also examined good practices in undergraduate education and have identified factors, such as
student-faculty contact, active learning, prompt feedback, time on task, high expectation, respect
for diverse learning styles, and cooperation among students as meaningful not only to student
success, but to student engagement as well. This line of research suggests that students and
institutions both play a role in student engagement.
Student engagement is what students do--the time and energy they invest in educationally
purposeful activities and what institutions do as well--using effective educational practices to
7
encourage student involvement in high impact educational activities. As Pascarella and Terenzini
(2005) concluded, “if, as it appears, individual effort or engagement is the critical determinant of
the impact of college, then it is important to focus on the ways in which an institution can shape
its academic, interpersonal, and extracurricular offerings to encourage student engagement” (p.
602).
This line of research supports the notion that students develop in holistic ways, and that
the root of this development is in academic and non-academic domains. The conditions for
student engagement align with the role of institutions as creating the right kind of high impact
activities to foster student engagement regardless of student background or previous experience
with higher education.
Importance of Student Engagement
The contemporary research on student engagement has largely agreed that student
engagement, or the amount of time students invest in their education, is positively linked with
desired outcomes of undergraduate education (Pascarella & Terenzini, 2005). While this remains
true, the meaning of the construct of student engagement has evolved in time to include the
complex relationship between desired outcomes and how students spend their time studying or
taking part in other educationally purposeful activities.
Among the benefits of student engagement is that it has a balancing effect, or a way to
overcome initial academic challenges, on grades and persistence for students who enter higher
education or transfer to another institution but lack the adequate preparation to succeed
academically. What this implies is that the more engaged students are, the more likely they are to
succeed in college and have a positive experience even if they enter inadequately prepared
(Cruce, Wolniak, Seifert, & Pascarella, 2006; Kuh, Cruce, Shoup, Kinzie, & Gonyea, 2008;
8
NSSE, 2007; Pascarella & Terenzini, 2005). Interactions with faculty and staff, peers, and the
environment can not only make up for deficiencies in academic preparation but ultimately lead to
higher persistence and graduation rates as engaged students spend meaningful time on task and
invest more time and effort in their education. In the following section, I discuss who transfer
students are and why it is important to understand student engagement for this student group.
Trends and Issues for the Transfer Population
As mentioned previously, with improved college access, students can make a lot of
choices as to where to pursue their college education. Today about a third of all students change
institutions at least once before they complete their degrees, and this defies the traditional college
experience (Hossler, Shapiro, & Dunbar, 2012; Simone, 2014). Understanding the unique
characteristics of transfer students and issues surrounding this student group is important when
tracing their unique college experiences and engagement levels.
With the change of their academic environments, transfers are extremely likely to face a
number of challenges, including academic, social, and personal, and that is why it is important to
consider and evaluate their experiences (Ishitanti, 2008; Laanan, 2001; Townsend & Wilson,
2006). There are several predominant assumptions about transfer students, such as their inability
to navigate through college (Tobolowsky & Cox, 2012), while, in fact, resources that have
significant impact on student behavior such as financial aid, housing, and orientation, are mostly
available to the native student population (Porter, 1999). As a result, transfer students are likely
to struggle in their college experience. Some have even suggested that most institutions lack an
understanding of how to support transfer students, largely due to the variety of reasons behind
why students switch institutions, which in turn widens the gap between how transfers and native
students experience higher education (Kirk-Kuwaye & Kirk-Kuwaye, 2007).
9
Student integration is important to address for transfer students, since their transition is
largely influenced by how successful they are in integrating with the host institution. There are
two types of integration defined in the literature: academic integration or “the formal education
of students. Its activities center around the classrooms and laboratories of the institution and
involve various faculty and staff whose primary responsibility is the education students” (Tinto,
1993, p. 106), and social integration, defined as “reoccurring sets of interactions among students,
faculty and staff that take place largely outside the formal academic domain of the college”
(Tinto, 1993, pp. 106-107). The academic challenges they face, such as managing the academic
rigor of the host institution and large class sizes, have been well documented (Townsend, 1993,
1995). Experiences such as transfer shock, discussed in more detail later in this chapter, show
that academic difficulties remain a priority for transfer students.
Unlike academic integration, social integration for transfer students has received less
attention from researchers. While most transfers prioritize on academic integration and some
have limited time on campus, transfers face a number of social challenges which affect their
college experience, such as making friends, breaking into existing social groups and adjusting to
the new social climate (Laanan, 2007). Furthermore, Laanan (2007) found that students who
participated in clubs and organizations found it less difficult to adjust socially to their host
institution. He also concluded that students who spent more time socializing with peers
experienced positive social adjustments. Individual characteristics, such as age, work
commitments, and residence tend to make it difficult for transfer students to fully integrate into
the social atmosphere on campus and make social integration one of the biggest challenges after
the transfer.
10
Another issue for transfer students is the fact that they are often discounted by college
administrators due to the fact that they do not contribute to graduation and retention rates and can
be a challenge to measure (Cook, 2012). There is a lack of appropriate programs and services for
transfer student--,such as orientation, advising--and other institutional initiatives tend to target
freshmen students and tend to overlook the older and transfer populations, and ultimately this
marginalizes these student groups (Kuh, 2003). Indicators, such as grades, persistence,
satisfaction, and gains across desired educational outcomes go along with student engagement
and all of these factors affect the transfer population (McCormick, Sarraf, BrckaLorenx, &
Haywood, 2009).
Concerns about the Transfer Student Experience and Engagement
With the increased mobility of college students, concerns also arise regarding their
academic experiences and engagement at the host institution.
While studies of post-secondary outcomes of horizontal transfer students are limited the
available data shows that while the national baccalaureate completion rate for non-transfers is
59%, only 17% of students who start at the community college level successfully transfer and
graduate with a bachelor’s degree (U.S. Department of Education, NCES, 2015b). Unlike studies
of students from community colleges who are tracked at the community college level and beyond
the transfer, there is a lack of studies of the degree outcomes for horizontal transfers, so their
experiences have not been reflected in the literature. Studies on transfers often focus on
measurable variables such number of credits transferred, number of previous institutions
attended, and time between enrollments. While there is some very brief mention of horizontal
transfers in the literature (Goldrick-Rab & Pfeifer, 2009), transfer students tend to be defined
11
predominantly as community college students transferring to 4-year institutions, and most
research typically compares characteristics of vertical transfer students to non-transfers.
According to some researchers, there are certain factors that influence transfer students’
academic success after the transfer. Prior academic performance and first-semester GPA are the
strongest predictors of persistence and academic success after the transfer (Pascarella &
Terenzini, 1991, 2005), so improving relevant conditions should be a focus for all host
institutions. Perhaps, unlike non-transfers and the transfer students at 4-year institutions who
tend to fall into the traditional student category, students at the community college tend to be
older, enrolled predominately part-time, be more of minority status, be from lower socio-
economic backgrounds, and be students who work both full and part-time more than students at
4-year institutions (AACC, 2014). These are background characteristics that influence the
college experience.
Student engagement for transfer students is especially problematic. Research has found
differences between transfers and non-transfers: transfer senior students participate in
collaborative learning at much lower rates than their non-transfer counterparts (NSSE, 2014);
first-year transfer students found their campus environments to be less supportive than non-
transfers and educational practices seemed to be less effective for transfer students (NSSE,
2013a). Transfer students also show lower levels of integration with the host institution. For
example, this group of students has been found to feel less academically connected to the new
institution, report less interaction with faculty, have fewer opportunities to participate in student
life, be confused about transfer policies (Townsend &Wilson, 2009).
The lower engagement levels and the social and academic challenges that transfer
students face suggests that there are fundamental issues with the educational experience of this
12
group of the student population. In order to help their transition and to keep them on track to earn
a bachelor’s degree, improvements for student success and engagement for the transfer group
must be put in place.
Research on Transfer Students’ Engagement
In the last two decades, a great deal of research has focused on student engagement
(Astin & Sax, 1998; Carini, Kuh & Klein, 2006; Huh & Kuh, 2003; Zhao, Carini & Kuh, 2005).
As institutions continue to focus on activities and efforts to engage students, it is important for
researchers to maintain focus on the importance of student engagement for all students. However
there are several major limitations with current research:
Limited Understanding of Student Engagement
Studies on student engagement have provided only limited understanding of the student
experience. Background characteristics and non-academic agents, such as institutional
commitment and social support, may also influence academic performance, and these are factors
not measured by student engagement indicators. The differences in the student engagement
levels between transfer and native students suggest that their experiences vary, and therefore
more research is needed to confirm the differences and, if these differences do exist, to examine
the reasons.
Lack of Research Differentiating the Types of Transfer Students and Their Engagement
Most of the research has examined the reasons why students transfer, not their experience
after the transfer, and even fewer studies have focused on the student engagement of transfer
students. One of the biggest obstacles that transfer students face after their transfers is social
13
integration. Townsend and Wilson (2006) conducted a single-institution study and looked at
students who transferred from a small community college to a large 4-year institution oriented
toward traditional-age, full-time residential students and concluded that transfer students did not
make many social connections with peers at the host institution because they were much older
than their peers and commuted. Others agree that transfer students have less focus on student
engagement and rely mostly on their interactions in the classroom for engagement and have little
social contact outside of class (Borglum & Kubala, 2000). But none of these studies
differentiated between transfer student type.
The time of transfer is also important for student engagement. Ishitani and McKitrick
(2010) compared the student engagement of community college transfer students to that of native
students at the 4-year colleges and found that the first group was less engaged than native
students and also that students who transferred later were less engaged than students who
transferred earlier in their academic careers. Student engagement research has found that transfer
students tend to be marginalized, with the majority of this research focused on traditional non-
transfer students, who have different background characteristics and experiences than traditional
students. Today, close to half of all students are age 21 or younger, and about 22% are over the
age of 30 (Baum, Ma, & Payea, 2013). By institutional level, for 2012, 12.7% of students ages
18 to 24 were enrolled in 2-year institutions, while 28.3% were enrolled in 4-year institutions
(U.S. Department of Commerce, 2013). Within the transfer group, about one-third attended 2-
year institutions and transferred to 4-year colleges by the age of 25 (Surette, 2001), and most
transfers have been found to be 29 years or older by the time they graduate from a 4-year
institution, in contrast to the average age of 22 years at graduation for non-transfers (Phillippe &
Patton, 2000).
14
Some have cautioned that the engagement construct relies too heavily on the assumption
that students are full-time, traditional-age, and residential students, and that it omits students
from diverse backgrounds and historically underrepresented groups (Bensimon, 2007; Harper &
Quaye, 2008). While generally students from all backgrounds benefit from student engagement,
conditional effects apply; meaning some activities have a higher impact on certain students and
less impact on others (Pascarella & Terenzini, 2005). There has been limited attention to how
transfer students differ from their non-transfer peers as to their level of engagement in college.
Research studying variations in engagement levels across the transfer groups in
comparison to native students is limited. While some have acknowledged that horizontal
transfers have barely been the subject of study (Jacobs, 2004), little has done to address this
need. Only in recent years have a few studies focused on student perceptions of the transfer
process, such as feelings, experiences, satisfaction, transition, and adjustment after the transfer
(Cameron, 2003; Laanan, 2001). In previous literature, scholars have examined the community
college experience on one hand and the traditional 4-year student on the other, but there is a
strong need for researchers to examine an overlooked segment of students--horizontal transfers--
meaning those students that transfer from one 4-year institution to another and their experience
on campus. In particular, it is important to investigate not only why students transfer, but what
happens to them after the transfer. Up to this point in time, horizontal transfers have been treated
as students who stop or drop out of education, while, in reality, some transfer students continue
in higher education. The graduation rates of horizontal transfers have not been reported by
institutions (Cook, 2012), and it is not clear what makes these students successful. Currently,
there is a lack of focus and effort toward addressing the unique student characteristics of this
group. Understanding who these students are, where they attend college, and how they utilize
15
their time can make all of the difference in their chances to obtain a bachelor degree and
continue on their path to financial independence. Student engagement has been a part of the
research lexicon for a couple of decades. Its role is clear for students who begin and graduate
from the same 4-year institution. Institutional initiatives such as the first-year experience, living
and learning communities, and peer and faculty support are all examples of institutional efforts
aimed at improving academic success, and they are the result of research on student engagement.
These efforts, however, have been concentrated on traditional students and not on the transfer
population. In the light of the President’s plan to fund community college education, and its
potential impact on enrollment and inclusion in higher education, more research on the link
between student engagement and academic success by student type is needed.
Issues with Measuring Student Engagement
Even with reliable tools such as the National Survey of Student Engagement student
engagement remains difficult to measure. Self-reported student data raises questions about
validity and reliability, as students may find questions unclear or uncomfortable to answer. In
addition, student engagement does not measure other important factors such as scores on
standardized admissions tests, which tend to be strong predictors of first-year academic success.
Researchers need to be aware that these and other factors influence student engagement, and
studies must examine these additional aspects, relevant to all student groups.
In conclusion, transfer students, whether they come from community colleges or other 4-
year institutions are often overlooked in the research, yet they are significant in numbers and
important to institutions and the economy at large, as transfer students may fail to connect with
the host institution, underperform, or leave yet again. Failure of institutions to engage them
leaves great consequences, as it negatively affects other educational outcomes such as GPA.
16
There is a complicated interplay between a variety of social, economic, cultural, and education
factors that influence student success in college (Kuh, Kinzie, Buckley, Bridges, & Hayek,
2006). In addition to persistence and graduation rates, student success is commonly measured by
academic achievement, engagement in educationally purposeful activities, satisfaction,
acquisition of desired knowledge, skills and competencies, attainment of educational objectives,
and post college performance (Kuh et. al., 2006). While academic preparation has been found to
be important in predicting student success in college (Dennis, Phinney, & Chuateco, 2005), what
students do in college, meaning the activities students engage in and institutional efforts to create
conditions for student success, can become the deciding factor in academic success (Kuh et al.,
2006).
Overview of This Study
Given the persistent differences in student graduation rates for transfer students and the
inconsistencies of student engagement research across student type (native, vertical, and
horizontal transfers), and lack of research on transfer students in general, this study sought to
explore whether transfer students were as successfully engaged in their education as students
who did not transfer. Research comparing the different engagement levels of students from
different transfer status backgrounds can be helpful to meet this need and to highlight the
importance of student engagement in general.
This study will remedy the limitation in the literature by examining whether differences
in engagement exist between student transfer status types at all, and what other key
characteristics are related to student engagement. To this end, I propose the following research
questions:
1. Is transfer status related to student engagement levels in general?
17
2. If yes, does such relationship differ by transfer type (vertical, horizontal, vs. native)? and
3. What other student characteristics are associated with student engagement?
The conceptual framework for this study draws on the construct of student engagement to
explain differences between transfer and native students, as literature and prior research suggest.
Common institutional engagement practices are also reviewed in this study in order to
understand institutional efforts to foster student engagement and environmental impacts on
student engagement. The sample used for this study comes from the National Student
Engagement Survey (NSSE, 2009), which is the most comprehensive national study of student
engagement. Given the student engagement construct and student type, in addition to descriptive
statistics standard multiple regression is used in this study.
Significance of the Study
As economic inequality remains an issue, investing in higher education is widely
recognized as among the best means to ameliorate the human condition (Baum, Ma, & Payea,
2013). Today, more students enroll in higher education than in any previous decade and the
numbers continue to grow (U.S Department of Education, NCES, 2015a). There is a vast number
of students who transfer between institutions or enter college at a later time in life or after a
pause. While these enrollment patterns show positive trends in enrollment, completion rates
remain low in light of enrollment success among diverse socio-economic and racial groups and
the transfer path so many take. As previously mentioned, one way to improve educational
outcomes among all student groups, especially for transfer students, is to focus on student
engagement.
Student engagement is shown to matter more for student learning than institutional
characteristics or prior experience in higher education. Student mobility and transfer patterns
18
indicate that at least one-third of all students would transfer at some point in their journey to a
bachelor’s degree however this research still remains limited to transfer students. What the
literature has suggested, is that differences exist between student engagement and levels of
transfer and non-transfers, especially for first-year transfer students who show the lowest levels
of engagement (NSSE, 2013a, 2014).
Besides student efforts to engage in their college experience, the conditions that
institutions create are also important for student engagement, regardless of student status. High-
impact practices, learning communities, collaborative learning (Brownell & Swaner, 2009),
student-faculty contact, active learning, and respect for diverse backgrounds (Pascarella &
Teremzini, 2005) all suggest that students and institutions both play a role in student
engagement. However, transfer students face a different set of challenges that native students.
A growing number of studies point out the importance that student engagement plays in
student learning (Kuh, 2003; Pascarella & Terenzini, 2005). Some institutions are more effective
in promoting learning and creating educationally effective environments than others. Certain
practices, such as faculty interaction or collaborative learning, are well established as beneficial
to student success, while other practices do not always work well for all students or institutions,
especially for transfer students who have shown to engage at lower levels than native students.
Policymakers and institutional leaders must understand the importance and value of student
engagement, especially for the more marginalized student populations, such as minorities, older
students, and transfers.
The comparison of transfer-student completion rates and engagement levels to those of
native students has suggested that there are some barriers to transfer student success. Time
between enrollments is a crucial barrier to success, as institutional policies facilitating the
19
transfer process must be in place. Furthermore, as the number of credits at the time of transfer
matters to student success, it is necessary for community college and 4-year institutional leaders
alike to seek ways to help their students to reach the maximum number of credits prior to
transferring out. Unless campus and public policymakers address the lag in educational outcomes
between the two groups, transfer students will continue to lag behind.
Recent studies (Bailey & Alfonso, 2005; Crystal, Gansemer-Torf & Laanan 2013;
D’Amico, Dika, Elling, Algozzine & Ginn 2013; Lester, Leonard, & Mathias 2013) have already
looked at differences in engagement levels between transfer students and native students and
have sought to understand happens to transfer students after the transfer. However, these studies
draw data from either a single institution or utilize a very small sample of participants or
generalize prior results. What the present study contributes to this research is that it is
comprehensive, uses a large national data set, and engagement levels are compared within
student groups and clusters within institutional type.
This study is significant because it takes another look at the transfer population on a
national level, addresses some of the gaps in the literature, and contributes to the line of research
on student engagement with a focus on the transfer population. Most of the studies on student
engagement focus on the traditional non-transfer student experience, and few studies have
examined community college transfer students. Previous research has also suggested that transfer
students exhibit lower levels of engagement in comparison to non-transfers, and this study
identifies how wide these differences are, especially within the transfer student population,
which is a topic largely absent in the literature.
20
Organization of the Dissertation
This dissertation includes four more chapters. Chapter II discusses theories of student
engagement and synthesizes relevant studies on student engagement of transfer students. Chapter
III presents the research design, including the data source, the sample, research methods, and
analytic procedures. Chapter IV reports the finding of the data analyses. Chapter V presents the
conclusions, implications, and recommendation for future research.
21
CHAPTER II
LITERATURE REVIEW
With the increase in access to higher education in the past century, student development
theories have sought to understand student learning and interactions with the educational setting
by intertwining fields of psychology, sociology, and education. In the early 20th century for
example, psychological theorists examined human behavior and development beyond just moral
character formation and have focused specifically on the experiences of students in college
(Upcraft & Moore, 1990). This marked the start of student development theory. Student
development theory has continued to play an important part in higher education research as
students have faced new challenges. Among these contemporary factors are price, student
choice, and mobility, all of which influence the decision to transfer. For the purpose of this
study, the terms student engagement, involvement, and integration are used interchangeably to
define the student engagement outcome. As a result of the evolution of student engagement
theory, the nuances between these terms have become insignificant, and the terms have been
increasingly used to carry the same meaning in the literature.
This chapter first introduces the concepts of student engagement and the transfer process,
review and analyze then appropriate theories generally used in student engagement research are
reviewed and analyzed, and then the prior research on the effects of transfer on college student
engagement is synthesized. In conclusion, this chapter will propose a comprehensive conceptual
framework to research student engagement levels for transfer students. Because this study
focused on transfer students who came from community colleges as well as other 4-year
institutions, this literature review focuses on student engagement at 4-year institutions since this
22
is the point of their academic journey where their engagement levels were compared and data
was available.
Defining and Measuring Student Engagement
Before reviewing theories and literature, it is important to understand how student
engagement was defined and measured in prior research. Kuh, Kinzie, Cruce, Shoup, and
Gonyea (2007) defined student engagement as participation in educationally effective practices,
both inside and outside of the classroom that lead to a range of measurable outcomes. This
definition also includes the “quality of effort students themselves devote to educationally
purposeful activities that contribute directly to desired outcomes” (Hu & Kuh, 2001, p, 3). In
other words, student engagement is “the time and effort students devote to activities that are
empirically linked to desired outcomes of college and what institutions do to induce students to
participate in these activities” (Kuh, 2009a).
Alexander Astin’s student involvement research in the 1980s laid the foundations for
modern day student engagement research and theory. Astin (1984) defined student involvement
as “the amount of physical and psychological energy that the student devotes to the academic
experience” (p. 297), and he argued that for learning to occur, students need to actively engage in
their educational environment and educators need to provide in and out of classroom experiences
to facilitate student learning behavior. Alexander Astin emphasized the role of student
involvement in development and inspired valuable research in education.
The basic tenets of the student engagement construct incorporate concepts and research
on student involvement, time on task, academic and social integration, and what are considered
good practices in higher education. According to Kuh (2009b), research on student engagement,
as it is used in research today, dates as far back as Ralph Tyler’s research of time on task and its
23
connection to education in the 1930s. Tyler was the first to demonstrate the positive effects of
the time students spent on task and learning (as cited in Merwin, 1969). A few decades after
Tyler, C. Robert Pace focused on the concept of quality of effort and developed the College
Student Experience Questionnaire. His research showed that students gained more from their
education when they invested a greater quality of effort in their education and when they
invested more time in learning and educationally purposeful activities, such as studying and
interacting with peers and faculty (Pace, 1990). Astin (1984) later recognized the importance of
the quality of effort in education, and this inspired his student involvement theory. Pace’s
research on the quality of effort and Astin’s research on student involvement have inspired other
prominent researchers, such as Chickering and Gamson (1987), whose research focused on good
practices in undergraduate education and Vincent Tinto’s ideas about social and academic
integration and student departure theory. This line of research has contributed to the construct of
student engagement and the NSSE instrument.
The engagement principle is easily understood and it rests upon the assumption that,
the more students study a subject, the more they know about it, and the more students
practice and get feedback from faculty and staff members on their writing and
collaborative problem solving, the deeper they come to understand what they are learning
and the more adept they become at managing complexity, tolerating ambiguity, and
working with people from different backgrounds or with different views. (Kuh, 2009b,
p.5)
There are scholars who do not fully agree that involvement and engagement carry the
same theoretical and practical meaning. The differences between the terms involvement and
engagement are mostly rooted in the role institutions play in student development. Student
24
involvement implies that the role of the institution is minimal because the role of institutions was
not fully considered during the early stage of coining the term, student engagement, while
engagement suggests that the role of the educational setting is pivotal, which later research has
explained. In other words, student involvement pertains to the responsibility of the students to
participate in their college experience given the educational setting, and the definition focuses on
the amount of energy that the students invest in educationally purposeful activities. Student
engagement adds a focus on the role that institutions play in creating educationally purposeful
opportunities for students to take part in, and it holds that the institutions are responsible for
contributing to positive student experience and growth (Wolf-Wendel, Ward, & Kinzie, 2009).
While there are certain nuances that are different between involvement and engagement, there is
a significant overlap of the terms; enough overlap that the terms could be used interchangeably.
Astin has also indicated that, there are “no essential differences” between the terms; a claim
supported by the NSSE’s former director, George Kuh, as well (Axelson & Flick, 2011; Wolf-
Wendel, Ward, & Kinzie, 2009). In fact, student engagement has come to refer to how interested
in involvement students are in their education, and how connected they are to their institutions
and each other. For the purpose of this study, involvement and engagement are used
interchangeably.
The definition of and measures for engagement are also reflected in various research
studies. Pascarella and Terenzini (1991, 2005) have made a significant contribution to the
definition of student engagement and have demonstrated ways to evaluate the construct and its
contribution to higher education. Their work focuses on the relationship between students and
the educational setting and how institutions influence a variety of learning outcomes including
student engagement. Their first research study (Pascarella & Terenzini, 1991), a meta-analysis,
25
was based on 2,600 studies, and their second publication (2005) contained direct applications to
student engagement and explored the institutional effects on student learning and the role of
institutions in creating and maintaining student engagement opportunities.
Others, including Lester, Leonard, and Mathias (2013), have also contributed to the
definition by stating that the engagement is not about what students “bring” to college, but it is
what they “do” in college, as far as behavior, such as pursuing educationally meaningful
opportunities and the nature of the educational setting that supports or inhibits learning and
positive outcomes, such as retention and graduation. What this definition adds is that institutional
practices and environment can affect student engagement, and therefore institutions can
encourage or inhibit student engagement. Schuetz (2008) offered the following definition of
engagement: “a state of interests, mindfulness, cognitive effort, and deep processing of new
information that partially mediates the gap between what learners can do and what they actually
do” (p. 18). Most often student engagement has been divided into two main components:
academic engagement and social engagement, which are often referred to as academic
integration and social integration. This line of research demonstrates how complex the construct
of student engagement really is. In research, while the principle definition of engagement
remains consistent, most studies add nuances to the definition of the term. For the purpose of this
study, these definitions accurately describe student engagement as a term and are guided the
research.
As previously suggested, student engagement is measured by the extent to which students
are engaged in good educational practices, and what they gain from their college experience
(Kuh, 2001b). There are certain metrics, such as time spent on a particular task, engagement, and
exchange of ideas with students who are from different backgrounds or attend campus activities
26
and events, which create a measure for the construct. This assessment is done by comparing
students across five distinct benchmarks, which mirrors practices outlined by Chickering and
Gamson (1987): level of academic challenge, active and collaborative learning, student-faculty
interaction, enriching educational experiences, and supportive campus environment, all of which,
research suggests, capture vital aspects of the student experience that were factored into the
creation of the National Survey of Student Engagement (NSSE).
The National Survey of Student Engagement is the largest and most comprehensive
instrument to date that measures student engagement based on measurable aspects of student
behavior and institutional effectives. The National Survey for Student Engagement (NSSE)
measures, “student behaviors highly correlated with many desirable learning and personal
development outcome of college” (NSSE, 2013b, para. 1.), and it is the most commonly used
instrument to measure student engagement among college students in the United States. Years of
research on student engagement and student success have suggested that certain behaviors, such
as interacting with peers and faculty, spending time on homework, and working collaboratively,
are positively related to positive student outcomes, such as persistence and higher GPA. This
survey is the most widely used measurement tool in student engagement research, and
engagement levels are measured by five distinct benchmarks that were derived from the research
and these include: Level of academic challenge (LAC), active and collaborative learning (ACL),
student-faculty interaction (SFI), enriching educational experiences (EEE), and supportive
campus environment (SCE).
Defining and Measuring Transfer Status
The second term discussed is student transfer. Today, about one-third of all college
students transfer at some point in their higher education (Hossler, Shapiro, & Dunbar, 2012).
27
Understanding the types of transfer is important, as the transfer experience is often disorganized,
moving back and forward and in unpredictable fashion (Hagedorn, Moon, Cypers, Maxwell, &
Lester, 2006). Traditionally, the term transfer student refers to a student who enrolls at a 4-year
institution after initially enrolling at a community college (Jacobs, 2004). However, research has
highlighted that students are far more mobile and many transfer multiple times across multiple
institutions and institutional types and their reasons vary.
Vertical Versus Horizontal Transfer
A vertical transfer student is one who moves directly from a 2-year community college or
a vocational school to a 4-year college or university in order to obtain a bachelor’s degree (Kirk-
Kuwaye & Kirk-Kuwaye, 2007). According to researchers, most institutional policies and
practices at 4-year institutions are designed for this type of transfer student, and there have been
a variety of partnerships between community colleges and 4-year institutions so as to facilitate
the transfer process (Kirk-Kuwaye & Kirk-Kuwaye, 2007). There is significant amount of
research being conducted on community college students and on the vertical transfer. Many state
institutions have policies and practices to facilitate the process for this group.
A horizontal student transfer is a student who starts at a 4-year institution and later
transfers to another 4-year college or a university. This includes students who transfer within the
2-year sector (Jacobs, 2004). Unfortunately, research on horizontal transfers and navigating
through college is extremely limited (Allen, 2007). The experiences and characteristics of the
horizontal transfer student differ from of those of the vertical transfer. Although the horizontal
transfer process assumes that students in this category move in a linear progression, they differ
from vertical transfers in that they move from one 4-year institution to another. It is often
assumed that horizontal transfers have few issues transitioning because of their prior academic
28
experience at a 4-year institution. In reality they have a harder time engaging on campus and
have lower academic performance rates than vertical transfers (Kirk-Kuwaye & Kirk-Kuwaye,
2007). The reasons behind the horizontal transfer are clearly different that other the reasons
behind other types of transfer but there are only a very few studies today which look this
segment of the student population.
Reverse Transfer Versus Swirling Transfer
While not the focus of this study, two additional types of transfer students are worth
mentioning. Reverse transfers are those students with credits from a 4-year college or university
who choose to reverse their course of study and enroll at a 2-year community college after they
have attended a 4-year institution (Hagedorn & Castro 1999). The other type of transfer student
is the swirling transfer. Rather than progressing through the institutions in a sequential manner,
the swirling transfers choose to enroll in a back-and-forth pattern; attending one institution for
one term, moving into a second institution the next term, and then transferring back to the
original institution the next academic term (McCormick, 2003). Because the focus of the current
study is on student engagement at 4-year institutions and the available data is limited, reverse
and swirling transfers were excluded from review and analysis.
Transfer Student Characteristics and Effects of the Transfer
The transfer rates are almost equal between horizontal transfers and vertical transfers:
each is about 25 %. The other half of all transfers, happens with downward or between
community colleges only (Hossler, Shapiro, & Dunbar, 2012), and there has been significant
research in recent years that has examined this trend. With such mobility between institutions,
understanding the educational experience of transfer students is important in order to know how
29
to create incentives for student engagement. Rich (1979) described several common
characteristics among transfer students which are also true today: (a) they often harbor
preconceived opinions about their new environment, and these opinions will influence how they
interact with the new institution; (b) transfer students often believe that the change in college
environment will remedy past academic issues; (c) a transfer student’s social adjustment is
dependent above all on his or her mindset; thus programs such as orientation must address issues
such as involvement, desire to belong and institutional fit and social adjustment; and (d) transfer
students perceive that they have to adjust to campus situation that they may view as less
favorable than their previous institutions. This perception is largely due to issues related to
starting over and finding a niche in a new environment. These characteristics concern student
expectations from their transfer institutions and are common across transfer type. In terms of
their background characteristics, as compared to native students, transfers are more likely to be
older, tend to not live on campus, are more likely to work off campus, and are more likely to care
for family members (McCormick, Sarraf, BrckaLorenz, & Haywood, 2009).
In addition to student characteristics unique to the transfer group, the transfer process
comes with many challenges. Lester (2006) noted that most transfer students are concerned with
the following: academic concerns, financial concerns, grades, and ethnic differences.
Researchers have suggested further differences between transfers and native students. Among the
biggest concerns for transfer students has been the sharp decline in GPA after transfer (Glass &
Harrington, 2002) and lower graduation rates as compared to native students (Long &
Kurleander, 2009; Ishitani, 2008). The phenomenon, known as transfer shock (as coined by
Hills, 1965) refers to the initial GPA drop after transfer. Students usually recover after their first
semester at the new institution. This fact suggests that there are assimilation and adaptation
30
issues that transfer students encounter at their host institutions. Those transfers who recover
successfully after transfer shock are likely to graduate with GPAs higher than those of native
students, and such academic adjustment is directly related to intellectual self-awareness and
confidence (Laanan, 2007). The issue of transfer shock and lower academic performance for
transfer students is more complicated than simply lower GPAs in their first semesters.
Researchers have found differences in transfer shock between men and women, with female
student academic performance being significantly better a than that of male students (Al-Sunbul,
1987; Keeley & House, 1993), and transfer students who earned high GPAs at their initial
institution tended to earn high grades at their transfer institutions (Carlan & Byxbe, 2000).
Research has suggested that social and academic integration are important factors for
student success, namely retention rates and GPA as found by Tinto. The environment plays an
important role in defining the student experience, and students are more likely to succeed when
they find themselves in a supportive environment. Social integration, including integration with
peers as well as faculty, is just as important for transfer students as it is for freshmen, particularly
for retention and graduation (Pascarella, Smart, & Ethington, 1986; Tinto, 1975;). Studies have
shown that among all of the various forms of social integration that take place in college, peer
group association is most directly related to individual social integration (Tinto, 1975). This
could be a particular challenge for the transfer student population, due to some of its specific
characteristics, such as coming to the educational setting later on and having responsibilities
outside of academic life, such jobs or caring for dependents. Not only are making friends and
establishing social connections on campus challenging initially for transfer students, but some
even report that the problem increases after the first year, when native students lose motivation to
31
associate and invite transfers to participate in collaborative assignments, study groups, and other
social and academic opportunities (Townsend & Wilson, 2006).
Review of Conceptual Framework of Student Engagement Research
In order to explain the relationship between transfer status and student engagement, this
section provides a solid theoretical framework to understand the engagement differences
between transfer and non-transfer students. The theories reviewed inform how and why the
variables in this study are connected. Student engagement theory will provide the framework for
this study because it conceptualizes the NSSE survey as well as explains how students interact
with the learning environment. Since this study involved transfer students as well, understanding
the differences in engagement between transfers and non-transfers would not be possible without
understanding the transfer process. Vincent Tinto’s (1987, 1993) integration framework will
inform their experience.
Student development theories generally fall into four main categories. Psychological
theories focus on the self-reflective and interpersonal aspects of students’ lives. These theories
explain how students’ perspectives of their own identity and society evolve through the personal
conflicts and crisis. Cognitive-structural theories focus on how students think, reason, and
organize and make meaning of their college experiences. Person-environment interactive
theories focus on how the educational environment affect student behavior and grown. And
lastly, humanistic-existential theories describe how students made decisions that affect
themselves and others (Long, 2012). There has been significant research on student engagement
in recent years, and there are several theories commonly used to conceptualize this construct. In
addition, the diversity of the student experience is forcing many American colleges and
universities to pay closer attention to student engagement as it is affected by transfer status.
32
These theories fall under the person-environment interactive theories. Multiple studies have been
conducted in recent years that have explored student involvement at community colleges and
students at 4-year institutions, and there are several common theories explaining the construct of
student engagement and its relationship to transfer status. The theoretical framework that follows
encompasses theories and models that explain student engagement and the transfer process.
Because no single theory is capable of depicting the complexity of the college experience for
both transfer students and native students alike, the use of more than one theory provides insight
into relationship between student engagement and the transfer process. Since student engagement
was the outcome variable in this study, theories about the quality of effort and student
involvement provided a significant part of the framework for this study. Pascarella and
Terenzini (1991) model of assessing student change focuses on the direct and indirect effects of a
college or university’s structural characteristics, and its campus culture. Vincent Tinto’s (1987,
1993) integration framework will inform the understanding of the transfer process and how
transfers adjust to their new environments. These theories summarize the person-environment
interactive theories and were particularly useful because they all informed the research on
student engagement, the transfer process, and the effect of educationally purposeful activities for
transfers and non-transfers alike, and they address the complicated relationship between the
individual and the environment that this study investigated. These theories are among the most
common ones in the research of student engagement of transfer and native students.
Student Engagement Theory: Theoretical Construct
By definition, the construct of student engagement has two main components. It
embodies the amount of time and effort students put in their studies and other educationally
purposeful activities that lead to outcomes of student success, such as high GPA, persistence, and
33
graduation rates. It also includes programs and services and learning opportunities that
institutions create for their students (Kuh, 2009b). Student engagement theory incorporates ideas
from Pace’s (1980) quality of effort, Astin’s (1984, 1999) involvement theory, and Chickering
and Gamson’s (1987) seven good practices in undergraduate education, as discussed at the
beginning of this chapter.
Quality of Effort
One of the first theories to gain a prominent place in student engagement research was
Pace’s (1979, 1984) theory on the Quality of Effort (QE). As part of this research Pace
developed the College Student Experiences Questionnaire (CSEQ), which was the first attempt
to operationalize and assess student effort. According to Pace (1992, p. 4): “accountability for
achievement and related student outcomes must consider both what the institution offers and
what the students do with those offerings.” This implies that institutions have a responsibility to
create opportunities for learning, while students have certain obligation for involvement. His
theory suggests that student growth and development require that time and effort be invested by
students, and that what they learn in college will largely depend upon the quality of their efforts
toward their college experience; meaning how much effort is expended and how they utilize
campus resources (Pace, 1979). Pace also maintained that there were various types of academic
and social involvement, including library experiences, experiences in writing, the student union,
experiences with faculty, and others. According to his theory, quality of effort comes from
recognizing that certain activities take more effort and have greater impact on growth and
development. His instrument measured the quality of effort in various environmental settings,
such as libraries, classrooms, and laboratories, and these experiences reflect, “unidimentional
hierarchy, meaning they are interdependent, in the sense that engagement in higher quality and
34
most difficult activities subsumes engagement in the lower quality or easier activities” (Pace,
1984, p. 11).
Pace’s quality of effort theory enhanced the understanding of student engagement. The
QE framework posits that development and educational outcomes are products of the time and
effort students invest in educationally purposeful activities. When applied to transfer students,
the QE framework highlights the differences of educational experiences between transfer
students and native students and the processes by which they are involved in certain academic
and social activities. Since Pace focused on the quality time invested in academic and social
experiences on campus, for transfer students and their unique characteristics, time impacts
factors like involvement, satisfaction, and adjustment. The role of the environment is also
important, as programs and services at 4-year institutions may not adequately respond to the
needs of transfer students and, as a result, poor quality of effort may reflect poor engagement and
weak educational processes.
Astin’s Student Involvement Theory
Alexander Astin’s (1993) work on student involvement has had a significant influence on
the development of the student engagement construct. The most basic assumption it maintains is
that the more time and energy students invest in academic and co-curricular student activities the
more learning that takes place (Astin, 1977; 1993). Building on Pace’s (1979) QE model,
involvement theory suggests that there are certain factors that influence student engagement,
such as time spent on a task and interactions with faculty and peers, that, in turn, are positively
related to educational outcomes. One of the strongest aspects of the involvement theory is that it
can explain most of the empirical knowledge about environmental influences on student
development that researchers have gained over the years (Astin, 1984). The theory of student
35
involvement is network-based and emphasizes the student relationship with the educational
setting, and focuses on how student input effects the quality of output. However, there is a
behavioral component: “It is not so much what the individual thinks or feels, but what the
individual does, how he or she behaves, that defines and identifies involvement” (Astin, 1984, p.
298).
The conceptual basis of student involvement is rooted in a longitudinal study of college
dropouts (Astin, 1975). Astin conducted a nationwide survey with a representative sample of
undergraduate students that examined the extent to which certain factors, such as academic and
family background, school cost, religious affiliation, study habits, and institutional practices
influenced a student’s decision to drop out of higher education. Factors in the college
environment were identified that significantly affected persistence rates. He concluded that the
factors that contributed to the student remaining in college suggested involvement, and the
factors that contributed to dropout suggested lack of involvement. Later, in his initial publication,
Four Critical Years, Astin (1977) looked at changes in attitudes, beliefs, behavior, academic
achievement, and career path, examined the relationship between student satisfaction with the
college environment, and tracked how these characteristics changed. His theory of involvement
officially was defined when Astin and his research team published an article in the Journal of
College Student Personnel in 1984 titled, “Student Involvement: A Developmental Theory for
Higher Education.” In his article Astin defined involvement as the physical and psychological
energy students invest in their academic experiences. Therefore, a highly involved student is one
who devotes considerable time and energy to studying, spends time on campus, participates in
student life on campus, and has frequent interactions with faculty and peers. An uninvolved
36
student, consequently, is one who neglects studies, spends little time on campus, refrains from
extracurricular activities, and rarely has contact with professors and other students.
Focusing on student effort, Astin (1999) suggested five main postulates about
involvement: a) includes an investment of physical and psychological energy in various objects
or tasks; (b) occurs along a continuum, meaning different students manifest different degrees of
involvement in a given object, and the same student manifests different degrees of involvement
in different objects at different times; (c) possesses both quantitative and qualitative features--for
example, the extent of a student’s involvement in academic work can be measured both
quantitatively and qualitatively; (d) the amount of learning and development is directly
proportional to quality and quantity of student involvement; and (e) the more effective
educational policies and practices are, the more they promote student involvement. In addition to
the five postulates, Astin revealed three other principles that were rooted in his conception model
of involvement. First, student’s psychic and physical times are finite. This suggests that the most
valuable resource is time, and Astin referred to it as “zero-sum game”(p. 523), meaning that the
time and energy that students invest in family, friends, jobs, and other activities outside of school
would take away from the time left for educationally purposeful activities. Second, “time
devoted” translates to involvement. This principle implies that the extent to which students can
achieve a particular educational goal is a function of the time and effort they devote activities
seeking to produce these ends. Lastly, though the construct of student involvement resembles the
psychological construct of motivation, Astin preferred the use of the word involvement:
“Involvement is more susceptible to direct observation and measurement than is the more
abstract psychological term of motivation” (p. 301).
37
Involvement is typically utilized in research that has used Astin’s Inputs-Environment-
Outcomes (or I-E-O) model. The premise of the model is derived from the core tenets of Astin’s
theory of student involvement and is used to provide accurate assessment of how the
environment impacts student outcomes, while input differences are controlled. This sociological
model of college impact describes how student attributes affect academic success. The model
holds that educational assessments are not complete unless the evaluation includes information
on student inputs (I), educational environment (E), and student outcomes (O) (Astin, 1993). The
student characteristics at the time of entry define inputs; the various programs and policies,
faculty and peer interactions and all other educationally purposeful activities that students are
exposed to comprise the environment; and student characteristics at the time of degree
completion define the outputs in this model (Astin, 1993; Terenzini & Upcraft, 1996). According
to Astin (as cited in Wolf-Wendel, Ward, & Kinzie 2009), “The advent of involvement theory
led to the elaboration of the IEO model to include ‘involvement’ (also called ‘intermediate
outcomes’) as an additional construct situated between Environment and Outcome (IEO)” (p.
411). Since the I-E-O model focuses on the impact of the environment, campus and academic
life offer an opportunity for student involvement, showing the effects of various outcomes
affecting student development.
In examining how the college environment affects student development Astin (1996)
concluded that the most important type of involvement was academic involvement, including
interactions with faculty and peers. Astin’s theory of student involvement holds that in order for
growth to occur, students must be actively engaged in their environment and institutions must
provide learning opportunities in and outside of the classroom. Applying Astin’s I-E-O model
may be useful for understanding the student engagement of all students, but particularly for
38
transfer students, whose characteristics and environmental interactions lead to quantitatively
different college experience.
Research on student involvement has found that high levels of involvement are linked to
positive outcomes, such as satisfaction with the college experience, high academic achievement,
and persistence in higher education (Kuh, 2001b). This line of thinking is instrumental to
connecting effective educational practices to student outcomes (Wolf-Wendel, Ward, & Kinzie,
2009), and if differences in engagement levels exist, as the literature suggests, what are the
practices that are most helpful to reduce these differences in student engagement. Astin’s student
involvement theory warrants use in predicting student engagement. The theory offers a way to
measure academic performance, other factors of student success, and college satisfaction. It also
suggests that the role of the institution is central to student success and that institutional practices
affect student outcomes. Although Astin’s theory of student involvement was developed as a
result of studying persistence among traditional college students, it is easily applied to the study
of horizontal and vertical transfer students at 4-year institutions. Not only does Astin’s
theoretical framework offer a way to measure components like time and effort, but it also offers
a way to understand the complex academic and social adjustment process that transfer students
encounter. According to Laanan (2004), when applied to vertical or horizontal transfers, the
utility of Astin’s involvement theory is clear: “ if […] transfer students are involved in their
social and academic activities at the two-and four-year levels, they will more likely experience a
successful or positive academic and social adjustment at senior institutions” (p. 335). Therefore,
if transfer students are involved in their educational development in their initial institution, they
are likely to have similar levels of involvement at their host institutions.
39
Pascarella’s Model for Assessing Student Change
Another theory belonging to the person-environment interaction category of student
development theories is Pascarella’s (1985a) model for assessing student change. Similar to
some of Astin’s concepts about the role of the institution in student development and Pace’s
notion of quality of effort, Pascarella’s focused on the institution’s structural characteristics and
the campus culture in addition to student characteristics. According to him, student development
and growth are a function of the direct and indirect effects of five major sets of variables: (a)
students’ backgrounds and precollege characteristics; (b) the structural and organizational
features of the institution (such as size, selectivity, and residential character); (c) institutional
environment or campus culture; (d) frequency and content of student interactions with the major
socializing agents on campus (faculty and peers); and (e) the quality of effort put forward by the
students (Pascarella, 1985a, p. 31). Pascarella’s model for assessing student change is seen as a
function of students’ background characteristics, interactions with major socializing agents, and
the quality of student efforts in learning and developing. He also believes that structural features
of the institution have indirect effects on student development, and that they are mediated
through the institution’s general environment, the quality of student effort, and student
interactions with peers and faculty. Pascarella’s model for assessing student change is a general
causal model that assesses student change. It is helpful in understanding student engagement and
the experience of transfer and non-transfer students because it suggests that the campus
environmental and structural characteristics affect student development and that student
characteristics affect student development and change.
40
Tinto’s Integration Theory, Student Departure and Engagement
One of the most influential theories to examine the transfer process and the relationship
between transfer and engagement came from Tinto (1987, 1993). Initially, His theory focused on
student retention, and he theorized that students were more committed to their institutions and
more likely to graduate if they were socially and academically integrated into their environment.
According to him, there are different types of leaving behavior: academic failure, voluntary
withdrawal, permanent dropout, temporary dropout, and transfer (Tinto, 1975). At the heart of
Tinto’s model is the assumption that students who are integrated into their college develop
connections and participate in college life and academic activities are more likely to persist than
those who remain on the periphery. This is consistent with student engagement theory, but Tinto
also focuses on individual characteristics that he believes affect the student’s pre-enrollment
commitment to their academic goal and the institution they choose to attend. The characteristics
that Tinto highlights as important fall into three categories: (a) individual attributes, such as race,
sex, academic ability; (b) pre-college experiences, such as school GPA and academic and social
experiences; and (c) family background factors, such as value climates, social climates, and
expectation climates. In addition to individual characteristics, Tinto emphasized that dropout is
the result of longitudinal process of interactions between the individual and the institution he or
she attends. Institutional fit and isolation are often the reasons that prevent student integration,
and students who do not feel at home or connected to their institution do not believe that an
institution can help meet their goals and they are unlikely to persist.
Tinto (1987, 1993) claimed that positive student outcomes depended upon the extent to
which a student was successfully integrated into the academic and social structures of the
41
institutions. Fitting in is more important for student success than academic preparation or clearly
defined goals. Concerned with why students transfer or depart institutions, he stated:
“Nevertheless, there does emerge among the diversity of behaviors reported in research
on this question a number of common themes as to the primary causes of individual
withdrawal from institutions of higher education. These pertain on one hand to the
dispositions of individuals who enter higher education and, on the other, to the character
of their interactional experiences within the institution following entry” (Tinto, 1987, p.
39).
Therefore, the ways that students connect with their institutions and their experiences can
be predictors of intent to transfer and level of engagement to the institution.
Tinto (1987) suggested that there are two dimensions of social integration, social and
academic, and that they both enhance and interact with one another. Academic integration takes
place when students interact with the academic opportunities created by their institutions, while
social integration involves relationships and personal connections. Tinto maintained that there
are formal and informal systems in the college setting to encourage both dimensions of
integration. He also suggested that lack of integration is the reason why some students depart
their institution or higher education altogether. Students enter with certain individual
characteristics, such as socioeconomic status, family support, clarity of purpose for higher
education, and cultural and social values, and institutions also pose certain characteristics (Tinto,
1993). Conflicts result when student and institutional characteristics fail to match and, as a result,
students choose to depart or drop out if the sources of these conflicts remain unresolved. Tinto
posited that the reasons behind student departure were mostly in three specific areas: academic
42
problems, failure to integrate socially and intellectually with the college culture, and a low level
of commitment (Tinto, 1993, p. 24).
Tinto’s theory of student departure is relevant to understanding student differences
between and within transfer student groups because of its utility in understanding the reasons for
transfer and because it focuses on social and academic integration as condition for student
success. Tinto’s theory holds that students who switch institutions for different reasons are faced
with different experiences and resources on campus and, as a result, they exhibit differences in
their engagement and satisfaction levels. Tinto (1988) suggested that for students to successfully
transition, they must first separate themselves from previous relationships. This is particularly
hard for transfer students who are likely to face difficulties integrating into the new campus
climate and their host institution may not facilitate integration as it usually does for incoming
freshmen and current students as well (McCormick, Sarraf, et al., 2009). Programs such as
orientation and other socialization opportunities are usually only available to new and current
students, and transfers are oftentimes excluded. Student departure, as for example when a student
chooses to transfer out, may generally be due to academic difficulties, inability to meet academic
goals, or failure to become or remain integrated into the institution. Student engagement is
essentially the result of institutional and student efforts, and specific behaviors and
environmental characteristics are the reason behind student departure. Understanding student
departure theory and the role of engagement in it is essential in understanding student behavior
and improving educational success.
Tinto’s theory of student departure was particularly useful in conceptualizing the present
study because it examines the relationship between transfer status and engagement from the
perspective of student engagement. Tinto’s theory suggests a negative relationship between
43
transfer status and student engagement. To clarify, because Tinto believed that integration was a
factor for student engagement, academic success, and overall assimilation to the new campus
environment, these are also among the biggest challenges that transfer students face after the
transfer. Students leave college because they are unable to successfully integrate into their
educational environment. Student engagement also relies on academic and social integration,
which may marginalize the transfer population if institutional factors serving to help with
integration do not exist.
The theoretical construct of student engagement combined with Tinto’s integration theory
and the unique characteristics of each transfer student group not only suggest that there are
differences in the student experience between students who transfer and those who do not, but
also indicate that the types of transfers may be differentially related to student engagement. My
hypothesis is that there are differences in the student engagement levels of transfers and native
students. It is derived from research on transfer students, as well as from Tinto’s theory, which
suggests that the integration process of vertical and horizontal transfers may differ in some ways.
The reasons behind the transfer for each group vary, with vertical transfers facing bigger barriers
to integration than horizontal students. Both groups, but especially community college transfer
students, often experience much different environments than the ones they are accustomed to,
due to the fact that they do not immediately connect with those who have matriculated as
freshmen (native students), they experience different institutional culture and experience initial
assimilation issues (American Council on Education, 2006). Furthermore, much of this lack of fit
is enhanced by the additional problems transfer students experience with transfer credits,
adequate housing, and class registration (Dowd & Cheslock, 2003; Townsend & Wilson, 2006).
For students who are in pursuit of bachelor degrees from 2-year institutions into a degree-
44
granting senior institution of higher education, the transfer is a necessary step to obtain the
bachelor’s degree, while the reasons behind a horizontal transfer tend to be much more varied
and oftentimes include unsatisfactory academic performance, academic, personal, or social
dissatisfaction, financial affordability, and availability of academic programs (McCormick,
Sarraf, BrckaLorenz, & Haywood, 2009). Research has found that students who begin at the
community college and later transfer to a 4-year institution encountered more barriers to
persistence, academic success, and assimilation than students who transferred from 4-year
institutions (Jacobs, 2004). Berkner, He, and Cataldi (2002) looked at other outcomes, such as
persistence, and built a profile of transfer students. Their study found that part-time enrollment,
delayed entry into college after high school, having a child or other dependents, single
parenthood, financial independence from parents, and full-time employment while attending
college all negatively affect persistence. Many of these factors also accurately describe the
average community college student (Jacobs, 2004), who is typically in his or her mid-20s and
works at least part-time (AACU, 2016; Carlan & Byxbe, 2000). Unlike horizontal transfers, who
largely share the same characteristics as non-transfers, for vertical transfers these factors add
further difficulties to transfer and integration than and this group is likely to face the same
barriers at the new institution (Jacobs, 2004) in addition to assimilating to the new environment.
The theoretical framework discussed above suggests relevant concepts and common
theories guiding the research on student engagement and transfer students. The literature review
which follows below examines research and empirical studies on transfer status and engagement
as well as student and institutional characteristics which comprise the variables examined by this
study.
45
Review of Literature: Transfer and Student Engagement
Even though the research on transfer student engagement is not robust, a few studies have
contributed to the discussion on the topic, and research on the transfer student engagement is
quite complex. In the next section, I discuss the relationship between student transfer and
engagement, and then how, if at all, the types of transfer may differentially relate to student
engagement.
Transfer Status
In general, a number of studies have suggested that the transfer student population seems
to be less engaged that the non-transfers students before controlling for student characteristics
(Kuh et al., 2006; McCormick, Sarraf, BrckaLorenx, &Haywood, 2009; NSSE, 2008). These
studies found that there are certain conditions that impact the engagement of transfer students in
comparison to non-transfers. A review of studies comparing engagement levels of transfer
students to their non-transfer counterpart suggests that while overall non-transfers are more
engaged than transfer students, the researchers cannot agree on the factors that affect the
engagement levels of the student sub-groups. This lack of understanding of the factors that affect
the transfer student population calls for more research on the topic.
The increase in the number of transfer students has led to researchers to examine the
reasons why students transfer, but few studies have detailed the transfer experience after the
transfer. Empirical analysis has found that there are differences in the engagement levels of
native and transfer students (Bailey & Alfonso, 2005; Crystal, Gansemer-Torf & Laanan 2013;
D’Amico, Dika, Elling, Algozzine & Ginn 2013; Lester, Leonard & Mathias 2013), and transfer
46
students are generally less likely to have time to become involved in campus activities outside of
the classroom due to work or family obligations. Social engagement has also been found to
suffer for transfers because social engagement comes from interacting with classroom activities
(Baily & Alfonso, 2005; Crystal et al., 2013; Tinto, 1997). These studies have found that factors
such as age, where students live, social engagement outside of the classroom, and sense of
belonging are important factors for engagement, and they were more commonly factors that
defined the non-transfer student experience.
For example, Crystal, Gansemer-Tord, and Laanan (2013) conducted a qualitative study
of 22 traditional-age students who transferred from a 2-year community college to a 4-year
institution. Specifically, their assessment looked at the reasons why students first enrolled at the
community college, the mechanics of the transfer process, and the academic and social
integration they experienced. The sample included students who transferred from one Iowa
community college into Iowa State University, a large research university. The findings included
the reasons why these students began at the community college, which included ambiguous
future goals, lack of academic preparation, the desire to save money, and uncertainty about
leaving home, and concern for the transfer of credits from the community college to the 4-year
institution. They reported that their adjustments after the transfer were challenging. They found
courses to be challenging and larger, and they reported a drop in their GPA after the transfer.
Social integration was even harder for the transfer group. Participants reported that they felt
isolated and lost, lacked a sense of belonging to the institution, and were generally less satisfied
with their experience.
Another single institution study (Lester, Leonard, & Mathias, 2013) utilized a cross-
sectional sampling design to understand more about the transfer student experiences. The host
47
institution was a large, 4-year, primarily residential, research university with a large transfer
population. While the respondents were older than the traditional population, they still
considered social engagement important, but theory relied heavily upon support from outside of
the institution and lacked social integration inside the classroom. Academic integration was
strong inside the classroom, but interactions with faculty outside of class were lacking.
Responses on institutional fit were mixed.
Baily and Alfonso (2005) presented a critical analysis of the state of the research on the
effectiveness of certain practices to increase persistence and completion at community colleges.
These practices included: advising and orientation, learning communities, developmental
education, and college-wide reform. The researchers completed a meta-analysis of data and
empirical research and concluded that, in general, community colleges did not sufficiently
engage their students and there was a general lack of consensus on what effective educational
and engagement practices were.
Lastly, D’Amico, Dika, Elling, Algozzine, and Ginn (2013) conducted a quantitative
study and developed regression models for the relationships between demographics and
background variables of interest and perceived academic and social integration for community
college transfers 6 weeks after the transfer. The researchers used a large, metropolitan, s
institution that served a great number of transfer students, and they examined regression models
for early academic and social fit and student success as measured by the following outcome
variables: first-semester GPA, second-semester GPA, second-semester enrollment, third-
semester enrollment, and academic hours earned in the first and second-semesters. The results
indicated that academic and social integration were important for transfer students who often
48
struggled at the new institution. Consistent with the studies discussed in this section, academic
and social integration happen mainly inside the classroom for the transfer student population.
Others also support these findings. Townsend and Wilson (2006) looked at transfer
student experiences in their host institutions and found that they did not make as many social
connections as their non-transfer peers because they were often much older than the traditional
students. Ishitani and McKitrick (2010) observed that transfer students were less engaged than
students who were native. Among the main reasons cited for this finding was the time of transfer
(late transfer lead to lower engagement among the transfers). In addition, part-time status was
negatively correlated to engagement for the transfer group. In conclusion, results support that
transfer students have more of a difficult time engaging on campus and that the more students are
involved both academically and socially the more successful they are in the transfer transition
and the better their student experience (Flaga, 2006). Transfer students often miss out on
programs and services such as orientation and co-curricular and extracurricular activities that aim
to facilitate the transition to campus life and help to establish some academic and social
connections, which are often available to freshmen. The lack of these opportunities for transfer
students may lead to the development of a sense of isolation (Tinto, 1988).
The research on the type of transfer and student engagement is limited. Some studies
have examined how the type of transfer related to student engagement. For instance, Roberts and
McNeese (2010) found that students were engaged at the university on statistically different
levels and it concludes that while non-transfer students exhibit higher engagement levels than
transfer students, ultimately there were no statistically significant differences within the transfer
group (vertical or horizontal transfers). Another study, Fernander (2012) found that there were
certain factors, such as student-faculty interaction and supportive campus environment, in which
49
non-transfers were more engaged than transfers; moreover, these differences persisted after
controlling for residence, enrollment status, and institutional control (public vs. private). In
conclusion, the data gathered in this study did not indicate any significant differences among
vertical and horizontal transfers.
Some variation between the types of transfer and native students exists, and their scores
on certain engagement benchmarks exist. Fugard (2009) found that on the student-faculty
interaction benchmark, vertical transfer students scored significantly higher than the non-transfer
group. McCormick, Sarraf, BrckaLorenx, and Haywood (2009) also found that non-transfers
were more involved in their college experience than transfer students on measures of student-
faculty interactions, supportive campus environment, and overall satisfaction with college. They
also found that horizontal transfers were more engaged in these benchmarks than vertical
transfers, but that vertical transfers were more engaged with their faculty than horizontal
transfers. Moreover, while non-transfers were found to be more likely to participate in activities
known to promote student engagement, the difference between non-transfers and horizontal
transfers was not significant. Not only did their background characteristics affect their academic
performance and college experience, but often times they experienced transfer shock, which was
characterized by sharp declines in GPAs during their first semester (Glass & Harrington, 2002;
Ishitani, 2008; Laanan, 2001).
Last but not least, one study undertook the goal of focusing solely on the student
engagement levels of horizontal transfers and moved beyond GPA as the sole indicator of
transition for this transfer group. The researcher found that having horizontal transfer students
who were academically prepared and actively involved with faculty and staff throughout the
entire process of transition were the most important predictors of academic success (Allen,
50
2007). The research on the experiences of horizontal transfers is very limited and further
empirical analysis of this group will likely contribute to better understanding of the experience of
this type of transfer students.
As this review of relevant research has shown, there has been an effort to understand
student engagement not only between transfers and non-transfers, but among the different sub-
groups of undergraduate students. While these studies suggest that, in general, non-transfer
students are more engaged than transfer students, this line of research also highlights the
complexity of the transfer process and suggests the need for more research from different
perspectives and settings. These studies propose that there are different factors, such as
individual characteristics, type and time of transfer, contact with faculty and peers, and
institutional environment that affect the engagement of transfer students, but there is lack of
consistency in the research on these characteristics. Understanding the unique features of transfer
students will contribute to understanding how they engage with their institutions and their
educational outcomes. This is why the present study is important.
Review of Literature: Other Determinants of Student Engagement
The abundance of theoretical frameworks on student engagement has inspired an
abundance of empirical studies that have operationalized engagement. These studies provide
empirical evidence and measures of student engagement and suggest that, in addition to transfer
status, other factors affect student engagement and educational outcomes. These factors can be
grouped into two main categories: student characteristics (such as transfer status, gender, race
and ethnicity, paternal education levels, enrollment status) and institutional characteristics (such
as institutional control, classification, size and selectivity). Astin (1993) denoted that student
characteristics are associated with student involvement and a variety of outcomes. Student
51
engagement theory suggests that engagement represents the time and effort students put into
their time and studies, as well as how institutions deploy their resources to get students to
participate in activities which research has identified as educationally meaningful for student
development (NSSE, 2015).
Student Characteristics
Gender
Research indicates that gender is a factor in student engagement, and that there are
differences in engagement levels between men and women. Kinzie, Gonyea, Kuh, Umbach,
Bliach and Korkmaz (2007) found that undergraduate women participated more frequently than
their male counterparts in educationally purposeful activities, and that male students devoted less
time and effort to challenging academic tasks, such as working hard to meet expectations and
spending time studying. Senior males also participated less often in active and collaborative
learning activities. In addition, Astin (1993) found gender differences in understanding people of
different racial and ethnic background. He reported that women reported more positive increases
in cultural awareness, or racial/ethnic understanding, than men. Others have confirmed this
finding and have concluded that men are less likely than women to engage with individuals who
hold different values and religious beliefs (Hu & Kuh, 2003).
Race/Ethnicity
The effects of race and ethnicity in higher education have been long studied. Researchers
agree that there are big disparities in graduation rates between White students and students of
color. In particular, the 4 year college completion rate for African-American and Latino students
is the lowest among all ethnic groups: only about 20.8% and 29.8% respectively, across all 4-
52
year institutions for the cohort that entered college in 2007 graduated (U.S. Department of
Education, 2014), despite the increase in access to higher education. The wide gap in degree
completion across racial categories along with public pressure for accountability (Bok, 2006) has
increased the pressure to understand and improve the factors that contribute to student success.
But when it comes to the relationship between race/ethnicity and student engagement, African-
American students tend to show higher levels of engagement than their White counterparts
(Sontam & Gabriel 2012). In terms of how prevalent the differences are within ethnic groups,
research suggests that Latino and Hispanic students have the lowest level of engagement, while
African American and Black students were at the top of all the ethnic groups and exhibited the
highest levels of student engagement, with Whites and Asians in between (Temkin, 2004).
However, perhaps due to cultural differences, Asian students were most engaged when working
alone, while Latino and Black students have been found to be the most engaged when doing
group work (Temkin, 2004). Others disagree. Research by Kuh et al. (2008) found no differences
in engagement in educationally purposeful activities by racial background. However, most
importantly, they found that African American students benefited more than White students from
increasing their engagement in educationally effective activities. In relation to other important
outcomes, they found that African American students at the lowest levels of engagement were
less likely to persist than their White counterparts, but as their engagement increased, they were
more likely than White students to return the following year.
Limited data exist in terms of tracing racial differences for transfer students at the 4-year
institutions. Laanan (1999) examined racial differences and quality of effort across racial groups
and found than non-White students were likely to have different experiences at both 2 and 4-year
institutions than White students in terms of quality of effort, perceptions of the environment, and
53
educational background. In his study, White students reported significantly higher quality of
effort with regard to faculty and learning and also reported higher GPAs than non-White
students. His study also highlighted that a significant number of non-Whites were first-
generation college students. This study is significant because it looked at the racial differences of
transfer students at 4-year institutions and highlighted how race and other factors impacted the
college experience.
Enrollment Status
Another important predictor of student engagement that should be considered is
enrollment status. Because two-thirds of students at community colleges are enrolled part-time
(AACU, 2016) and many of them continue to be enrolled part-time after the transfer, it is
important to learn about their college experience.
Crosta (2014) examined the relationship between community college enrollment patterns
and student outcomes-credential completion and transfer to a 4-year institution using data from
cohorts of first-time community college students at five colleges in a single state. He found that
students who were enrolled full-time enrollment and more likely to successfully transfer to 4-
year institutions. Adelman (2006) conducted a national study and also found that students who
did not attend full-time, who did not enroll continuously, or were unable to earn at least 20
credits by the end of the first calendar year were much less likely to earn a bachelor’s degree.
Ishitani and McKitrick (2010) compared the educational experiences of community
college transfer students and native students at one large, Carnegie doctoral-intensive, 4-year
institution. Their sample included groups of senior native and senior community college transfer
students, and they used NSSE benchmarks to assess the levels of the students’ collegiate
experiences. Consistent with the literature, they found that transfer students were less engaged in
54
the 4-year institution than native students. The results of this study also suggest that part-time
enrollment has a significant negative impact on engagement, regardless of whether students are
transfers or native to the institution.
Given that full-time students tend to spend more time on campus, they also have more
opportunities to engage with campus life than part-time students. Whether there are more
opportunities to participate in extra-curricular activities, socialize with peers across campus, or
interact with their professors, the fact that full-time students spend more time on campus is
bound to open more opportunities for engagement and make them more aware of engagement
opportunities. Research has confirmed this expectation. Recently, Laird and Cruce (2009) found
that not only do part-time students interact less with faculty and report less gains in general
education than full-time students, but most importantly, the proportion of part-time students was
found to be a negative predictor of student engagement with faculty. This means that campuses
with greater numbers of part-time students are negatively affecting the engagement of full-time
students.
GPA
Although the GPAs were self-reported, examining the relationship between GPA and
student engagement indicators was important in the present study. Since the NSSE is based on
research regarding effective educational practices that contributed to desirable educational
outcomes, engagement scores are expected to be related to certain outcomes, such as GPA. This
relationship is supported by the research of Carini, Kuh, and Klein (2009) who found that student
engagement was positively related to GPA and other education outcomes. Others have also
linked engagement scores to GPA and persistence (NSSE Psychometric Portfolio, 2009) and
have found that students who showed higher levels of engagement were more likely to persist
55
after their second semester and earn more credits after their sophomore year than students with
lower levels of engagement.
Fuller, Wilson, and Tobin (2011) examined the relationship between NSSE benchmarks
and GPA. They used both a cross-sectional and longitudinal analysis. The results of the cross-
sectional analysis found that level of academic challenge was a significant predictor of GPA for
freshmen, while active and collaborative learning was a significant predictor for seniors. These
findings suggest that at different points in academic careers, different behaviors affect
educational outcomes. However, the results of the longitudinal analysis showed that no single
NSSE benchmark was a significant predictor of GPA for either of the groups (freshmen or
seniors), even though the longitudinal variance accounted for more variance than the cross-
sectional analysis. Perhaps most importantly, the study found that each benchmark increased
from when students completed the survey as freshmen to when the group completed the survey
as seniors, suggesting that student engagement increased over time in college.
Employment Status
Because many transfer students tend to work during college (McCormick, Sarraf,
BrckaLorenz, & Haywood, 2009), employment and the number of hours students are employed
are likely to affect the time and number of opportunities students have to engage both socially
and academically. Research has consistently found a negative relationship between employment
and educational outcomes. Pascarella and Terenzini (2005) reported that the number of hours
worked had a negative impact on virtually all institutional indicators for retention. Other
educational outcomes have also been found to be negatively affected by employment status.
Pike, Kuh, and Massa-McKinley (2008) found a statistically significant negative relationship
between working over 20 hours a week and academic performance (grades). Astin (2005) also
56
studied the role of employment and controlled for student characteristics and social and
academic integration. He found that working off-campus had a negative effect on grades and
degree completion, while 20 hours or less per week on campus related positively to student
outcomes. Student engagement has also been found to be affected by the number of hours
students work. Furr and Elling (2000) found a significant relationship between hours worked and
student participation in educationally purposeful activities.
Residential Status
The literature suggests that a key factor in student engagement is living arrangement, or
whether students live on or off campus. Related to student engagement, Pascarella, Terenzini,
and Blimling (1994) concluded, “residential living during college is consistently one of the most
important determinants of a student’s level of involvement” (p. 25) because students who live in
residence halls are more likely to interact with peers and faculty, become involved in extra-
curricular activities, and use campus facilities. Pascarella (1985a) also examined whether living
on campus impacted college life using the outcome measures that included: interpersonal self-
concept, academic integration, and social integration with peers and faculty, all of which are
factors of student engagement. Using data from the Cooperative Institutional Research Program
(CIRP) survey, he evaluated academic integration, social integration with peers, and social
integration with faculty with living arrangement coded for each of the participants. He concluded
that living on campus had a direct effect on social integration with both faculty and peers.
However, there were no significant effects between living arrangement and academic integration
or intellectual or interpersonal self-concept. Schudde (2011), whose study included all
undergraduates found that students living on campus had more social support through
relationships with faculty and peers, spent less time working off campus, and spent more time on
57
extra-curricular activities than commuter students. These are all behaviors that define student
engagement. This research is consistent with that of Astin’s (1996), who asserted that student
peer groups were a power influence on involvement in the educational experience, and that it
might explain why transfer students, many of whom traditionally live off campus, have lower
levels of student engagement. Furthermore, in regard to living arrangement, Astin specifically
named living at home and commuting to campus as negatively influencing the educational
experience.
Empirical research has sought to identify demographic differences and differences in the
college experiences of commuter and residential students. A single-institution study at
Bridgewater State College, which enrolls a large number of transfer students, compared 190
commuter students to 190 residential students, in an effort to identify differences between
residents and commuters. Based on an analysis of 2008 NSSE results, it was found that
commuters worked more hours than residential students. In addition, commuters were found to
spend more hours caring for dependents. Twenty-four percent of commuters work over 31 hours
per week off campus, as compared to just 1% of resident students. Senior commuters were more
likely to be enrolled part-time than resident seniors, 24% versus 3% respectively. In addition, the
study found commuters to be older than residents, with only 23% of senior commuters falling
between 20-23 years-old versus 95% of resident senior (Bridgewater State College, 2009). An
important limitation to note is that this study gathered data from one college campus at one
particular point in time. Nationally representative data would be more likely to reveal further
differences between commuter and residential students that are relevant for students across
institutional type.
58
Kuh, Gonyea, and Palmer (2001) looked at whether commuter students were less
involved in academic life than students who lived on campus by examining the differences in
characteristics of student engagement as measured by the NSSE. This study included data from
first year and senior students, so the results should be taken with caution, as first-year students
are not relevant for this study. The characteristics are defined as benchmarks of effective
educational practices. The researchers found that students who resided on campus had the
highest scores on all of the benchmarks and this suggests that these students were more engaged
in campus life that commuter students. What these findings suggest is that the efforts put into
residence hall programming by faculty and administrators could cause a positive effect and that
one of the reason why transfer students may exhibit lower levels of student engagement is their
living arrangement, since the commuter experience is a characteristic for many transfer students.
Participating in student groups, interacting with peers and faculty, studying in groups,
and access to campus recourses all seem more easily accessible to students who live on campus.
Even though a lot of campuses have made some efforts to integrate commuter students, most
resources are not available to students with limited time on campus, which is a characteristic of a
lot of transfer students (Porter, 1999). While most of the studies discussed in this section focused
on students other than seniors, which is the key group of the present study, the literature provides
insight on how residential status affects student engagement in more general terms.
Other Factors
In addition to the aforementioned student characteristics, the literature suggests that there
may be other factors that affect student engagement. One of these factors is academic major.
McArthur (2005) examined the effects of advising on student integration and persistence at one
community college and found that students who were arts and humanities majors were more
59
integrated than the general student population. Furthermore, he concluded that arts and
humanities majors were aware of advising, acknowledged faculty’s efforts, and felt that faculty
cared about their progress more than the general student population. Others (Brint, Cantwell, &
Hanneman, 2007) also studied the impact of academic major on college experience and have
identified two distinct cultures of student engagement. The culture of engagement in the arts,
humanities, and social sciences focuses on interaction, participation, and interest in ideas,
whereas the culture of engagement in the natural sciences and engineering focuses on
improvement of quantitative skills through collaborative study with further focus on the labor
market. What this line of research suggests is that academic major affects student engagement
levels and differences in the education experience, and therefore more research is needed to
study these differences.
There have been numerous studies on athletic status. Some concerns exist that
participating in college athletics may lead to social isolation and lower engagement as student
athletes may bond with each other but not with others (Wolf-Wendel, Toma, and Morpher,
2001). Despite this possible isolation, few studies have reported that student-athletes are often
more satisfied and involved than their non-athletes (Astin, 1993; Pascarella & Smart, 1991) and
yet others (Umbach, Palmer, Kuh, & Hannah 2006) found that student athletes do not differ
greatly from their non-athlete peers in terms of their participation in effective educational
practices and where differences exist, they favor athletes. Therefore, more research into athletic
status as a predictor of student engagement is needed to determine the degree to which athletic
status affects student engagement, if at all.
60
Institutional Characteristics
Several models for student outcomes have been developed and these models suggest that
outcomes such as student engagement are affected by the human, social, and cultural capital that
students bring with them at their point of entry into the institution, as well as their experiences on
campus and aspects of the institution such as size and selectivity (Astin, 1993; Pascarella, 1985b;
Perna, 2004; Porter, 2006).
Institutional Control, Classification, and Size
There has been much debate about whether the type and size of institution really matters
for student engagement or whether student engagement is a factor of student behavior. One
major study by Gonyea and Kuh (2006) looked at religious affiliation and found that religious
affiliation explained the most variance in the following variables: participation in spiritual
activities, gains in spiritual development, and gains in ethical development. Surprisingly, the
same study found that students who were enrolled in other non-affiliated private institutions did
not differ in any significant way from students enrolled at public institutions in terms of how
often they engage in spiritual activities. However, differences were found to exist in terms of
participating in spiritual activities, engaging in deep learning, and in self-reported growth in
spirituality, ethical development, personal and social development, and social development and
intellectual skills; with students at private institutions reporting higher levels of engagement than
students at public institutions.
In terms of institutional size, it seems that large and small campuses employ different
programs and policies to encourage student engagement and that smaller school generally engage
students more effectively (Kuh, 2003). Most of these methods are naturally driven by the mission
61
of the university, with large campuses having complex missions and betting on structural
activities, while on the other hand, small and private campuses emphasize values and philosophy
as the driving force behind engagement opportunities. Aside from institutional practices, the
literature remains unclear about how different the two types of institutions are in terms of
fostering student engagement.
Review of the Literature: Engagement as the Outcome Variable
Because the present study investigated how transfer status affected student engagement,
the engagement construct was the dependent variable. The theoretical overview and research
discussed in this chapter suggests that there are certain student behaviors and institutional
features that are powerful contributors to student learning and development. As a result of
previous research on student engagement, the following variables were used to comprise the
construct of student engagement, which also comprise the five NSSE benchmarks: Level of
Academic Challenge (LAC), Active and Collaborative Learning (ACL), Student-Faculty
Interaction (SFI), Enriching Educational Experiences (EEE), and Supportive Campus
Environment (SCE).
The choice of student engagement as a dependent variable was based on other studies that
used it as a dependent variable. For example, Galladia (2012) examined the five benchmarks of
student engagement for commuter students enrolled at an urban public university and used
student engagement benchmarks as her dependent variable. Her findings were that, when
compared with first-year students, seniors at that institution found a more enriching educational
experience at the institution which may have been a factor for persistence to the senior year. She
also utilized student engagement benchmarks as the dependent variable and student
characteristics as the independent variable in her study.
62
Johnson (2008) conducted a study based on the identification of NSSE socialization
clusters that predicted private Midwestern college persistence. He utilized two of the NSSE
benchmarks, student-faculty interaction and supportive campus environment as the dependent
variable for engagement and looked at persistence, which was the independent variable of his
study. Johnson found that student-faculty interaction was an indicator of persistence.
Lastly, O’Dair (2012) used the Masters Survey of Student Engagement (MSSE), the
version of NSSE for Master’s students and used student engagement as her dependent variable
and student characteristics as the independent variable in her study. ODair’s findings were that at
least five dimensions of engagement for masters’ student, three of these dimensions were more
strongly associated with student characteristics, including academic discipline. Her study
concluded that masters’ students in business and education were more likely to experience a
supportive campus environment than were students in arts and sciences.
Summary and Critique of Theories
The theoretical framework behind the student engagement construct has been developed
over time and as a result of significant research on student development from the person-
environment interactive theory we now have a more complete understanding of the benefits and
importance of student engagement on student development. The departure and integration theory
explain how the transfer process shapes the college experience for those students who transition
from one institution to another and when student engagement is combined with transfer,
literature and prior research highlight differences between the student groups.
This chapter reviewed the relevant theories behind the student engagement construct and
highlighted not only how they informed student engagement, but also how it is relevant to the
experience of transfer students. Pace (1980) and Astin (1993) both defined student engagement
63
as the product of student behavior, such as time and energy invested and quality of student effort.
Pascarella (1987) emphasized the role of the environment in student development and Tinto’s
(1993) theory of integration and student departure informed the discussion of the transfer
process.
There are common issues across person-environment interaction theories. One major
problem in student engagement research has been the generalization to the student population in
research. Student engagement has been shown to be an important part of student success for
traditional students (Astin, 1984; Kuh et al. 2005; Pascarella & Terenzini, 2005), but its
applicability to transfer students has not been evident. Astin’s theory of student involvement and
the importance that students are involved in academically purposeful activities and Tinto’s
theory of student integration (Tinto, 1993) are relevant to this study because Astin’s theory
explains student engagement and Tinto’s seeks to explain transfer behavior. However, both
theories generalize to the entire student population but fail to take into account the diversity of
transfer types and background characteristics. Tinto’s theory of social integration presents
limitations for transfer students in general but especially for community college students,
because it assumes that social integration generally takes place for everyone. In reality, lack of
social integration is one of the main problems for community college students, who do not live
on campus or spend much time there, as well as for transfer students who often leave their
original institutions because of, among other reasons, a lack of integration.
Lastly, Pascarella’s model for student change is useful due to its emphasis of the role of
the environment. However, while it shows that structural characteristics affect student
development, it does not address how specific aspects of these structures affect student
development.
64
The theories discussed previously in this chapter are useful in defining student
engagement and understanding transfer behavior and the role of the environment. However,
these theories must be taken into consideration with caution as they tend to generalize and
remain too broad to explain how individual characteristics and student sub-groups engage with
their institutions.
Summary and Critique of Prior Research
Empirical research on transfer student engagement is inconsistent. While most studies
suggest that native students have higher levels of engagement than transfer students, most of the
research has focused on community college students only, who, if taken as a subset, have a
different experience and a different set of challenges than students who begin their higher
education at 4-year institutions. Furthermore, when the NSSE benchmarks are used for the
analysis of student engagement, the benchmark comparison indicators are inconsistent across
many studies. There have been no known studies that have looked at student engagement not
only between native and transfer students, but within the transfer student population at a national
scale. Despite the link between student engagement and academic performance, the diversity
within the transfer population and lack of literature on the topic suggests the need for further
research.
In terms of problems with some of the research available on the topic, some studies focus
on special groups in the population, such as engagement defined by a sense of belonging for
Latino students (Hurtado & Carter, 1997) for example. These studies have drawn attention to
distinct subgroups of the student population and have highlighted nuances of the student
experience. Studies focusing on the engagement level of transfer students, especially for
65
horizontal transfers, are very few. Most studies in that group have focused on the push-out
factors behind the transfer and not the experiences of this group at the new institution.
Some research has also focused on what institutions can do to facilitate student
engagement. Chickering and Gamson (1987) and Pascarella and Terenzini (2005) summarized
research on which institutional practices were most meaningful to students. This line of thinking
contributed to the creation of NSSE, which attempts to measure student change as a function of
students’ background characteristics, interactions with major socializing agents, and the quality
of student effort in learning.
An important common critique of most empirical research available is that most studies
focus on either one institution or a limited number of participants. Nationwide studies would
likely reveal data that could be generalized to a wider segment of the student population.
Longitudinal students would reveal how student development and engagement shape the college
experience over time, rather than report on the variable at one point in time.
Proposed Framework
The research that has examined transfer student engagement is limited. The person-
environment perspective informs the definition of student engagement and why it matters for
student success. In addition, student integration theory highlights the importance of social and
academic integration for student success. Ultimately, the theory suggests that engagement is the
result of student behavior interacting with the environmental factors. Based on relevant theories
and empirical research reviewed earlier, this study proposes a conceptual framework to examine
the relationship between transfer status and student engagement. It incorporates what research
suggests are important student and institutional factors for transfers and non-transfers. The
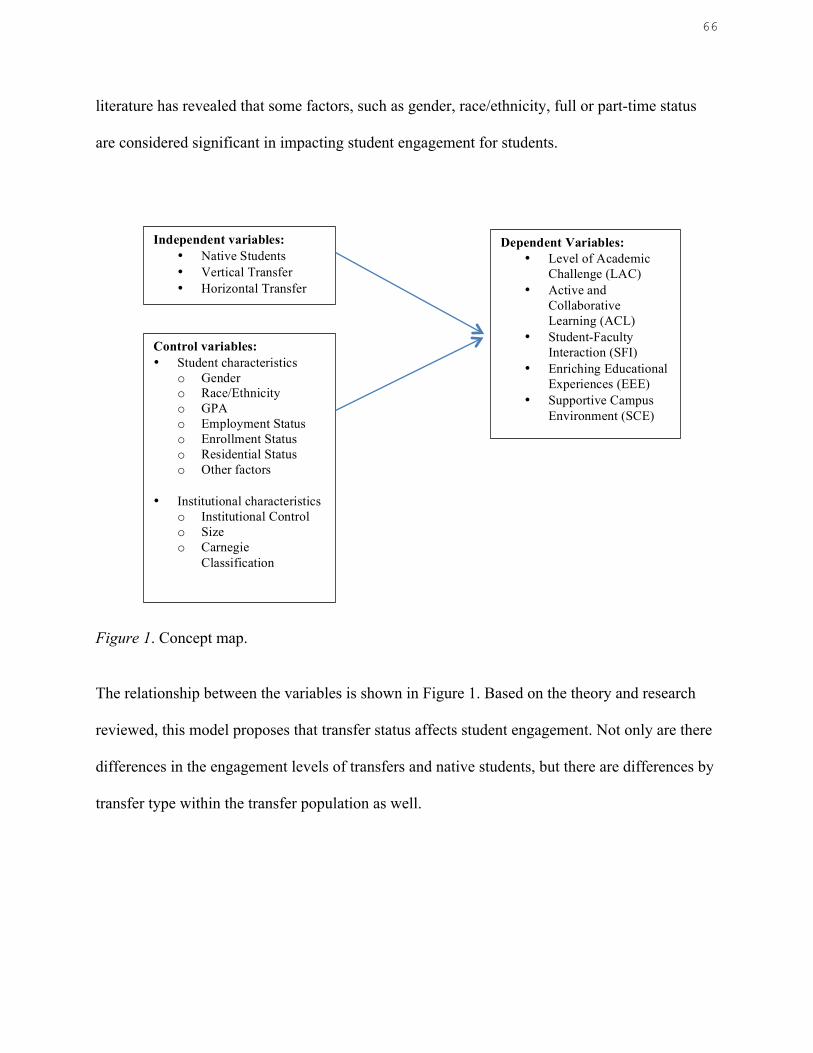
66
literature has revealed that some factors, such as gender, race/ethnicity, full or part-time status
are considered significant in impacting student engagement for students.
Figure 1. Concept map.
The relationship between the variables is shown in Figure 1. Based on the theory and research
reviewed, this model proposes that transfer status affects student engagement. Not only are there
differences in the engagement levels of transfers and native students, but there are differences by
transfer type within the transfer population as well.
Independent variables: • Native Students • Vertical Transfer • Horizontal Transfer
Dependent Variables: • Level of Academic
Challenge (LAC) • Active and
Collaborative Learning (ACL)
• Student-Faculty Interaction (SFI)
• Enriching Educational Experiences (EEE)
• Supportive Campus Environment (SCE)
Control variables: • Student characteristics
o Gender o Race/Ethnicity o GPA o Employment Status o Enrollment Status o Residential Status o Other factors
• Institutional characteristics
o Institutional Control o Size o Carnegie
Classification
67
Conclusion
In sum, the literature and research reviewed in this chapter outlined student engagement
theory and the determinants of student engagement among the student groups. Specifically, the
literature indicates that, in addition to transfer status, other factors, including student
characteristics and institutional characteristics, are related to student engagement. The
availability of quality data, such as data collected by NSSE, have made it possible for hundreds
of institutions to get to know their students, what they learn in college, and the programs and
practices that make the most difference to the student educational experience. This is why the
NSSE has become the most widely used measure of student engagement. In addition, the NSSE
has allowed benchmarking among institutions seeking to improve educational outcomes. Most of
the studies reviewed in this chapter used data from national surveys, such as the Cooperative
Institutional Research Program (CIRP), and the National Survey on Student Engagement (NSSE)
to perform qualitative and mixed methods studies and other relevant research methods.
The literature validates the importance of research on the topic and it demonstrates that
more quality research is needed to understand and improve student outcomes and to highlight the
differences in college experiences, especially within the transfer student population as the
transfer population are either altogether omitted or only partially considered. The present study
fills this void as it explored differences not only between native and transfer students, but also
between horizontal and vertical transfers by comparing these groups across the five NSSE
benchmarks.
Based on the review of the literature, there is a clear need to study the relationship
between transfer status and student engagement as constructed by the five benchmarks (level of
academic challenge; active and collaborative learning; student-faculty interaction, enriching
68
educational experiences, and supportive campus environment). While theories about student
quality of effort, student involvement, student integration, and models of assessing students hold
a valuable place in student development, the most appropriate theoretical framework will
integrate these theories together. The findings of previous research suggest that differences
between transfer and native students exist, but this research has failed to differentiate between
the subgroups of transfer students.
Due to the vast numbers of transfer students in the United States, continued research and
review of the literature pertaining to transfer students will provide a better understanding of the
transfer experience. The academic integration of transfer students may have previously been
among the most critical aspects of the transfer experience, as there has been a lot of research
focused around transfer shock. Transfer students face a myriad of issues in their transition to the
new academic environment, but transfer shock is only one of these challenges. Student
engagement is a much more accurate predictor of student success and educational outcomes such
as persistence and graduation. Student engagement encompasses both academic and social
integration alike and it is rooted in the relationship between students and their environment. If
college administrators and faculty do not create inclusive environments, if they do not provide
programs and services that are distinct for non-transfers, horizontal and vertical transfers,
students who lack these opportunities will likely dropout, as Tinto’s student integration model
suggests.
By integrating theories of quality of effort, student involvement, assessing student change
and integration, the current study proposes to include individual and institutional characteristics
to examine student engagement. Specifically, gender, race/ethnicity, enrollment status,
residential status and other relevant factors as well institution size, classification and control will
69
also be included in analyzing the effects of transfer status on student engagement. In addition,
this review suggests that transfer status may be important to be considered to predict student
engagement levels and there may be differences in the college experience. This proposed model
could be useful to institutions to better assess current practices for transfer students and focus
their attention on this often overlooked big segment of the student population.
70
Chapter III
RESEARCH DESIGN
The purpose of this study was to investigate the relationship between transfer status and
student engagement and, in addition, to find out whether transfer types were related to
differences in engagement levels among transfer students. Furthermore, this study sought to
understand the other factors, including student and institutional background characteristics, that
were associated with student engagement levels. This chapter begins with an introduction of the
research questions and the model that guided this study, the data source and sample used for this
study are discussed, issues of validity and reliability are addressed and the major categories of
research variables under study are outlined. In addition, the appropriate data analysis methods for
analysis is reviewed and an overview of limitations is included at the end.
This study was guided by the following research questions:
1. Is transfer status related to student engagement levels in general?
2. If yes, does such relationship differ by transfer type (vertical, horizontal vs. native)? and
3. What other student characteristics are associated with student engagement?
Research Model
The conceptual framework that guided this study was presented in detail in Chapter II. It
relied on the construct of student engagement, and it includes integrated theories of quality of
effort (Pace 1979, 1984), involvement theory (Astin 1993), Pascarella’s model for assessing
student change (Pascarella 1985), and integration theory (Tinto 1987, 1993). Empirical research
has suggested that there are certain factors that affect student engagement. The major variables
included in this research are the independent variable of transfer status, which includes native
71
students, vertical transfer, and horizontal transfer; two types of control variables: student
characteristics, which includes gender, race/ethnicity, residential status, enrollment status and
other factors (major, athletic affiliation) and institutional characteristics, which includes
institutional control, classification and size, and their relationship to the outcome variable for this
study, student engagement, which was constructed of the five benchmarks that encompass the
student engagement construct: level of academic challenge, active and collaborative learning,
student-faculty interaction, enriching educational experiences, and supportive campus
environment.
In sum, this research model was used to investigate how student transfer status, together
with other factors, related to college student engagement.
Data Source
This study used data from the National Survey of Student Engagement (NSSE) dataset
that was provided by the Indiana University Center for Postsecondary Research (see Appendix A
for paper version of the survey also known as the “College Student Report”). The purpose of
NSSE is to provide a way for institutions to identify and measure aspects of the undergraduate
experience inside and outside of the classroom that can be ameliorated through changes of
practices consistent with identified good practices in undergraduate education (NSSE, 2015). In
addition, the data provides information on how students spend their time at different colleges and
what they gain from their experiences. In the last year, over 1.5 million students and 587
institutions participated in the 2015 version of the survey. No other college survey has reached
this number of students, and this highlights the importance of this instrument for assessment
purposes.
72
What makes the NSSE the most appropriate data for this study is that it is based on
Chickering and Gamson’s (1987) “Seven Principles of Good Practice in Undergraduate
Education” and because the survey captures the effect the institution has on its students
(Pascarella, Cruce, Umbach, Wolniack, Kuh, Carini, Haye, Gonyea, & Zhao, 2006). In addition
to its extensive use, research has examined the association of NSSE benchmarks to student
outcomes and has determined that there is a link between engagement measures and educational
outcomes (Carini, Kuh, & Klein, 2006).
Sample
The sample used in this study came from the 2009 NSSE dataset. In 2009 about 1.1
million first-year and senior students from 622 institutions in the United States and Canada were
invited to participate in the 2009 NSSE survey administration. Of this population, 367, 318
students responded and 65% of the participating institutions opted for the Web-only
administration mode, and about 98% of all respondents completed the survey online and 52% of
the respondents were seniors (NSSE, 2009a). In the 2009 NSSE administration, overall the
institutions reflected the diversity of U.S. higher education with respect to institutional type,
sector, region, and location (NSSE, 2009a).
The survey respondents included a large number of transfer students. About 42% of
senior respondents began their higher education at an institution other than the one they were
attending at the time of the survey administration. Among them, about half had previously
attended another baccalaureate-granting institution, 70% had attended community college, 14%
had attended a vocational-technical school, and 5% had enrolled in some other form of
postsecondary educations (percentages add to over 100% because some respondents indicated
they had attended more than one type of institution) (NSSE, 2009a).
73
Because the purpose of this study was to examine the relationship between transfer status
and student engagement, this study only focused on respondents who were in their senior year of
college, as they were getting ready to graduate. NSSE collects data from first-year and senior
students. Focusing on data from students in their last year seemed to be the most appropriate for
this study. It is important to note that this study was designed to focus on students who
successfully transferred and were nearly ready to graduate. The focus on this group only was
thought to provide more meaningful data on how the transfer process has affected their college
experience since they have already spent some time in the institution.
This study uses a representative sample of the 2009 senior student participants (n=67,
362), which comprised 20% random sample of all collected responses that year and included 183
variables. The 2009 dataset was the largest data available for release to researchers up until the
start of this study. After the data were sorted for senior students, the sample was comprised of
29,446 respondents. Missing data were removed using list-wise deletion and the sample
contained 26,133 respondents who were used for the analysis of this study.
Validity and Reliability
Because of its popularity and common use in research, the NSSE instrument is often
scrutinized for validity and reliability. As more institutions use the NSSE, the need to validate it
becomes increasingly more important. Supported by research, NSSE is a valid measure of
student engagement, and its benchmarks are indicators of student learning across institutions,
regardless of type, classification, or population.
Due to the sophistication and research origin of the instrument, the NSSE relies on high
content validity and reliability, continuously improved based on data collection (Kuh, 2009b).
Crobach’s alpha is used to measure internal consistency, as to how closely related a set items are
74
in a group, in this case, questions in single benchmark. For the 2009 NSSE data, the survey
reported high levels of reliability, based on reported Cronbach’ alpha, which for social science
research generally means indicators of 70% or above (Cortina, 1993). In these data, the
Crobach’s alpha showed three of the benchmarks to contain a high degree of reliability for senior
participants: level of academic challenge α=.76; student-faculty interaction α=.74 and supportive
campus environment α=.80; and two of the benchmarks fell below α of .7 with active and
collaborative learning score of α=.66 and Enriching Education Experiences score of α= .66 as
well, meaning that results should be used with caution (NSSE, 2009a).
Research Variables
The research variables in this study are divided into three categories: dependent variables,
independent variables, and control variables. These variables were derived from the literature
review and the data available for this study.
Dependent Variables-NSSE Engagement Benchmarks
The five engagement benchmarks comprise the dependent variables in this study. Each
one is a continuous variable, standardized for the purpose of this study. The variables are as
follows:
Level of Academic Challenge (ACa), measuring the effect of coursework and time spent
on reading and writing on cognitive development.
Active and Collaborative Learning (ACL), evaluating student involvement with various
activities such as asking questions in class or taking advantage of tutoring sessions.
Student and Faculty Interaction (SFI), examining the frequency of discussing grades,
assignments, and career plans with faculty and administrative staff.
75
Enriching Education Experiences (EEE), examining student participation with volunteer
opportunities, study abroad and the like.
Supportive Campus Environment (SCE), examines the relationship with other students
and faculty.
Each one of these benchmarks is composed to series of relevant questions, identified by research,
as directly related to this measure. All questions for each benchmark can be found in Appendix B
Description of NSSE Items.
Over time, the NSSE has established various scales including a set of questions in the
survey. The most frequently reported are the five NSSE benchmarks: Level of academic
challenge, active and collaborative learning, student-faculty interaction, enriching educational
experiences, and supportive campus environment, (College Student Report, 2009 Codebook).
Level of academic challenge is a benchmark of 11 items that measure time spent preparing for
class, the amount of reading and writing, deep learning, and the institutional expectations for
academic performance. The second benchmark, active and collaborative learning, is a seven-item
benchmark that measures the extent of class participation, working collaboratively with other
students in and out of the classroom, tutoring and involvement with a community-based project.
The student-faculty interaction scale contains six items and measures the extent of interaction
with faculty and advisors, discussing ideas from cases with faculty outside of class, getting
prompt feedback on academic performance, and working with faculty on a research project.
Enriching educational experiences is a benchmark that consists of 12 items that measure the
extent of interaction among students of different racial and ethnic backgrounds or with different
values or political opinions. Items here focus on information, technology, and participating in
activities such as internships, community service, study abroad, and co-curricular activities. And
76
lastly, supportive campus environment consists of six items and is a scale measuring the extent to
which students perceive the campus helps them succeeds academically and socially, assists them
in coping with nonacademic responsibilities, and promotes supportive relations among students
and their peers, faculty members, and administrative staff. The design of the survey was
influenced by the seven principles of good practice in undergraduate education by Chickering
and Gamson (1987).
Independent Variable: Transfer Status
In the analysis for the first and second research questions, data from question 21 on the
survey was used, to classify transfer students into several transfer categories: Variable votech05
with label Vocational or technical school, variable comcol05 with label community or junior
college, variable fouryr05, labeled 4-year college other than this one, none05, labeled None or
ocol1_05, labeled Other are used in this analysis to classify respondents in one of several
categories of transfer status:
Non-transfer or students who are native to an institution, those who start and finish at the
same college or university are measured by the variable none05, with response values as
0=Checked and 1=Non-checked.
Horizontal transfer students who begin at one 4-year institution and transferred into
another, or students who have had multiple transfers but ultimately arrived from one 4-year
institution into another are measured by the variable fouryr05 with response values as
0=Checked and 1=Non-checked.
Vertical transfers students who start at a community college or a vocational school before
transferring into a 4-year institution are measured by the variables votech05 and comcol05 with
response values as 0=Checked and 1=Non-checked.
77
Control Variables
This study included and controlled for the following variables:
Student characteristics.
• Gender. Item 16 on the survey, this variable is named as sex, to reflect a student’s gender;
with response values of 0=Male and 1=Female.
• Item 17 on the survey, named as race05 asks about the respondent’s race/ethnicity. The
item is, “What is your racial or ethnic identification (select only one)”, with categories of
American Indian or other Native American, Asian, Asian American or Pacific Islander,
Black or African American, White (non-Hispanic), Mexican or Mexican American,
Puerto Rican, Other Hispanic or Latino, Multiracial, Other, and I prefer not to respond. In
the present study, Race/Ethnicity is recoded into dummy variables measuring student
race/ethnicity. White students were treated as the reference group, and Latino and
Hispanic categories were combined into one ethnic group and the group of student that
preferred not to respond were treated as missing data.
• GPA-Item 27 on the survey, named as grades04, asks “What have most of your grades
been up to now at this institution?”. In this study, this variable is recoded into three
dummy variables, instead of using the original 8 categories, ranging from C- to A, into
three groups only measuring A- or higher is treated as the reference group, with variables
such as A to A- as topgpa, B+ to B- as medgpa and C+ to C- as lowgpa in order to
decrease the number of original variables and facilitate use.
• Employment status, item 9 on the survey, named as workon01 for hours per 7-day week
spent working for pay on campus and named as workof01 for hours per 7-day week spent
78
working for pay off campus. These variables were recoded into dummy variables in this
study to measure the hours of employment per week.
• Enrollment status, part-time or full-time, was assessed by item 22 with variable named as
enrlment indicating “Thinking about this current academic term… How would you
characterize your enrollment?” with response values for this variable being, 0=less than
full time and 1=full-time.
• Residential status (on campus or commuter). This variable is assessed by item 26 in the
survey, named livenow, asked, “Which of the following best describes where you are
living now while attending college?”. In this study, it is recoded into dummy variables
measuring residential status. On-campus was treated as the reference group.
• Other characteristics. Major and athletic affiliation were examined to see if they had an
effect on the level of engagement between student groups. Academic major is assessed by
item 28a named majprim that asked, “Please enter your major(s) or your expected
major(s). Primary major (Enter only one),” with arts and humanities as the reference
group. Athletic affiliation is assessed by item 24a, named athlete, with response values
0=No; 1=Yes.
Institutional characteristics.
The institutional characteristics were based on the 2005 Carnegie classifications, since
these were in place at the time of data collection.
Institutional control referred to whether the institution attended was public or private. The
variable name is PRIVATE with values 0=public and 1=private.
79
Classification referred to the type of institution, and it is named Rec_enrl_tds. It was
recoded into dummy variables that assessed the classification of each institution.
Research university (very high research activity), was treated as the reference group.
Size referred to the size of undergraduate enrollment and, in this study, this variable was
named Rec_enrl_tds, and it was also recoded into dummy variables, with fewer than
1,500 students as the reference group. The original categories of this variable were
1=Fewer than 1,500, 2=1,500 to 2,499, 3=2,500 to 4,999, 4=5,000 to 9,999, and
5=10,000 or more and were recoded to inst_small to refer to institutions with enrollments
up to 2,499 students, inst_medium referred to institutions with enrollments between 2,500
and 9,999 students, and inst_large was used to refer to institutions with enrollments of
10,000 or more students.
Data Analysis
Multiple regression was chosen as an appropriate statistical method for this study due to
the continuous nature of the outcome variables. The statistical equation can be represented as
follows: Y=b1 X1+b2X2+b3X3+…+e. In this equation, the b represents the regression coefficients
for the respective predictor variables (X) and e is the error term. The standard errors at the
institution level were clustered in order to account for students clustered within colleges.
Because transfer status was self-reported, there were no concerns about error for this variable.
Furthermore, in order to address error in the self-reported data on transfer status, it was believed
to be unlikely that respondents would lie about demographics and their transfer status, so it was
assumed that there were no major concerns about errors in self-reported transfer status.
The following steps were taken before the actual inferential analysis was performed. In
order to select the appropriate data sample, SPSS was used to identify the student cases that
80
reported a class rank of senior. This step was necessary to determine whether transfer status was
related to student engagement levels in general for all senior students. Because this study sought
to examine the impact of transfer status on student engagement and sought to compare transfers
to non-transfers, the use of data from senior students provided the most valuable information, as
senior students had spent the longest time at their respective institutions. After data were filtered
for seniors, a list-wise deletion was used to deal with missing data cases. This method was used
in the study due of the large number of available cases and relatively low number of missing
cases. Three thousand, three hundred and thirteen cases were removed because of missing data.
This left a sample of 23,166 cases to be used for analysis. Necessary recoding of any variables
took place so that descriptive and inferential statistics could be conducted. Lastly, clustered data
was incorporated in the analysis because respondents were nested within a type of institution at
the time that the data was provided. There is an institutional indicator present in the dataset and
so cluster-correlated data arise when there is a grouped structure to the data.
The NSSE generally provides the option to weight the data when two conditions are
present: (a) the proportion of respondents within a particular demographic variable differs
substantially from their population percentages, and (b) students within the subgroups differ
substantially in the variables of interests. These conditions require NSSE to weight by gender,
enrollment status, and institutional size (NSSE, 2016). While weighting is generally used by
individual institutions to adjust their data for underrepresented populations, weighting was not
used in the present study because it was not appropriate to use for student subgroups. Since this
study used data from senior respondents only, which consisted of 20% of all respondents, the
data was not weighted. The weights used by the NSSE should only be used if the proportion of
seniors by gender, ethnicity and enrollment status is the same as in the full sample of senior
81
respondents. Otherwise, the weighted sample is not representative of the population. Given that I
did not have access to all seniors who took the NSSE 2009 survey, it is unlikely that the
subsample is representative of respondents.
This study used both descriptive statistics and a one-way ANOVA to describe and
analyze characteristics of the sample. To answer the research questions, a multiple regression
was performed in order to examine the relationship between transfer status, a set of control
variables, and student engagement. To answer the first and third research questions, multiple
regression models were run on the whole sample to understand the relationship between transfer
status and student engagement. For the second research question, a multiple regression was
conducted on the transfer student sample only to understand how transfer types may relate to
student engagement.
Limitations
As with all surveys, the NSSE relies on students to self-report information about their
educational experiences. Even though this may be an effective way to understand student
engagement, there are several limitations to the use of the NSSE, such as relying on self-reported
data, problems with cross-sectional analysis, and potentially older data.
The first limitation of this study is that it relied on self-reported student data. There are a
several general problems associated with surveys. The first is the inability of respondents to
provide accurate information in response to a single question (Wentland & Smith, 1993). In the
case of the present study, the respondents might not have had enough experience with the
institution to be able to accurately answer the questions at hand. Another problem with self-
reporting in surveys is the possible unwillingness of the respondents to provide truthful
information (Aaker, Kumar, & Day, 1998). This means that students may intentionally provide
82
false data about their experiences or characteristics. However, research has discovered that
people generally tend to respond accurately when questioned about their experiences or past
behavior, except when asked uncomfortable questions or asked to reveal information which may
put them in potentially awkward position (Bradburn & Sudman, 1998). Lastly, student self-
reports are also subject to the halo effect, meaning that some students may inflate certain aspects
of experience or behavior, such as grades, outcome gains, and the level of effort. The halo effect
does not seem to be a factor for a particular type of institution, but research has shown that it is
rather constant across different institutional types (Pike, 1999). However, research has also
shown that self-reports tend to be valid under five distinct conditions: (a) when the information
requested is known to the respondents; (b) the questions are structured clearly; (c) the questions
refer to recent activities; (d) the respondents think that the questions merit a serious and
thoughtful response; and (e) answering the questions does not threaten, embarrass, or raise
privacy issues (Bradburn & Sudman, 1988). The NSSE was intentionally designed to satisfy all
of these conditions (Kuh, 2001b). In addition, there is no indication that transfer students may
answer items on the survey with any more or less error than native students Therefore, the
response error does not raise concerns.
The second limitation of this study is the use of cross-sectional analysis. This presents a
limitation for this study because data from a single year only was used in analysis of student
engagement, while learning and development actually occur over time. Using cross-sectional
data is challenging because this way student engagement scores are not necessarily expected to
grow over time, but it is estimated that in the context of their current setting and courses they
have taken up to this point (Chen et. al. 2009). A recommendation for further research is the use
of multi-year data analysis of student engagement in order to ameliorate this problem.
83
The third limitation of this study is its design. Because this study focused on students
who successfully transferred and were nearly ready to graduate when the data was collected, it
focused on student engagement after a successful transfer and does not examine the factors that
contributed to the transfer. Future studies need to examine this population.
The fourth limitation of this study is that it did not address the type of institution from
which the transfers originated. The data only includes information about the institutional
characteristics of the host institutions. A more thorough study could examine whether there is an
alignment or not between original and host institutions and how institutional types affect fit. This
is particularly important for transfer students, since lack of fit with the host institution is one of
the challenges leading to transfer shock and lack of persistence and may also impact
engagement.
The fifth limitation of using NSSE data is that participation in the survey is voluntary,
and institutions report their data rather than the data being selected randomly from all eligible
institutions. Given this self-selection bias, it is important to compare the institutional
characteristics of NSSE schools to all other post-baccalaureate institutions in the United States.
Perhaps future research will evaluate institutional characteristics. If institutions that choose to
participate in NSSE have similar institutional characteristics and constitute a nationally
representative sample, then there is a lower chance of self-selection bias influencing NSSE
results.
The sixth limitation of this study is use of data from 2009, as more recent data was
available at the time of this writing. While the NSSE continues to grow and engage more
students and institutions across the United States and Canada, the data for the present study
comes from the 2009 edition of the survey. I acquired the data in 2012, and at that time (the start
84
of this study) it was the most recent data available to any researcher. Future research could use
more recent data and compare it with what has been found in the current study. If similar studies
using more recent data are conducted, then a comparison with this study could reveal whether
there has been a change in the results or not. In addition, the NSSE 2009 results are likely to
have been administered right before the effects of the recession crisis the country faced were
fully felt. Therefore, results from this particular point in time will be useful in examining how the
financial crisis of 2008 impacted college students.
85
CHAPTER IV
RESULTS
As outlined in Chapter III, the research questions for this study ask about the relationship
between student engagement and transfer status. The results presented in this chapter are
separated into two sections. The first section outlines the descriptive statistics of the sample for
each variable used in this study. The second section presents the findings of the multiple
regression analysis for each of the variables that were significantly related to the dependent
variable.
Descriptive Statistics
Table 1 presents the student characteristics of the sample. All of the data is self-reported
student data from the 2009 NSSE survey. Information included in Table 1 includes gender, race
and ethnicity, transfer status, type of transfer, enrollment status, GPA, primary major, living
arrangement, athletic affiliation, and on and off campus employment. The data also include
information about institutions, such as institutional control, IPEDS, and Carnegie classifications.
After the data were cleaned and filtered for senior respondents and the missing data were
eliminated, the sample contained 26,133 respondents.
Table 1 shows that the majority of the sample was female (64.5%). White students were
the majority of respondents, 75.8% of all survey takers, while 7.8%of the respondents were
Black, 5.4% reported that they were Asian students represent, less than 1% of the sample
reported that they were Native American, and 6.2% of the sample reported that they were
Hispanic/Latino. Students who did not provide ethnic/race information were treated as missing
86
data and were excluded from the analysis. Five and two-tenths percent of the original dataset,
which included first-year and senior students, fell into this category and 6.3% of the senior
subset of the population selected, I prefer not to respond.
The majority of students included in this sample were transfers, 53.2%, while 46.8%
identified as non-transfer students. Among the transfer population, 28.4% were vertical transfers,
while 24.8% were horizontal, leaving 48.6% as native students in the sample, referred to as non-
transfers in this study. These descriptive statistics were relatively evenly distributed between
student types.
Other demographic statistics also highlight the population of the sample. The vast
majority of respondents as a whole, or 86.3%, were enrolled full-time and 13.7% were enrolled
on part-time basis. As a group, the respondents reported relatively high GPA in grade
equivalency: 48.7% having mostly grades falling between A- and A, 45.8% reporting grades
between B+ and B- and only 5.6% reporting grades C+ or below. The distribution of the
respondents’ primary major indicated that 28% majored in one of the social sciences, 19. 1%
majored in business, 13.8% majored in the arts and humanities, and 10.2% majored in education;
9.1% majored in professional majors: 7.3% majored in biological sciences, 5.5% majored in
engineering; 3.8% had declared majors that did not fall within any of the NSSE categories, and
3.2% majored in the physical sciences. Student athletes comprised only 6.6% of the respondents,
while 93.4% were not affiliated with any athletic team on campus.
Students who lived on-campus in either dorms or residence halls comprised 16.1% of the
sample, while 22.6% lived within walking distance of their campus. Over half of all
respondents, 53.8%, lived within driving distance of campus. One and a half percent lived in
sorority or fraternity houses, and 6% of the sample indicated they had some other living
87
arrangement. Lastly, when it came to student employment either on or off campus, the
distribution was the following: students who did not work on campus comprised 70.4% of the
sample, 26.2% reported working under 20 hours per week on campus, and 3.4% of students
reported working over 21 hours on campus. In the off-campus employment group, 43.2% of
students reported that they did not work off campus, 27.4% reported that they worked under 20
hours a week off campus, and 29.4% reported that they worked over 21 hours a week at an off-
campus job. This distribution shows that the number of respondents who worked over 21 hours a
week off campus is a significant portion of all of the students who were employed off-campus
while, in comparison, only 3.4% of students held on-campus jobs.
Also, the descriptive statistics presented in Table 1 show the distribution of students
based on their home institutions. Twenty-one percent of respondents attended small institutions,
with a size of less up to 2,499 students, 39.4% attended institutions with enrollments between
2,500 and 9,999 students, and 39.6% of respondents attended institutions with enrollments of
10,000 or more students. The majority of respondents attended public institutions, 57.8% of the
sample, while the remainder, 42.2%, attended private colleges or universities.
Cross-tabulation analysis revealed that the samples were very similar across gender, race,
and GPA, see Table 2. For native students, 93.7% indicated that they were enrolled on full-time
basis, while horizontal and vertical transfer students were at 79.9% and 79.8% respectively.
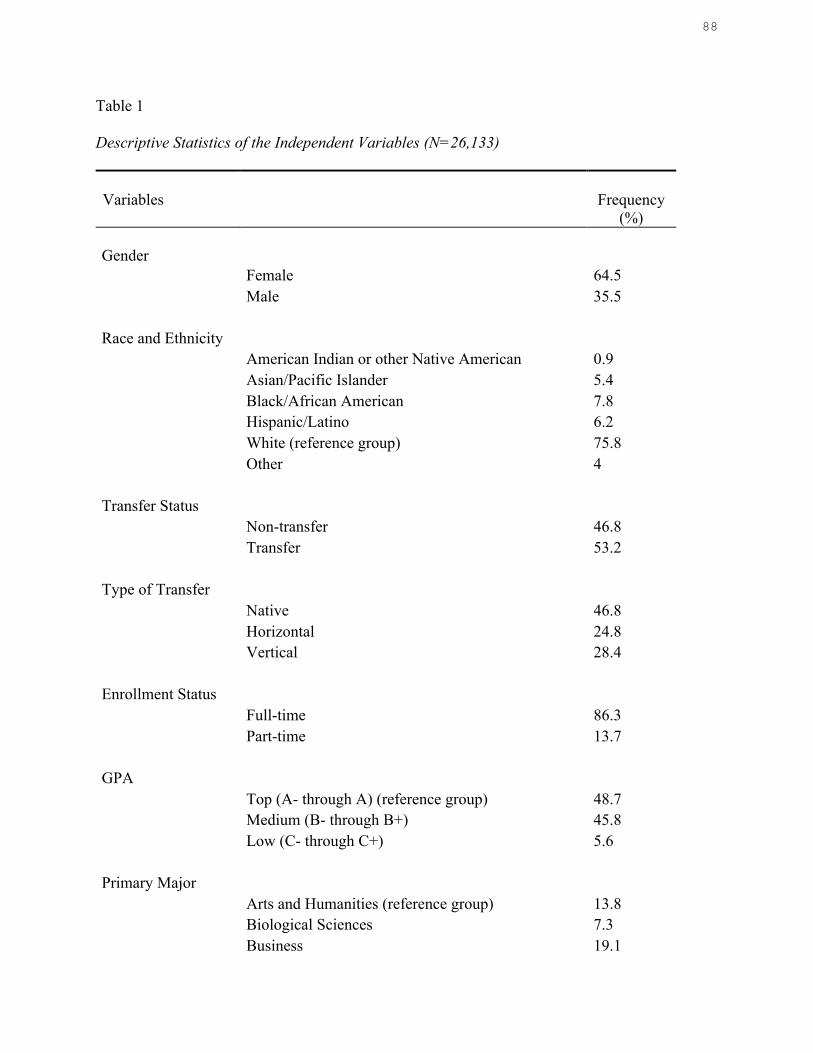
88
Table 1
Descriptive Statistics of the Independent Variables (N=26,133)
Variables
Frequency
(%) Gender
Female 64.5
Male 35.5
Race and Ethnicity
American Indian or other Native American 0.9
Asian/Pacific Islander 5.4
Black/African American 7.8
Hispanic/Latino 6.2
White (reference group) 75.8
Other 4
Transfer Status
Non-transfer 46.8
Transfer 53.2
Type of Transfer
Native 46.8
Horizontal 24.8
Vertical 28.4
Enrollment Status
Full-time 86.3
Part-time 13.7
GPA
Top (A- through A) (reference group) 48.7
Medium (B- through B+) 45.8
Low (C- through C+) 5.6
Primary Major
Arts and Humanities (reference group) 13.8
Biological Sciences 7.3
Business 19.1
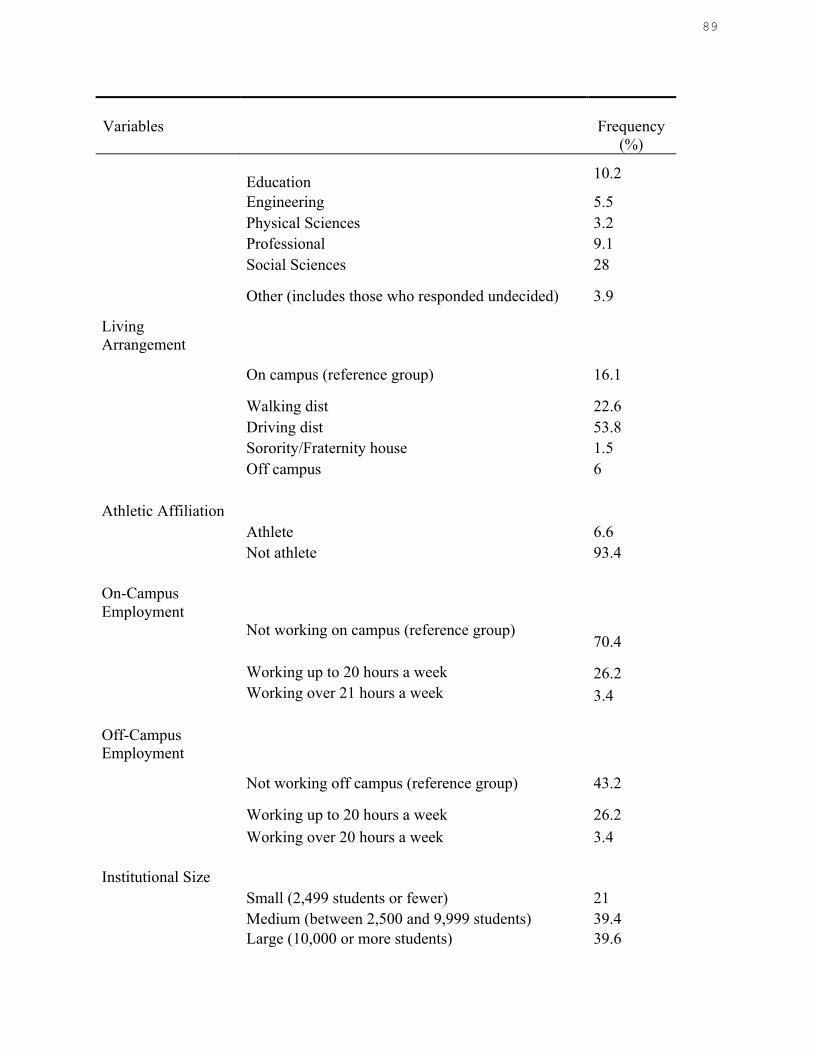
89
Variables
Frequency
(%)
Education 10.2
Engineering 5.5
Physical Sciences 3.2
Professional 9.1
Social Sciences 28
Other (includes those who responded undecided) 3.9
Living Arrangement
On campus (reference group) 16.1
Walking dist 22.6
Driving dist 53.8
Sorority/Fraternity house 1.5
Off campus 6
Athletic Affiliation
Athlete 6.6
Not athlete 93.4
On-Campus Employment
Not working on campus (reference group)70.4
Working up to 20 hours a week 26.2
Working over 21 hours a week 3.4
Off-Campus Employment
Not working off campus (reference group) 43.2
Working up to 20 hours a week 26.2
Working over 20 hours a week 3.4
Institutional Size
Small (2,499 students or fewer) 21
Medium (between 2,500 and 9,999 students) 39.4
Large (10,000 or more students) 39.6
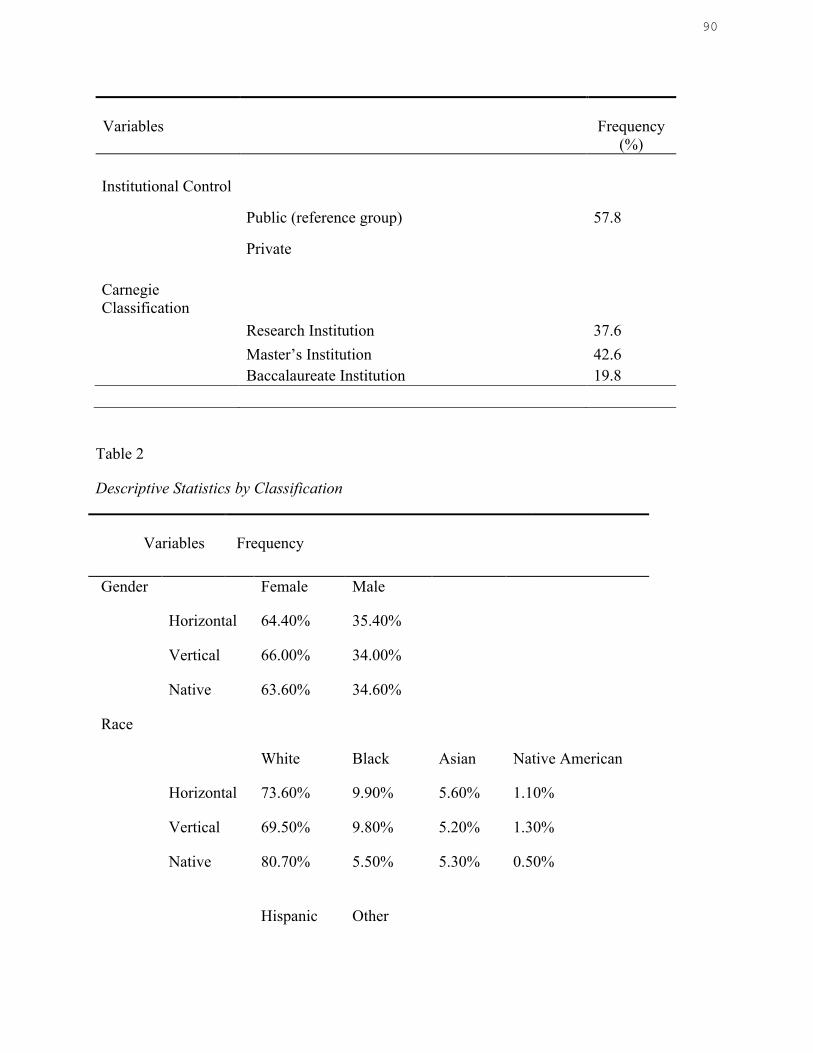
90
Variables
Frequency
(%)
Institutional Control
Public (reference group) 57.8
Private
Carnegie Classification
Research Institution 37.6
Master’s Institution 42.6
Baccalaureate Institution 19.8
Table 2
Descriptive Statistics by Classification
Variables
Frequency
Gender
Female Male
Horizontal 64.40% 35.40%
Vertical 66.00% 34.00%
Native 63.60% 34.60%
Race
White Black Asian Native American
Horizontal 73.60% 9.90% 5.60% 1.10%
Vertical 69.50% 9.80% 5.20% 1.30%
Native 80.70% 5.50% 5.30% 0.50%
Hispanic Other
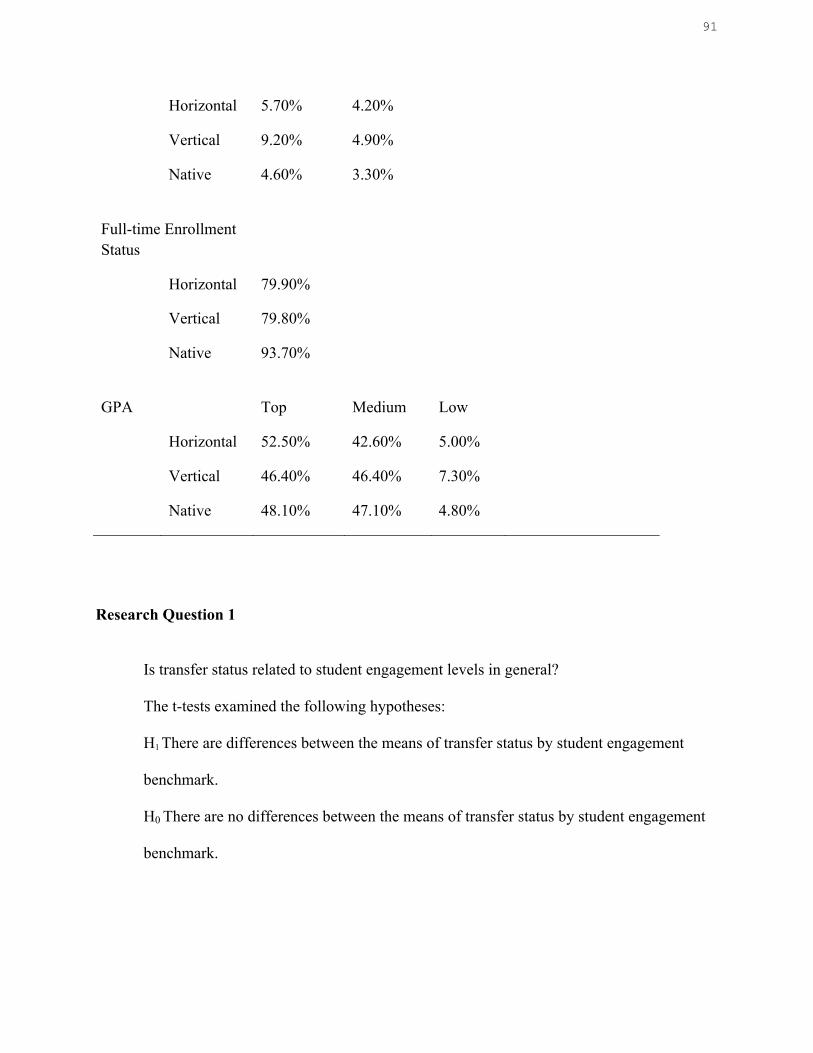
91
Horizontal 5.70% 4.20%
Vertical 9.20% 4.90%
Native 4.60% 3.30%
Full-time Enrollment Status
Horizontal 79.90%
Vertical 79.80%
Native 93.70%
GPA
Top Medium Low
Horizontal 52.50% 42.60% 5.00%
Vertical 46.40% 46.40% 7.30%
Native 48.10% 47.10% 4.80%
Research Question 1
Is transfer status related to student engagement levels in general?
The t-tests examined the following hypotheses:
H1 There are differences between the means of transfer status by student engagement
benchmark.
H0 There are no differences between the means of transfer status by student engagement
benchmark.
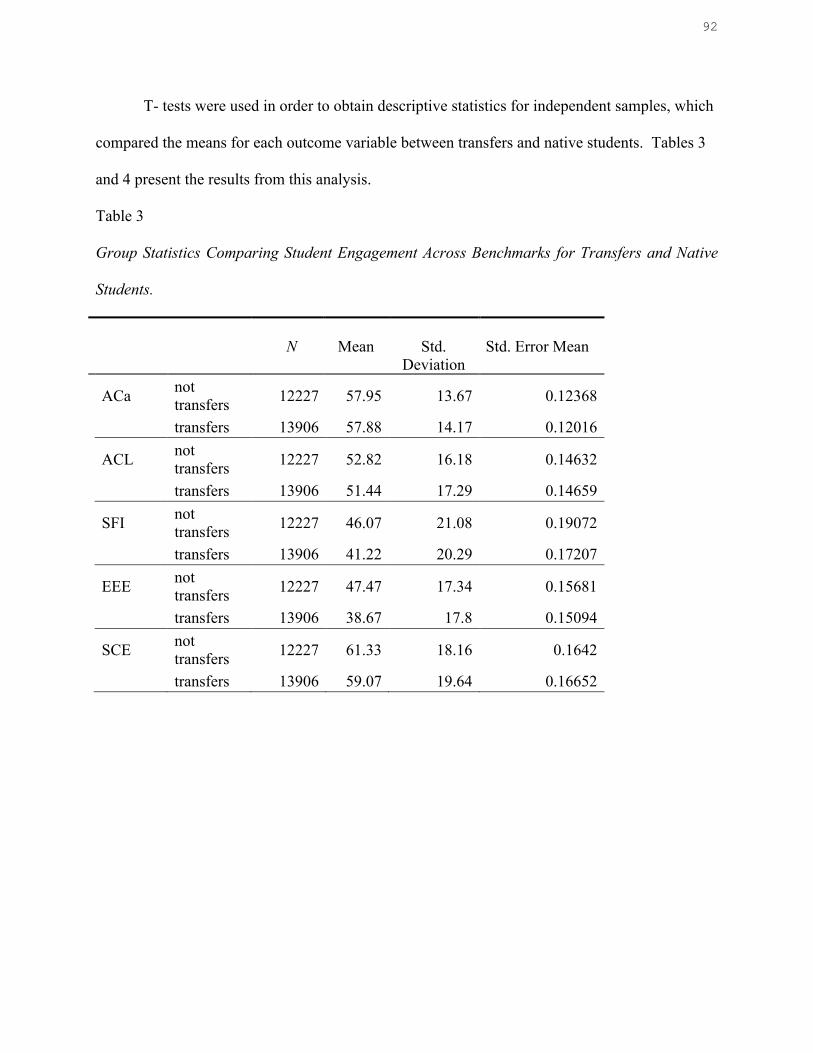
92
T- tests were used in order to obtain descriptive statistics for independent samples, which
compared the means for each outcome variable between transfers and native students. Tables 3
and 4 present the results from this analysis.
Table 3
Group Statistics Comparing Student Engagement Across Benchmarks for Transfers and Native
Students.
N
Mean
Std.
Deviation
Std. Error Mean
ACa not transfers 12227 57.95 13.67 0.12368
transfers 13906 57.88 14.17 0.12016
ACL not transfers 12227 52.82 16.18 0.14632
transfers 13906 51.44 17.29 0.14659
SFI not transfers 12227 46.07 21.08 0.19072
transfers 13906 41.22 20.29 0.17207
EEE not transfers 12227 47.47 17.34 0.15681
transfers 13906 38.67 17.8 0.15094
SCE not transfers 12227 61.33 18.16 0.1642
transfers 13906 59.07 19.64 0.16652
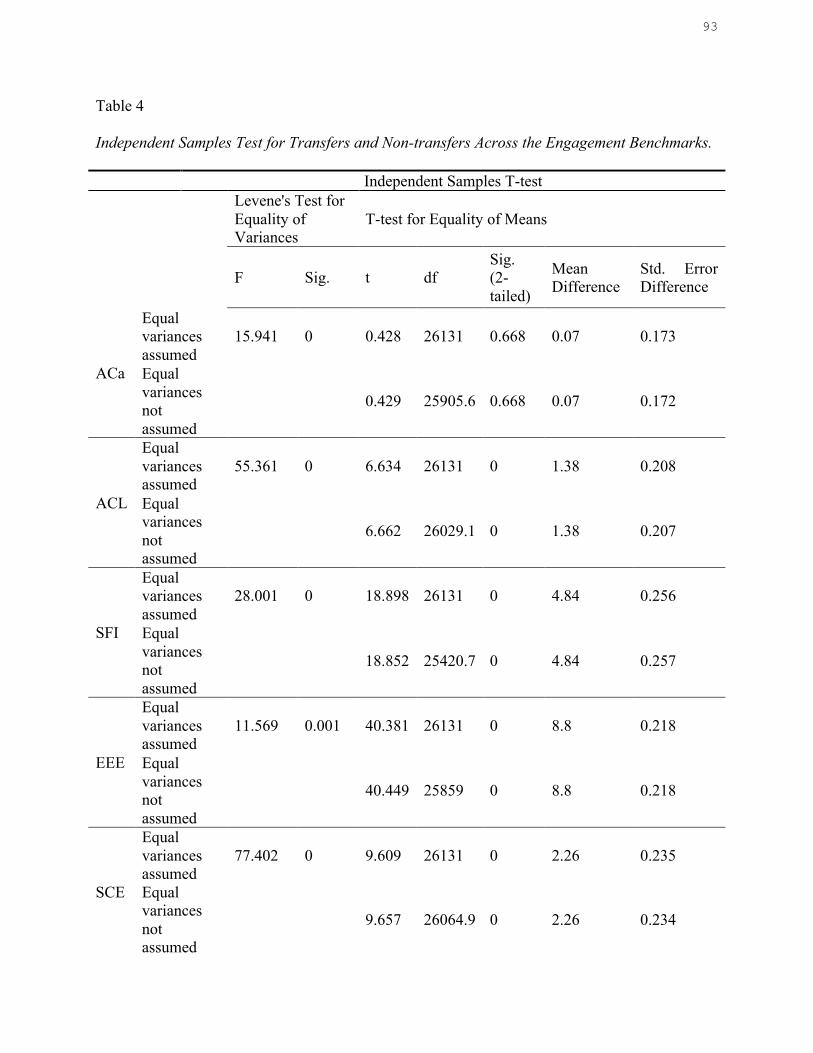
93
Table 4
Independent Samples Test for Transfers and Non-transfers Across the Engagement Benchmarks.
Independent Samples T-test
Levene's Test for Equality of Variances
T-test for Equality of Means
F Sig. t df Sig. (2-tailed)
Mean Difference
Std. Error Difference
ACa
Equal variances assumed
15.941 0 0.428 26131 0.668 0.07 0.173
Equal variances not assumed
0.429 25905.6 0.668 0.07 0.172
ACL
Equal variances assumed
55.361 0 6.634 26131 0 1.38 0.208
Equal variances not assumed
6.662 26029.1 0 1.38 0.207
SFI
Equal variances assumed
28.001 0 18.898 26131 0 4.84 0.256
Equal variances not assumed
18.852 25420.7 0 4.84 0.257
EEE
Equal variances assumed
11.569 0.001 40.381 26131 0 8.8 0.218
Equal variances not assumed
40.449 25859 0 8.8 0.218
SCE
Equal variances assumed
77.402 0 9.609 26131 0 2.26 0.235
Equal variances not assumed
9.657 26064.9 0 2.26 0.234
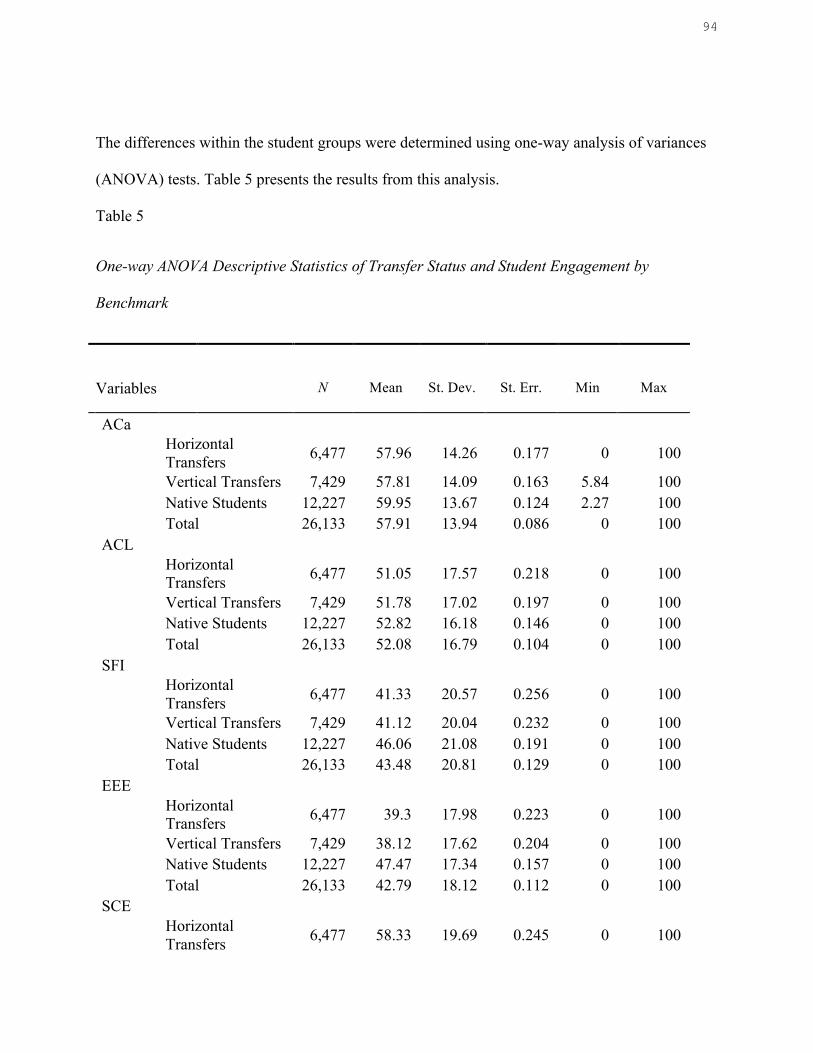
94
The differences within the student groups were determined using one-way analysis of variances
(ANOVA) tests. Table 5 presents the results from this analysis.
Table 5
One-way ANOVA Descriptive Statistics of Transfer Status and Student Engagement by
Benchmark
Variables
N
Mean
St. Dev.
St. Err.
Min
Max
ACa
Horizontal Transfers 6,477 57.96 14.26 0.177 0 100
Vertical Transfers 7,429 57.81 14.09 0.163 5.84 100
Native Students 12,227 59.95 13.67 0.124 2.27 100
Total 26,133 57.91 13.94 0.086 0 100 ACL
Horizontal Transfers 6,477 51.05 17.57 0.218 0 100
Vertical Transfers 7,429 51.78 17.02 0.197 0 100
Native Students 12,227 52.82 16.18 0.146 0 100
Total 26,133 52.08 16.79 0.104 0 100 SFI
Horizontal Transfers 6,477 41.33 20.57 0.256 0 100
Vertical Transfers 7,429 41.12 20.04 0.232 0 100
Native Students 12,227 46.06 21.08 0.191 0 100
Total 26,133 43.48 20.81 0.129 0 100 EEE
Horizontal Transfers 6,477 39.3 17.98 0.223 0 100
Vertical Transfers 7,429 38.12 17.62 0.204 0 100
Native Students 12,227 47.47 17.34 0.157 0 100
Total 26,133 42.79 18.12 0.112 0 100 SCE
Horizontal Transfers 6,477 58.33 19.69 0.245 0 100
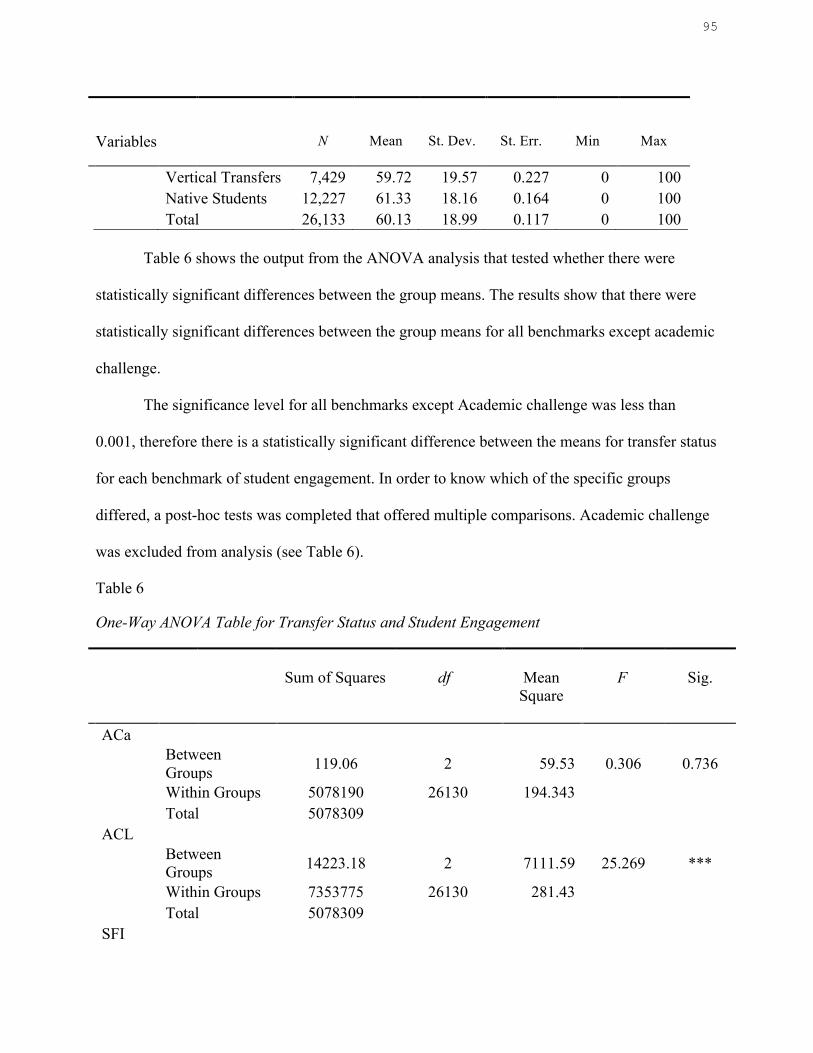
95
Variables
N
Mean
St. Dev.
St. Err.
Min
Max
Vertical Transfers 7,429 59.72 19.57 0.227 0 100
Native Students 12,227 61.33 18.16 0.164 0 100
Total 26,133 60.13 18.99 0.117 0 100
Table 6 shows the output from the ANOVA analysis that tested whether there were
statistically significant differences between the group means. The results show that there were
statistically significant differences between the group means for all benchmarks except academic
challenge.
The significance level for all benchmarks except Academic challenge was less than
0.001, therefore there is a statistically significant difference between the means for transfer status
for each benchmark of student engagement. In order to know which of the specific groups
differed, a post-hoc tests was completed that offered multiple comparisons. Academic challenge
was excluded from analysis (see Table 6).
Table 6
One-Way ANOVA Table for Transfer Status and Student Engagement
Sum of Squares
df
Mean Square
F
Sig.
ACa
Between Groups 119.06 2 59.53 0.306 0.736
Within Groups 5078190 26130 194.343
Total 5078309
ACL
Between Groups 14223.18 2 7111.59 25.269 ***
Within Groups 7353775 26130 281.43
Total 5078309
SFI
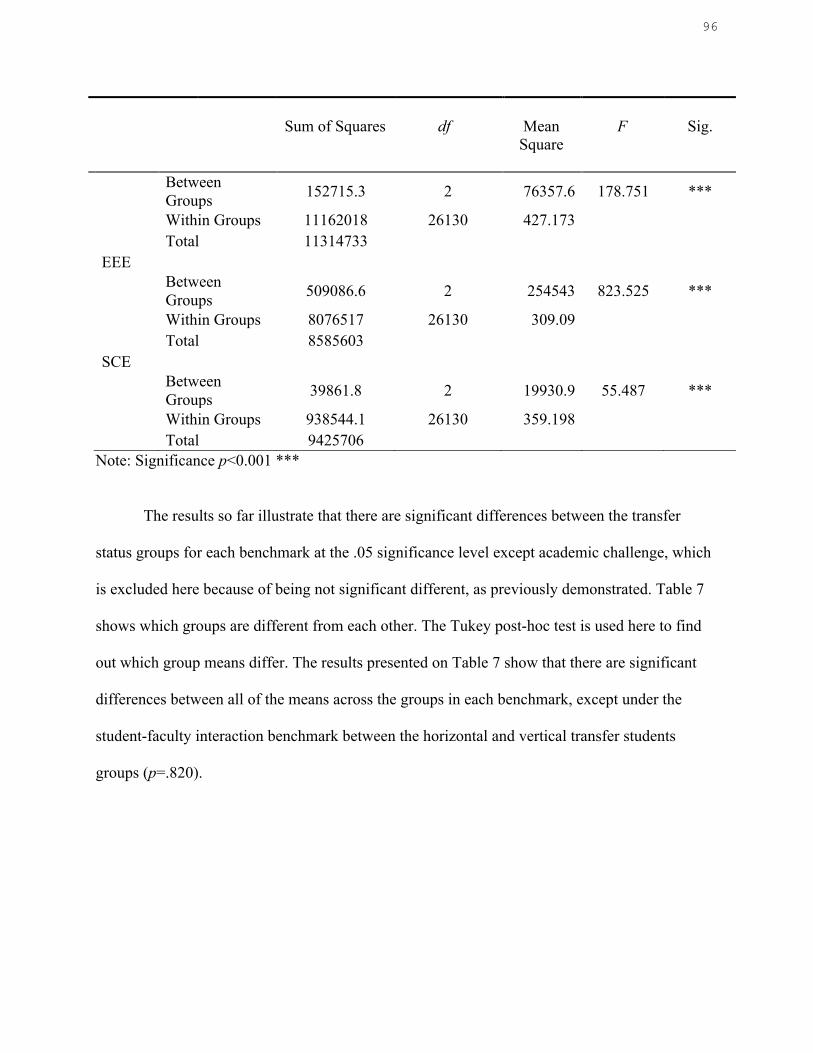
96
Sum of Squares
df
Mean Square
F
Sig.
Between Groups 152715.3 2 76357.6 178.751 ***
Within Groups 11162018 26130 427.173
Total 11314733
EEE
Between Groups 509086.6 2 254543 823.525 ***
Within Groups 8076517 26130 309.09
Total 8585603
SCE
Between Groups 39861.8 2 19930.9 55.487 ***
Within Groups 938544.1 26130 359.198
Total 9425706 Note: Significance p<0.001 ***
The results so far illustrate that there are significant differences between the transfer
status groups for each benchmark at the .05 significance level except academic challenge, which
is excluded here because of being not significant different, as previously demonstrated. Table 7
shows which groups are different from each other. The Tukey post-hoc test is used here to find
out which group means differ. The results presented on Table 7 show that there are significant
differences between all of the means across the groups in each benchmark, except under the
student-faculty interaction benchmark between the horizontal and vertical transfer students
groups (p=.820).
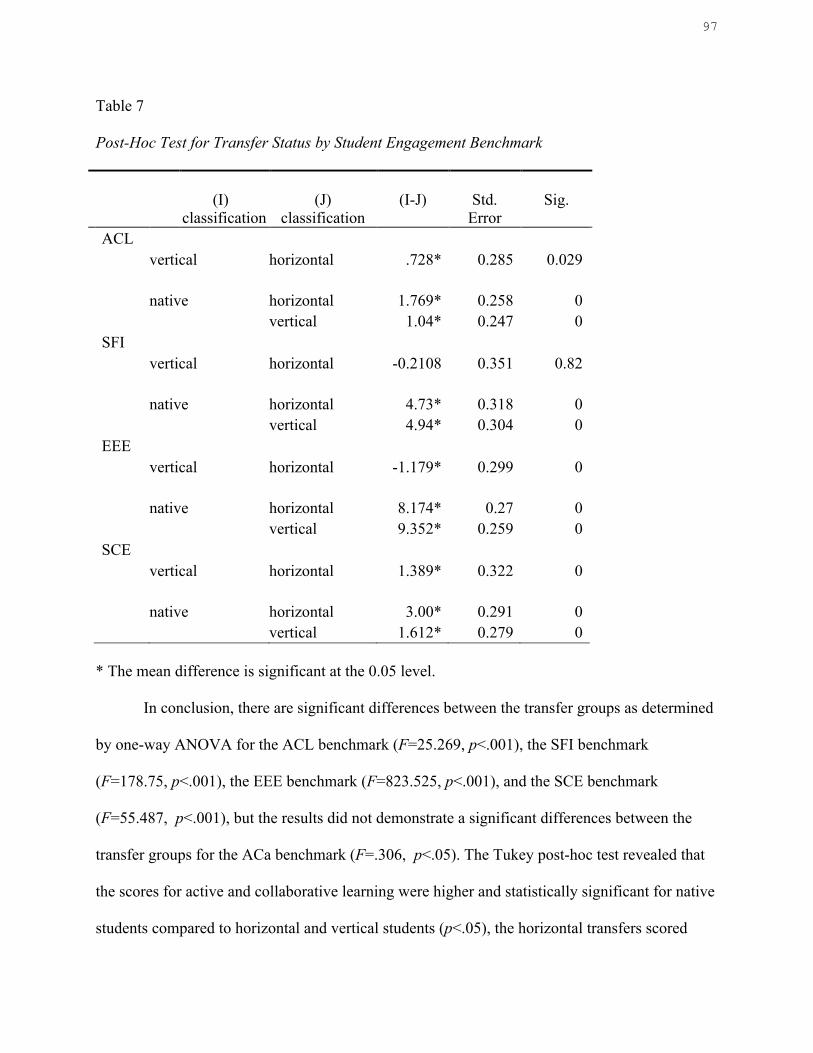
97
Table 7
Post-Hoc Test for Transfer Status by Student Engagement Benchmark
(I)
classification
(J)
classification
(I-J)
Std.
Error
Sig.
ACL
vertical horizontal .728* 0.285 0.029
native horizontal 1.769* 0.258 0
vertical 1.04* 0.247 0
SFI
vertical horizontal -0.2108 0.351 0.82
native horizontal 4.73* 0.318 0
vertical 4.94* 0.304 0
EEE
vertical horizontal -1.179* 0.299 0
native horizontal 8.174* 0.27 0
vertical 9.352* 0.259 0
SCE
vertical horizontal 1.389* 0.322 0
native horizontal 3.00* 0.291 0
vertical 1.612* 0.279 0
* The mean difference is significant at the 0.05 level. In conclusion, there are significant differences between the transfer groups as determined
by one-way ANOVA for the ACL benchmark (F=25.269, p<.001), the SFI benchmark
(F=178.75, p<.001), the EEE benchmark (F=823.525, p<.001), and the SCE benchmark
(F=55.487, p<.001), but the results did not demonstrate a significant differences between the
transfer groups for the ACa benchmark (F=.306, p<.05). The Tukey post-hoc test revealed that
the scores for active and collaborative learning were higher and statistically significant for native
students compared to horizontal and vertical students (p<.05), the horizontal transfers scored
98
significantly lower on this benchmark when compared to vertical transfers (p<.05). For the
student-faculty interaction benchmark, the ANOVA post-hoc revealed similar results. Native
students scored higher than the two transfer groups (p<0.001). However, there were no
statistically significant differences between the horizontal and vertical transfers for this
benchmark (p>.05).
The results for the remainder of the student engagement benchmarks, the enriching
educational experiences and supportive campus environment, also showed that native students
scored higher in each benchmark as compared to any one of the two transfer groups (p<.001).
This indicated that across all benchmark native students were more engaged in their education
and with their campus, than transfer students.
Multiple Regression
In order to determine the relationship between transfer status and student engagement
benchmarks and the impact of any other variables, such as student characteristics or institutional
factors, standard multiple regression was conducted to address each one of the research questions
due to the continuous nature of the each one of the student engagement benchmarks except
academic challenge (ACa).
The results of the first multiple regression analysis showed that a significant relationship
existed between transfer status and student engagement benchmarks. Table 8 presents the results
for transfer status by benchmark.
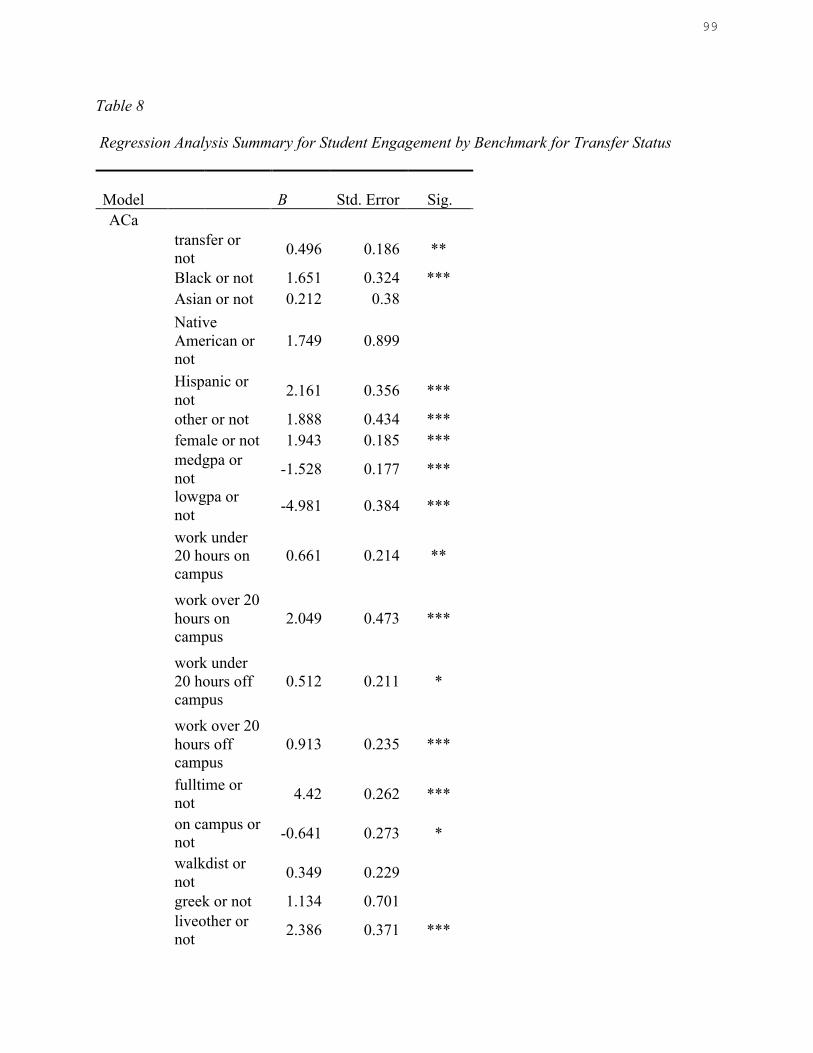
99
Table 8
Regression Analysis Summary for Student Engagement by Benchmark for Transfer Status
Model
B
Std. Error
Sig.
ACa
transfer or not 0.496 0.186 **
Black or not 1.651 0.324 ***
Asian or not 0.212 0.38
Native American or not
1.749 0.899
Hispanic or not 2.161 0.356 ***
other or not 1.888 0.434 ***
female or not 1.943 0.185 ***
medgpa or not -1.528 0.177 ***
lowgpa or not -4.981 0.384 ***
work under 20 hours on campus
0.661 0.214 **
work over 20 hours on campus
2.049 0.473 ***
work under 20 hours off campus
0.512 0.211 *
work over 20 hours off campus
0.913 0.235 ***
fulltime or not 4.42 0.262 ***
on campus or not -0.641 0.273 *
walkdist or not 0.349 0.229
greek or not 1.134 0.701
liveother or not 2.386 0.371 ***
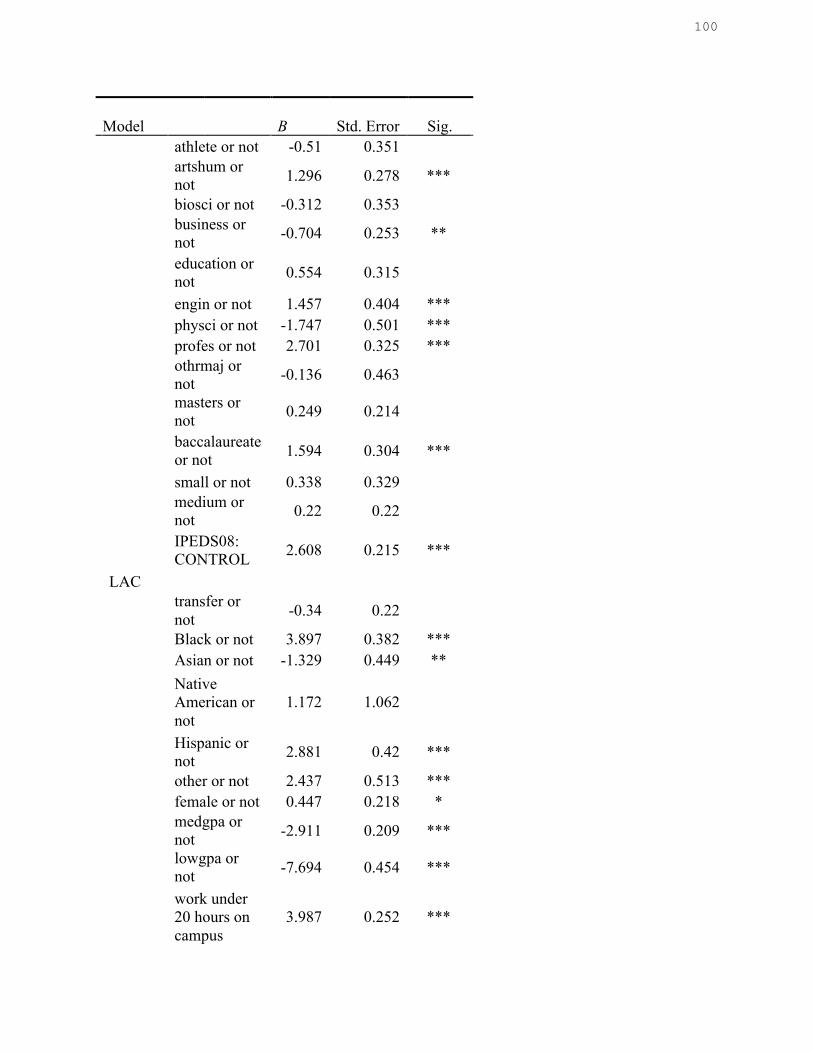
100
Model
B
Std. Error
Sig.
athlete or not -0.51 0.351
artshum or not 1.296 0.278 ***
biosci or not -0.312 0.353
business or not -0.704 0.253 **
education or not 0.554 0.315
engin or not 1.457 0.404 ***
physci or not -1.747 0.501 ***
profes or not 2.701 0.325 ***
othrmaj or not -0.136 0.463
masters or not 0.249 0.214
baccalaureate or not 1.594 0.304 ***
small or not 0.338 0.329
medium or not 0.22 0.22
IPEDS08: CONTROL 2.608 0.215 ***
LAC
transfer or not -0.34 0.22
Black or not 3.897 0.382 ***
Asian or not -1.329 0.449 **
Native American or not
1.172 1.062
Hispanic or not 2.881 0.42 ***
other or not 2.437 0.513 ***
female or not 0.447 0.218 *
medgpa or not -2.911 0.209 ***
lowgpa or not -7.694 0.454 ***
work under 20 hours on campus
3.987 0.252 ***
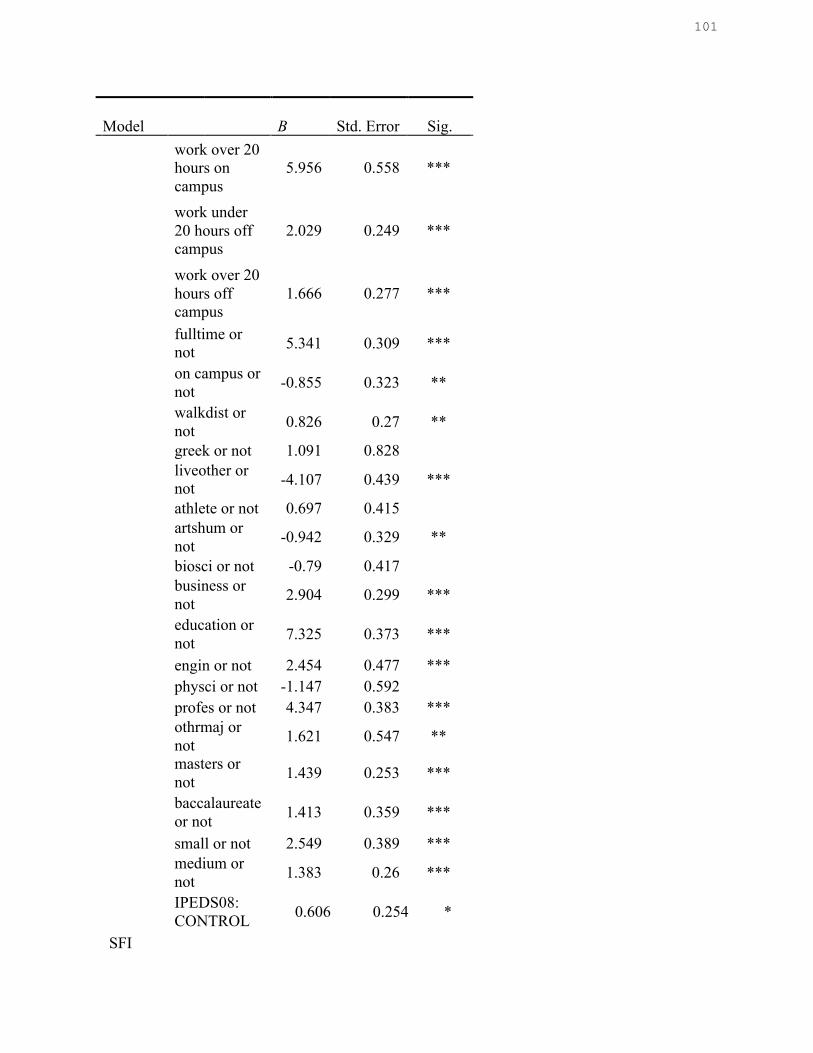
101
Model
B
Std. Error
Sig.
work over 20 hours on campus
5.956 0.558 ***
work under 20 hours off campus
2.029 0.249 ***
work over 20 hours off campus
1.666 0.277 ***
fulltime or not 5.341 0.309 ***
on campus or not -0.855 0.323 **
walkdist or not 0.826 0.27 **
greek or not 1.091 0.828
liveother or not -4.107 0.439 ***
athlete or not 0.697 0.415
artshum or not -0.942 0.329 **
biosci or not -0.79 0.417
business or not 2.904 0.299 ***
education or not 7.325 0.373 ***
engin or not 2.454 0.477 ***
physci or not -1.147 0.592
profes or not 4.347 0.383 ***
othrmaj or not 1.621 0.547 **
masters or not 1.439 0.253 ***
baccalaureate or not 1.413 0.359 ***
small or not 2.549 0.389 ***
medium or not 1.383 0.26 ***
IPEDS08: CONTROL 0.606 0.254 *
SFI
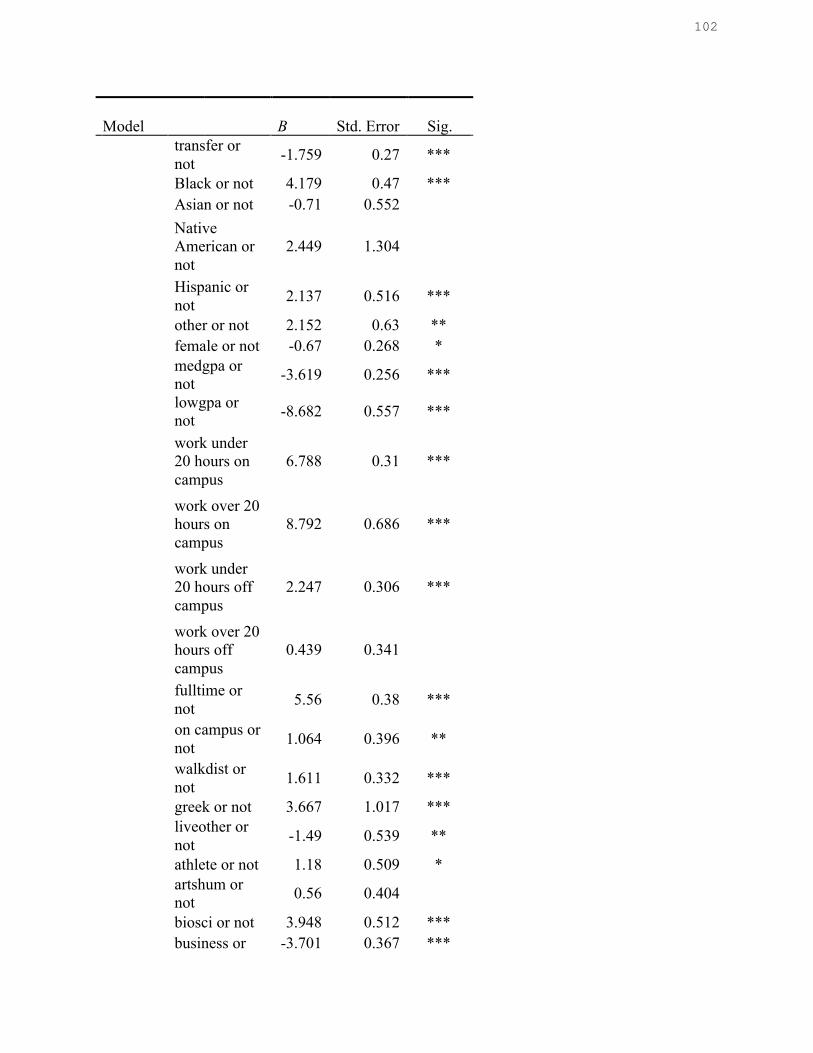
102
Model
B
Std. Error
Sig.
transfer or not -1.759 0.27 ***
Black or not 4.179 0.47 ***
Asian or not -0.71 0.552
Native American or not
2.449 1.304
Hispanic or not 2.137 0.516 ***
other or not 2.152 0.63 **
female or not -0.67 0.268 *
medgpa or not -3.619 0.256 ***
lowgpa or not -8.682 0.557 ***
work under 20 hours on campus
6.788 0.31 ***
work over 20 hours on campus
8.792 0.686 ***
work under 20 hours off campus
2.247 0.306 ***
work over 20 hours off campus
0.439 0.341
fulltime or not 5.56 0.38 ***
on campus or not 1.064 0.396 **
walkdist or not 1.611 0.332 ***
greek or not 3.667 1.017 ***
liveother or not -1.49 0.539 **
athlete or not 1.18 0.509 *
artshum or not 0.56 0.404
biosci or not 3.948 0.512 ***
business or -3.701 0.367 ***
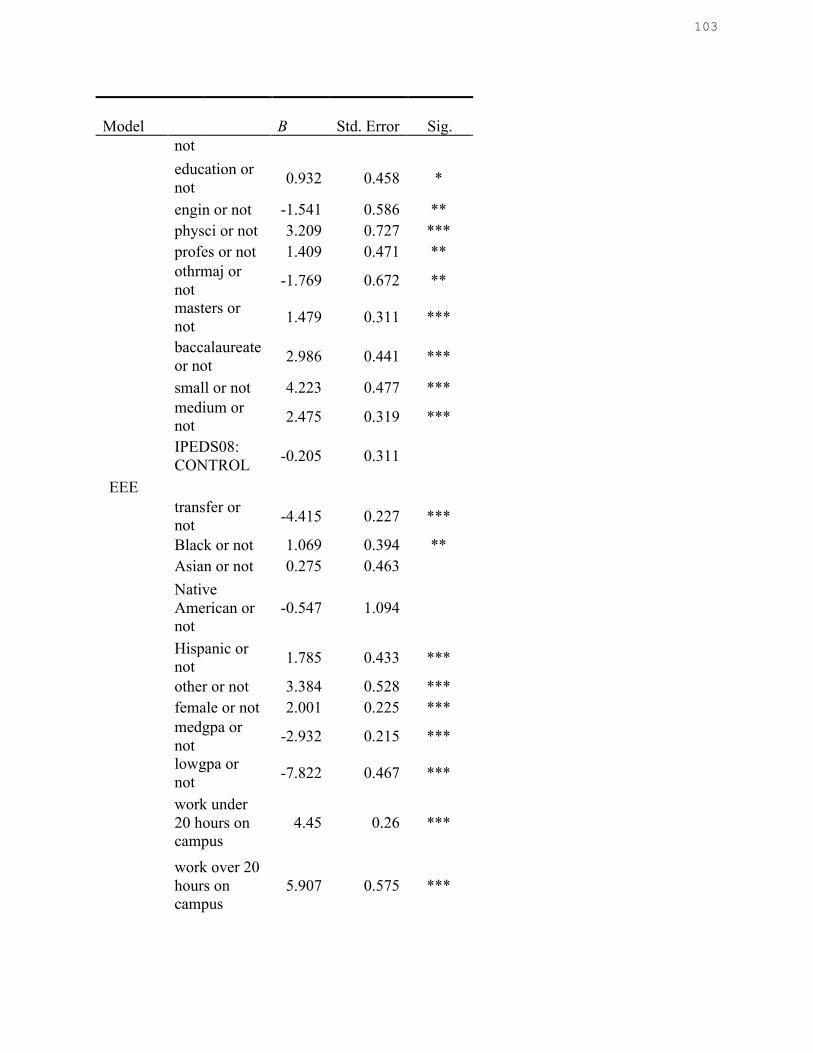
103
Model
B
Std. Error
Sig.
not
education or not 0.932 0.458 *
engin or not -1.541 0.586 **
physci or not 3.209 0.727 ***
profes or not 1.409 0.471 **
othrmaj or not -1.769 0.672 **
masters or not 1.479 0.311 ***
baccalaureate or not 2.986 0.441 ***
small or not 4.223 0.477 ***
medium or not 2.475 0.319 ***
IPEDS08: CONTROL -0.205 0.311
EEE
transfer or not -4.415 0.227 ***
Black or not 1.069 0.394 **
Asian or not 0.275 0.463
Native American or not
-0.547 1.094
Hispanic or not 1.785 0.433 ***
other or not 3.384 0.528 ***
female or not 2.001 0.225 ***
medgpa or not -2.932 0.215 ***
lowgpa or not -7.822 0.467 ***
work under 20 hours on campus
4.45 0.26 ***
work over 20 hours on campus
5.907 0.575 ***
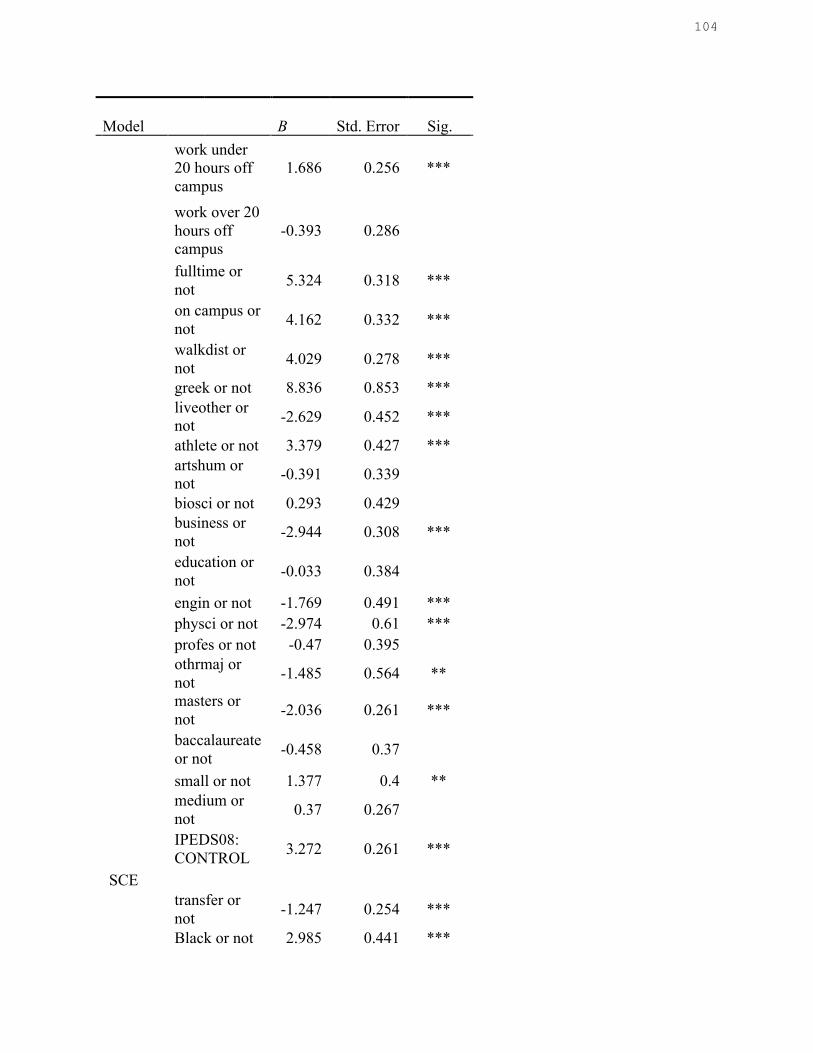
104
Model
B
Std. Error
Sig.
work under 20 hours off campus
1.686 0.256 ***
work over 20 hours off campus
-0.393 0.286
fulltime or not 5.324 0.318 ***
on campus or not 4.162 0.332 ***
walkdist or not 4.029 0.278 ***
greek or not 8.836 0.853 ***
liveother or not -2.629 0.452 ***
athlete or not 3.379 0.427 ***
artshum or not -0.391 0.339
biosci or not 0.293 0.429
business or not -2.944 0.308 ***
education or not -0.033 0.384
engin or not -1.769 0.491 ***
physci or not -2.974 0.61 ***
profes or not -0.47 0.395
othrmaj or not -1.485 0.564 **
masters or not -2.036 0.261 ***
baccalaureate or not -0.458 0.37
small or not 1.377 0.4 **
medium or not 0.37 0.267
IPEDS08: CONTROL 3.272 0.261 ***
SCE
transfer or not -1.247 0.254 ***
Black or not 2.985 0.441 ***
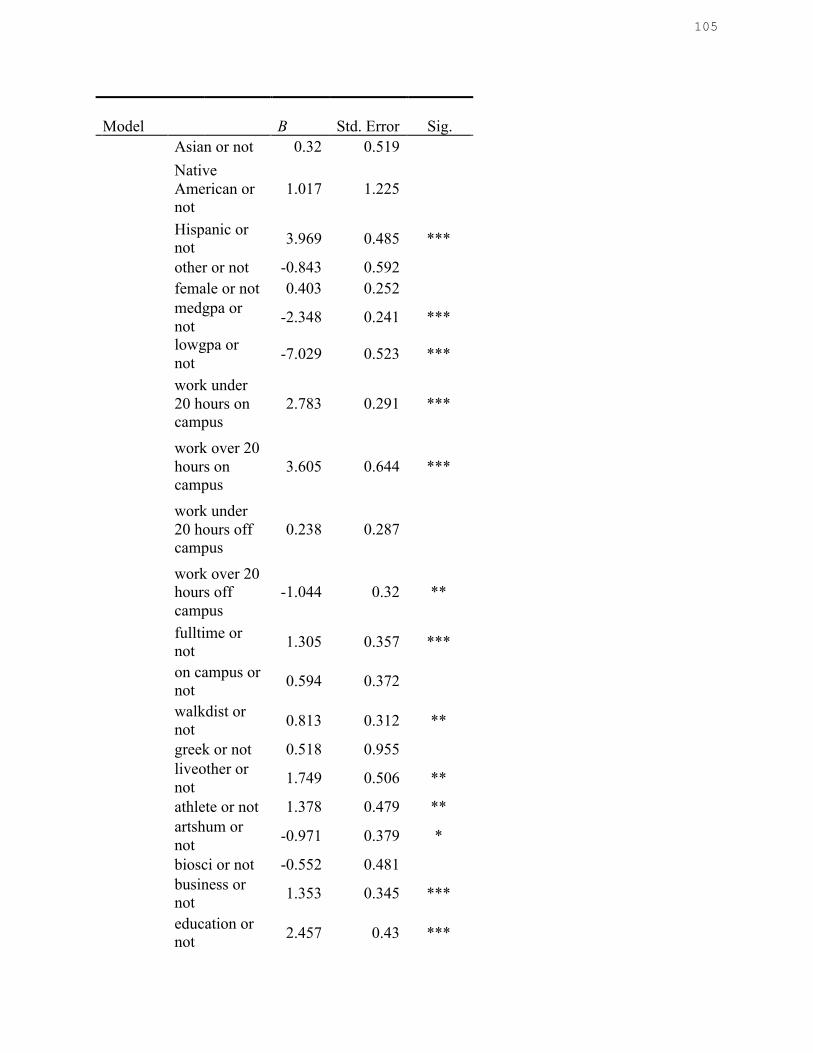
105
Model
B
Std. Error
Sig.
Asian or not 0.32 0.519
Native American or not
1.017 1.225
Hispanic or not 3.969 0.485 ***
other or not -0.843 0.592
female or not 0.403 0.252
medgpa or not -2.348 0.241 ***
lowgpa or not -7.029 0.523 ***
work under 20 hours on campus
2.783 0.291 ***
work over 20 hours on campus
3.605 0.644 ***
work under 20 hours off campus
0.238 0.287
work over 20 hours off campus
-1.044 0.32 **
fulltime or not 1.305 0.357 ***
on campus or not 0.594 0.372
walkdist or not 0.813 0.312 **
greek or not 0.518 0.955
liveother or not 1.749 0.506 **
athlete or not 1.378 0.479 **
artshum or not -0.971 0.379 *
biosci or not -0.552 0.481
business or not 1.353 0.345 ***
education or not 2.457 0.43 ***
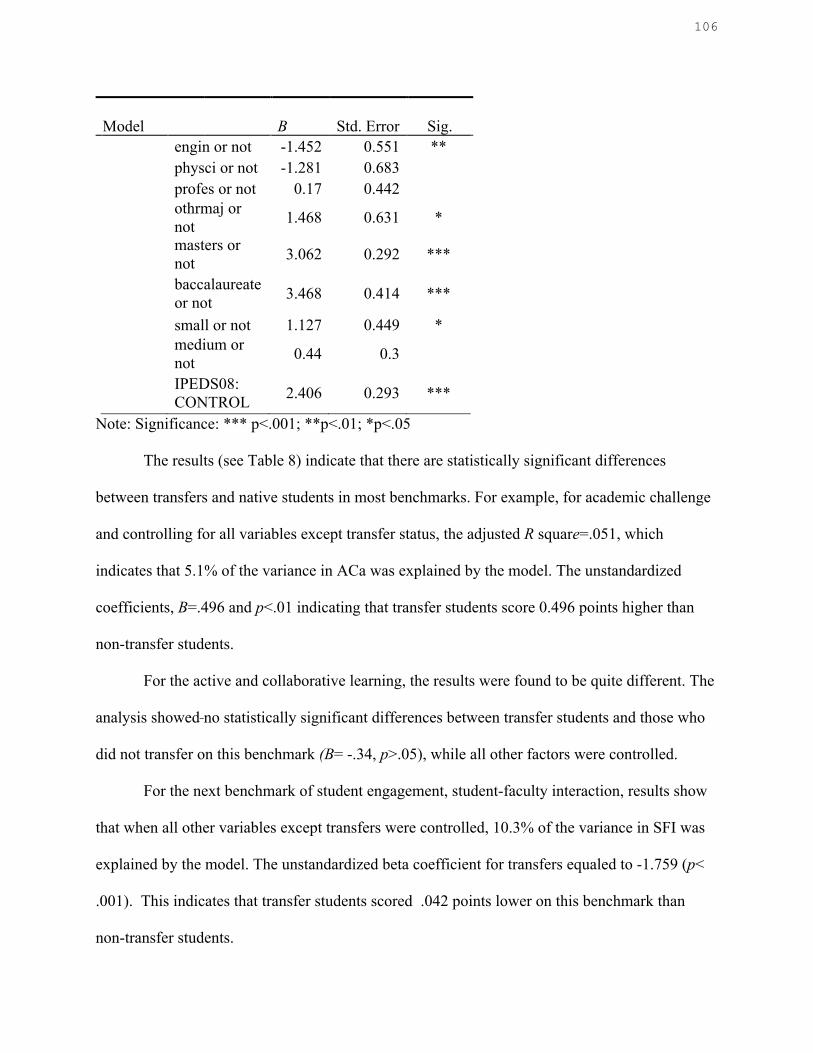
106
Model
B
Std. Error
Sig.
engin or not -1.452 0.551 **
physci or not -1.281 0.683
profes or not 0.17 0.442
othrmaj or not 1.468 0.631 *
masters or not 3.062 0.292 ***
baccalaureate or not 3.468 0.414 ***
small or not 1.127 0.449 *
medium or not 0.44 0.3
IPEDS08: CONTROL 2.406 0.293 ***
Note: Significance: *** p<.001; **p<.01; *p<.05
The results (see Table 8) indicate that there are statistically significant differences
between transfers and native students in most benchmarks. For example, for academic challenge
and controlling for all variables except transfer status, the adjusted R square=.051, which
indicates that 5.1% of the variance in ACa was explained by the model. The unstandardized
coefficients, B=.496 and p<.01 indicating that transfer students score 0.496 points higher than
non-transfer students.
For the active and collaborative learning, the results were found to be quite different. The
analysis showed no statistically significant differences between transfer students and those who
did not transfer on this benchmark (B= -.34, p>.05), while all other factors were controlled.
For the next benchmark of student engagement, student-faculty interaction, results show
that when all other variables except transfers were controlled, 10.3% of the variance in SFI was
explained by the model. The unstandardized beta coefficient for transfers equaled to -1.759 (p<
.001). This indicates that transfer students scored .042 points lower on this benchmark than
non-transfer students.
107
For the benchmark enriching education experiences, the adjusted R square=.169, meaning
16.9% of the variance in EEE is explained by the model. The unstandardized beta coefficient for
vertical transfers equaled to -4.415 (p<.001), and this indicates that transfer students scored
4.415 points lower on this benchmark as compared to native students and the p value suggests
that these results are statistically significant (p<.001).
Lastly, with regard to supportive campus environment, again controlling for all other
variables, the adjusted R square=.050. This means that the model explains 5% of the variance in
SCE. The unstandardized beta coefficient equaled to -1.247 (p<.001). This means that transfer
students scored 1.247 points lower than non-transfers on this benchmark.
In summary, the results presented this chapter suggest that transfer students exhibit lower
levels of student engagement than non-transfer students across student-faculty interactions,
enriching educational experiences, and supportive campus environment. The results for academic
challenge show that transfer students performed better on this benchmark as compared to native
students. For active and collaborative learning the differences were not to found to be
statistically significant when transfers were compared to native students.
Research Question 2
If differences in engagement level among the transfer student group exist, does such a
relationship differ by transfer type (vertical, horizontal, vs. native)?
The results of the first multiple regression analysis showed that a significant relationship
existed between the transfer status and student engagement benchmarks. Table 9 presents the
results for transfer status by benchmark.
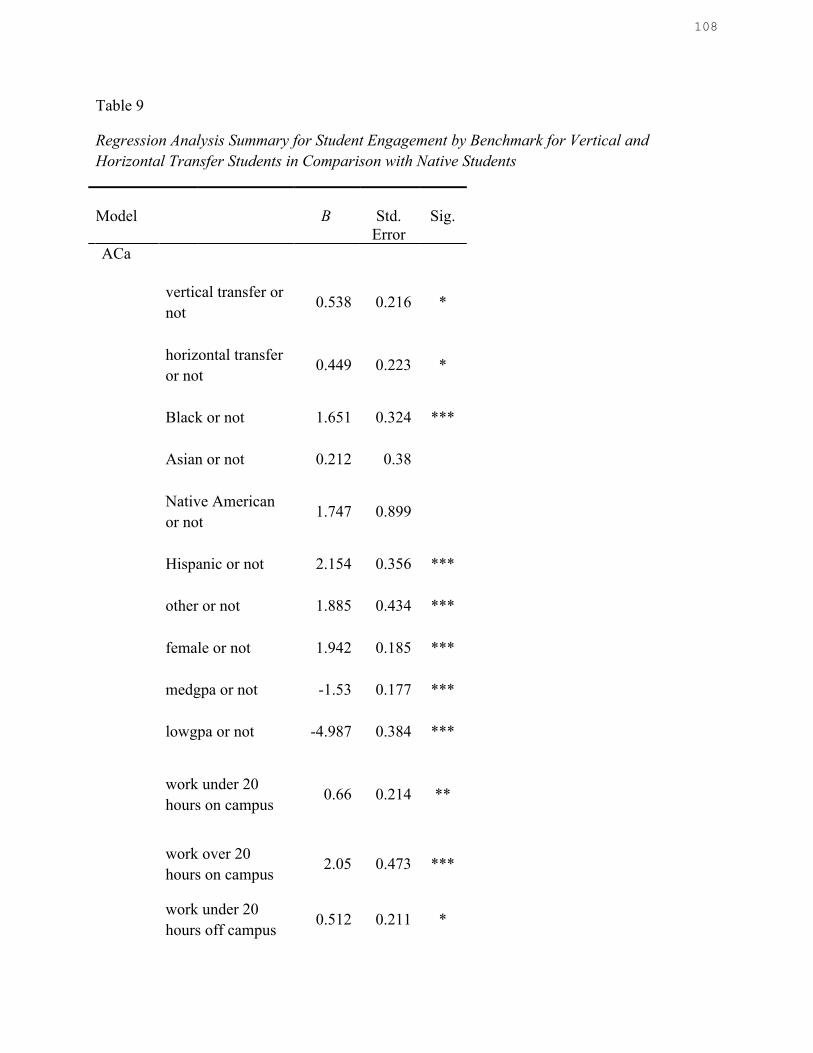
108
Table 9
Regression Analysis Summary for Student Engagement by Benchmark for Vertical and Horizontal Transfer Students in Comparison with Native Students
Model
B
Std.
Error
Sig.
ACa
vertical transfer or not
0.538 0.216 *
horizontal transfer or not
0.449 0.223 *
Black or not 1.651 0.324 ***
Asian or not 0.212 0.38
Native American or not
1.747 0.899
Hispanic or not 2.154 0.356 ***
other or not 1.885 0.434 ***
female or not 1.942 0.185 ***
medgpa or not -1.53 0.177 ***
lowgpa or not -4.987 0.384 ***
work under 20 hours on campus
0.66 0.214 **
work over 20 hours on campus
2.05 0.473 ***
work under 20 hours off campus
0.512 0.211 *
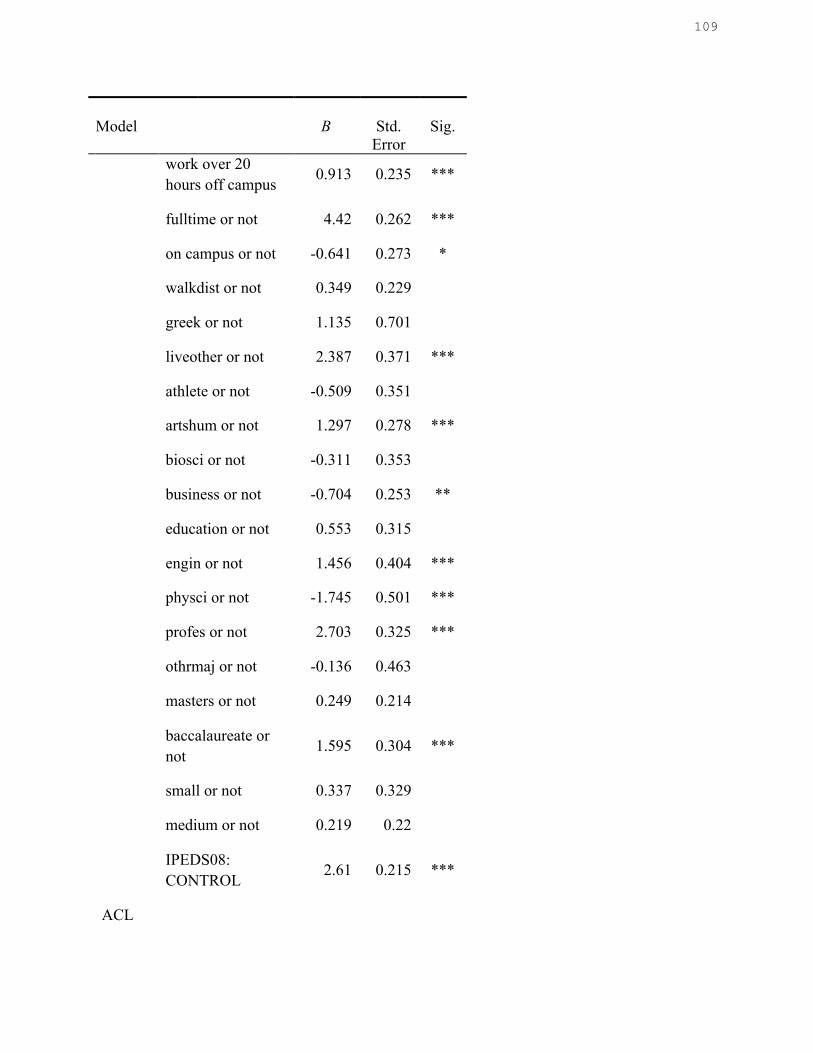
109
Model
B
Std.
Error
Sig.
work over 20 hours off campus
0.913 0.235 ***
fulltime or not 4.42 0.262 ***
on campus or not -0.641 0.273 *
walkdist or not 0.349 0.229
greek or not 1.135 0.701
liveother or not 2.387 0.371 ***
athlete or not -0.509 0.351
artshum or not 1.297 0.278 ***
biosci or not -0.311 0.353
business or not -0.704 0.253 **
education or not 0.553 0.315
engin or not 1.456 0.404 ***
physci or not -1.745 0.501 ***
profes or not 2.703 0.325 ***
othrmaj or not -0.136 0.463
masters or not 0.249 0.214
baccalaureate or not
1.595 0.304 ***
small or not 0.337 0.329
medium or not 0.219 0.22
IPEDS08: CONTROL
2.61 0.215 ***
ACL
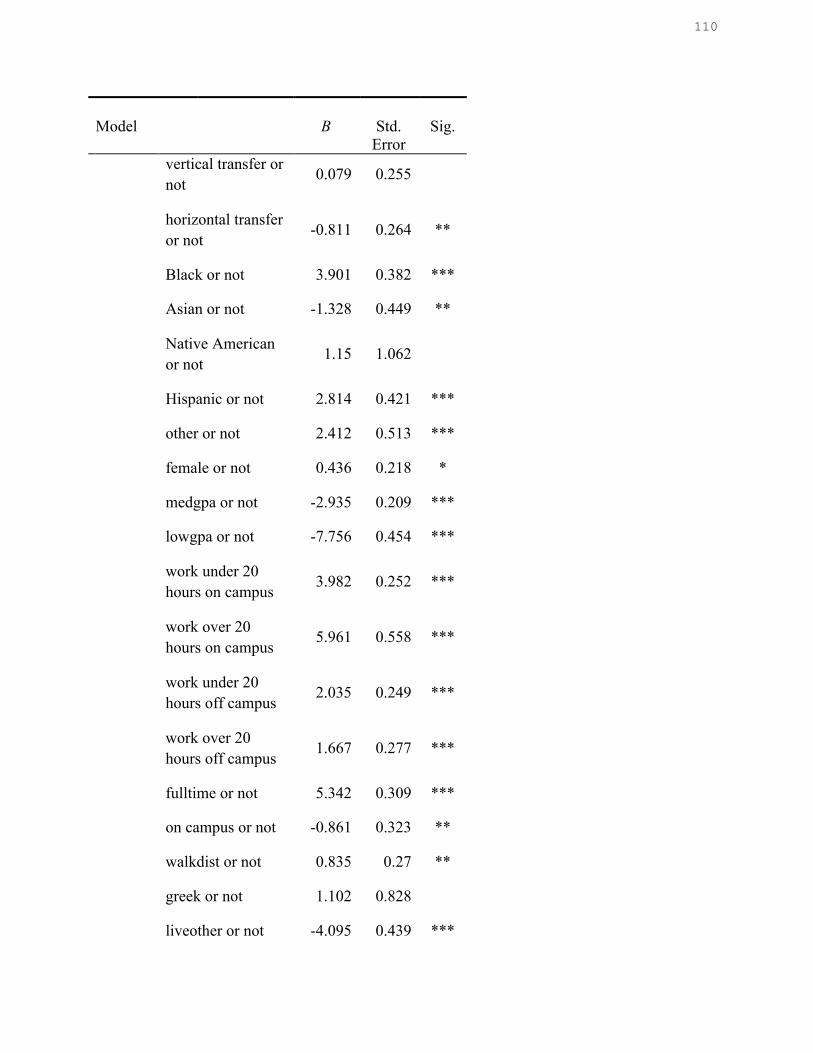
110
Model
B
Std.
Error
Sig.
vertical transfer or not
0.079 0.255
horizontal transfer or not
-0.811 0.264 **
Black or not 3.901 0.382 ***
Asian or not -1.328 0.449 **
Native American or not
1.15 1.062
Hispanic or not 2.814 0.421 ***
other or not 2.412 0.513 ***
female or not 0.436 0.218 *
medgpa or not -2.935 0.209 ***
lowgpa or not -7.756 0.454 ***
work under 20 hours on campus
3.982 0.252 ***
work over 20 hours on campus
5.961 0.558 ***
work under 20 hours off campus
2.035 0.249 ***
work over 20 hours off campus
1.667 0.277 ***
fulltime or not 5.342 0.309 ***
on campus or not -0.861 0.323 **
walkdist or not 0.835 0.27 **
greek or not 1.102 0.828
liveother or not -4.095 0.439 ***
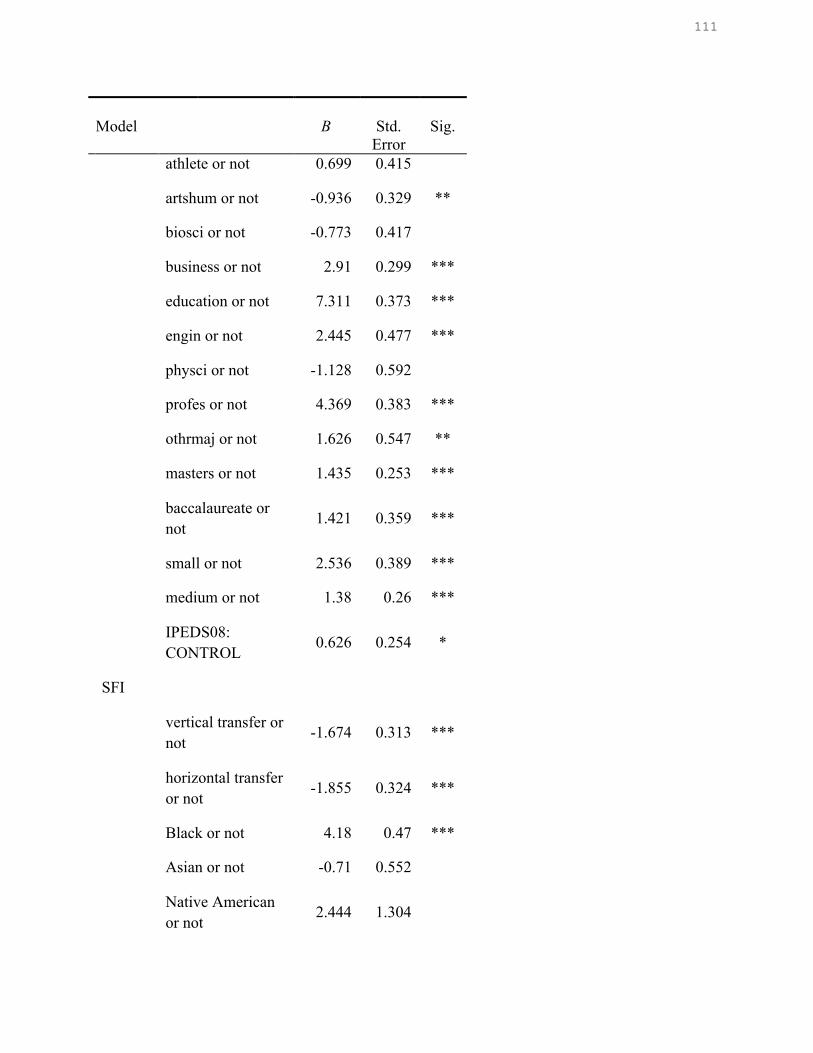
111
Model
B
Std.
Error
Sig.
athlete or not 0.699 0.415
artshum or not -0.936 0.329 **
biosci or not -0.773 0.417
business or not 2.91 0.299 ***
education or not 7.311 0.373 ***
engin or not 2.445 0.477 ***
physci or not -1.128 0.592
profes or not 4.369 0.383 ***
othrmaj or not 1.626 0.547 **
masters or not 1.435 0.253 ***
baccalaureate or not
1.421 0.359 ***
small or not 2.536 0.389 ***
medium or not 1.38 0.26 ***
IPEDS08: CONTROL
0.626 0.254 *
SFI
vertical transfer or not
-1.674 0.313 ***
horizontal transfer or not
-1.855 0.324 ***
Black or not 4.18 0.47 ***
Asian or not -0.71 0.552
Native American or not
2.444 1.304
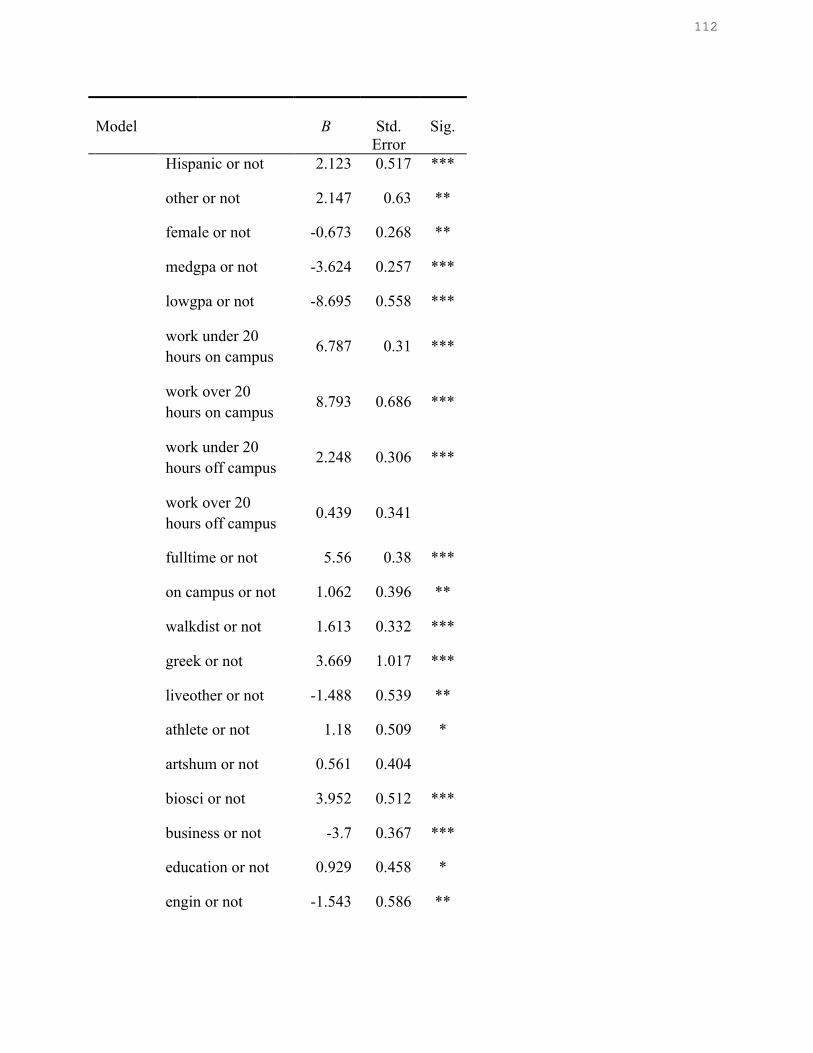
112
Model
B
Std.
Error
Sig.
Hispanic or not 2.123 0.517 ***
other or not 2.147 0.63 **
female or not -0.673 0.268 **
medgpa or not -3.624 0.257 ***
lowgpa or not -8.695 0.558 ***
work under 20 hours on campus
6.787 0.31 ***
work over 20 hours on campus
8.793 0.686 ***
work under 20 hours off campus
2.248 0.306 ***
work over 20 hours off campus
0.439 0.341
fulltime or not 5.56 0.38 ***
on campus or not 1.062 0.396 **
walkdist or not 1.613 0.332 ***
greek or not 3.669 1.017 ***
liveother or not -1.488 0.539 **
athlete or not 1.18 0.509 *
artshum or not 0.561 0.404
biosci or not 3.952 0.512 ***
business or not -3.7 0.367 ***
education or not 0.929 0.458 *
engin or not -1.543 0.586 **
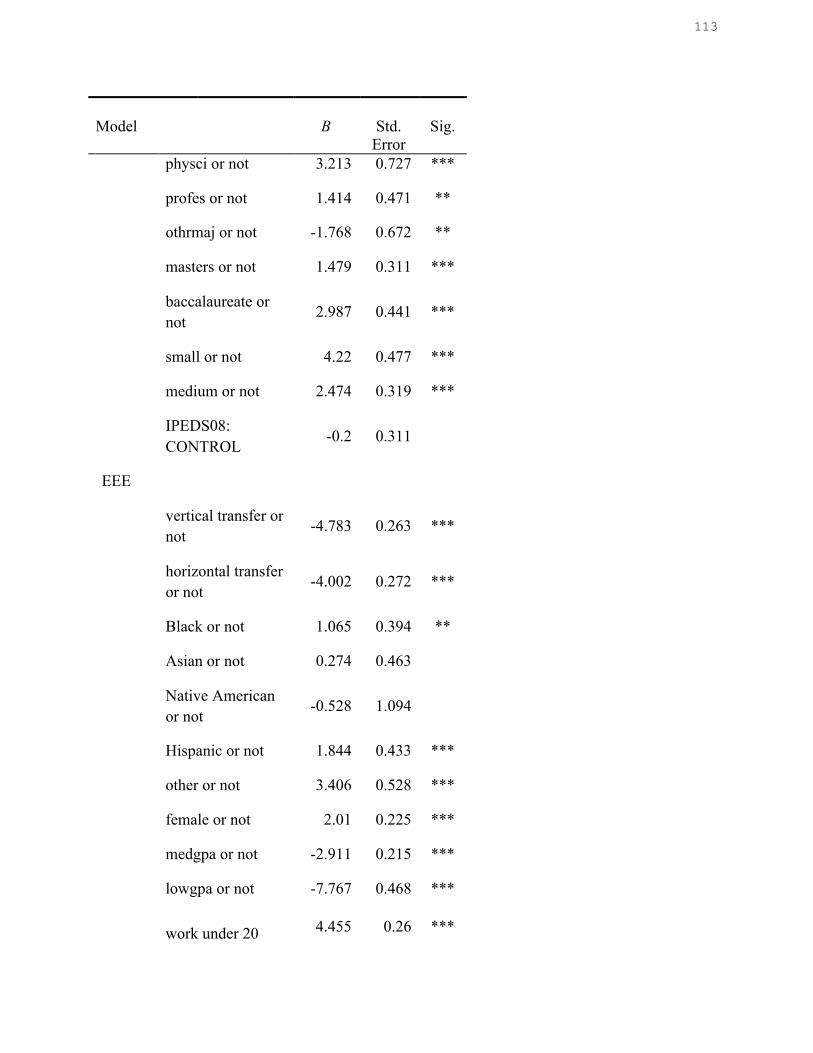
113
Model
B
Std.
Error
Sig.
physci or not 3.213 0.727 ***
profes or not 1.414 0.471 **
othrmaj or not -1.768 0.672 **
masters or not 1.479 0.311 ***
baccalaureate or not
2.987 0.441 ***
small or not 4.22 0.477 ***
medium or not 2.474 0.319 ***
IPEDS08: CONTROL
-0.2 0.311
EEE
vertical transfer or not
-4.783 0.263 ***
horizontal transfer or not
-4.002 0.272 ***
Black or not 1.065 0.394 **
Asian or not 0.274 0.463
Native American or not
-0.528 1.094
Hispanic or not 1.844 0.433 ***
other or not 3.406 0.528 ***
female or not 2.01 0.225 ***
medgpa or not -2.911 0.215 ***
lowgpa or not -7.767 0.468 ***
work under 20 4.455 0.26 ***
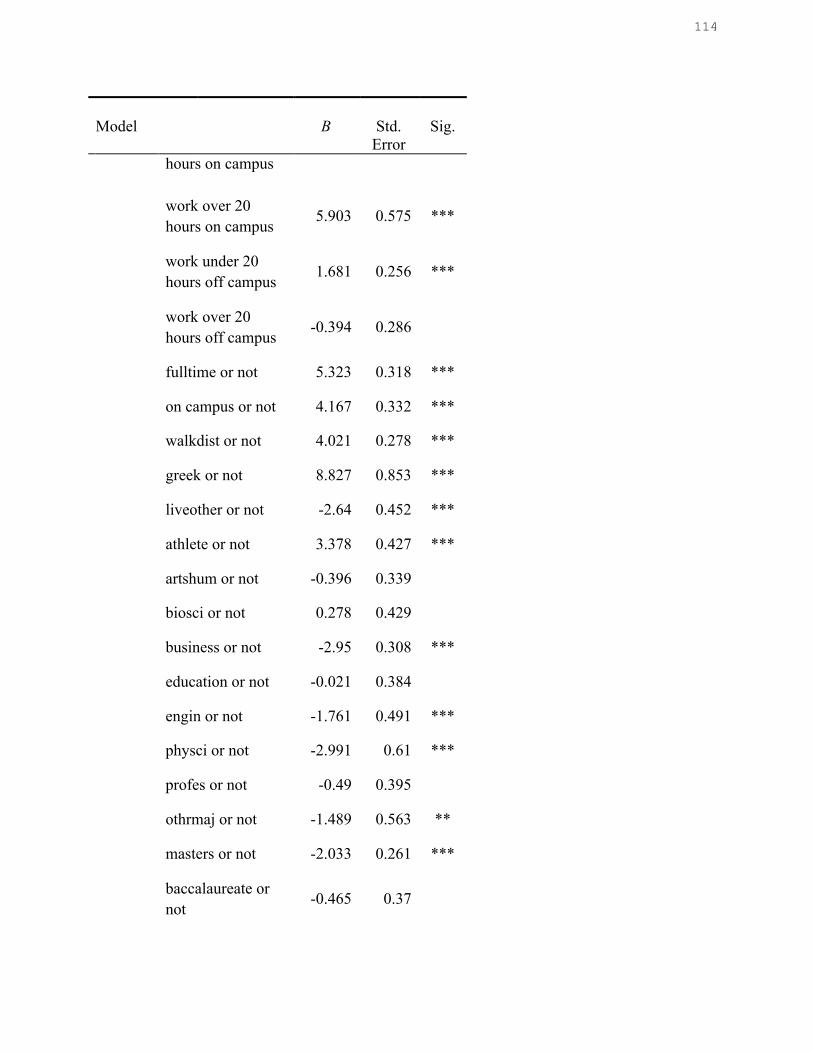
114
Model
B
Std.
Error
Sig.
hours on campus
work over 20 hours on campus
5.903 0.575 ***
work under 20 hours off campus
1.681 0.256 ***
work over 20 hours off campus
-0.394 0.286
fulltime or not 5.323 0.318 ***
on campus or not 4.167 0.332 ***
walkdist or not 4.021 0.278 ***
greek or not 8.827 0.853 ***
liveother or not -2.64 0.452 ***
athlete or not 3.378 0.427 ***
artshum or not -0.396 0.339
biosci or not 0.278 0.429
business or not -2.95 0.308 ***
education or not -0.021 0.384
engin or not -1.761 0.491 ***
physci or not -2.991 0.61 ***
profes or not -0.49 0.395
othrmaj or not -1.489 0.563 **
masters or not -2.033 0.261 ***
baccalaureate or not
-0.465 0.37
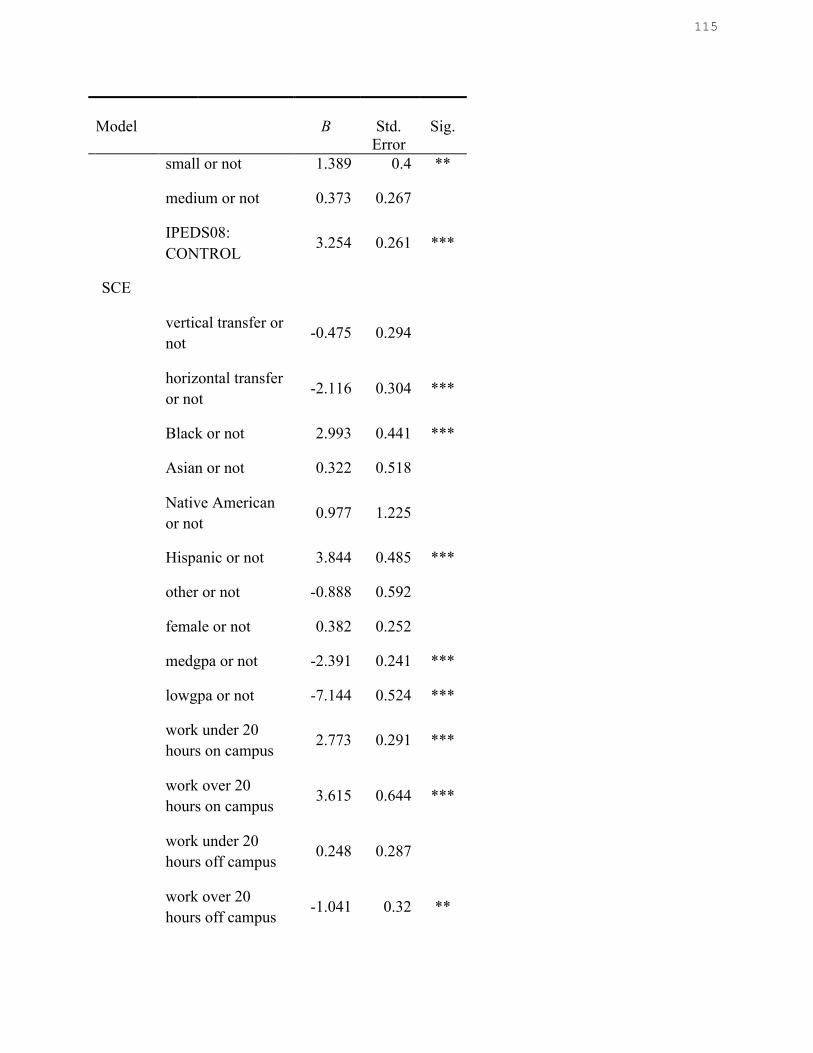
115
Model
B
Std.
Error
Sig.
small or not 1.389 0.4 **
medium or not 0.373 0.267
IPEDS08: CONTROL
3.254 0.261 ***
SCE
vertical transfer or not
-0.475 0.294
horizontal transfer or not
-2.116 0.304 ***
Black or not 2.993 0.441 ***
Asian or not 0.322 0.518
Native American or not
0.977 1.225
Hispanic or not 3.844 0.485 ***
other or not -0.888 0.592
female or not 0.382 0.252
medgpa or not -2.391 0.241 ***
lowgpa or not -7.144 0.524 ***
work under 20 hours on campus
2.773 0.291 ***
work over 20 hours on campus
3.615 0.644 ***
work under 20 hours off campus
0.248 0.287
work over 20 hours off campus
-1.041 0.32 **
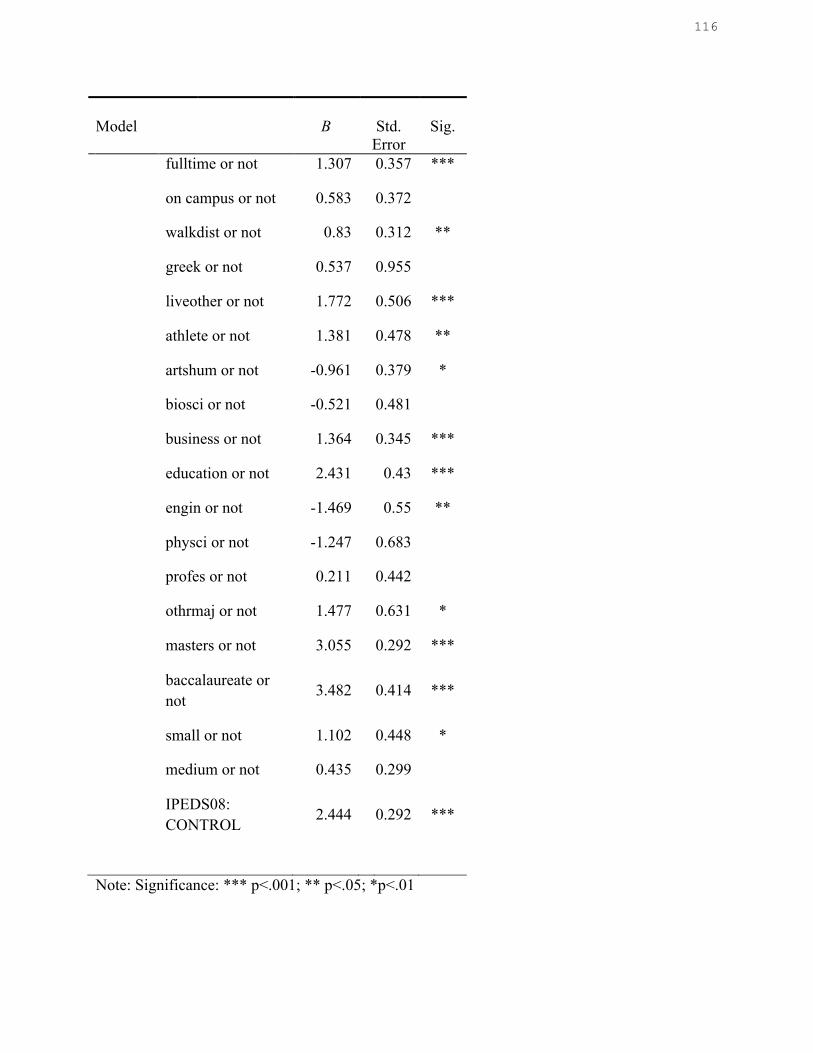
116
Model
B
Std.
Error
Sig.
fulltime or not 1.307 0.357 ***
on campus or not 0.583 0.372
walkdist or not 0.83 0.312 **
greek or not 0.537 0.955
liveother or not 1.772 0.506 ***
athlete or not 1.381 0.478 **
artshum or not -0.961 0.379 *
biosci or not -0.521 0.481
business or not 1.364 0.345 ***
education or not 2.431 0.43 ***
engin or not -1.469 0.55 **
physci or not -1.247 0.683
profes or not 0.211 0.442
othrmaj or not 1.477 0.631 *
masters or not 3.055 0.292 ***
baccalaureate or not
3.482 0.414 ***
small or not 1.102 0.448 *
medium or not 0.435 0.299
IPEDS08: CONTROL
2.444 0.292 ***
Note: Significance: *** p<.001; ** p<.05; *p<.01
117
The results shown in Table 9 are broken down in terms of transfer category, horizontal
and vertical transfers. In this case, both are compared to native students, who were the reference
group, Table 9 shows that there are statistically significant differences between vertical transfers,
horizontal transfers, and native students in most benchmarks. For example, for academic
challenge, when all variables except vertical and horizontal transfer status were controlled, the
adjusted R square=.051, which indicates that 5.1% of the variance in ACa was explained by the
model. The unstandardized coefficients for vertical transfers, B=.538 and p<0.01, which
indicates that vertical transfer students scored 0.538 points higher than non-transfer students.
Compared to native students, horizontal transfers score .449 points higher on this benchmark
[B=.449 p<.05]. The model is statistically significant at p<.05.
For the active and collaborative learning, the results were different. The model showed
no statistically significant differences between vertical transfer students and those who did not
transfer on this benchmark (B= .79, p>.05), when all other factors were controlled. However, for
horizontal transfers, B= -.811 (p<.01), with an F value of 76.551 and p<.000 and adjusted R
square of .087, meaning that the model explains 8.7% of the variance in ACL for horizontal
transfer students. The results indicate that, as compared to native students, horizontal transfers
scored .087 points lower on this benchmark.
The results associated with the next benchmark of student engagement, student-faculty
interaction shows that controlling for all other variables except vertical transfer and horizontal
transfer, the adjusted R square= .103, meaning that 10.3% of the variance in SFI is explained by
the model. The unstandardized beta coefficient for vertical transfer status equaled -1.674 (p<
.001). This indicates that vertical transfer students scored 1.674 points lower on this benchmark
than non-transfer students. Similarly, the beta coefficient for horizontal students was found to be
118
-1.855 (p<.001), therefore, when compared to native students, horizontal transfers score with
1.855 points lower on this benchmark.
In enriching education experiences, the adjusted R square=.169, meaning 16.9% of the
variance in EEE is explained by the model. The unstandardized beta coefficient for vertical
transfers equaled -4.783 (p<.001), and this indicates that vertical transfer students scored 4.783
points lower on this benchmark than non-transfers. As far as horizontal transfers, the results
indicate that B= -4.002 (p<.001), therefore this group of students scored 4.002 lower than native
students, and the results were found to be statistically significant. This benchmark showed the
highest differences between the groups.
Lastly, for the supportive campus environment benchmark, again when all other variables
were controlled, adjusted R square=.051, This means that the model explains 5.1% of the
variance in SCE The unstandardized beta for the vertical transfers coefficient was found to be -
.475 (p>.05). This suggests that there was no significant difference between transfers and
vertical transfer students. Differences between horizontal and native students on the SCE were
found to exist, however. For horizontal transfers, B= -2.116 (p<.001), therefore horizontal
transfers scored 2.116 points lower than native students. These results were found to be
statistically significant.
In summary, the results, as presented in Table 9, suggest that differences in engagement
levels existed within the both vertical and horizontal transfer students for academic challenge,
student-faculty Interaction, and enriching education experiences when compared to native
students. For active and collaborative learning and supportive campus environment, while both
vertical and horizontal transfers showed differences when compared to the reference group of
119
native students, only the results for horizontal transfers were found to be significant for both
benchmarks.
Research Question 3
What other student characteristics are associated with student engagement?
The data to address this research question are presented by benchmark in Table 9.
Academic Challenge-Aca. For the first benchmark, several variables were found to be
significant factors that affected student engagement. In the race category, with White being the
reference group, Black and Hispanic were found to be the two variables that affected academic
challenge. Black students (B=1.651, p<.001), as compared to White students, scored 1.651 points
higher on this benchmark. This is consistent with (see Chapter 2). Hispanic students were found
to have a B value of 2.154 (p<.001), meaning they scored 2.154 points higher on this benchmark,
which has not generally been supported by previous research. Gender was another characteristic
that was found to affect ACa. Compared to male students, female students scored 1.942 points
higher on ACa (B=1.942, p<.001). This finding was statistically suggesting significant.
Academic characteristics were also factors found to affect student engagement. With top
GPA (or grades of A to A-) being the reference group, students who reported lower GPAs also
had lower scores on the academic challenge indicator of student engagement. Compared to top
grades A and A-, students with grades from B- to B+ and grades between C+ and C-, the
students in the last two categories reported lower scores on this benchmark as well.
Employment was found to be a factor that affected student engagement as well. However,
contrary to the literature previously discussed, all of the variables for working on and off campus
were found to be statistically significant for ACa, and all of them received positive
unstandardized beta coefficients. This suggests that, compared to the students who did not work
120
either on or off campus, the students who were employed either on or off campus performed
better on the academic challenge benchmark.
However, in line with previous research on enrollment status and student engagement, for
ACa, full-time students scored 4.42 points higher than their part-time counterparts (B=4.420,
p<.001) confirming that spending time on campus is important in taking advantage of student
engagement opportunities.
The variables for academic major showed mixed results (see Table 9). The majors that had
statistically significant findings were arts and humanities, business, engineering, the physical
sciences, and professional studies. They all showed significance of at least lower than .01
(p<.01).
Active and collaborative learning-ACL. While vertical transfer was not found to be a
statistically significant factor for ACL, other student characteristics were found to be statistically
significant. As regards race, compared to White students, Black students scored 3.901 points
higher on this benchmark (B=3.90, p<.001), Asian students scored -.1.328 lower than White
students (B= -1.328, p<.01), and Hispanic students scored 2.814 points higher than White
students (B=2.814, p< .001). Gender also mattered for active and collaborative learning.
Compared to male students, female students scored .436 points higher (B=.436, p<.05).
For academic characteristics, GPA was found to be a factor for ACL. Students who
reported medium and low GPAs scored lower on this benchmark than students who reported
high GPAs. For the employment variables, both working on and off campus were found to be
statistically significant and all of those variables had positive unstandardized beta coefficients.
This suggests that the students who were employed either on or off campus performed better on
the active and collaborative learning benchmark. However, those students who were enrolled
121
full-time also scored 5.324 points higher than students who were enrolled part-time (B=5.324,
p<.001).
Lastly, certain academic majors were found to be statistically significant factors for ACL.
Arts and humanities, business, education, engineering, and professional studies were all
statistically significant factors for this benchmark of student engagement.
Student-faculty interaction-SFI. For this benchmark, Black and Hispanic students also
showed statistically significant results. When compared to White students, Black students scored
4.180 points higher (B=4.180, p<.001) and Hispanic students scored 2.123 points higher than
White students (B=2.123, p<.001). This finding showed that there were statistically significant
differences between White students and Black and Hispanic students with regard to student-
faculty interaction. Unlike active and collaborative learning, here female students actually scored
lower than their male counterparts. Female students scored .673 points lower (B=-.673, p<.05).
Students who reported top GPAs also outscored students with medium and low GPAs (p
<.001), and again, full-time enrollment was found to be a statistically significant factor for SFI
(B=5.560, p<.001). All academic majors except arts and humanities were found to be statistically
significant in this case (with p-values of .05 or higher).
Enriching educational experiences-EEE. Once again, compared to White students, Black
and Hispanic students were found to exhibit higher levels of engagement in this benchmark.
Black students scored 1.065 points (B= 1.065and p<.001) and Hispanic students scored 1.844
points higher (B=.1.844 and p<.001) on EEE. Gender was a significant characteristic for this
benchmark as well, with females outperforming males by 2.01 points (B=2.01, p<.001). GPA,
full-time status, and living arrangement (all except other arrangement) were found to be
statistically significant for this benchmark. Unlike the previous benchmarks, athletic status is
122
statistically significant factor for student engagement as exhibited by EEE. Athletes were found
to be more engaged than non-athletes (B=3.378, p<.001). Lastly, among the academic majors,
those that were statistically significant were Business, Engineering and Physical Sciences, while
all other majors were not significant for this benchmark
Supportive campus environment-SCE. Lastly, for supportive campus environment as a
factor of student engagement, Race, full-time status and major were found to be important
factors. Black and Hispanic students again showed higher levels of student engagement, as
indicated by the SCE benchmark. Compared to White students, Black students scored 2.993
points higher (B=2.993, p<.001) and Hispanic students scored 3.844 points higher than White
students (B=3.844, p<.001). While gender was not found to be a statistically significant factor in
SCE, full-time status was found to be statistically significant. Full-time students reported scores
1.307 points higher than students who were enrolled part-time. GPA once again mattered, as
students with top GPAs scored better on this benchmark than students who reported medium and
low grades on average. As far as academic majors, business, education, and engineering were
found to be statistically significant factors for student engagement, as exhibited by the SCE
benchmark.
Summary
The purpose of this study was to determine whether a relationship existed between
transfer status and student engagement benchmarks. Besides exploring the relationship between
transfer students and non-transfers and student engagement, this study also sought to determine if
differences existed within the transfer student population; between vertical and horizontal
transfer students. Lastly, this study looked for additional student characteristics that affected
student engagement that were suggested by the literature. This chapter presented the results of
123
the data analysis as pertained to the research questions. The results suggest that there are
differences between transfer status and further within the transfer group and native sunsets in
student engagement. Additionally, many additional student characteristics were found to be
statistically significant for student engagement. Chapter V provides a discussion of the results
and presents implications for policy, practice, and research.
124
CHAPTER V
CONCLUSIONS AND IMPLICATIONS
During the past couple of decades the body of literature on student engagement has been
grown. However, as scholars and researchers have focused on the benefits and challenges of
student engagement, the transfer student population was largely neglected from their analysis.
Most studies have focused on the traditional non-transfer student, and only a few studies have
studied the transfer student experience. No studies have compared and contrasted the vertical and
horizontal transfer path to a baccalaureate degree using the NSSE instrument on a national scale.
This study has made an effort to add to the existing body of literature through its focus on
transfer students, and specifically the vertical and horizontal subgroups of transfer students, in
comparison to native students, who are a considerable number of the student population on most
American campuses. This study is important for any U.S. institution as it analyzed student
behavior and learning by using the student engagement benchmarks. This will allow institutions
to compare results with a study on a national scale.
The main goals of this study were to study the relationship between transfer status and
student engagement and to find out whether transfer types were related to differences in the
engagement levels of transfer students. In addition, this study examined the role of student and
institutional background characteristics in student engagement. The results can help
administrators to better understand the needs of a truly heterogeneous student population and
improve student success rates and measurable outcomes, such as graduation and persistence
rates. Most importantly, stakeholders can use the results of in this study to inform and improve
policy, programs, practices, and research.
125
The conceptual framework for this study relied on the construct of student engagement,
and it included an integration of the theories of: quality of effort (Pace 1979, 1984), involvement
theory (Astin 1993), Pascarella’s model for assessing student change (Pascarella, 1985), and
integration theory (Tinto 1987, 1993). In addition, current research on student factors affecting
student engagement was reviewed and these factors were combined into three categories: transfer
status, student characteristics, and institutional characteristics, and their relationships with the
student engagement construct, as comprised of the five engagement benchmarks, were examined.
The data for this study came from the 2009 National Survey for Student Engagement, and
it was the most recent dataset available at the start of this study. NSSE data were used with
permission from The Indiana University Center for Postsecondary Research. In 2009 about 1.1
million first-year and senior students from 622 institutions in the United States and Canada were
invited to participate in the 2009 NSSE survey. Of this population, 367, 318 students responded,
and 65% of the participating institutions opted for the Web-only administration mode. About
98% of all respondents completed the survey online (NSSE, 2009a). In the 2009 NSSE
administration, overall the institutions reflected the diversity of the U.S. higher education
population with respect to institutional type, sector, region, and location (NSSE, 2009a). The
final sample used in the present study contained 26,133 senior student respondents, 6,477
horizontal transfers, 7,429 vertical transfers, and 12, 227 native students from public and private,
small and large institutions in the United States.
As noted in Chapter III, descriptive statistics about the population, and t-test and one-way
ANOVA were used to compare the type of students across each benchmark. Multiple regression
was used to address the relationship between transfer status and type of transfer and student
engagement, while all other variables were controlled. Multiple regression was also used to
126
address research question 3, but student characteristics were also considered to address the
question.
This chapter discusses the findings in the previously found. Then it provides a discussion
about the policy and practice implications and provides suggestions for future research on the
topic.
Summary of Findings and Conclusions
The descriptive analyses at the start of Chapter IV provided information about the
makeup of the student population used for the sample. Female respondents outnumbered their
male counterparts by almost 2 to 1, and the sample contained a high number of White students;
about 75%. This is consistent with other studies. However, the ratio of transfer to native students
was more evenly distributed, 53.2% and 46.8% respectively. Among the transfer students in the
sample, 24.8% were horizontal transfers and 28.4% were vertical transfer students. This was
thought to be a representative sample for comparison. A one-way analysis of variance (ANOVA)
was used to find the means of each group and to determine whether there were differences in
these means across each one of the student engagement benchmarks. The ANOVA used one
categorical variable, classification, to compare the three groups of students in this study: native,
vertical transfers, and horizontal transfers. The results showed that there are statistically
significant differences in general.
The regression analysis revealed how prevalent these differences were, by benchmark.
For academic challenge, the transfer group actually scored higher than the native students. As a
whole, when compared with native students, the transfer students scored .018 points higher on
this benchmark; a significant but perhaps not meaningful difference. Perhaps transfer students
actually performed better on this benchmark because they chose to spend more of their time on
127
academics rather than social activities. By sub-group, vertical transfers scored .018 points higher
than transfers, while horizontal transfers scored .014 points higher than transfers. Both results
were statistically significant (p<.05). For active and collaborative learning, the differences
between the vertical transfers and native students were not found to be significant, but when
horizontal transfers were compared to native students, the native students were found to have
higher levels of engagement. For student-faculty interaction, transfer students exhibited lower
levels of engagement than native students. Both vertical and horizontal students were
significantly less engaged than native students on this benchmark. This was also true for the
enriching educational experiences benchmark. As a whole, the transfer students were
significantly less engaged than the native student population, and further analysis of the transfer
groups revealed this to be the case for both vertical and horizontal transfers. Lastly, for the fifth
benchmark, supportive campus environment, the data analysis showed that there were
differences in the engagement levels as well, but only between horizontal transfers and native
students, with horizontal transfers scoring lower than native students. Vertical transfers were not
found to have statistically different levels of student engagement compared to native students.
The regression analyses revealed that there were certain student and institutional
characteristics that were associated with student engagement. As the review of the literature
revealed, gender, race, enrollment status, GPA, employment status, residential status, and
additional factors (such as major and athletic affiliation), as well as institutional characteristics
such as control, classification, and size were previously found to affect student engagement.
Gender differences in engagement levels were discussed in the analysis of the dataset in
the previous chapter. Female students showed significantly higher levels of engagement across
all benchmarks except supportive campus environment. This finding is consisted with empirical
128
research, which has shown, in general, that women are more engaged than their male
counterparts. Contrary to what previous research has suggested, this study found that, after
controlling for other characteristics, Black and Hispanic students as compared with White
students in the sample, had generally higher levels of student engagement across each
benchmark. The research literature on race and student engagement (see Chapter III) indicated
that Black students generally showed the highest levels of student engagement across all ethnic
and racial groups, which is what this study confirmed; while Hispanic students showed the
lowest (Temkin, 2004). In the sample used in this study, both Black and Hispanic students scored
higher across each engagement benchmark than White students.
Enrollment status (part-time or full-time) was found to be a strong factor affecting
student engagement across all benchmarks. Consistently across the benchmarks of student
engagement, full-time students showed significantly higher levels of engagement than part-time
students. Given the time spent on campus and opportunities to engage academically and socially
inside and outside of the classroom, it is not surprising that this finding is consistent with the
previous literature on the topic.
The GPA variable in this study was also found to have results that are consistent with the
literature. Compared to students who self-reported high GPAs (falling between A- and A on
average) the students who reported lower grades showed lower levels of student engagement
across the benchmarks. Perhaps performing well academically allowed for more faculty and peer
interactions, which lead to higher levels of student engagement in general and higher levels of
motivation and satisfaction with the college experience.
The data on the employment characteristics of the students in the sample and the effect
this variable on student engagement is somewhat mixed. While previous research has determined
129
that a negative relationship exists between employment and educational outcomes, this study
found the relationship between employment status and student engagement to be largely positive
across the benchmarks, regardless of hours committed to work and whether work was on or off
campus. The data used for this study was collected in 2009, which is shortly after the financial
crisis that affected the United States. While the residual effects of a recession usually take some
time to affect the population, it is likely that the data for this study came at a time before these
effects affected student choices between employment and education.
When residential status was included in the regression model, the results showed that
students who lived on-campus in residence halls were more engaged than students who lived
elsewhere. The reasons for this finding are likely the opportunities to interact with peers and
faculty and taking advantage of engagement opportunities available to them, among which are
social and academic support available to them. Living on campus has consistently been found to
be a positive factor for student success, and this study confirms this finding.
There are a couple of other factors that the literature has suggested might affect student
engagement, and they were also included in the regression model of this study. One of these
factors is academic major. This study found mixed results regarding student engagement by
academic major. While certain majors, such as business, were found to be overall negative
factors for engagement, it is hard to draw conclusive general results, as the values for each major
varied across each benchmark. Athletic affiliation also varied by benchmark and this finding
contradicted some of the literature on the subject. Where it was found to be a significant was for
students who were athletes, as they showed higher levels of student engagement than non-
athletes, which is consistent with some of the literature reviewed in earlier chapters.
130
In addition to student factors, institutional features were also factored into the regression
model to help to address the research questions. The results were mixed by benchmark, but
overall smaller institutional size and control were found to be consistent with the findings in the
literature. In general, smaller institutions and private colleges and universities seemed to be more
successful in engaging their students than other types of institutions.
A multicollinearity test was performed to the specification of the model for the all
variables used in this study in order to measure the correlation between the predictors in the
model. The Variance Inflation Factors, or VIF values, were less than 3 for all of the independent
variables. Since the VIF values were less than the critical value of 10, no multicollinearity issues
impacted this study.
This statistical analysis indicated that the relationship between transfer status and student
engagement was complex, and that there were multiple other factors that impacted it. In general,
transfer students were found to show significantly lower levels of student engagement than
native students, which indicates that institutions continue to be lacking in their efforts to
integrate and engage transfer students. This study also found that within the transfer student
population, differences in engagement levels existed on a national scale. This is a significant
contribution to the research field. Horizontal transfer students were less engaged than native
students across U.S. campuses. This indicates that community college transfers were more
successful in integrating into the new institution than students who had previous experiences at
4-year institutions. This is consistent with the literature that suggests that community college
students who are successful in transferring to 4-year institutions are likely to persist, engage, and
graduate, while many horizontal transfers continue to struggle.
131
Factors such as a gender, race, enrollment status, and GPA have also been known to be
factors that affect student engagement, and this study confirms these findings. Female students
were found to generally be more engaged in their education and environment than male students,
Black students tended to be more engaged than White students, and students who were enrolled
full-time tended to be more integrated as well. Students who performed well academically also
seemed to have higher rates of student engagement and benefitted more from their educational
experiences than students who did not report top grades. All of these findings support the
existing body of empirical research, and this study affirms the general understanding of the
impact of these factors.
Implication for Policy and Practice
This study provides a comprehensive picture of the student engagement of transfer
students on a national level. The descriptive statistics and regression analysis demonstrated that
transfer students lag farther behind in student engagement than native students. The findings of
this study have important implications for administrators, faculty, and other stakeholders
interested in student engagement and success.
First, from a policy perspective, less engagement will ultimately lead to higher dropout
rates, higher debt among students, and overall dissatisfaction with the educational experience.
While this study did not collect any data on student debt, it collected data on student
engagement, which is linked to the outcome of student success. Engagement is particularly
problematic for transfer students, many of whom likely experience assimilation, integration, and
academic challenges after the transfer. Furthermore, for horizontal transfers, who have already
left another 4-year institution, engaging academically and socially continues to be a problem.
These challenges will ultimately affect graduation rates and are likely to increase debt and cause
132
fewer employment opportunities than those available to students who successfully graduate from
college.
Second, policy makers at the institutional level must create ways to facilitate the transfer
process, and once developed, offer programs and services that specifically target transfer
students and their needs. Issues such as initial academic barriers and dip in GPA after the transfer
should already cause concerns for institutional policymakers, so remedies cannot be further
delayed. Transfer policy already exists for community college transfers at many 4-year state
institutions, but these policies need to be improved in order to integrate horizontal transfers as
well. Programs such as transfer student orientation, advising, peer programs, and other academic
programs must be initiated and be constantly improved in order to help the large number of
transfer students and to lead to more successful engagement of this segment of the population.
Third, public policymakers are in a position to make a difference in higher education.
Due to multiple priorities and limited resources, funding and distribution of resources are
generally major concerns. Intentional and directional spending can have the highest impact on
student engagement. Investing in quality research on student engagement, especially for transfer
students, will be necessary to improve the transfer student experience. With large numbers of
transfers across institutional type, but especially within and to public institutions of higher
education, public policy makers are in a unique position to direct funding and efforts to better
track transfer students and address their unique needs. In addition, assessment and program
evaluation can help to differentiate ineffective and high-impact programs and services and will
make the most difference to student success.
133
Implications for Future Research
This study focused on the relationship between transfer status and student engagement.
This study contributes to the literature on student engagement in that it was conducted using a
large national dataset and differences between the complex makeup of the transfer population
were examined. There are several areas for future research that are worth mentioning.
Hopefully, this study will inspire further research on the topic and initiate further research and
conversations about the transfer student experience.
First, although there are several studies that have explored the transfer student
experience, they are all on a small scale, usually sampling from a single institution. While this
method has certain advantages, particularly for that specific institution and for comparison
purposes, large-scale studies on this topic will provide more generalizable results. Furthermore,
there is a lack of research that has examined student engagement as a dependent variable and that
have used multiple regression. The results of this study found for the academic challenge, in
particular, was that transfer students had higher levels of engagement for this benchmark than
native students, and this finding should be further examined. More studies like this one will
likely confirm or dispute the results of the present study.
Second, other types of studies, such as mixed-methods and qualitative studies can further
contribute to the conversation and provide different perspectives. These types of studies could
reveal a more in-depth research and direct student perspectives that will either validate or dispute
the findings of this study. This type of analysis will allow respondents to elaborate on challenges
to student engagement in an open-ended format, which is something that the NSSE and a
quantitative analysis is not able to do.
134
Third, as mentioned in Chapter III, the data used for this survey is the NSSE 2009. A
replication of the present study using a more recent dataset from the NSSE will further validate
or dispute the findings of this study. Furthermore, even a longitudinal study of the student
engagement of transfer students would likely provide additional information about the
engagement patterns of transfer students over time.
Fourth, this study clearly addresses the engagement patterns of transfer students who
have been successful in the transfer process. Further studies could examine students who were
not successful after transfer, and such a study would likely to reveal meaningful information and
provide important policy and practice implications.
Fifth, designing a study on this topic using hierarchical linear modeling (HLM) would be
another way to build on this research. The use of HLM analysis would allow researchers to
analyze students nested within types of institutions, as this is data available in the NSSE dataset.
Clustered data can be incorporated into the data analysis and this could lead to a deeper
understanding of the transfer student engagement experiences.
Lastly, a more representative sample would lead to more comprehensive results. Data
indicate that 58% of all students ages 18-24 who enrolled in higher education are White, and that
they represent 69% of all bachelor’s degrees awarded (Krogstad & Fry, 2014). In the sample
used in the present study this population was represented at a much higher level. The descriptive
statistics used in the present study revealed that female respondents were disproportionally
higher than male respondents and that White students comprised 75% of the sample. This is
similar to other studies that have used NSSE data. While this disproportion between gender and
race is common among survey respondents, the results of the analysis of such data reveal that
data may be skewed to a particular segment of the population and may not be subject to
135
generalizations. Finding a way to integrate more diverse respondent base or using other datasets
available will be beneficial for researcher studying the topic of student engagement.
Concluding Comments
As institutions continue to focus efforts toward improving student engagement, it is
important that stakeholders do not lose focus of the importance of engagement for all students on
campus. The path to college success is often indirect for a very large number of students. The
transfer function of the U.S. system of higher education has allowed students to opt out to
institutions that better serve and address their needs. But this study has confirmed that not all
college students successfully engage on campus, and student engagement has already been
proven to matter for student success. The more engaged students become with their institutions,
the more likely they are to succeed academically and to graduate. This study affirms that
institutional leaders have failed to create opportunities for engagement and a balanced
environment for transfer students, and hopefully this line of research will inspire more discussion
on the topic and the change needed in order to see all students succeed.
136
REFERENCES
Aaker, D.A., Kumar, V. & Day, G.S. (1998). Marketing research (6th ed). New York: Wiley.
Adelman, C. (2006). The toolbox revisited: Paths to degree completion from high school through
college. Washington, DC: U.S. Department of Education. Retrieved from
https://www2.ed.gov/rschstat/research/pubs/toolboxrevisit/toolbox.pdf
Al-Sunbul, A. (1987). The achievement of two-year transfer students in four-year institutions: A
case study. Community Junior College Research Quarterly of Research and Practice. 11,
1-9.
Allen, K. R. (2007). Horizontal transfer students navigating college transfer and transition: An
untold story of invisible students. (Unpublished doctoral dissertation). University of
Missouri-St. Louis, MO.
American Association of Community Colleges. (2014). 2014 fact sheet. Retrieved from
http://www.aacc.nche.edu/AboutCC/Documents/Facts14_Data_R3.pdf.
American Association of Community Colleges. (2016). Students at community colleges.
Retrieved from
http://www.aacc.nche.edu/AboutCC/Trends/Pages/studentsatcommunitycolleges.aspx
American Council on Education. (2006, September). Addressing the challenges facing American
undergraduate education: A letter to our members. American Council on Education.
137
Astin, A. W. (1975). Preventing students from dropping out. San Francisco, CA: Jossey-Bass.
Astin, A. W. (1977). Four critical years: Effects of college on beliefs, attitudes, and knowledge.
San Francisco, CA: Jossey-Bass.
Astin, A. W. (1984). Student involvement: A developmental theory for higher education. Journal
of College Student Personnel, 25, 297-308.
Astin, A. W. (1993). What matters in college? Four critical years revisited. San Francisco, CA:
Jossey-Bass.
Astin, A. W. (1996). Involvement in learning revisited: Lessons we have learned. Journal of
College Student Development, 37, 123–134.
Astin, A. W., & Sax, L. (1998). How undergraduates are affected by service participation.
Journal of College Student Development, 39, 251-263.
Association of American Colleges and Universities. (2007). College learning for the new global
century: A report from the National Leadership Council for Liberal Education and
America’s Promise (LEAP). Washington, DC: Association of American Colleges and
Universities.
Axelson, R. D., & Flick, A. (2011). Defining student engagement. Change, 43, 38-43.
Bailey, T. R., & Alfonso, M. (2005). Paths to persistence: An analysis of research on program
effectiveness at community colleges. Indianapolis, IN: Lumina Foundation for Education.
138
Baum, S., Ma, J., & Payea, K. (2013). Education pays 2013. The College Board. Retrieved on
from https://trends.collegeboard.org/sites/default/files/education-pays-2013-full-
report.pdf
Bensimon, E. (2007). The underestimated significance of practitioner knowledge in the
scholarship on student success. Review of Higher Education, 30, 441-469.
Berkner, L., He, S. & Cataldi, E. (2002). Descriptive summary of 99501996 Beginning
Postsecondary Students: 6 years later (NCES 2003-151).. Washington, DC: National
Center for Education Statistics.
Bok, D. (2006). Our underachieving colleges: A candid look at how much students learn and
why they should be learning more. Princeton, NJ: Princeton University Press.
Borglum, K., & Kabala, T. (2000). Academic and social integration of community college
students: A case study. Community College Journal of Research and Practice, 24, 567-
576.
Bradburn, N.M. & Sudman, S. (1988). Polls and Surveys: Understanding what they tell us. San
Francisco, CA: Jossey-Bass.
Brownell, J. E., & Swaner, L. E. (2009). High-impact practices: Applying the learning outcomes
literature to the development of successful campus programs. Peer Review, 11(2), 26-30.
Bridgewater State College, Office of Institutional Research. (2009). National survey for student
engagement: Commuter vs. resident student responses. Retrieved from
http://www.learningace.com/doc/2840089/152400c583a536b6b8f957a970676df4/nsse08-
139
analysis-of-resident-vs-commuter-responses
Brint, S., Cantwell, A. M., & Hanneman, R. A. (2007). The two cultures of undergraduate
academic engagement. Research in Higher Education, 49, 383-402.
Cameron, C. (2003). The lived experience of transfer students in a collaborative baccalaureate
nursing program. (Unpublished doctoral dissertation). University of Toronto, Ontario,
Canada.
Carini, R. M., Kuh, G. D. & Klein, S. P. (2006). Student engagement and student learning:
Testing the linkages. Research in Higher Education, 47, 1, 1-32.
Carlan, P. E., & Byxbe, F.R. (2000). Community colleges under the microscope: An analysis of
performance predictors for native and transfer students. Community College Review, 28
(2), 27-42.
Cejda,B. D., Kaylor, A. J., Rewey, K. L. (1998). Relationship between students’ majors and their
academic performance. Community College Review, 26(3), 1-13.
Chen, P.D., Gonyea, R. M., Sarraf, S. A., BrckaLorenz, A., Korkmaz, A., Lambert, A.D., Shoup,
R., & Williams, J. M. (2009). Analyzing and interpreting NSSE data. New Directions for
Institutional Research, 141, 35-54.
Chickering, A., Gamson, Z. (1987). Seven principles for good practice in undergraduate
education. American Association of Higher Education Bulletin, 39(7), 3-7
Cook, B. J. (2012). Incomplete compelters: Analysis of a comprehensive graduation rate,
American Council on Education. Retrieved from https://www.acenet.edu/news-
140
room/Documents/GradRate-110812.pdf
Cortina, J. M. (1993). What is coefficient alpha? An examination of theory and applications.
Journal of Applied Psychology, 78 (1), 98-104.
Crisp, G. & Nunez, A.-M. (Spring, 2014). Minority and Nonminority students’ pathways from
two-to four-year institutions. The Review of Higher Education, 37(3), 291-320
Crosta, P. (2014). Intensity and attachment: How chaotic enrollment patterns of community
college students relate to educational outcomes. Community College Review, 42(2), 118-
142.
Cruce, T., Wolniak, G. C., Seifert, T. A. & Pascarella, E. T. (2006). Impacts of good practices on
cognitive development, learning opportunities, and graduate degree plans during the first
year of college. Journal of College Student Development, 47, 365-383.
Crystal, L. L., Gansemer-Torf, A., & Laanan, F. S. (2013). Assessing students’ transition from
community college to a four-year institution. Journal of Assessment and Institutional
Effectiveness, 3 (1), 1-18.
D’Amico, M. M., Dika, S. L., Elling, T. W., Algozzine, B., & Ginn, D.J. (2014) Early
integration and other outcomes for community college transfer students. Research in
Higher Education, 55(4), 370-399.
Dennis, J.M., Phinney, J.S., & Chuateco, L.I. (2005). The Role of motivation, parental support,
and peer support in the academic success of ethnic minority first-generation college
students. Journal of College Student Development, 46(3), 223-236
141
Dowd, A., & Cheslock, J. (2003) Community college transfer students at selective colleges and
universities in the United States: An estimate of the two-year transfer population at elite
institutions and of the effects of institutional characteristics on transfer access. Jack Kent
Foundation. Retrieved from
http://www.jackkentcookefoundation.org/jkcf_web/Documents/Section% 20II.pdf
Fernander, K. A. (2012). Examining the engagement of transfer students in texas
universities (Order No. 3533579). Retrieved from ProQuest Dissertations & Theses
Global. (1223343642)
http://ezproxy.cul.columbia.edu/login?url=http://search.proquest.com.ezproxy.cul.columb
ia.edu/docview/1223343642?accountid=10226
Flaga, C. T. (2006). The process of transition for community college students. Community
College Journal of Research and Practice, 30, 3-19.
Fugard, A. (2009). Transfer students: Information accessibility, services, and student
engagement. Dissertation Abstract International, 70 (12), 1-172.
Fuller, M., Wilson, M., & Tobin, R. (2011). The national survey of student engagement as a
predictor of undergraduate GPA: A cross-sectional and longitudinal examination.
Assessment & Evaluation in Higher Education, 36, 735-748.
Elling, S. R., & Elling, T. W. (2000). The influence of work on college student
development. NASPA Journal, 37(2), 454-470.
142
Galladian, C. (2013). An examination of five benchmarks of student engagement for commuter
students enrolled at an urban public university (Order No. 3587773). Available from
ProQuest Dissertations & Theses Global. (1428167227). Retrieved from
http://ezproxy.cul.columbia.edu/login?url=http://search.proquest.com.ezproxy.cul.columb
ia.edu/docview/1428167227?accountid=10226
Glass, J., & Harrington, A. (2002) Academic performance of community college transfer
students and “native” students at a large state university. Community College Journal of
Research and Practice, 26(5), p. 415-430.
Goldrick-Rab, S., & Pfeifer, F. (2009). Beyond access: Explaining socioeconomic differences in
college transfer. Sociology and Education, 82, 101-125.
Gonyea, R. M. & Kuh, G. D. (2009). Using NSSE in institutional research, New Directions for
Institutional Research, 141, San Francisco: Jossey-Bass.
Hagedorn, L. S.,& Castro, C. R. (1999). Paradoxes: California’s experience with reverse transfer
students. In B. K. Townsend (Ed.), Leadership in an era of change, New Directions for
Community Colleges, 106, 15-26.
Hagedorn, L. S., Moon, H. S., Cypers, S., Maxwell, W. E., & Lester, J. (2006). Transfer between
community colleges and 4-year colleges: The all-American game. Community College
Journal of Research and Practice, 30(3), 223-242.
Harper, S. R., & Quaye, S. J. (2008). Student engagement in higher education: Theoretical
perspectives and practical approaches for diverse populations. London: Routledge.
143
Hills, J. R. (1965). Transfer shock: The academic performance of the junior college transfer.
Journal of Experimental Education, 33, 201–216.
Hinkle, D. E., Wiersma, W., & Jurs, S.G. (2003). Applied statistics for the behavior sciences (5th
ed.). Boston, MA: Houghton Mifflin Company.
Holland, B. (2015). Envisioning workforce training differently: The Obama "free" community
college initiative. Industry And Higher Education, 29(4), 249-252.
Hosler, D., Shapiro, D., & Dundar, A. (2012). Transfer and mobility: A national view of pre-
degree student movement in postsecondary institutions. National Student Clearinghouse
Research Center, Signature Report 2.
Hu, S. and Kuh, G.D. (2001). Being (dis)engaged in educationally purposeful activities: The
influences of student and institutional characteristics. Paper presented at the American
Educational Research Association Annual Conference. Seattle, WA.
Hu, S., & Kuh, G. D. (2003). Maximizing what students get out of college: Testing a learning
productivity model. Journal of College Student Development, 44(2), 185-203.
Hurtado, S., & Carter, D. F. (1997). Effects of college transition and perceptions of the campus
climate on Latino students’ sense of belonging. Sociology of Education, 40(1), 17-41.
Ishitani, T (2008). How do transfers survive after “transfer shock”? A longitudinal study of
transfer student departure at a four-year institution. Research in Higher Education, 49,
403-419.
144
Ishitani, T. & McKitrick, S. (2010). After transfer: The engagement of community college
students at a four-year collegiate institution. Community College Journal of Research and
Practice, 34, p. 576-594.
Jacobs, B. (2004). Today’s transfer students: Trends and challenges. In B. C. Jacobs, B. Lauren,
M. T. Miller, & D. P. Nadler (Eds.), The college transfer student in America: The
forgotten student (pp. 87-108). Washington, DC: American Association of Collegiate
Registrars and Admissions Officers.
Johnson, J. (2008). Identification of National Survey of Student Engagement (NSSE)
socialization variable clusters that predict private midwestern college persistence.
(Unpublished Dissertation). University of Missouri, Columbia, MO.
Keeley, E. I., & House, J. D. (1993). Transfer shock revisited: A longitudinal study of transfer
academic performance. Retrieved from http://files.eric.ed.gov/fulltext/ED357774.pdf
Kinzie, J., Gonyea, R., Kuh, G. D., Umbach, P., Blaich, C., & Korkmaz, A. (2007). The
relationship between gender and student engagement in college. In 32nd annual
conference of the Association for the Study of Higher Education, Louisville, KY.
Kinzie, J. L., Thomas, A. D., Palmer, M. M., Umbach, P. D. & Kuh, G.D. (2007). Women
students at coeducational and women’s colleges: How do their experiences compare?
Journal of College Student Development, 48, 145-165.
Kirk-Kuwaye, C. & Kirk-Kuwaye, M. (2007). A student engagement patterns of lateral and
145
vertical students during their first semester at a public research university. Journal of the
First Year Experience and Students in Transition, 19(2), 9-27.
Krogstad, J. M., & Fry, R. (2014). More Hispanics, blacks enrolling in college, but lag in
bachelor’s degrees. Retrieved from http://www.pewresearch.org/fact-
tank/2014/04/24/more-hispanics-blacks-enrolling-in-college-but-lag-in-bachelors-
degrees/.
Kuh, G. D. (2001a). Assessing what really matters to student learning: Inside the National
Survey of Student Engagement. Change 33(3), p. 10-17, 66.
Kuh, G. D. (2001b). The National Survey of Student Engagement: Conceptual framework and
overview of psychometric properties. Bloomington, IN: Indiana University, Center for
Postsecondary Research.
Kuh, G. D. (2003). What we're learning about student engagement from NSSE: Benchmarks for
effective educational practices. Change, 35(2), 24–32.
Kuh, G. D. (2008). High-impact educational practices: What they are, who has access to them,
and why they matter. Washington, DC: Association of American Colleges and
Universities.
Kuh, G. D. (2009a) What student affairs professionals need to know about student engagement.
Journal of College Student Development, 50 (6), 683–706.
Kuh, G. D. (2009b). The National Survey of Student Engagement: Conception and empirical
146
foundations. New Directions for Institutional Research, 141, 5-20.
Kuh, G. D., Cruce, T., Shoup, R., Kinzie, J, & Gonyea R. M. (2008). Unmasking the effects of
student engagement on first-year college grades and persistence. Journal of Higher
Education 79(5), 540-563.
Kuh, G.D., Gonyea, R. M. & Palmer, M. (2001). The disengaged commuter student: Fact or
fiction? Commuter Perspectives, 27(1), 2-5.
Kuh, G. D., Kinzie, J., Buckley, J., Bridges, B., & Hayek, J. (2006). What matters to student
success: A review of the literature. Commissioned report for the National Symposium on
Postsecondary Student Success: Spearheading a dialog on student success. Final report
for the National Postsecondary Education Cooperative and National Center for Education
Statistics. Bloomington, IN: Indiana University Center for Postsecondary Research.
Kuh, G. D., Kinzie, J., Cruce, T., Shoup, R. & Gonyea, R. (2007). Connecting the dots: Multi-
faceted analyses of the relationships between student engagement results from the NSSE,
and the institutional practices and conditions that foster student success. Final report to
Lumina Foundation for Education. Bloomington: Indiana University Center for
Postsecondary Research.
Kuh, G. D., Kinzie, J., Schuh, J. H., & Whitt, E. J. (2005). Student success in college: Creating
conditions that matter. San Francisco, CA: Jossey-Bass.
Laanan, F. S. (1999). Any differences? Comparative analysis of White and non-White transfer
students at a university. Retrieved from ERIC database. (ED429654)
147
Laanan, F. S. (2001). Transfer student adjustment. New Directions for Community Colleges, 114,
5-13.
Laanan, F. S. (2004). Studying transfer students: Part I: Instrument design and implications,
Community College Journal of Research and Practice, 28(4), 331-351.
Laanan, F. S. (Ed.). (2006). Understanding students in transition: Trends and Issues. New
Directions for student Services, No. 114. San Francisco, CA: Jossey-Bass.
Laanan, F. S. (2007). Studying transfer students: Part II: Dimensions of transfer students’
adjustment. Community College Journal of Research and Practice, 31, 37-59.
Laird, T. N., & Cruce, T. (2009). Individual and environmental effects of part-time enrollment
status on student-faculty interaction and self-reported gains. The Journal of Higher
Education 80(3), 290-314.
Lester J. (2006). Who will we serve in the future? The new student in transition. In F. S. Laanan,
(Ed.), Understanding students in transition: Trends and issues (New Directions for
Student Services, No. 114, pp. 7-16). San Francisco: Jossey-Bass.
Lester, J., Leonard, J. B.& Mathias, D (2013). Transfer student engagement: Blurring of social
and academic engagement. Community College Review, 41(3), 202-222.
Long, B. T., & Kurleander, M. (2009). Do community colleges provide viable pathway to a
baccalaureate degree? Educational Evaluation and Policy Analysis, 31(1), 30-51.
148
Long, D. (2012). Theories and models of student development. In L. J. Hinchliffe & M. A. Wong
(Eds.), Environments for student growth and development: Librarians and student affairs
in collaboration (pp. 41-55). Chicago: Association of College & Research Libraries.
McArthur, R. C. (2005). Faculty-based advising: An important factor in community college
retention. Community College Review, 32 (4), 1-19.
McClenney, K., Marti, C.N. & Adkins, C. (2007). Student engagement and student outcomes:
Key findings from CCSSE validation research. Retrieved from
http://www.ccsse.org/center/resources/docs/publications/CCSSE_Validation_Summary.p
df
McCormick, A. C. (2003). Swirling and double-dipping: New patterns of student attendance and
their implications for higher education. In J. E. King, E.L. Anderson, & M.E. Corrigan
(Eds.), Changing student attendance patterns: Challenges for policy and practice, New
Directions for higher Education (pp. 13-24). San Francisco, CA: Jossey-Bass.
McCormick, A., Pike, G., Kuh, G. & Chen, P. (2009). Comparing the utility of the 2000 and
2005 Carnegie classification in research on students’ college experiences and outcomes.
Research in Higher Education, 50(2), 144-167.
McCormick, A., Sarraf, S., BrckaLorenx, A., & Haywood, A. (2009a). Examining the transfer
student experience: Interactions with faculty, campus relationships, & overall
satisfaction. Paper presented at the national meeting of the Association for the study of
Higher Education in Vancouver, Canada, November 2009.
149
Merwin, J. C. (1969). Historical review of changing concepts of evaluation. In R. L. Tyler (Ed.),
Educational evaluation: New roles, new methods: The sixty-eighth yearbook of the
nations. Chicago, IL.: University of Chicago Press.
National Center for Public Policy and Higher Education. (2011). Affordability and transfer:
Critical to increasing baccalaureate degree completion. Policy Alert. National Center for
Public Policy and Higher Education. San Jose, CA.
National Student Clearinghouse. (2015). Snapshot report: Contribution of two-year institutions
to four-Year completions. Retrieved from http://nscresearchcenter.org/wp-
content/uploads/SnapshotReport17-2YearContributions.pdf
National Survey of Student Engagement. (2007). Experiences that matter: Enhancing student
learning and success. Bloomington, IN: Indiana University for Postsecondary Research.
National Survey of Student Engagement. (2008). Promoting engagement for all students: The
imperative to look within. Bloomington, IN: Indiana University Center for Postsecondary
Research.
National Survey of Student Engagement. (2009). NSSE 2009 overview. Retrieved from
http://nsse.indiana.edu/2009_Institutional_Report/pdf/NSSE_2009_Overview.pdf
National Survey of Student Engagement Codebook. (2009). NSSE 2009: Codebook. Retrieved
from
http://nsse.indiana.edu/2009_Institutional_Report/pdf/NSSE%202009%20Codebook.pdf
150
National Survey of Student Engagement. (2013a). Fresh look at student engagement: Annual
results 2013. Bloomington, IN: Indiana University Center for Postsecondary Research.
National Survey of Student Engagement. (2013b). Constructing benchmarks. Retrieved from
http://nsse.iub.edu/_/?cid=403
National Survey of Student Engagement. (2014). Bringing the institution into focus. Annual
results 2014. Bloomington, IN: Indiana University Center for Postsecondary Research.
National Survey of Student Engagement. (2015). About. Retrieved from
http://nsse.indiana.edu/html/about.cfm
National Survey of Student Engagement. (2016). An Explanation of Weighting in the
NSSE Institutional Report. Retrieved from http://nsse.indiana.edu/html/weighting.cfm.
NSSE Psychometric Portfolio. (2009). Bloomington, IN: Center for Postsecondary research,
Indiana University, School of Education. Retrieved from http://www.nsse.iub.edu
O'Dair, K. G. (2012). Measuring master's student engagement (Order No. 3549064). ProQuest
Dissertations & Theses Global. (1283073473). Retrieved from
http://ezproxy.cul.columbia.edu/login?url=http://search.proquest.com.ezproxy.cul.columb
ia.edu/docview/1283073473?accountid=10226
Pace, C.R. (1979). Measuring Outcomes of College: Fifty Years of Findings and
Recommendations for the Future. San Francisco: Jossey-Bass.
Pace, C. R. (1980). Measuring the quality of student effort. Current Issues in Higher Education,
151
2, 10-16.
Pace, C. R. (1984). Measuring the quality of student effort. Los Angeles: UCLA, Center for the
Study of Evaluation.
Pace, C. R. (1990). The undergraduates: A report of their activities and college experiences in
the 1980s. Los Angeles: Center for the Study of Evaluation, UCLA Graduate School of
Education.
Pascarella, E.T. (1985a). The influence of on campus living versus commuting to college on
intellectual and interpersonal self-concept. Journal of College Student Personnel, 26(4),
292-299.
Pascarella, E. T. (1985b). College environmental influences on learning and cognitive
development. A critical review and synthesis. In J. Smart, (Ed.), Higher education
handbook of theory and research (Vol. 1). Agathon, Edison, NJ.
Pascarella, E. T., Crice, T., Umback, P. D., Wolniack, G. C., Kuh, G.D., Carini, R. M., Hayek,
J.C., Gonyea, R. M., & Zhao, C. (2006). Institutional selectivity and good practices in
undergraduate education: How strong is the link? The Journal of Higher Education,
77(2), 251-285.
Pascarella, E. T, Seifert, T. & Blaich, C. (2008). Validation of the NSSE benchmarks against
liberal arts outcomes and deep approaches to learning. Paper presented and the annual
meeting of the Association for the Study of Higher Education in Jacksonville, Fl.
152
Pascarella, E. T. & Smart, J. C. (1991). Impact of intercollegiate athletic participation for African
American and Caucasian men: Some further evidence. Journal of College Student
Development 32(2), 123-130.
Pascarella, E. T., Smart, J., Ethington, C. (1986). Long-term persistence of two-year college
students. Research in Higher Education, 24(1), p. 47-71.
Pascarella, E. T. & Terenzini, P. (1991). How college affects students: Findings and insights
from twenty years of research. San Francisco, CA: Jossey-Bass.
Pascarella, E. T. & Terenzini, P. (2005). How college affects students, volume 2: A third decade
of research. San Francisco, CA: Jossey-Bass.
Pascarella, E.T., Terenzini, P. T. & Blimling, G.S. (1994). The impact of residential life on
students. In C.C. Schroeder., P. Mable, & Associates (Eds.), The educational potential of
residence halls (pp. 22-52) San Francisco, CA: Jossey-Bass.
Perna, L.W. (2004). Understanding the decision to enroll in graduate school: Sex and
racial/ethnic group differences. Journal of Higher Education, 75(5), 487-527.
Phillippe, K. & Patton, M. (2000). National profile of community colleges: Trends and statistics
(3rd ed.) Washington, DC: American Association of Community Colleges.
Pike, G. R. (1999). The constant error of the halo in education outcomes research. Research in
Higher Education, 40, 61-86.
Pike, G. R. (2006). The convergent and discriminant validity of NSSE scalelet scores. Journal of
College Student Development 47(5), 550-563.
153
Pike, G. R., Kuh, G. D., & Massa-McKinley, R. C. (2008). First-year students' employment,
engagement, and academic achievement: Untangling the relationship between work and
grades. Naspa Journal, 45(4), 560-582.
Porter, S. (1999). Assessing transfer and native student performance at four-year institutions.
AIR 1999 Forum paper. Retrieved from http://files.eric.ed.gov/fulltext/ED433790.pdf
Porter, S. (2006). Institutional structures and student engagement. Research in Higher Education,
47(5); 521-558.
Price, D. V. & Tovar, E., (2014). Student engagement and institutional graduation rates:
Identifying high-impact education practices for community colleges. Community College
Journal of Research and Practice, 38(9), 766-782.
Rich, I. (1979). Counseling and the transfer student: Myths and realities. Journal of College
Student Personnel, 20, 170-176.
Remarks by the President in State of the Union Address. (2015). Retrieved from
https://www.whitehouse.gov/the-press-office/2015/01/20/remarks-president-state-union-
address-january-20-2015
Roberts, J., & McNeese, M. (2010). Student involvement/engagement in higher education based
on student origin. Research in Higher Education Journal, 7, 1-11.
Schudde, L. T. (2011). The causal effect of campus residency on college student retention. The
Review of Higher Education, 34(4), 581-610.
154
Schuetz, P. (2008). Developing a theory-driven model for community college engagement. New
Directions for Community Colleges, 144, 17-28.
Shapiro, D., Dunbar, A., Chen, J., Ziskin, M., Park, E., Torres, V., Chiang, Y.C., (2015,
February). Completing college: A national view of student attainment rates. (Signature
Report No. 5)., Herndon, VA: National Student Clearinghouse Research Center.
Shapiro, D., Dunbar, A., Ziskin, M., Yuan, X., & Harrell, A. (2013, July). Baccalaureate
Attainment: A national view of the post-secondary outcomes of students who transfer
from two to four-year institutions. (Signature Report No. 5.) Herndon, VA: National
Student Clearinghouse Research Center.
Simone, S. A. 2014. Transferability of postsecondary credit following student transfer or
coenrollment (NCES 2014-163). National Center for Educational Statistics. Retrieved
from http://nces.ed.gov/pubsearch
Sontam, V., & Gabriel, G. (2012). Student engagement at a large suburban community college:
gender and race differences. Community College Journal of Research & Practice, 36
(10), 808-820.
Surrette, B. J. (2001). Transfer from two-year to four-year college: An analysis of gender
differences. Economics of Education Review, 20, 151-163.
Temkin, J. (2004). Student engagement varies by race and type of instruction. Catalyst-Chicago
Finance Reform, April 2004. Retrieved from http://www.catalyst-
chicago.org/news/2005/12/30/student-engagement-varies-race-and-type-instruction
Teremzini, P. T., & Upcraft, K. L. (1996). Assessing program and service outcomes. In M. L.
155
Upcraft and J. H. Schuh (Eds.). Assessment in student affairs (pp. 217-221). San
Francisco, CA: Jossey-Bass.
Tinto, V. (1975). Dropout from higher education: A theoretical synthesis of recent research.
Review of Educational Research, 45(1), 89-125.
Tinto, V. (1987). Leaving college: Rethinking the causes and cure of student attrition research.
Chicago: University of Chicago.
Titno, V. (1988). Stages of student departure: Reflections on the longitudinal character of student
leaving. The Journal of Higher Education, 59(4), p. 438-455.
Tinto, V. (1993). Leaving college: Rethinking the causes and cures of student attrition (2nd ed.).
Chicago, IL: The University of Chicago Press.
Tobolowsky, B., & Cox, B. (2012). Rationalizing neglect: An institutional response to transfer
students. The Journal of Higher Education, 83(3), 289-410.
Townsend, B. K. (1993). University practices that hinder the academic success of community
college transfer students. Paper presented at the 18th annual meeting of the Association
for the Study of Higher Education, Pittsburgh, PA.
Townsend, B. K. (1995). Community college transfer students: A case study of survival. Review
of Higher Education, 18, 175-193.
156
Townsend, B. K., & Wilson, K. (2006). ‘”A hand hold for a little bit’’: Factors facilitating the
success of community college transfer students to a large research university. Journal of
College Student Development, 47(4), 439-456.
Townsend, B. & Wilson, K. (2009). The academic and social integration of persisting
community college transfer students. Journal of College Students Retention: Research,
Theory, and Practice, 10(4), 405-423.
U.S. Department of Commerce, Census Bureau. (2013). Current population survey (CPS),
October, 1967 through 2012. Retrieved from
http://nces.ed.gov/programs/digest/d13/tables/dt13_302.60.asp
U.S. Department of Education, National Center for Education Statistics. (2014). Integrated
Postsecondary Education Data System (IPEDS), Fall 2001 and Spring 2007 through
Spring 2014, Graduation Rates component.
Snyder, T.D., and Dillow, S.A. (2015). Digest of Education Statistics 2013 (NCES 2015-011).
National Center for Education Statistics, Institute of Education Sciences, U.S.
Department of Education. Washington, DC.
Kena, G., Musu-Gillette, L., Robinson, J., Wang, X., Rathbun, A., Zhang, J., Wilkinson-Flicker,
S., Barmer, A., and Dunlop Velez, E. (2015). The Condition of Education 2015 (NCES
157
2015-144). U.S. Department of Education, National Center for Education Statistics.
Washington, DC. Retrieved [date] from http://nces.ed.gov/pubsearch.
Umback, P. D., Palmer, M. M., Kuh, G. D., & Hannah, S. J. (2006). Intercollegiate athletes and
effective educational practices: winning combination or losing effort? Research in
Higher Education, 47(6), 709-733.
Upcraft, M. L., & Moore, L.V. (1990). Evolving theoretical perspectives of student development.
In M.J. Barr & M. L. Upcraft and Associates, New futures of student affairs: Building a
vision for professional leadership and practice (pp.41-68). San Francisco, CA: Jossey-
Bass.
Wentland, E.J. & Smith, K.W. (1993). Survey responses: An evaluation of their validity. New
York: Academic Press.
Wolf-Wondel, L. E., Toma, J. D. & Morphew, C.C. (2001). There is no “I” in “team”: Lessons
from athletes on community building. The Review of Higher Education, 24(4), 369-396.
Wolf-Wendel, L., Ward, K., & Kinzie, J. (2009). A tangled web of terms: The overlap and
unique contribution of involvement, engagement and integration to understanding college
student success. Journal of College Student Development, 50(4), 407-428.
Zhao, C-M., Carini, R. M., & Kuh, G. D. (2005). Searching for the peach blossom: Shangri-la:
Student engagement of men and women STEM majors. Review of Higher Education, 28,
503-525.
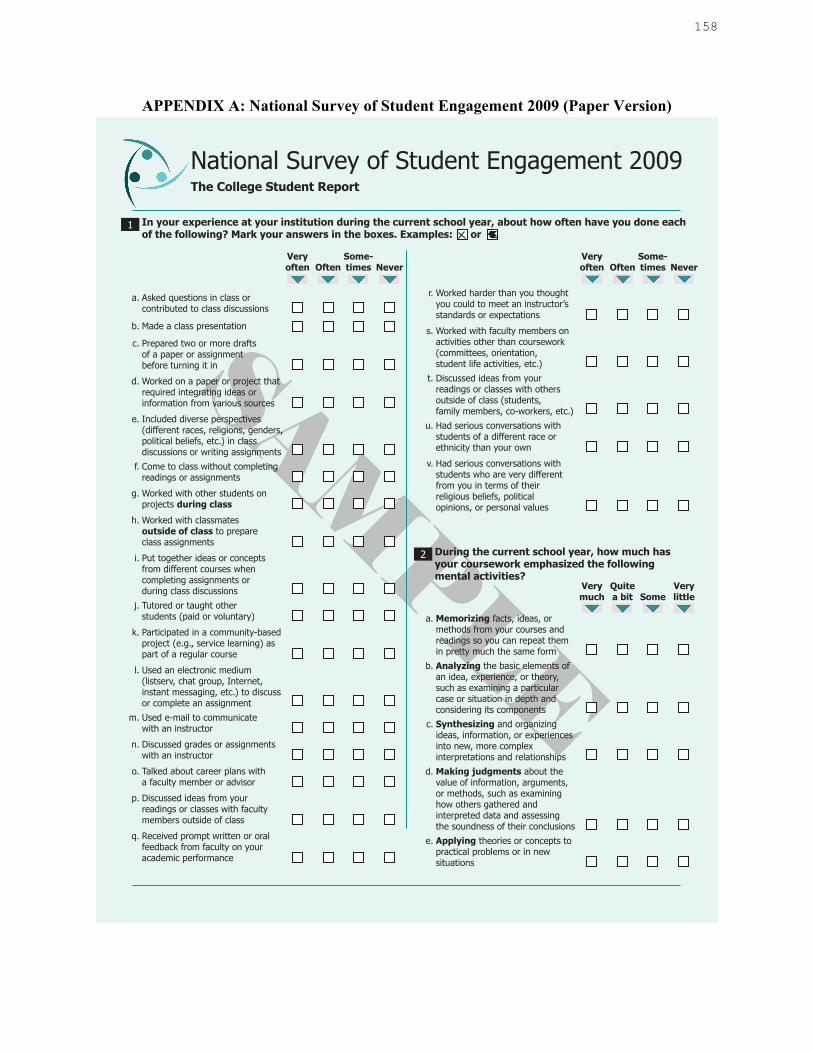
158
APPENDIX A: National Survey of Student Engagement 2009 (Paper Version)
SAMPLE
National Survey of Student Engagement 2009The College Student Report
1
Very often Often
Some-times Never
a. Asked questions in class or contributed to class discussions
b. Made a class presentation
c. Prepared two or more draftsof a paper or assignmentbefore turning it in
d. Worked on a paper or project that required integrating ideas orinformation from various sources
e. Included diverse perspectives(different races, religions, genders, political beliefs, etc.) in classdiscussions or writing assignments
f. Come to class without completing readings or assignments
g. Worked with other students on projects during class
h. Worked with classmatesoutside of class to prepareclass assignments
i. Put together ideas or conceptsfrom different courses whencompleting assignments orduring class discussions
j. Tutored or taught otherstudents (paid or voluntary)
k. Participated in a community-based project (e.g., service learning) as part of a regular course
l. Used an electronic medium(listserv, chat group, Internet,instant messaging, etc.) to discuss or complete an assignment
m. Used e-mail to communicatewith an instructor
n. Discussed grades or assignments with an instructor
o. Talked about career plans witha faculty member or advisor
p. Discussed ideas from yourreadings or classes with faculty members outside of class
q. Received prompt written or oral feedback from faculty on your academic performance
Very often Often
Some-times Never
r. Worked harder than you thought you could to meet an instructor’s standards or expectations
s. Worked with faculty members on activities other than coursework (committees, orientation,student life activities, etc.)
t. Discussed ideas from yourreadings or classes with others outside of class (students,family members, co-workers, etc.)
u. Had serious conversations with students of a different race or ethnicity than your own
v. Had serious conversations withstudents who are very different from you in terms of theirreligious beliefs, politicalopinions, or personal values
2 During the current school year, how much has your coursework emphasized the followingmental activities?
Very much
Quitea bit Some
Very little
a. Memorizing facts, ideas, ormethods from your courses and readings so you can repeat themin pretty much the same form
b. Analyzing the basic elements of an idea, experience, or theory,such as examining a particularcase or situation in depth andconsidering its components
c. Synthesizing and organizing ideas, information, or experiences into new, more complexinterpretations and relationships
d. Making judgments about the value of information, arguments,or methods, such as examininghow others gathered andinterpreted data and assessingthe soundness of their conclusions
e. Applying theories or concepts to practical problems or in newsituations
In your experience at your institution during the current school year, about how often have you done each of the following? Mark your answers in the boxes. Examples: or
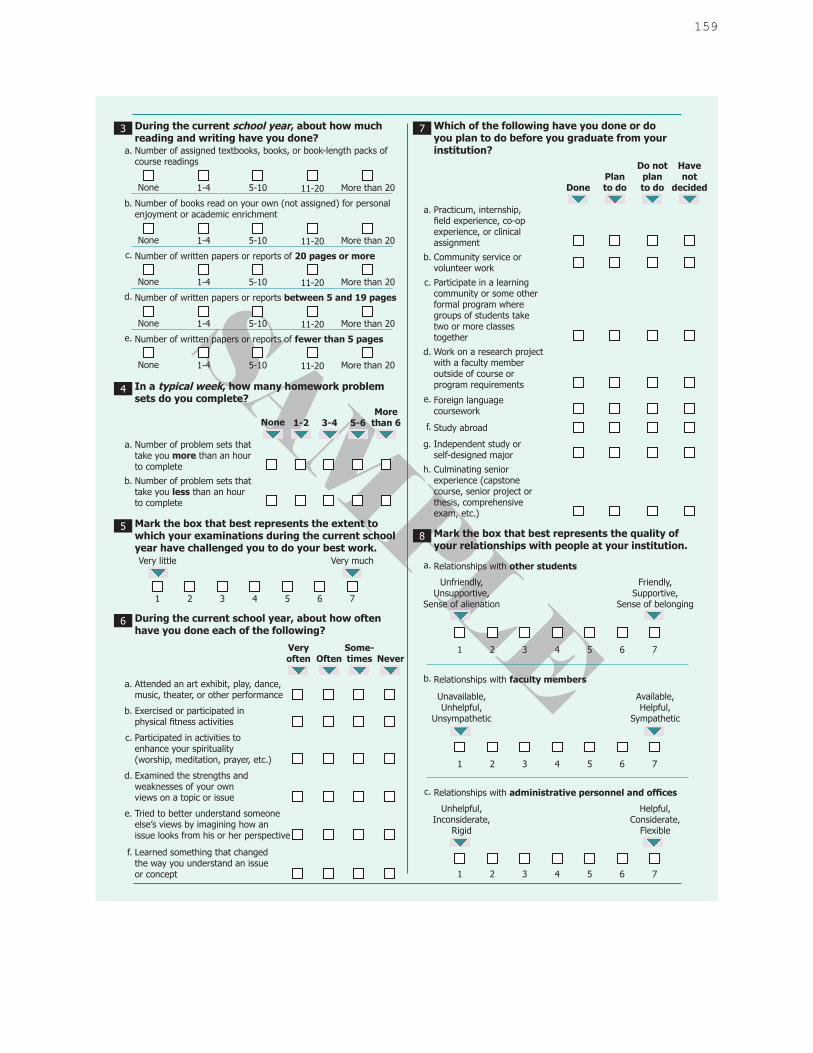
159
SAMPLE
3 During the current school year, about how much reading and writing have you done?
a. Number of assigned textbooks, books, or book-length packs of course readings
None 1-4 5-10 11-20 More than 20
b. Number of books read on your own (not assigned) for personal enjoyment or academic enrichment
None 1-4 5-10 11-20 More than 20
c. Number of written papers or reports of 20 pages or more
None 1-4 5-10 11-20 More than 20
d. Number of written papers or reports between 5 and 19 pages
None 1-4 5-10 11-20 More than 20
e. Number of written papers or reports of fewer than 5 pages
None 1-4 5-10 11-20 More than 20
4 In a typical week, how many homework problem sets do you complete?
1-2 3-4 5-6More
than 6None
a. Number of problem sets that take you more than an hour to complete
b. Number of problem sets that take you less than an hourto complete
5 Mark the box that best represents the extent to which your examinations during the current school year have challenged you to do your best work.Very little Very much
1 2 3 4 5 6 7
Very often Often
Some-times Never
a. Attended an art exhibit, play, dance, music, theater, or other performance
6 During the current school year, about how often have you done each of the following?
b. Exercised or participated inphysical fitness activities
c. Participated in activities toenhance your spirituality(worship, meditation, prayer, etc.)
d. Examined the strengths andweaknesses of your ownviews on a topic or issue
e. Tried to better understand someone else’s views by imagining how an issue looks from his or her perspective
f. Learned something that changedthe way you understand an issueor concept
DonePlan to do
Do not planto do
Havenot
decided
a. Practicum, internship,field experience, co-opexperience, or clinicalassignment
7 Which of the following have you done or doyou plan to do before you graduate from yourinstitution?
b. Community service orvolunteer work
c. Participate in a learningcommunity or some otherformal program wheregroups of students taketwo or more classestogether
d. Work on a research projectwith a faculty member outside of course orprogram requirements
e. Foreign languagecoursework
f. Study abroad
g. Independent study orself-designed major
h. Culminating seniorexperience (capstonecourse, senior project orthesis, comprehensiveexam, etc.)
8 Mark the box that best represents the quality of your relationships with people at your institution.
a. Relationships with other students
Unfriendly,Unsupportive,
Sense of alienation
Friendly,Supportive,
Sense of belonging
1 2 3 4 5 6 7
b. Relationships with faculty members
Unavailable,Unhelpful,
Unsympathetic
Available,Helpful,
Sympathetic
1 2 3 4 5 6 7
c. Relationships with administrative personnel and offices
Unhelpful,Inconsiderate,
Rigid
Helpful,Considerate,
Flexible
1 2 3 4 5 6 7
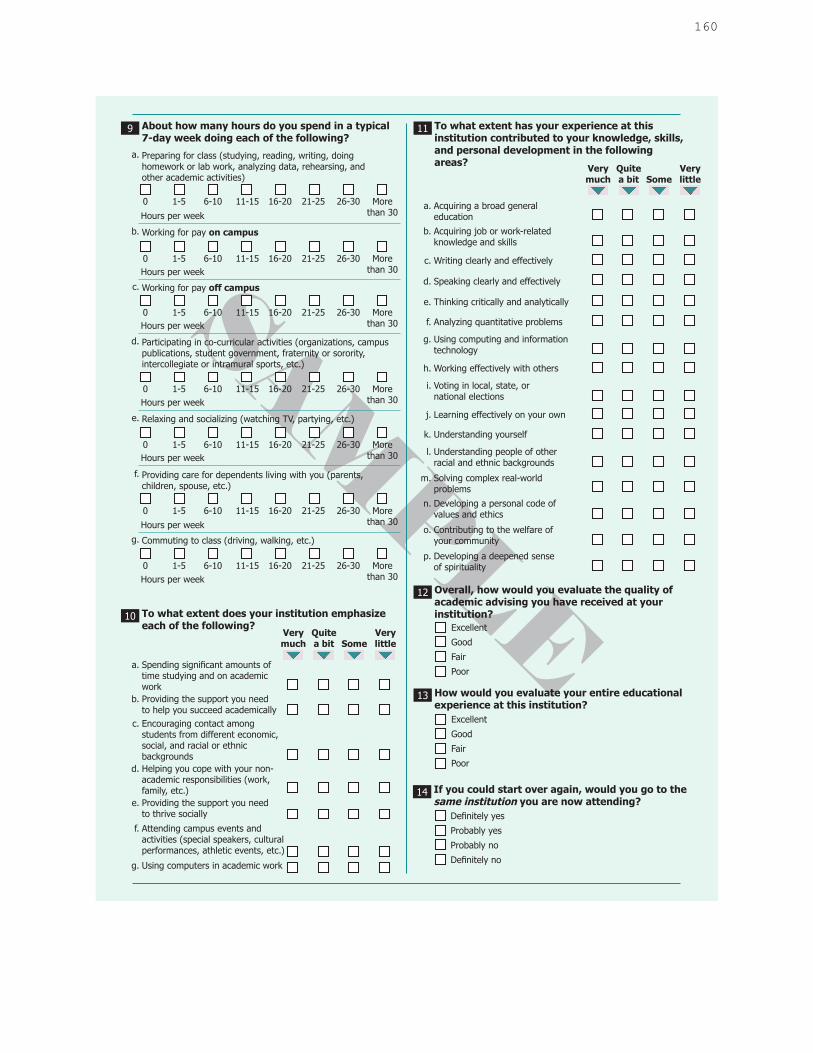
160
SAMPLE
9 About how many hours do you spend in a typical 7-day week doing each of the following?
a. Preparing for class (studying, reading, writing, doing homework or lab work, analyzing data, rehearsing, and other academic activities)
0 1-5 6-10 11-15 16-20 21-25 26-30 More than 30Hours per week
b. Working for pay on campus
c. Working for pay off campus
Hours per week
d. Participating in co-curricular activities (organizations, campus publications, student government, fraternity or sorority, intercollegiate or intramural sports, etc.)
Hours per week
e. Relaxing and socializing (watching TV, partying, etc.)
Hours per week
f. Providing care for dependents living with you (parents, children, spouse, etc.)
Hours per week
g. Commuting to class (driving, walking, etc.)
Hours per week
Very much
Quite a bit Some
Very little
10 To what extent does your institution emphasize each of the following?
a. Spending significant amounts of time studying and on academicwork
b. Providing the support you needto help you succeed academically
c. Encouraging contact amongstudents from different economic, social, and racial or ethnicbackgrounds
d. Helping you cope with your non-academic responsibilities (work, family, etc.)
e. Providing the support you needto thrive socially
f. Attending campus events and activities (special speakers, cultural performances, athletic events, etc.)
g. Using computers in academic work
Very much
Quite a bit Some
Very little
11 To what extent has your experience at this institution contributed to your knowledge, skills, and personal development in the followingareas?
a. Acquiring a broad generaleducation
b. Acquiring job or work-related knowledge and skills
c. Writing clearly and effectively
d. Speaking clearly and effectively
e. Thinking critically and analytically
f. Analyzing quantitative problems
g. Using computing and information technology
h. Working effectively with others
i. Voting in local, state, ornational elections
j. Learning effectively on your own
k. Understanding yourself
l. Understanding people of otherracial and ethnic backgrounds
m. Solving complex real-worldproblems
p. Developing a deepened senseof spirituality
o. Contributing to the welfare ofyour community
n. Developing a personal code ofvalues and ethics
12 Overall, how would you evaluate the quality of academic advising you have received at yourinstitution?
Excellent
Good
Fair
Poor
13 How would you evaluate your entire educational experience at this institution?
Excellent
Good
Fair
Poor
14 If you could start over again, would you go to the same institution you are now attending?
Definitely yes
Probably yes
Probably no
Definitely no
0 1-5 6-10 11-15 16-20 21-25 26-30 More than 30
0 1-5 6-10 11-15 16-20 21-25 26-30 More than 30
0 1-5 6-10 11-15 16-20 21-25 26-30 More than 30
0 1-5 6-10 11-15 16-20 21-25 26-30 More than 30
0 1-5 6-10 11-15 16-20 21-25 26-30 More than 30
0 1-5 6-10 11-15 16-20 21-25 26-30 More than 30
Hours per week
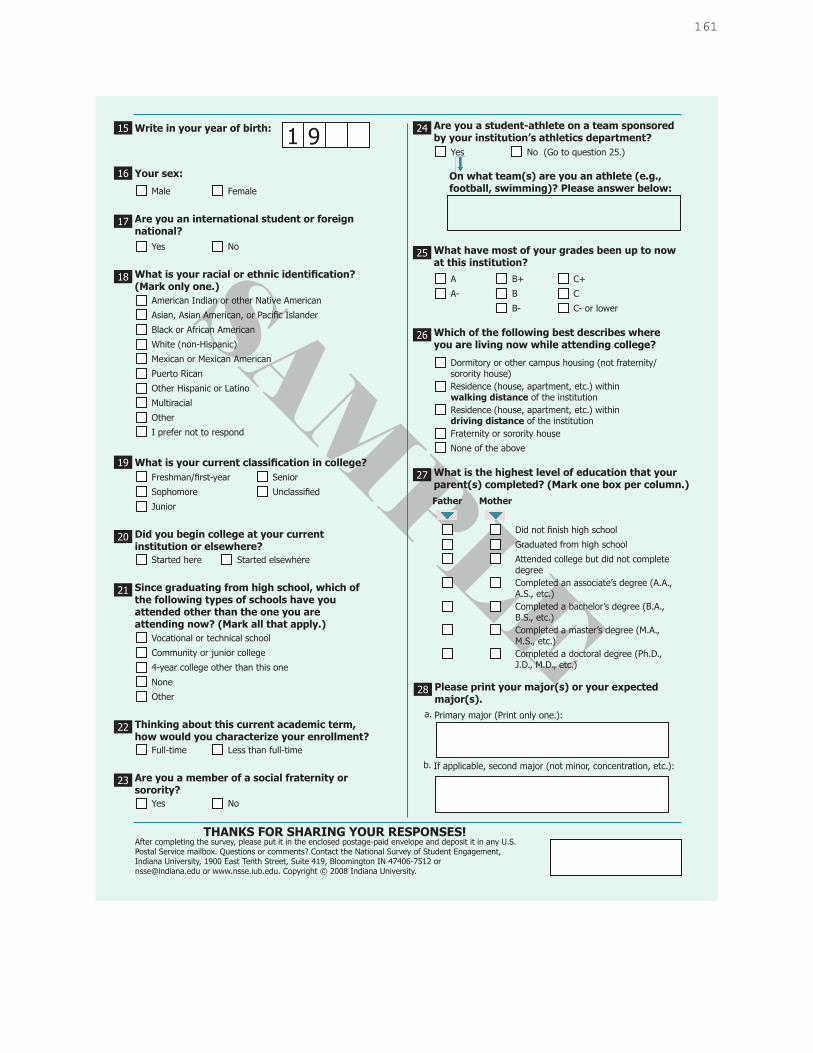
161
SAMPLE
Male
16 Your sex:
Female
17 Are you an international student or foreignnational?
Yes No
American Indian or other Native American
18 What is your racial or ethnic identification?(Mark only one.)
Asian, Asian American, or Pacific Islander
Black or African American
White (non-Hispanic)
Mexican or Mexican American
Puerto Rican
Other Hispanic or Latino
Multiracial
Other
I prefer not to respond
19 What is your current classification in college?Freshman/first-year
Sophomore
Junior
Senior
Unclassified
20 Did you begin college at your currentinstitution or elsewhere?
Started here Started elsewhere
Vocational or technical school
21 Since graduating from high school, which ofthe following types of schools have youattended other than the one you areattending now? (Mark all that apply.)
Community or junior college
4-year college other than this one
None
Other
22 Thinking about this current academic term, how would you characterize your enrollment?
Full-time Less than full-time
23 Are you a member of a social fraternity orsorority?
Yes No
24 Are you a student-athlete on a team sponsoredby your institution’s athletics department?
Yes No (Go to question 25.)
25 What have most of your grades been up to nowat this institution?
A
A-
B+
B
B-
C+
C
C- or lower
Dormitory or other campus housing (not fraternity/sorority house)
26 Which of the following best describes whereyou are living now while attending college?
Residence (house, apartment, etc.) withinwalking distance of the institutionResidence (house, apartment, etc.) withindriving distance of the institutionFraternity or sorority house
None of the above
27 What is the highest level of education that yourparent(s) completed? (Mark one box per column.)Father Mother
Did not finish high school
Graduated from high school
Attended college but did not complete degreeCompleted an associate’s degree (A.A.,A.S., etc.)Completed a bachelor’s degree (B.A.,B.S., etc.)Completed a master’s degree (M.A.,M.S., etc.)Completed a doctoral degree (Ph.D.,J.D., M.D., etc.)
28 Please print your major(s) or your expected major(s).
a. Primary major (Print only one.):
b. If applicable, second major (not minor, concentration, etc.):
THANKS FOR SHARING YOUR RESPONSES!After completing the survey, please put it in the enclosed postage-paid envelope and deposit it in any U.S.Postal Service mailbox. Questions or comments? Contact the National Survey of Student Engagement,Indiana University, 1900 East Tenth Street, Suite 419, Bloomington IN 47406-7512 or [email protected] or www.nsse.iub.edu. Copyright © 2008 Indiana University.
15 Write in your year of birth: 1 9
On what team(s) are you an athlete (e.g.,football, swimming)? Please answer below:
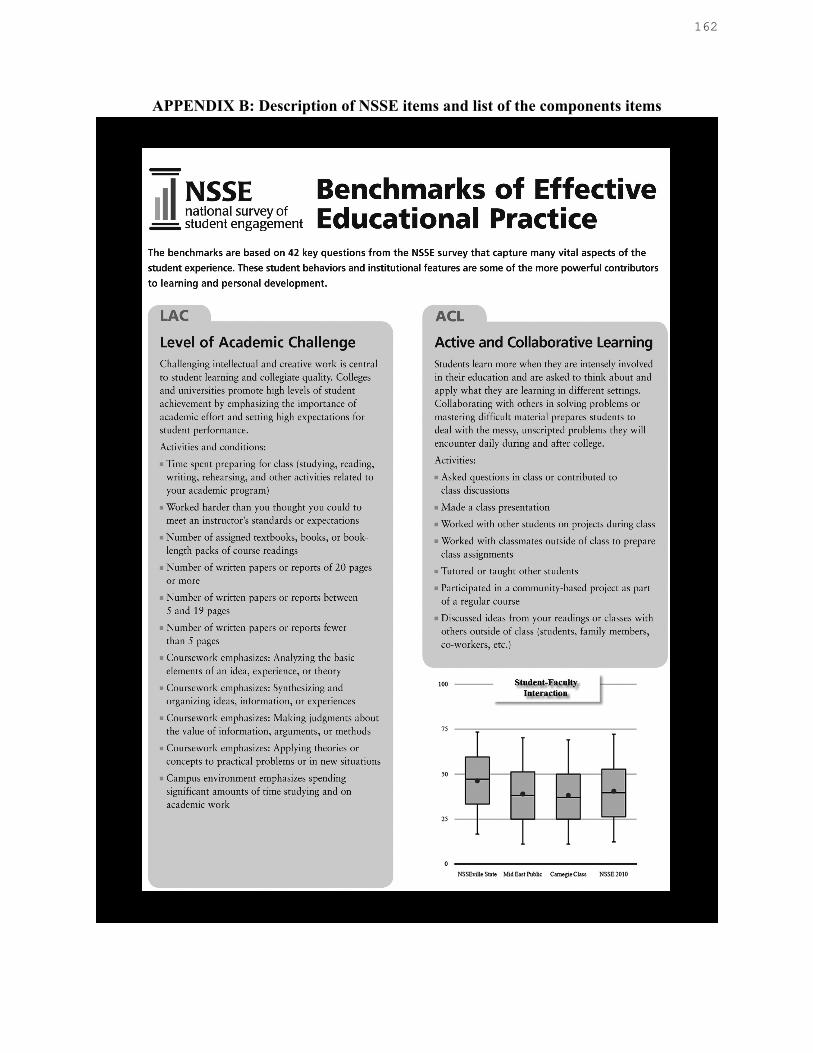
162
APPENDIX B: Description of NSSE items and list of the components items
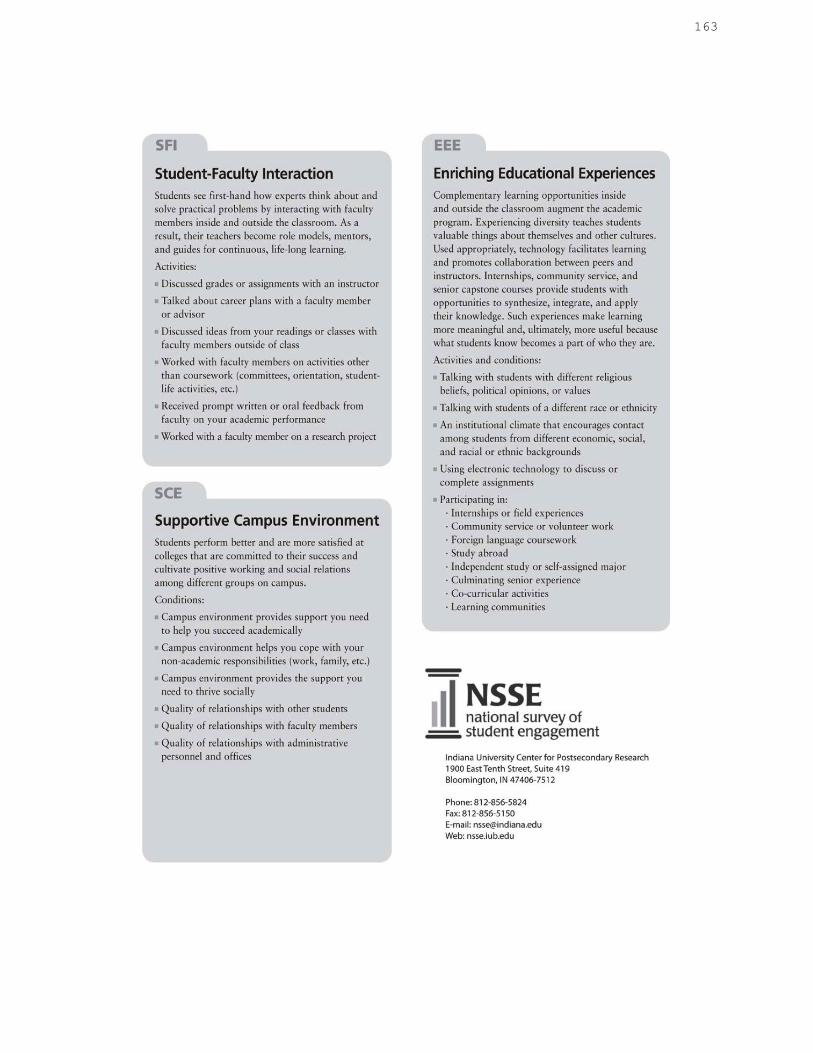
163