Embed Size (px)
Citation preview
Understanding the Effects of Hydrogen, Hydrostatic testing and Mill-
scale on SCC of Pipelines in Near-Neutral pH Environments
By
Zeynab Shirband
A thesis submitted in partial fulfillment of the requirements for the degree of
Doctor of Philosophy
in
Materials Engineering
Department of Chemical and Materials Engineering
University of Alberta
© Zeynab Shirband, 2016
ii
Abstract
Near-neutral pH stress corrosion cracks (NNpH SCC) are developed under coating disbondments
on the external surface of pipelines where the surface of pipeline is exposed to the soil solution.
NNpH SCC initiation and early stage of growth is mainly governed by the dissolution process of
steel. However, laboratory experiments on polished specimens rarely reproduced cracks in near-
neutral pH environment whose growth rates were consistent with what has been observed on
pipelines in the field. So, there have to be other factors involved in the crack initiation process
which have been ignored in most of the crack initiation studies. The presence of mill-scale and
application of occasional over-load cycles during hydrotesting on pipelines in the field can
explain this discrepancy. Furthermore, hydrogen involvement in this type of cracking, during
both crack initiation and growth, has been confirmed in several studies. However, the presence
of disbonded coatings on the pipeline, which can cause a CO2 concentration gradient along the
disbondment and may further change the environment and the amount of hydrogen ingress into
the steel, has been ignored in all previous experiments. Therefore, these tests may not represent
the true role of hydrogen in near-neutral pH SCC without considering disbonded coatings. This
study aimed at understanding the contribution of these important factors to NNpH SCC. In this
study, the role of coating disbondment on hydrogen ingress into pipeline steels and the effects of
mill-scale and hydrotesting on NNpH SCC crack initiation are investigated.
To study hydrogen ingress, a specially-designed Devanathan-Stachurski double cell was used for
hydrogen permeation measurements. This double cell simulated coating disbondment on one side
of the specimen and at the same time measured hydrogen permeation on the other side.
Furthermore, a comparative study was developed and crack initiation in mill-scaled and polished
iii
specimens and also in samples that were undergone hydrotesting and those, on which no
hydrotesting was applied, was compared.
It was found that a simulated coating disbondment acts to change hydrogen ingress along the
disbondment. The results showed that although corrosion rate was lower under disbonded
coating at narrower gap sizes (2 and 5 mm) between pipeline steel and the coating, the highest
level of hydrogen occurred at intermediate gap sizes (5 mm). Also, it was shown that contrary to
general belief, increasing CO2 concentration in solution did not increase hydrogen ingress into
pipelines. It was also found that the frequency of crack initiation occurrence from pits was
increased by the presence of mill-scale and by the application of multiple hydrostatic testing
stress cycles on pipelines. The results of this study showed that crack initiation experiments on
polished specimens and without considering real pressure condition, to which pipelines are
exposed in the field, underestimated short crack growth rates in the near-neutral pH environment.

iv
Preface
This thesis is an original work by Zeynab Shirband. Chapter 4 of this thesis has been published
as “Z. Shirband, R. Eadie, W. Chen, J. Luo, R. Kania, J. Been, G. V. Boven, Developing a pre-
pitting procedure for near-neutral pH stress corrosion crack initiation studies on X-52 pipeline
steel, Corrosion Engineering, Science and Technology 50 (3) , p. 196-202”. Chapters 3 and 5
were also submitted for publication.

v
Acknowledgments
I would like first to offer my sincerest gratitude to my supervisory committee, Dr. Jing-li Luo,
Dr. Reginald Eadie, and Dr. Weixing Chen for providing this opportunity and for all their
encouragement, patience, and guidance throughout my PhD program.
During my research, I have been aided by many staff in the department of Chemical and
Materials Engineering. I am especially grateful to Lily Laser, James McKinnon, Herb Green and
Walter Boddez for their office and technical support. My special thanks go to my colleagues
Richard Oviasuyi, Mengshan Yu, Afolabi Egbewande, Jiaxi Zhao, Devin Engel, Tianfei Wang
and Olayinka Tehinse for their help and friendly guidance.
This study was financially supported by the Natural Science and Engineering Research Council
(NSERC), TransCanada Pipeline Limited, Spectra Energy, and the Pipeline Research Council
International (PRCI). So, their support is greatly acknowledged.
I would also like to express my gratitude to my parents, without whom I could never reach this
stage in my life. I am profoundly grateful to my special friend, Karina Chevil for her continuous
support. My last, but not least, appreciation goes to my husband, Ali, whose love, kindness and
support was always with me and encouraged me.
vi
Table of Content
ABSTRACT .......................................................................................................................................................... II
PREFACE ........................................................................................................................................................... IV
ACKNOWLEDGMENTS .................................................................................................................................... V
LIST OF TABLES............................................................................................................................................. VIII
LIST OF FIGURES ............................................................................................................................................. IX
CHAPTER 1: INTRODUCTION ........................................................................................................................ 1
1.1 INTRODUCTION ..................................................................................................................................................... 2
1.2 THESIS OUTLINE .................................................................................................................................................. 4
REFERENCES .............................................................................................................................................................. 6
CHAPTER 2: LITERATURE REVIEW ............................................................................................................. 7
2.1 PIPELINE BACKGROUND ....................................................................................................................................... 8
2.2 STRESS CORROSION CRACKING (SCC) OF PIPELINES ............................................................................................ 9
2.3 HIGH PH SCC ..................................................................................................................................................... 12
2.4 NEAR-NEUTRAL PH SCC ................................................................................................................................... 14
2.4.1 Mechanistic Stages of NNpH SCC ............................................................................................................. 16 2.4.1.1 Hydrogen-Enhanced Dissolution Model .............................................................................................................. 18 2.4.1.2 Crack Tip Strain Rate Model ................................................................................................................................ 19 2.4.1.3 Superposition model ............................................................................................................................................. 19 2.4.1.4 Corrosion Fatigue Model ...................................................................................................................................... 20
2.4.2 Factors Contributing to the Near- Neutral pH SCC .................................................................................. 22 2.4.2.1 Mechanical Factors ............................................................................................................................................... 23 2.4.2.2 Metallurgical (Materials) Factors ......................................................................................................................... 29 2.4.2.3 Environmental Factors .......................................................................................................................................... 30
2.4.3 Laboratory Experiments on Crack Initiation on Pipelines ........................................................................ 39
2.5 RESEARCH OBJECTIVES ...................................................................................................................................... 44
REFERENCES ............................................................................................................................................................ 45
CHAPTER 3: INVESTIGATION OF HYDROGEN PERMEATION ALONG A COATING
DISBONDMENT ................................................................................................................................................ 52
3.1 INTRODUCTION ................................................................................................................................................... 53
3.2 EXPERIMENTAL .................................................................................................................................................. 54
3.2.1 Sample, Solution and Hydrogen Permeation Cell...................................................................................... 54
3.2.2 Hydrogen Permeation Tests ....................................................................................................................... 56
3.3 RESULTS AND DISCUSSION ................................................................................................................................. 57
3.3.1 Hydrogen Permeation Test Results at 10 mm Gap Size ............................................................................. 57
3.3.2 Model Fitting of Hydrogen Permeation Data ............................................................................................ 60
3.3.3 Effect of Gap Size on Permeated Hydrogen ............................................................................................... 62
3.3.4 Effect of CO2 Level on the Hydrogen Permeation ..................................................................................... 70
3.3.5 Effect of CP level on the Hydrogen Permeation ........................................................................................ 72 3.3.6 Effect of Distance from the Open Mouth and Gap Size on the Hydrogen Permeation at CP Level of -0.9 V
............................................................................................................................................................................ 75
vii
3.4 SUMMARY AND CONCLUSIONS ........................................................................................................................... 78
REFERENCES ............................................................................................................................................................ 80
CHAPTER 4: DEVELOPING A PRE-PITTING PROCEDURE FOR NEAR-NEUTRAL PH STRESS
CORROSION CRACK INITIATION STUDIES ON X-52 PIPELINE STEEL............................................... 82
4.1 INTRODUCTION ................................................................................................................................................... 83
4.2 EXPERIMENTAL .................................................................................................................................................. 84
4.2.1 Material ..................................................................................................................................................... 84
4.2.2 Experimental procedure ............................................................................................................................. 85
4.3 RESULTS AND DISCUSSION ................................................................................................................................. 87
4.3.1 Corrosion potential measurements ............................................................................................................ 87
4.3.2 Cyclic polarization tests ............................................................................................................................. 88
4.3.3 Pitting procedure ....................................................................................................................................... 90
4.3.4 Characteristics of the Resulting Pits .......................................................................................................... 92
4.3.5 Pitting Mechanism ..................................................................................................................................... 95
4.4 APPLICABILITY OF PRE-PITTING PROCEDURE FOR SCC STUDIES IN PIPELINES .................................................. 96
4.5 SUMMARY .......................................................................................................................................................... 98
REFERENCES .......................................................................................................................................................... 100
CHAPTER 5: EFFECT OF HYDROSTATIC TESTING ON CRACK INITIATION IN PIPELINE STEELS
IN NEAR-NEUTRAL PH ENVIRONMENT .................................................................................................. 102
5.1 INTRODUCTION ................................................................................................................................................. 103
5.2 MATERIAL AND METHODS ............................................................................................................................... 105
5.3 RESULTS AND DISCUSSION ............................................................................................................................... 107
5.3.1 Stress corrosion cracking in control samples .......................................................................................... 107
5.3.2 Stress corrosion cracking in samples having undergone three hydrostatic tests ..................................... 110
5.3.3 Comparison of the results between two kinds of samples ........................................................................ 111
5.4 CONCLUSIONS .................................................................................................................................................. 121
REFERENCES .......................................................................................................................................................... 122
CHAPTER 6: MILL-SCALE EFFECT ON CRACK INITIATION IN PIPELINE STEELS IN NEAR-
NEUTRAL PH ENVIRONMENT ................................................................................................................... 125
6.1 INTRODUCTION ................................................................................................................................................. 126
6.2 EXPERIMENTAL PROCEDURE ............................................................................................................................ 128
6.3 RESULTS AND DISCUSSION ............................................................................................................................... 130
6.3.1 Mill scale characterization before crack initiation test ........................................................................... 130
6.3.2 Surface characterizations after crack initiation tests............................................................................... 133
6.3.3 Cross-section characterizations after crack initiation tests ..................................................................... 135
REFERENCE ............................................................................................................................................................ 143
CHAPTER 7: CONCLUSIONS AND RECOMMENDATIONS .................................................................... 145
7.1 SUMMARY AND CONCLUSIONS ......................................................................................................................... 146
7.2 RECOMMENDATIONS FOR FUTURE WORK ........................................................................................................ 149
REFERENCES ................................................................................................................................................. 151
APPENDIX A: NICKEL ELECTROPLATING PROCEDURE .................................................................... 166
viii
List of Tables
TABLE 2.1. THE CHEMICAL COMPOSITION OF SIMULATED SOIL SOLUTIONS USED IN NNPH SCC RELATED
EXPERIMENTS. ..................................................................................................................................................... 32
TABLE 3.1. SUMMARY OF HYDROGEN PERMEATION PARAMETERS OBTAINED AT DIFFERENT GAP SIZES AND SECTIONS
ALONG THE DISBONDED COATING (TOP, MID: MIDDLE, BOT: BOTTOM). ............................................................. 64 TABLE 3.2. HYDROGEN PERMEATION PARAMETERS UNDER DIFFERENT CONCENTRATIONS OF CO2 INSIDE THE PURGING
GAS IN THE CHARGING CELL. (NOTE: ERRORS INDICATE STANDARD DEVIATION) ................................................ 72
TABLE 3.3. HYDROGEN PERMEATION PARAMETERS. .................................................................................................... 73
TABLE 5.1. CHEMICAL COMPOSITION OF C2 SOLUTION .............................................................................................. 106
TABLE 5.2. STATISTICS OF CRACKS FOUND IN STUDIED TOTAL LENGTH OF SPECIMENS. ............................................. 114
TABLE 6.1. CHEMICAL COMPOSITION OF C2 SOLUTION .............................................................................................. 129 TABLE 6.2. CHEMICAL COMPOSITION (AT%) OF DARK AND LIGHT REGIONS INSIDE THE MILL-SCALE OBTAINED BY
EDX. ................................................................................................................................................................. 132
ix
List of Figures
FIGURE 2.1. MAJOR CAUSES OF CANADIAN PIPELINES RUPTURE DURING YEARS 1992 TO 2012 [2]. ............................... 9
FIGURE 2.2. PIPE MAIN STRESSES [5]. ........................................................................................................................... 11 FIGURE 2.3. METALLOGRAPHIC SECTION SHOWING A HIGH-PH STRESS CORROSION CRACK IN A GAS TRANSMISSION
PIPELINE [14]. ...................................................................................................................................................... 14
FIGURE 2.4. METALLOGRAPHIC SECTIONS OF NEAR-NEUTRAL PH SCC [14]. ............................................................... 15 FIGURE 2.5. COMPARISON OF PARKIN‟S MODEL AND THE RECENTLY PROPOSED MODEL FOR DIFFERENT STAGES OF
NNPH SCC [17]. ................................................................................................................................................. 17 FIGURE 2.6. EFFECT OF FREQUENCY ON THE CRACK GROWTH IN C2 SOLUTION [29]. NOTE THAT CONSTANT AMPLITUDE
LOADING REFERS TO TESTS WITH CONSTANT ΔK. ................................................................................................ 22 FIGURE 2.7. DISTRIBUTION OF RESIDUAL STRESS FOR A LOW CARBON STEEL BUTT WELD BEFORE AND AFTER STRESS
RELIEF HEAT TREATMENT AND SHOT PEENING [37]. ............................................................................................. 27
FIGURE 3.1. A PICTURE AND SCHEMATIC OF THE EXPERIMENTAL HYDROGEN PERMEATION DOUBLE CELL. .................. 56 FIGURE 3.2. HYDROGEN PERMEATION CURVES AT GAP SIZE OF 10 MM AND OPEN CIRCUIT POTENTIAL CONDITION AT
THE CATHODIC SIDE. ............................................................................................................................................ 58 FIGURE 3. 3. SURFACE OF THE SAMPLE AFTER ABOUT 3 MINUTES EXPOSURE TO THE AIR AFTER FINISHING HYDROGEN
PERMEATION TEST UNDER OCP AND 5% CO2 CONDITION WHEN GAP SIZE WAS 10 MM. ...................................... 60 FIGURE 3.4. FITTING OF THE EXPERIMENTAL DATA OBTAINED AT OCP, 10 MM GAP SIZE AND 5% CO2
CONCENTRATION AT DIFFERENT SECTIONS ALONG THE DISBANDED COATING: TOP (A) MIDDLE (B) BOTTOM (C) 63
FIGURE 3.5. SURFACE OF SPECIMENS IMMEDIATELY AFTER HYDROGEN PERMEATION TESTS ........................................ 65 FIGURE 3.6. PLOT OF SUB-SURFACE HYDROGEN CONCENTRATION AT DIFFERENT SECTIONS ALONG THE DISBONDED
COATING UNDER VARIOUS GAP SIZES (2, 5 AND 10 MM). ...................................................................................... 66 FIGURE 3.7. CORROSION POTENTIAL AT TOP AND MIDDLE SECTIONS ALONG THE DISBONDED COATING AT 2 MM GAP
SIZE AND 5% CO2. ............................................................................................................................................... 68 FIGURE 3.8. VARIATION OF THE AVERAGE SUB-SURFACE HYDROGEN CONCENTRATION ALONG THE DISBONDMENT
WITH THE GAP SIZE. ............................................................................................................................................. 69 FIGURE 3.9. HYDROGEN PERMEATION CURVES OBTAINED AT THE OPEN MOUTH OF THE DISBONDED COATING UNDER
VARIOUS CONCENTRATION OF CO2 IN THE CHARGING CELL (A) SURFACE OF SAMPLE AFTER THE TEST AT 50%
CO2. .................................................................................................................................................................... 72
FIGURE 3.10. THE EFFECT OF CATHODIC POTENTIAL ON THE SUB-SURFACE HYDROGEN CONCENTRATION. .................. 74 FIGURE 3.11. SURFACE OF THE TOP SECTION OF SPECIMENS AFTER HYDROGEN PERMEATION EXPERIMENTS AT CP
LEVELS OF -1 AND -1.1 V (SCE). ......................................................................................................................... 75 FIGURE 3.12. VARIATION OF THE SUB-SURFACE HYDROGEN CONCENTRATION ALONG THE DISBONDED COATING UNDER
VARIOUS GAP SIZES OF 5 AND 10 MM. .................................................................................................................. 77
FIGURE 4.1. MICROSTRUCTURE OF THE X-52 PIPELINE STEEL USED IN THIS STUDY. ..................................................... 85 FIGURE 4.2. CORROSION POTENTIALS VS. TIME MEASURED AT SOLUTIONS WITH DIFFERENT CONCENTRATIONS OF
NACL................................................................................................................................................................... 88 FIGURE 4.3. CYCLIC POLARIZATION CURVES MEASURED IN THE SOLUTIONS WITH DIFFERENT CONCENTRATIONS OF
NACL................................................................................................................................................................... 89
x
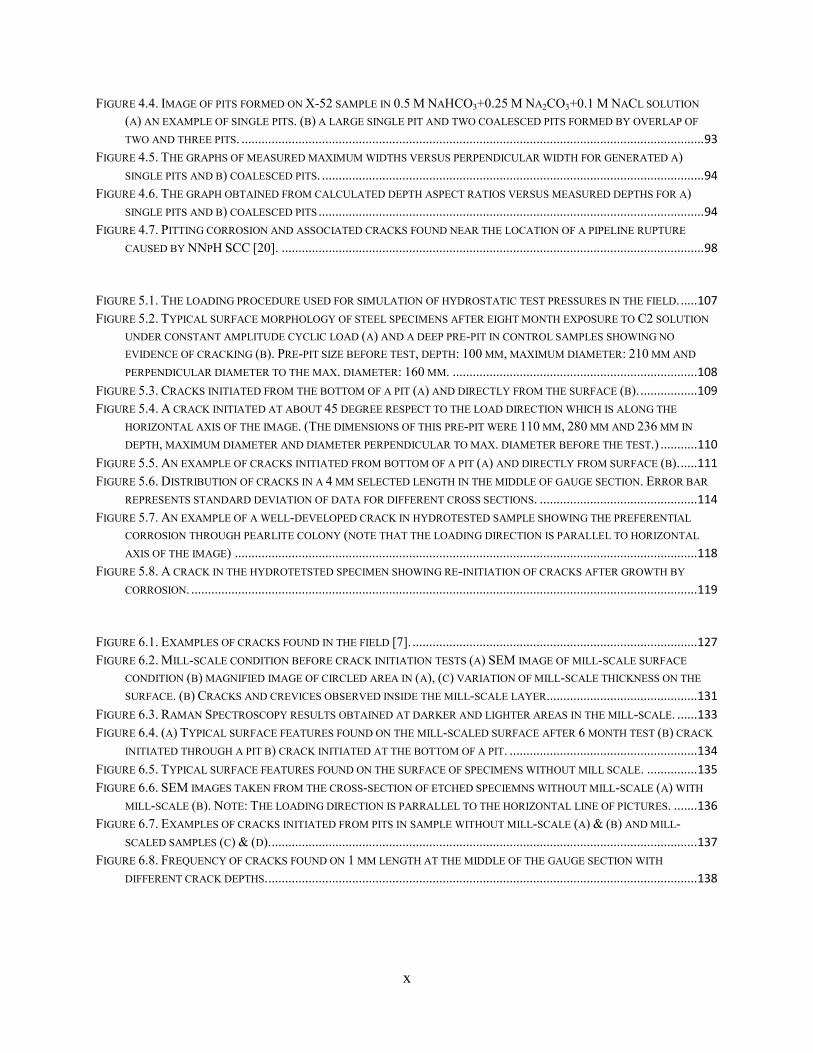
FIGURE 4.4. IMAGE OF PITS FORMED ON X-52 SAMPLE IN 0.5 M NAHCO3+0.25 M NA2CO3+0.1 M NACL SOLUTION
(A) AN EXAMPLE OF SINGLE PITS. (B) A LARGE SINGLE PIT AND TWO COALESCED PITS FORMED BY OVERLAP OF
TWO AND THREE PITS. .......................................................................................................................................... 93 FIGURE 4.5. THE GRAPHS OF MEASURED MAXIMUM WIDTHS VERSUS PERPENDICULAR WIDTH FOR GENERATED A)
SINGLE PITS AND B) COALESCED PITS. .................................................................................................................. 94 FIGURE 4.6. THE GRAPH OBTAINED FROM CALCULATED DEPTH ASPECT RATIOS VERSUS MEASURED DEPTHS FOR A)
SINGLE PITS AND B) COALESCED PITS ................................................................................................................... 94 FIGURE 4.7. PITTING CORROSION AND ASSOCIATED CRACKS FOUND NEAR THE LOCATION OF A PIPELINE RUPTURE
CAUSED BY NNPH SCC [20]. .............................................................................................................................. 98
FIGURE 5.1. THE LOADING PROCEDURE USED FOR SIMULATION OF HYDROSTATIC TEST PRESSURES IN THE FIELD. ..... 107 FIGURE 5.2. TYPICAL SURFACE MORPHOLOGY OF STEEL SPECIMENS AFTER EIGHT MONTH EXPOSURE TO C2 SOLUTION
UNDER CONSTANT AMPLITUDE CYCLIC LOAD (A) AND A DEEP PRE-PIT IN CONTROL SAMPLES SHOWING NO
EVIDENCE OF CRACKING (B). PRE-PIT SIZE BEFORE TEST, DEPTH: 100 ΜM, MAXIMUM DIAMETER: 210 ΜM AND
PERPENDICULAR DIAMETER TO THE MAX. DIAMETER: 160 ΜM. ......................................................................... 108
FIGURE 5.3. CRACKS INITIATED FROM THE BOTTOM OF A PIT (A) AND DIRECTLY FROM THE SURFACE (B). ................. 109 FIGURE 5.4. A CRACK INITIATED AT ABOUT 45 DEGREE RESPECT TO THE LOAD DIRECTION WHICH IS ALONG THE
HORIZONTAL AXIS OF THE IMAGE. (THE DIMENSIONS OF THIS PRE-PIT WERE 110 ΜM, 280 ΜM AND 236 ΜM IN
DEPTH, MAXIMUM DIAMETER AND DIAMETER PERPENDICULAR TO MAX. DIAMETER BEFORE THE TEST.) ........... 110
FIGURE 5.5. AN EXAMPLE OF CRACKS INITIATED FROM BOTTOM OF A PIT (A) AND DIRECTLY FROM SURFACE (B). ..... 111 FIGURE 5.6. DISTRIBUTION OF CRACKS IN A 4 MM SELECTED LENGTH IN THE MIDDLE OF GAUGE SECTION. ERROR BAR
REPRESENTS STANDARD DEVIATION OF DATA FOR DIFFERENT CROSS SECTIONS. ............................................... 114 FIGURE 5.7. AN EXAMPLE OF A WELL-DEVELOPED CRACK IN HYDROTESTED SAMPLE SHOWING THE PREFERENTIAL
CORROSION THROUGH PEARLITE COLONY (NOTE THAT THE LOADING DIRECTION IS PARALLEL TO HORIZONTAL
AXIS OF THE IMAGE) .......................................................................................................................................... 118 FIGURE 5.8. A CRACK IN THE HYDROTETSTED SPECIMEN SHOWING RE-INITIATION OF CRACKS AFTER GROWTH BY
CORROSION. ....................................................................................................................................................... 119
FIGURE 6.1. EXAMPLES OF CRACKS FOUND IN THE FIELD [7]. ..................................................................................... 127 FIGURE 6.2. MILL-SCALE CONDITION BEFORE CRACK INITIATION TESTS (A) SEM IMAGE OF MILL-SCALE SURFACE
CONDITION (B) MAGNIFIED IMAGE OF CIRCLED AREA IN (A), (C) VARIATION OF MILL-SCALE THICKNESS ON THE
SURFACE. (B) CRACKS AND CREVICES OBSERVED INSIDE THE MILL-SCALE LAYER............................................. 131
FIGURE 6.3. RAMAN SPECTROSCOPY RESULTS OBTAINED AT DARKER AND LIGHTER AREAS IN THE MILL-SCALE. ...... 133 FIGURE 6.4. (A) TYPICAL SURFACE FEATURES FOUND ON THE MILL-SCALED SURFACE AFTER 6 MONTH TEST (B) CRACK
INITIATED THROUGH A PIT B) CRACK INITIATED AT THE BOTTOM OF A PIT. ........................................................ 134
FIGURE 6.5. TYPICAL SURFACE FEATURES FOUND ON THE SURFACE OF SPECIMENS WITHOUT MILL SCALE. ............... 135 FIGURE 6.6. SEM IMAGES TAKEN FROM THE CROSS-SECTION OF ETCHED SPECIEMNS WITHOUT MILL-SCALE (A) WITH
MILL-SCALE (B). NOTE: THE LOADING DIRECTION IS PARRALLEL TO THE HORIZONTAL LINE OF PICTURES. ....... 136 FIGURE 6.7. EXAMPLES OF CRACKS INITIATED FROM PITS IN SAMPLE WITHOUT MILL-SCALE (A) & (B) AND MILL-
SCALED SAMPLES (C) & (D). ............................................................................................................................... 137 FIGURE 6.8. FREQUENCY OF CRACKS FOUND ON 1 MM LENGTH AT THE MIDDLE OF THE GAUGE SECTION WITH
DIFFERENT CRACK DEPTHS. ................................................................................................................................ 138

1
Chapter 1: Introduction
2
1.1 Introduction
Pipelines are used all over the world for transportation of large quantities of oil and gas. The
larger of these pipelines (101.6 mm to 1212 mm in diameter) are named transmission pipelines
and carry highly pressurized products over large distances. Since they transfer products which
pose a major threat to the surrounding people as well as the environment, they are manufactured,
installed, and operated according to well-established standards. Although strictly regulated to
avoid catastrophic disasters and environmental pollution, pipeline ruptures may occur even with
the application of preventive measures such as protective coating and cathodic protection. The
most common integrity concerns in pipelines are caused when pipeline coatings fail and the
pipeline surface is directly exposed to the soil solution. Stress corrosion cracking (SCC), which
is an environmentally enhanced cracking, has been reported to cause about 34% of pipeline
failures in the Canadian pipeline system [1]. One form of SCC which caused ruptures beginning
in 1986 is called near-neutral pH SCC [2] and is associated with the formation of a very dilute
bicarbonate-carbonate anaerobic solution with a near-neutral pH under disbonded coatings.
Carbon dioxide from the decay of organic materials is dissolved in the soil solution. With the
formation of a buffer solution made of H2CO3 and HCO3-
the pH remains in the near-neutral
range. This happens wherever limited or no cathodic potential can reach the pipeline surface to
increase the pH level.
The overall process of NNpH SCC cracking to the failure point is divided into several steps:
initiation and early stage growth, dormancy stage at about depth of 1 mm, re-initiation of the
dormant cracks and their propagation and coalescence to reach a critical size and, finally, rapid
growth and rupture of pipelines [3]. Pipelines spend most of their lifetime in steps one and two.
Although many investigations focused on initiation of NNpH SCC over the past years, the
3
current understanding of the initiation stage is still evolving because these studies rarely obtained
small crack growth rates comparable to what is observed in the field. Crack initiation and early
growth is believed to be a dissolution-controlled process. However, with the corrosion rates
observed in the simulated soil solutions it would take a very long time for cracks to grow to the
depth of 1 mm (the dormancy point). This is not reasonable considering the real life span of a
pipeline (20-30 years). One reason why most of the crack initiation studies failed to reproduce
cracks in a reasonable time can be that polished samples and the loading conditions which do not
simulate real pressure changes in the field have been used in those studies. In addition, pipelines
used in the field are covered with a thick mill-scale layer. Although surface preparation is
performed before the application of coatings on pipelines, it cannot remove the entire mill-scale
layer from the pipe surface. Mill-scale is known to have a more positive potential than the steel,
so there is the possibility of development of macro-galvanic effects between steel and the mill-
scale [4]. This effect could enhance initiation of small cracks. On the other hand, some pipelines
undergo hydrostatic testing every several years, during which they are pressurized with water to
pressures exceeding their normal operating pressures. Although this test is performed as a SCC
management tool to identify critical size cracks, it produces a large amount of plastic
deformation around stress raisers such as corrosion pits [5]. It has been shown that micro-plastic
deformation is essential for initiation of stress corrosion cracks [6] and also it can enhance
dissolution [7] which, in turn, can enhance crack initiation around the pits. Therefore, studying
the effects of hydrostatic testing and mill-scale on crack initiation and early crack growth
becomes important and may explain the incidence of higher growth of small cracks in the field.
Another parameter, whose effect on NNpH SCC cracking is confirmed but not completely
understood yet, is hydrogen. Since this type of cracking occurs at or near the open circuit
4
corrosion potential of steel, it is accompanied by dissolution of the steel. The cathodic reaction
involved in the corrosion process produces hydrogen atoms, some of which are absorbed into the
steel and play an important role in the cracking process. Although many studies in the open
literature have focused on the role of hydrogen in NNpH SCC, they did not consider the effect of
disbondment and environmental changes under disbonded coatings on hydrogen ingress inside
the pipeline steels. No study in the open literature has quantified the influence of test conditions
and distance from the holiday of the disbondment on the amount of hydrogen present within the
metal lattice which, in turn, can explain the different crack growth behaviour observed under
disbonded coatings.
Therefore, in order to address the aforementioned issues, this study was divided into two stages.
In the first stage, hydrogen permeation experiments were conducted using a specially-designed
Devanathan-Stachurski double cell. This cell enabled the measurement of hydrogen permeability
along a simulated coating disbondment. In the second stage, crack initiation experiments were
performed with the purpose of examining the effects of hydrostatic testing and mill-scale on
crack initiation and early growth stage separately.
1.2 Thesis Outline
This thesis reports the findings of two stages of the research. Before addressing the performed
experiments and results, a detailed background and literature review are given in Chapter 2.
In Chapter 3, the hydrogen permeation behaviour of X-65 pipeline steel at open circuit potential
was examined along a simulated coating disbondment. The results for different sections along
the simulated coating are compared for various gap sizes between the coating and steel specimen
and also different concentrations of CO2. The effect of applied cathodic potentials ranging from -
5
800 to -1200 mV on the environment under the disbondment, and its effect on hydrogen
permeation behaviour, is also investigated in this chapter.
Chapters 4 to 6 focus on crack initiation experiments. Knowing that crack initiation in the field
can take several years and cracks were shown to initiate mostly from pits [1], some pits were
generated on the specimens to accelerate the crack initiation process. Chapter 4 covers the
detailed experimental procedure for generation of these pre-pits on tensile specimens.
Chapter 5 presents crack initiation experiments that were conducted on four pre-pitted X-52 steel
specimens under a cyclic load with a frequency close to what gas pipelines usually undergo. To
determine the effect of hydrostatic testing on crack initiation, two specimens were considered as
control samples without undergoing any hydrostatic test loading while for the other two samples,
cyclic loading was interrupted at different intervals and a loading procedure simulating the
hydrotest pressure changes in the field was applied to them. Finally, the results for different
conditions were compared and presented in this chapter.
In Chapter 6, the role of mill-scale on initiation of cracks in the near-neutral environment is
investigated. Two types of specimens, covered with mill-scale and the other with polished
surfaces, were tested under the same cyclic load and environmental conditions. The effect of
mill-scale layer was found after comparing the results on the two types of samples after finishing
the tests.
Chapter 7 presents a summary of research findings and some suggestions for future work.
6
References
[1] https://www.neb-one.gc.ca/sftnvrnmnt/sft/pplnrptr/index-eng.html
[2] National Energy Board, 1996, "Public Enquiry Concerning Stress Corrosion Cracking on
Canadian Oil and Gas Pipelines," report #MH-2-95.
[3] W. Chen, An overview of near-neutral pH SCC in pipelines and mitigation strategies for its
initiation and growth, Corrosion 72 (7), p. 962-977.
[4] Z. Qin, B. Demko, J. Noel, D. Shoesmith, F. King, Localized Dissolution of Millscale-
Covered Pipeline Steel Surfaces, Corrosion, 60 (10), p. 906.
[5] J. Li, M. Elboujdaini, M. Gao, R.W. Revie, Investigation of plastic zones near SCC tips in a
pipeline after hydrostatic testing, Materials Science and Engineering A 486, p. 496–502
[6] B.T. Lu, J.L. Luo, P.R. Norton, Environmentally assisted cracking mechanism of pipeline
steel in near-neutral pH groundwater, Corrosion Science 52, p. 1787–1795.
[7] B. Fang, R. Eadie, W. Chen, and M. Elboujdaini, A Passivation/Acid-Immersion Technique
to Grow Pits in Pipeline Steel and a Study of the Resulting Pit Nucleation and Growth,
Corrosion Engineering, Science and Technology 44(1), p.32-42.

7
Chapter 2: Literature Review
8
2.1 Pipeline background
Pipelines make great contributions to cost reduction and increased transportation efficiency as
they allow transportation of crude oil and natural gas under high pressure throughout the world.
Canada, as one of the significant producers of oil and gas in the world, is home to about 830,000
km of pipelines which, if laid end to end is enough to go all the way around the world 20 times
[1]. Pipelines are considered as the most economical for transporting oil and gas but they are not
risk-free as they would impose life and environment risks in case of rupture followed by an
explosion. Therefore, safe construction and operation of pipelines is a basic requirement for
successful deployment of oil and gas transmission systems.
Safety measures are taken during planning, design, construction and operation of pipelines. The
most important measures during construction of pipelines to ensure their safe operation in the
future are the application of a protective coating coupled with installation of a cathodic
protection system and the initial hydrostatic testing of the pipelines. Protective coatings prevent
exposure of the pipelines to the soil solution, which would cause corrosion of the pipeline steel
and cathodic protection is a supplementary action to ensure exposed steel where coatings are
damaged are protected by passing an electric current through the soil to the pipes. The integrity
of pipelines is sometimes evaluated with hydrostatic tests during which pipelines are filled with
pressurized water at pressures in excess of their operational pressure.
Although preventive actions are taken during construction of pipelines, pipelines rupture still
occurs. As shown in Figure 2.1, according to National Energy Board of Canada, during 20 years
from 1992 to 2012, the major causes of Canadian pipelines ruptures were cracking, material,
manufacturing or construction causes, external interference, metal loss and geotechnical failure
9
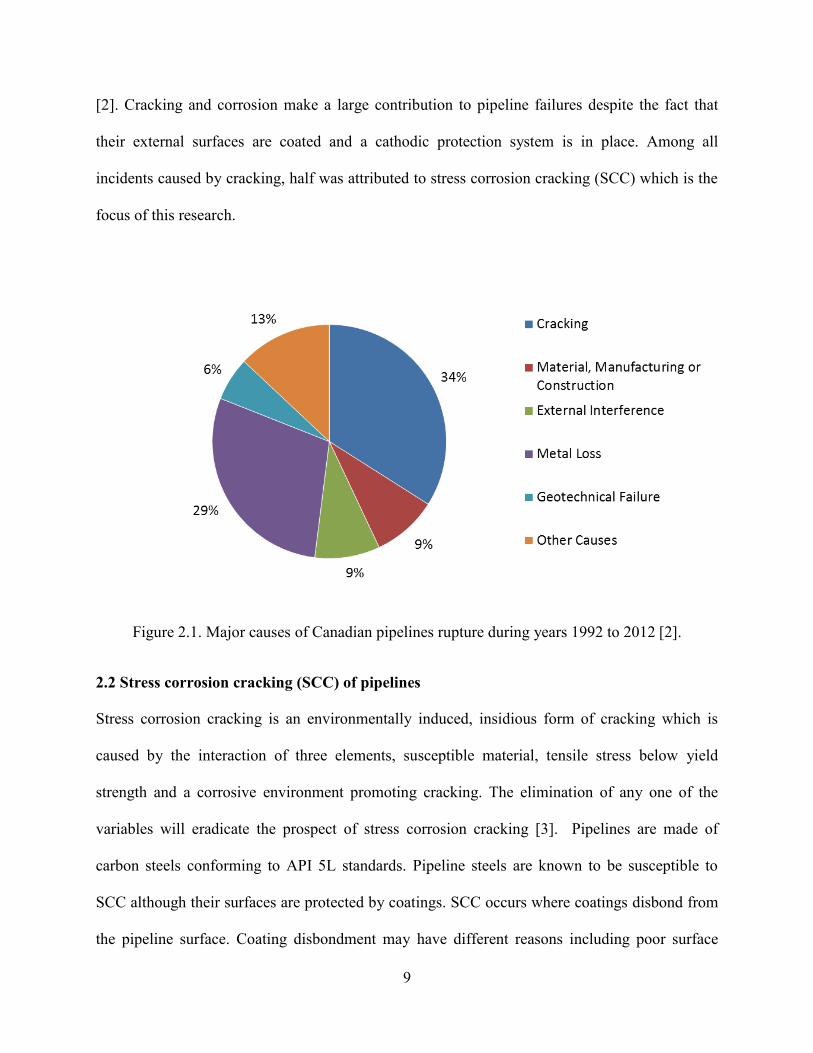
[2]. Cracking and corrosion make a large contribution to pipeline failures despite the fact that
their external surfaces are coated and a cathodic protection system is in place. Among all
incidents caused by cracking, half was attributed to stress corrosion cracking (SCC) which is the
focus of this research.
Figure 2.1. Major causes of Canadian pipelines rupture during years 1992 to 2012 [2].
2.2 Stress corrosion cracking (SCC) of pipelines
Stress corrosion cracking is an environmentally induced, insidious form of cracking which is
caused by the interaction of three elements, susceptible material, tensile stress below yield
strength and a corrosive environment promoting cracking. The elimination of any one of the
variables will eradicate the prospect of stress corrosion cracking [3]. Pipelines are made of
carbon steels conforming to API 5L standards. Pipeline steels are known to be susceptible to
SCC although their surfaces are protected by coatings. SCC occurs where coatings disbond from
the pipeline surface. Coating disbondment may have different reasons including poor surface
10
preparation method which weakens adhesion of coatings, coating damage as it tents over welds
and poor resistance of coatings against disbondment which can be related to their capacity for
water absorption from soils or their sensitivity to increased alkalinity produced by cathodic
protection [4]. Another suggested reason for coating disbondment is an evolution of hydrogen at
the steel-coating interface when there is excessive cathodic protection current in place [4].
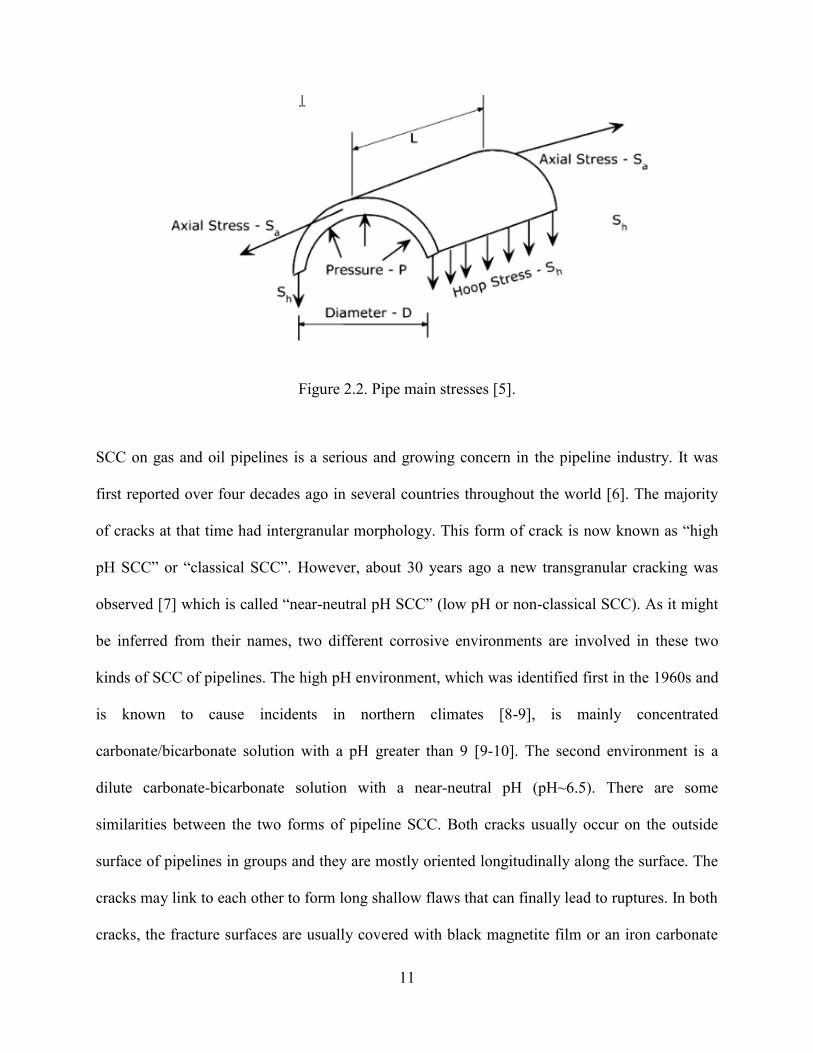
Tensile stress is an inherent part of pipelines as pressurized gas and crude oil pass through them.
The internal pressure of pipelines causes three different stresses on pipelines (Figure 2.2):
circumferential or hoop stress, longitudinal or axial stress and radial stress (which is insignificant
for the thickness used in transmission pipelines). Hoop stress is two times more than longitudinal
stress and is the main cause of SCC in the pipelines since most of SCC cracks are oriented
longitudinally along the pipe. However, stresses caused by internal pressure are not the only
stresses responsible for SCC. In most cases, residual stresses from pipe manufacturing and
construction (e.g., field bends) and stresses from in-service damage or soil, combined with hoop
stress, are the stresses causing pipelines failures.
11
Figure 2.2. Pipe main stresses [5].
SCC on gas and oil pipelines is a serious and growing concern in the pipeline industry. It was
first reported over four decades ago in several countries throughout the world [6]. The majority
of cracks at that time had intergranular morphology. This form of crack is now known as “high
pH SCC” or “classical SCC”. However, about 30 years ago a new transgranular cracking was
observed [7] which is called “near-neutral pH SCC” (low pH or non-classical SCC). As it might
be inferred from their names, two different corrosive environments are involved in these two
kinds of SCC of pipelines. The high pH environment, which was identified first in the 1960s and
is known to cause incidents in northern climates [8-9], is mainly concentrated
carbonate/bicarbonate solution with a pH greater than 9 [9-10]. The second environment is a
dilute carbonate-bicarbonate solution with a near-neutral pH (pH~6.5). There are some
similarities between the two forms of pipeline SCC. Both cracks usually occur on the outside
surface of pipelines in groups and they are mostly oriented longitudinally along the surface. The
cracks may link to each other to form long shallow flaws that can finally lead to ruptures. In both
cracks, the fracture surfaces are usually covered with black magnetite film or an iron carbonate
12
film [11]. However, there are differences between them. Since the steels involved and the
operating pressures do not differ practically for pipelines displaying the two different modes, the
difference in morphology of these two types of cracking arises from the different environment
involved in the cracking process. How these environments are formed around pipelines is
discussed in more details in the next sections.
2.3 High pH SCC
The first case of pipeline rupture caused by high pH SCC was reported in 1965 for a US gas
transmission pipeline [9]. Since this rupture, many investigators focused their work to determine
the causes and mechanism of this type of SCC and, unlike the near-neutral pH SCC, the pipeline
industry now has a full understanding of it. As shown in Figure 2.3, these cracks are
intergranular in morphology and have a narrow width, indicating a lack of corrosion at the crack
sides. Unlike near-neutral pH SCC, high pH SCC occurs when the cathodic protection current is
able to reach the affected pipeline steel, so it is more observed in low resistive soil area and in
pipelines with coatings that can conduct electricity such as coal tar and asphalt [10]. When a
coating is disbonded, ground water solution penetrates inside the gap between the coating and
pipe. If enough cathodic current reaches the steel exposed to the ground water, hydroxyl ions are
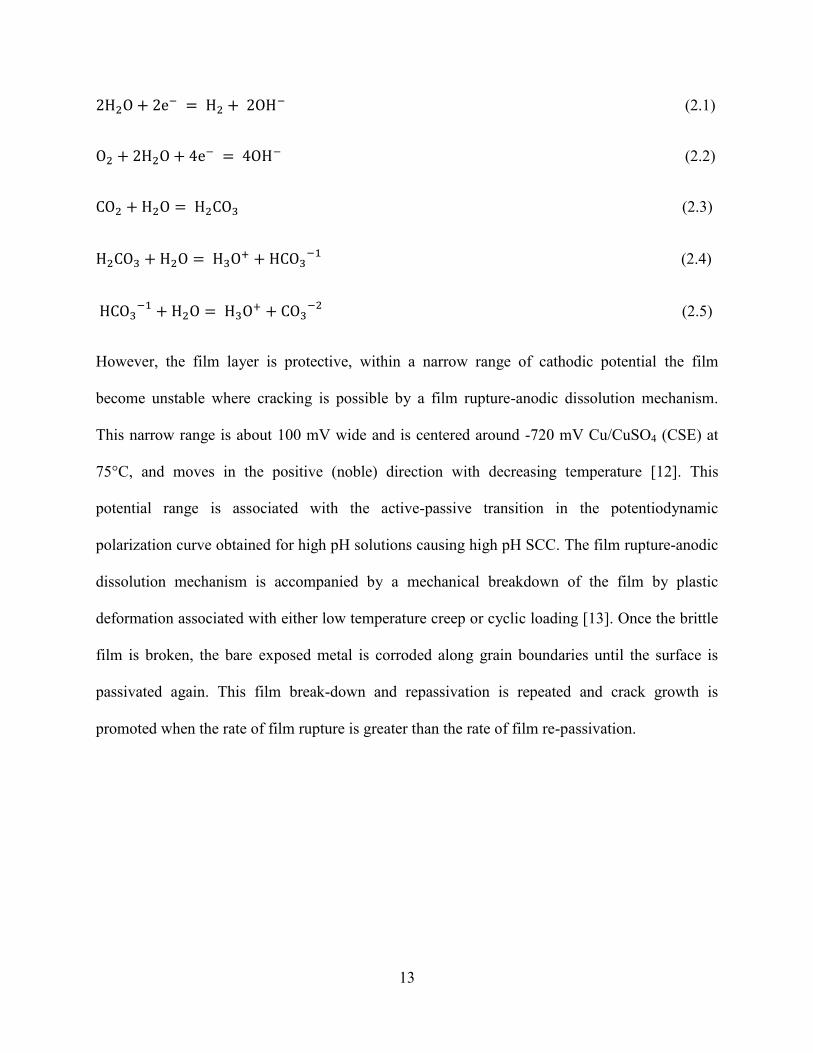
formed through equations (2.1) and (2.2) and cause pH of the trapped solution to increase. CO2
gas present in the soil water from the decay of organic matter is dissolved in this high pH
solution and a concentrated carbonate/bicarbonate solution with a pH 8 to10 is formed according
to equations (2.3) to (2.5). In order for the solution to be maintained in this pH range, continuous
supply of CO2 is essential. Any factor that affects the rate of CO2 generation, such as the soil
temperature and moisture content will affect the probability of high-pH SCC. This solution forms
a protective layer on the surface of pipelines which is mainly composed of FeCO3.
13
(2.1)
(2.2)
(2.3)
(2.4)
(2.5)
However, the film layer is protective, within a narrow range of cathodic potential the film
become unstable where cracking is possible by a film rupture-anodic dissolution mechanism.
This narrow range is about 100 mV wide and is centered around -720 mV Cu/CuSO4 (CSE) at
75°C, and moves in the positive (noble) direction with decreasing temperature [12]. This
potential range is associated with the active-passive transition in the potentiodynamic
polarization curve obtained for high pH solutions causing high pH SCC. The film rupture-anodic
dissolution mechanism is accompanied by a mechanical breakdown of the film by plastic
deformation associated with either low temperature creep or cyclic loading [13]. Once the brittle
film is broken, the bare exposed metal is corroded along grain boundaries until the surface is
passivated again. This film break-down and repassivation is repeated and crack growth is
promoted when the rate of film rupture is greater than the rate of film re-passivation.
14
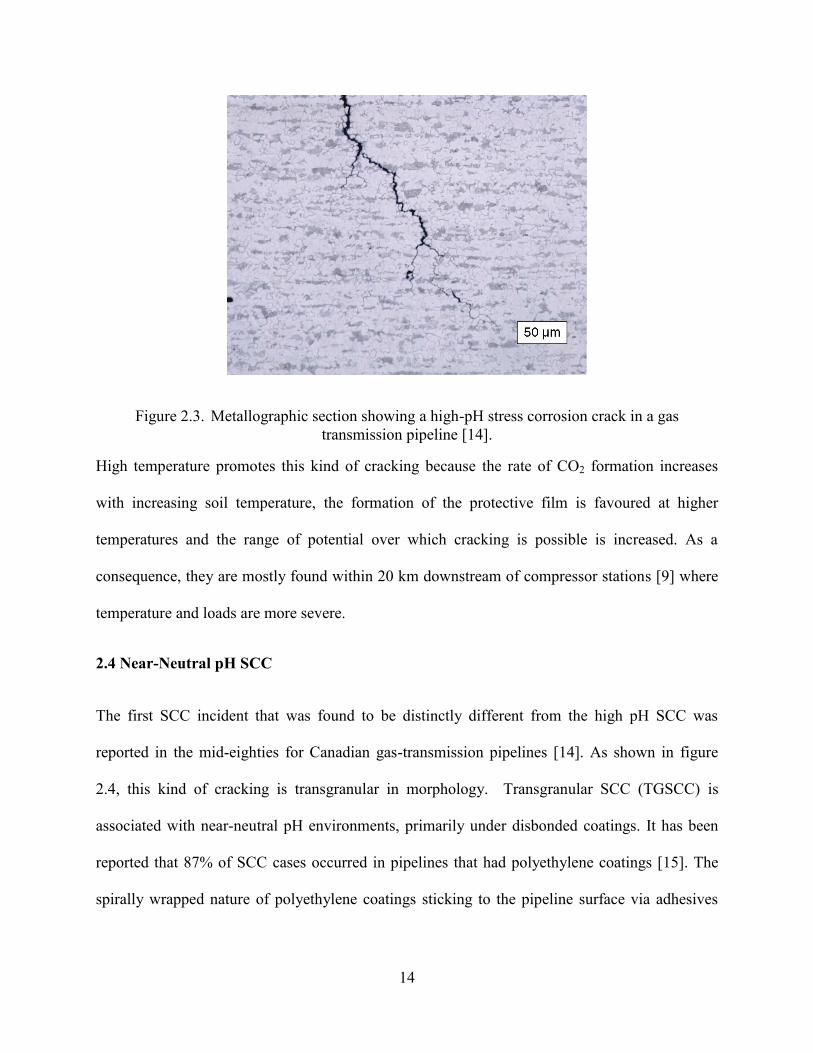
Figure 2.3. Metallographic section showing a high-pH stress corrosion crack in a gas
transmission pipeline [14].
High temperature promotes this kind of cracking because the rate of CO2 formation increases
with increasing soil temperature, the formation of the protective film is favoured at higher
temperatures and the range of potential over which cracking is possible is increased. As a
consequence, they are mostly found within 20 km downstream of compressor stations [9] where
temperature and loads are more severe.
2.4 Near-Neutral pH SCC
The first SCC incident that was found to be distinctly different from the high pH SCC was
reported in the mid-eighties for Canadian gas-transmission pipelines [14]. As shown in figure
2.4, this kind of cracking is transgranular in morphology. Transgranular SCC (TGSCC) is
associated with near-neutral pH environments, primarily under disbonded coatings. It has been
reported that 87% of SCC cases occurred in pipelines that had polyethylene coatings [15]. The
spirally wrapped nature of polyethylene coatings sticking to the pipeline surface via adhesives
15
makes them easy to de-bond, which is why SCC cracks are most likely found in this type of
coating.
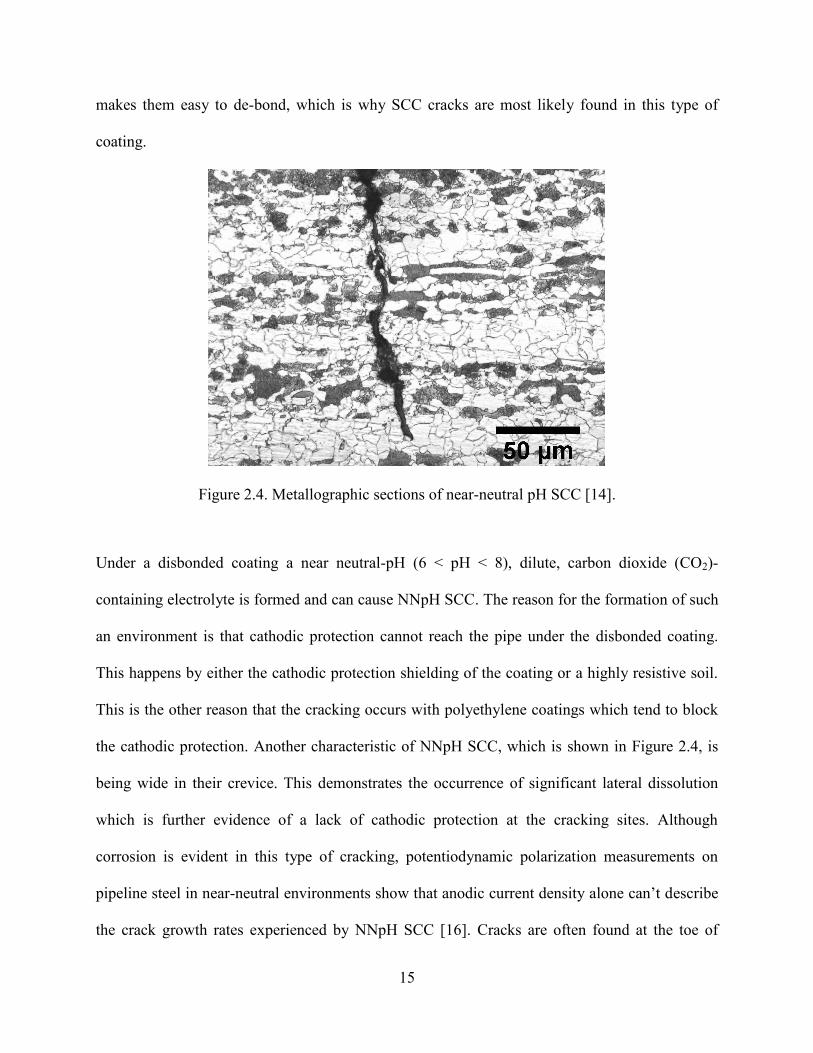
Figure 2.4. Metallographic sections of near-neutral pH SCC [14].
Under a disbonded coating a near neutral-pH (6 < pH < 8), dilute, carbon dioxide (CO2)-
containing electrolyte is formed and can cause NNpH SCC. The reason for the formation of such
an environment is that cathodic protection cannot reach the pipe under the disbonded coating.
This happens by either the cathodic protection shielding of the coating or a highly resistive soil.
This is the other reason that the cracking occurs with polyethylene coatings which tend to block
the cathodic protection. Another characteristic of NNpH SCC, which is shown in Figure 2.4, is
being wide in their crevice. This demonstrates the occurrence of significant lateral dissolution
which is further evidence of a lack of cathodic protection at the cracking sites. Although
corrosion is evident in this type of cracking, potentiodynamic polarization measurements on
pipeline steel in near-neutral environments show that anodic current density alone can‟t describe
the crack growth rates experienced by NNpH SCC [16]. Cracks are often found at the toe of
16
welds where coatings tend to tent due to the weld reinforcement and indicating that stress raisers
may play a more prominent role in this new form of SCC than in the case of high-pH SCC [14].
Since the focus of this study is on NNpH SCC, a detailed review on the mechanistic stages of
and contributing factors to this kind of cracking will be presented in the next sections.
2.4.1 Mechanistic Stages of NNpH SCC
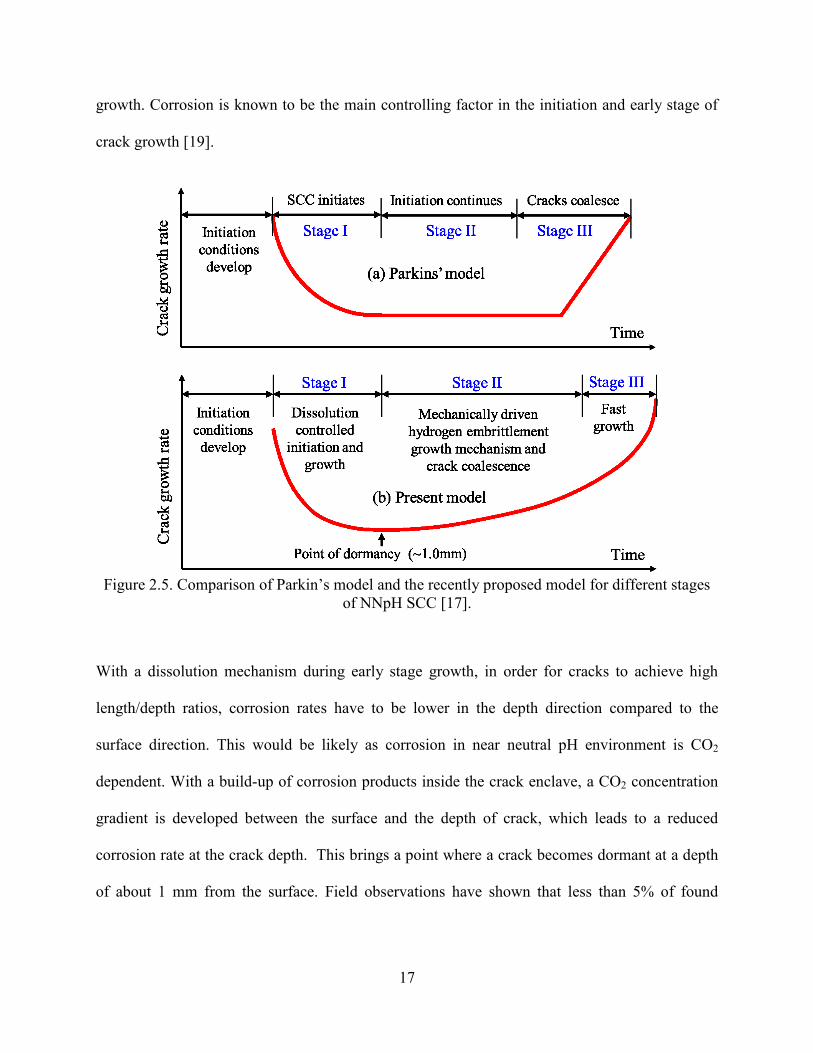
Stress corrosion cracking comprises different phases. Similar to what has been proposed by
Parkins in 1994 for high pH SCC, a model has been recently defined by Chen et al. for NNpH
SCC [17]. Figure 2.5 shows a comparison of Parkins‟ model and the recently proposed model.
Based on the latter model, before the start of cracking there is an incubation period during which
conditions for cracking develop. This period includes the time during which a coating disbonds
from the surface. The cracking phases include a period of initiation and early stage of growth
(Stage I), a period of increasing crack growth and crack coalescence (Stage II) and, finally, a
period of very rapid crack growth and final failure of the pipeline (Stage III).
Crack initiation and early stage of growth are believed to be dissolution controlled as their
growth does not follow fracture mechanics principles. Field findings have shown that NNpH
SCC cracks have a semi-elliptical shape with large length/depth ratio during their initiation and
early stage of cracking. This crack profile will result in higher stress intensity levels at the depth
of crack rather than on the surface and higher crack growth is expected in the crack depth.
However, this is in contrary to crack profiles found in the field. Experimental work by Wilmott
et al also showed that growth of shallow cracks is independent of crack stress intensity factor
[18]. Therefore, non-mechanical driving forces should be responsible for the early stage of crack
17
growth. Corrosion is known to be the main controlling factor in the initiation and early stage of
crack growth [19].
Figure 2.5. Comparison of Parkin‟s model and the recently proposed model for different stages
of NNpH SCC [17].
With a dissolution mechanism during early stage growth, in order for cracks to achieve high
length/depth ratios, corrosion rates have to be lower in the depth direction compared to the
surface direction. This would be likely as corrosion in near neutral pH environment is CO2
dependent. With a build-up of corrosion products inside the crack enclave, a CO2 concentration
gradient is developed between the surface and the depth of crack, which leads to a reduced
corrosion rate at the crack depth. This brings a point where a crack becomes dormant at a depth
of about 1 mm from the surface. Field observations have shown that less than 5% of found
18
NNpH SCC colonies had cracks that had grown beyond the dormancy point. Crack growth after
the dormancy point is a matter of stage II growth.
Long crack growth in Stage II has been investigated by many researchers and, unlike stage I
crack growth, corrosion alone cannot account for the observed crack velocities [20]. On the other
hand, since steel in near-neutral soil solutions shows active behaviour, the mechanism for crack
growth cannot be attributed to the film rupture-anodic dissolution mechanism. It has been
reported that stage II growth is influenced by many factors including pressure fluctuations
parameters, hydrogen, dissolution and low-temperature creep. Different mechanisms have been
proposed for long-crack growth which will be shortly addressed below:
2.4.1.1 Hydrogen-Enhanced Dissolution Model
This model was first presented by Mao et al. [21] and considers the synergistic effect of stress
and the presence of hydrogen. This model proposes that with the generation of hydrogen on the
surface and its absorption into the steel, it will diffuse to high-stress zones ahead of crack tip and
change the internal energy and entropy of the material as well as decrease the interactive atomic
cohesion, which increases the anodic dissolution rate [21]. They also performed a
thermodynamic analysis of the interactions between stress and hydrogen to demonstrate the
changes in free energy during the corrosion process. However, later experimental studies
performed by Lu et al. [22-23] showed that the active dissolution was almost unaffected by the
hydrogen charging and tensile stress. This invalidated the proposed hydrogen-facilitated
dissolution model.
19
2.4.1.2 Crack Tip Strain Rate Model
Beavers et al. [24] proposed the crack tip strain rate model for describing NNpH SCC crack
growth. They believed that a critical strain rate is required in order for the crack to grow. This
model is mainly used for systems that can produce a protective passive film on the surface. The
brittle passive film can rupture by plastic straining at the crack-tip when crack tip strains exceed
a critical value which is the strain rate needed for rupture of the film. Bare metal is then exposed
to the crack-tip electrolyte. Consequently, accelerated local anodic metal dissolution can take
place, which finally leads to corrosion-assisted crack growth.
Based on this model the strain rate ( ) at crack tip can be calculated using the below equation (f
denoting the frequency and R=
):
(2.6)
However, this model can predict that application of static load (f=0 and R=1) result in zero crack
tip strain rate and consequently no crack growth which is consistent with laboratory results, it
appears that strain rate alone cannot describe crack growth behavior although strain increases the
dissolution rate and enhances the uptake of hydrogen. This could be primary because of the fact
that pipeline steels are not passivated in near-neutral pH soil environments.
2.4.1.3 Superposition model
In a superposition modeling approach, the time-dependent SCC crack growth is combined with
the fatigue crack growth contribution to give the total crack growth:
SCCfatiguetotal dt
da
fdN
da
dN
da
1
(2.7)
20
Contribution of crack growth through fatigue is also expressed by simple Paris law:
(2.8)
where a is the crack size, N is the number of cycles, t is time, and f is the frequency of loading.
This model was used first by Zhang et al. [25,26] for NNpH SCC crack growth modeling and it
seemed to fit some of their experimental results. However under more severe pressure
fluctuations it failed to be an appropriate model for crack growth in NNpH environments.
Further investigations also revealed that although cracks can initiate under static load, cracks
would stop growing when a monotonic load or mild load cycles are applied to the steel which
eventually result in crack bluntness [27].
Chen et al. [27] later showed that this model cannot fit their experimental results. Instead, they
proposed a corrosion fatigue model considering load interaction and environmental factors.
2.4.1.4 Corrosion Fatigue Model
In contrast to what is inferred from the name of NNpHSCC, cracks would stop growing under
static loads. Considering the fact that pipelines undergo different pressure fluctuations during
their service, a corrosion fatigue model which represents the synergistic interaction between the
environment and cyclic loads could be a more appropriate model for crack growth prediction.
This idea first was suggested and justified by Chen et al. [27]. They proposed that beyond the
dormancy point corrosion cannot be responsible for the growth of cracks and another mechanism
must become active. They could correlate very well their experimental results with a corrosion
fatigue model. Based on this model, crack growth can be correlated to a combined factor
incorporating both the mechanical driving forces and the environmental contribution:
21
(
) (
)
(2.9)
where ΔK is the change in stress intensity during cyclic loading, Kmax is the maximum stress
intensity, f is the loading frequency, a, n, α, β and γ are all constants, with α+β=1, and b is the
contribution of SCC, which was found to be about one order of magnitude lower than the first
term in Stage II crack growth and can be ignored. It is noteworthy that the effect of ΔK on crack
growth is associated with crack closure effects by changing R (ΔK) and the effect of Kmax
reflects the minimum stress intensity level that must be achieved at the crack tip for fatigue
damage to occur. The frequency term in the equation arises from the effect of environment on
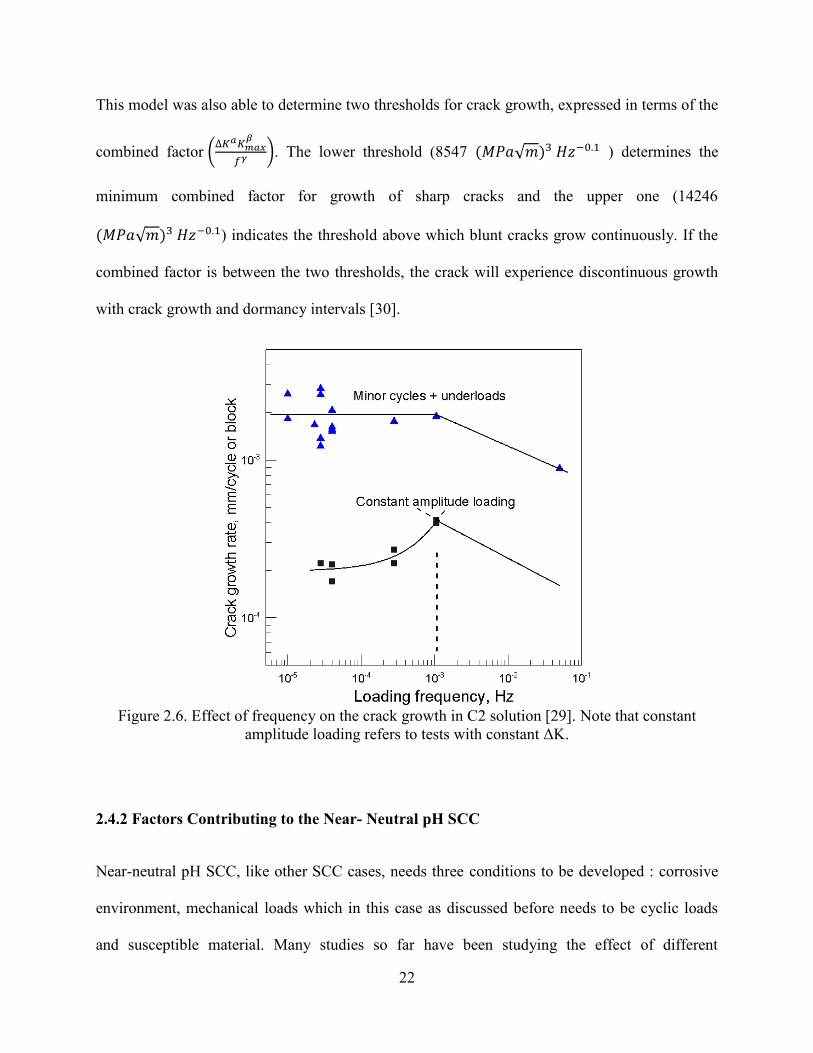
the crack growth and its final exponent was 0.1 in near-neutral pH environments. Considering
the fact that contribution of corrosion to the total growth (b) can be negligible, the effect of
frequency on the crack growth was found to originate from the contribution of hydrogen to the
crack growth. Based on equation (2.9), crack growth increases as the frequency of loading
condition decreases. With decreasing frequency, hydrogen atoms will have enough time to
diffuse to the high-stress zone ahead of the crack tip and contribute to crack growth. However, it
has been shown both experimentally and theoretically that there would be a point where
hydrogen saturation happens at the fracture zone ahead of the crack tip. It is assumed that the
crack growth reaches a maximum rate when the hydrogen concentration at the crack tip reaches
the saturation point. So, this frequency point is considered as the critical frequency, on the order
of 10-3
Hz in the laboratory tests. This frequency can change depending on the loading
conditions, temperature, mechanical properties of the steel and hydrogen diffusivity [28]. Figure
2.6 shows the effect of frequency on the crack growth obtained from laboratory tests using CT
specimens [29].
22
This model was also able to determine two thresholds for crack growth, expressed in terms of the
combined factor (
). The lower threshold (8547 √ ) determines the
minimum combined factor for growth of sharp cracks and the upper one (14246
√ ) indicates the threshold above which blunt cracks grow continuously. If the
combined factor is between the two thresholds, the crack will experience discontinuous growth
with crack growth and dormancy intervals [30].
Figure 2.6. Effect of frequency on the crack growth in C2 solution [29]. Note that constant
amplitude loading refers to tests with constant ΔK.
2.4.2 Factors Contributing to the Near- Neutral pH SCC
Near-neutral pH SCC, like other SCC cases, needs three conditions to be developed : corrosive
environment, mechanical loads which in this case as discussed before needs to be cyclic loads
and susceptible material. Many studies so far have been studying the effect of different
23
mechanical, metallurgical, and environmental factors on near-neutral pH SCC. In this section, an
overview of the work done to better understand the effect of these parameters on NNpH SCC is
provided.
2.4.2.1 Mechanical Factors
a) Loading Parameters
Williams et al. [31] used a fatigue machine with three-point bending configuration to study
surface crack growth during exposure of API X-60 steel samples to NS4 solution, which is a
solution simulating soil solution found in near-neutral pH SCC cases. They showed that the
majority of growth was on the surface and little growth was detected in the depth direction. This
is consistent with field findings as cracks have high length/depth ratio. In addition, their results
under variable amplitude cyclic loads also indicated that crack growth is accelerated on
subsequent cycles following an underload and this acceleration effect was attributed to reducing
crack closure on subsequent cycles because of the underload. The acceleration effect was found
to be more significant when there was an even distribution of underloads throughout the load
history compared to when they were grouped together in blocks.
Later on, Yu et al. [29] also confirmed the accelerated growth by application of under-load. They
performed a comparative crack propagation study on X60 pipeline steel in near-neutral pH
solution under both constant and variable amplitude loadings. Their findings suggested that
minor cycles with very high R-ratios that had been considered to be non-propagating based on
constant amplitude crack growth model can cause significant crack growth in the presence of
underloads. With the application of a spectrum consisting of underload and minor cycles crack
24
growth was found to increase by a factor of up to 10 when compared with constant amplitude
underloading without the inclusion of minor cycles in the low-frequency range.
Zhang et al. [32] used a three-point bending test system and found that the type of fracture
observed on the surface was strongly influenced by both frequency and R ratio. TGSCC was
found to be more pronounced at lower frequencies and higher R ratios while at higher
frequencies and lower R ratios, fracture surface features were rougher than the fatigue pre-
cracked surfaces which were attributed to corrosion fatigue. They also showed that for a given
ΔK, lower frequencies result in higher crack growth because a longer time was available for
environmental crack growth to take place during each cycle. They used the superposition model
to express the total environmental crack growth rate.
Beavers et al. [25] performed some experiment to find the effects of cyclic loading parameters
including frequency, R ratio and ΔK on the NNpH SCC crack growth. They concluded that
specific conditions of R and frequency determine whether cracks either continue to grow or
decelerate. They found that cracks tend to decelerate at high R and low frequency and finally
become dormant under this condition. In their experiment, dormancy could be prevented by
changes in environment or loading that sharpens the crack. For instance, low R values were
reported to sharpen cracks. They also claimed that a small number of low R cycles (e.g.,
complete depressurization) causes most of NNpH SCC damage on gas transmission lines.
In an effort by Beavers [24] to find the conditions favouring crack dormancy and re-initiation of
dormant cracks, he proposed that R ratio and frequency (which determine a critical crack tip
strain rate) can be employed to demarcate between dormancy and growth. He also showed that
unloading and re-loading cycles has a great contribution to the crack growth and can re-initiate
25
dormant cracks. Another factor which was determined in this study to help in re-initiation of
dormant cracks was increasing CO2 level in the solution. The role of CO2 in the crack growth is
mainly attributed to its effect on the production of hydrogen. So both hydrogen level and the
unloading can cause activation of dormant cracks.
b) Stress raisers
According to the National Energy Board of Canada, all their studied ruptures associated with
NNpH SCC were related to some kind of stress raiser [9]. Considering eleven ruptures they
reviewed, five of them happened near the long seam weld of the pipe, five were associated with
general corrosion (reduced wall thickness) and one initiated from a dent on the pipe surface.
Been et al. [33] considered the effect of dents on NN-pH SCC crack growth behaviour through a
combination of a corrosion fatigue model and an existing Dent Assessment Model (DAM).
Stresses were calculated around both constrained and unconstrained dents for 80% SMYS
(specified minimum yield strength) and for zero operating stress. The selected indent diameters
were 50, 100, and 200 mm and the results were presented for a X-65 pipe with a wall thickness
of 9.53 mm. Findings from the Dent Assessment Model showed that stress intensification was
higher for unconstrained dents than for restrained dents and lower ductility resulted in higher
local stresses at an unrestrained dent. These results combined with SCC model results revealed
that crack growth rate was higher for unconstrained dents and also crack growth was enhanced
by larger high-stressed areas as cracks slow when encountering lower stresses. They also
reported that materials with higher strength and lower ductility caused higher crack growth rates.
Brongers et al. [34] also demonstrated that dents promote SCC in both gas and liquid pipelines.
They reported that NNpH SCC is more prevalent at dents than high-pH SCC suggesting the
26
importance of stress raisers in this kind of cracking. They showed that cracking tended to occur
around the shoulder of a dent where metallurgical changes are minimal, but cyclic and maximum
stresses are high. In their investigation, most failures occurred in dents on the bottom of the pipe,
suggestive of rock dents.
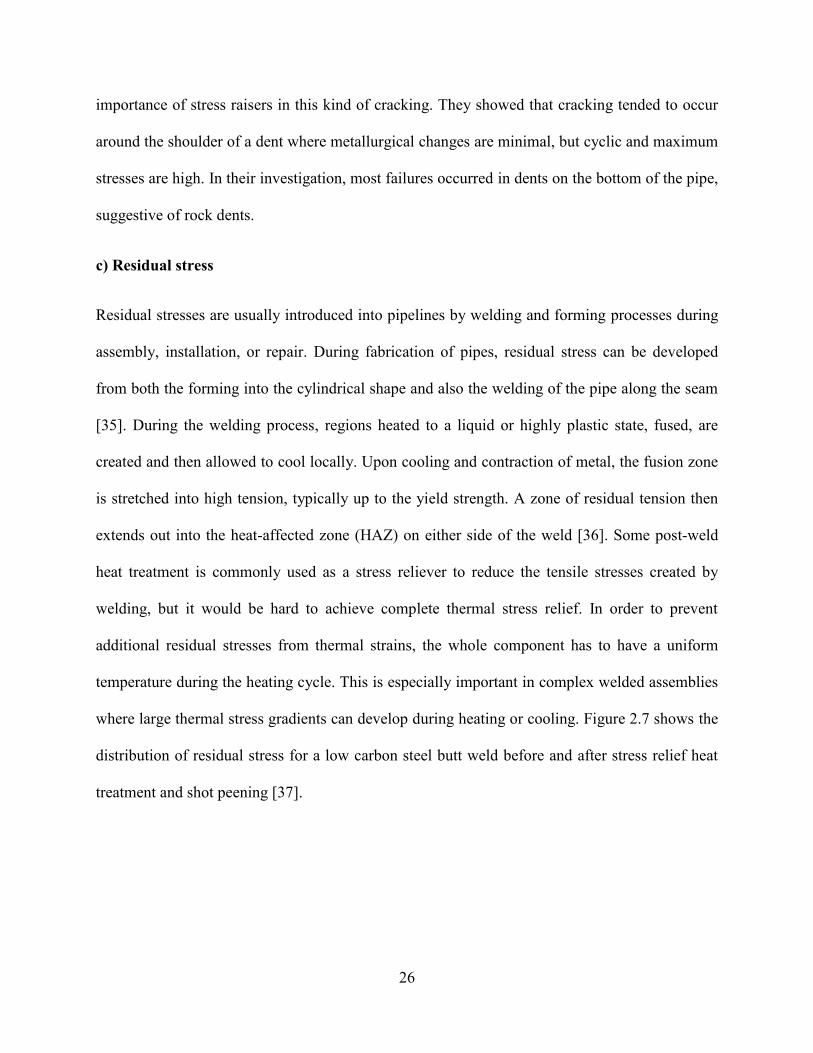
c) Residual stress
Residual stresses are usually introduced into pipelines by welding and forming processes during
assembly, installation, or repair. During fabrication of pipes, residual stress can be developed
from both the forming into the cylindrical shape and also the welding of the pipe along the seam
[35]. During the welding process, regions heated to a liquid or highly plastic state, fused, are
created and then allowed to cool locally. Upon cooling and contraction of metal, the fusion zone
is stretched into high tension, typically up to the yield strength. A zone of residual tension then
extends out into the heat-affected zone (HAZ) on either side of the weld [36]. Some post-weld
heat treatment is commonly used as a stress reliever to reduce the tensile stresses created by
welding, but it would be hard to achieve complete thermal stress relief. In order to prevent
additional residual stresses from thermal strains, the whole component has to have a uniform
temperature during the heating cycle. This is especially important in complex welded assemblies
where large thermal stress gradients can develop during heating or cooling. Figure 2.7 shows the
distribution of residual stress for a low carbon steel butt weld before and after stress relief heat
treatment and shot peening [37].
27
Figure 2.7. Distribution of residual stress for a low carbon steel butt weld before and after stress
relief heat treatment and shot peening [37].
Since fatigue and SCC initiate at the surface, residual stresses would have a significant influence
on their initiation. It has been reported that there is a correlation between residual stresses and
locations of line pipe SCC [38]. Beavers et al. [39] showed that the residual stresses at SCC
colonies could be as high as 216 MPa, which is almost twice as high as residual stresses in areas
that did not show signs of cracking. Since the effect of residual stress is mainly important during
the crack initiation process and one focus of this research is on the crack initiation in NNpH
environment, its effect will be addressed in more detail in a separate section under crack
initiation.
28
d) Hydrostatic testing
Hydrostatic testing is used as both a test for the structural integrity of new pipelines before they
are used and also a tool for SCC management. It is usually performed by filling the pipeline with
water and increasing the pressure to pressure levels exceeding the operating pressure of the
pipeline. The highest pressures during the hydrostatic test can vary from 100 to 110% of the
specified minimum yield strength (SMYS) depending on pipeline condition. Pressure is kept at
this level for a short period to ensure the strength of pipeline. Next pressure is lowered to about
90% SMYS and is kept at that pressure for a longer period of time with the purpose of detecting
possible leaks [40]. Hydrostatic testing is repeated every several years to ensure that the pipeline
would be safe for operation in the following years. In general, hydrostatic testing is a
straightforward and effective way for removing defects that exceed their critical size for the
hydrotest pressure and has been used by the oil and gas pipeline industry for the past decades
[41]. It is also believed that hydrostatic testing can retard the growth of surviving cracks in the
pipelines for a temporary period [42]. For instance, Zheng et al. [43] studied the effect of
hydrostatic testing on the crack growth of several X-52 pipes with some SCC cracks. In their
work, a saw tooth load spectrum with a maximum load equal to 95% yield and R=0.8 was
applied to the pipes for 42 days prior to hydrostatic testing and crack growth was then measured.
For the first Hydrotest, the pressure of pipes was dropped to zero and then increased in steps up
to 108% yield. The hold time for each pressure level up to 108% yield was varied from 2 to 20
min and the hold time at maximum pressure during hydrotest was one hour. After hystrotest the
same previous load spectrum was continued and SCC was monitored for 57 days. The results
showed that before hydrotest the highest SCC growth among different cracks was about 0.88 mm
per year and the growth rate of the same crack after hydrotest was about 0.37 mm per year. All
29
other cracks studied in this research were reported to show different degrees of crack retardation
after hydrotest. Cross section examination of pipe samples after the test showed that during
hydrotest, ductile crack growth on a plane about 45 degrees from the original plane with the
formation of some very small microvoids. These researchers attributed the retarding effect of
hydrotesting on SCC growth to the creation of compressive residual stress in front of crack tip
rather than crack tip blunting because for most of the cracks they remained sharp after the
hydrotest. Crack growth retardation effect of hydrostatic for a short period of time after the test
has been confirmed by other researchers as well. They also reported that the level of reduction
depended on the magnitude of cyclic loading, with a greater reduction for more mild cyclic
loads. Another important observation in this study was that crack growth only was observed in
solution, but not in the air during simulated hydrotest indicating the role of environment in the
cracking during hydrotest [43].
In another research which focused on the crack growth during simulated hydrostatic test, it was
found that crack growth during hydrotest is mainly driven through the internal-hydrogen-assisted
cracking mechanism, instead of the hydrogen environmental-assisted cracking mechanism. In
order to reduce crack growth during hydrotest, they also suggested producing plastic deformation
at the crack tip by room temperature creep prior to the hydrotest. Their results also showed that
increasing loading rate generally decreases crack growth by hydrostatic loading [44].
2.4.2.2 Metallurgical (Materials) Factors
a) Microstructure
It has been reported that all types of pipeline steels showed some degree of susceptibility to near-
neutral pH SCC [9]. However, the general idea is that modern steels seem to be less susceptible
30
than older ferrite-pearlite steels. For instance, Kushida et al. [45] studied susceptibility of
different microstructures using notched samples and cyclic loads in NS4 solution. The
susceptibility was assessed based on the lower notch depth in which cracking occurred. They
found that uniform microstructures of bainitic ferrite or bainite were more resistant to SCC than
mixed microstructures of ferrite and pearlite. In another effort to compare the susceptibility of
different microstructures using slow strain rate tests (SSRT) in NS4 solution, it was found that
acicular and polygonal ferrite when compared to pearlite-free acicular ferrite and pearlite- ferrite
microstructures had the highest susceptibility to NNpH SCC [46].
In another study, Gonzalez-Rodriguez et al. [47] investigated the effect of different heat-
treatments and microstructures on the SCC susceptibility of X-80 pipeline steel using SSRT.
They found that the order of susceptibility would be martensite > acicular ferrite> incompletely
transformed pearlite in ferrite matrix obtained by water-sprayed cooling>ferrite-pearlite banded.
Overall, it appears that experimental comparisons of the behaviour of different steels exhibit no
systematic effect of steel microstructure on cracking but non-uniformity in the microstructure
could make the steel more susceptible.
Besides the type of microstructure, inclusions also influence on the susceptibility of pipelines to
NNpH SCC but since their effect is more pronounced during initiation stage, it will be discussed
in the crack initiation section.
2.4.2.3 Environmental Factors
When cathodic protection is shielded by the disbonded coating and no significant cathodic
protection reaches the pipeline, the presence of some CO2 in the soil would be enough to keep
the pH within the near-neutral range. The normal CO2 partial pressures existing in the soil
31
around pipelines will cause the pH to remain in the range of 6-7. The situation would be different
if an appreciable amount of cathodic potential reached the pipe which would be the case in
coatings that doesn‟t shield cathodic protection. In this situation, hydrolysis of water by the
electrons provided by the cathodic protection and production of would raise the pH of the
solution to about 10, if no significant level of CO2 is present in the soil and no NNpH SCC
occurs.
Therefore, considering that near-neutral pH SCC was found to mostly occur at (or within 10-20
mV) of the corrosion potential of the pipeline, the presence of limited CP level and continuous
supply of CO2 are known to be essential for this kind of cracking. Hydrogen whose effect
originates from the presence of CO2 is also proved to play an important role in cracking
especially in the growth of long cracks. In this section, the effect of these parameters and also
other environmental factors on NNpH SCC will be discussed based on the literature.
Before reviewing environmental factors contributing to NNpH SCC, it is good to describe some
solutions that normally are used in laboratory experiments to simulate soil solutions around
pipelines where NNpH SCC had been found. Table 1 lists the chemical composition of these
simulated soil solutions. These simulated soil solutions are quite reliable in terms of simulating
near-neutral pH SCC soil conditions.
32
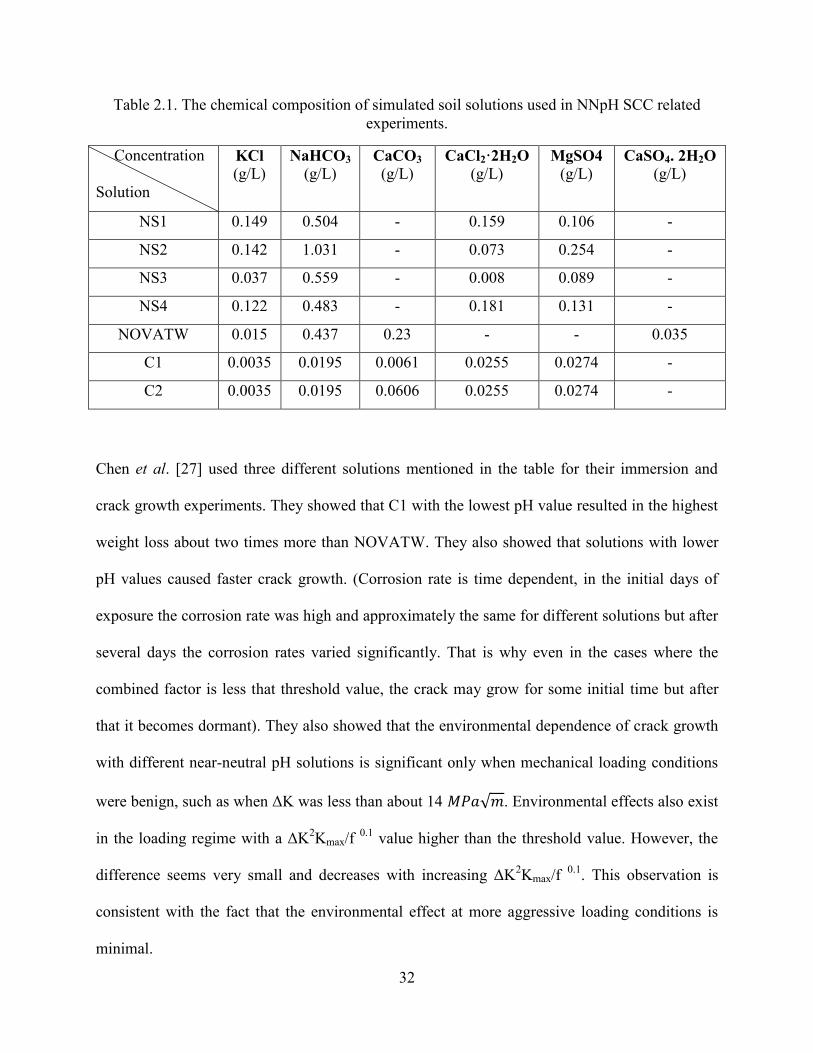
Table 2.1. The chemical composition of simulated soil solutions used in NNpH SCC related
experiments.
Concentration
Solution
KCl (g/L)
NaHCO3 (g/L)
CaCO3
(g/L) CaCl2·2H2O
(g/L) MgSO4
(g/L) CaSO4. 2H2O
(g/L)
NS1 0.149 0.504 - 0.159 0.106 -
NS2 0.142 1.031 - 0.073 0.254 -
NS3 0.037 0.559 - 0.008 0.089 -
NS4 0.122 0.483 - 0.181 0.131 -
NOVATW 0.015 0.437 0.23 - - 0.035
C1 0.0035 0.0195 0.0061 0.0255 0.0274 -
C2 0.0035 0.0195 0.0606 0.0255 0.0274 -
Chen et al. [27] used three different solutions mentioned in the table for their immersion and
crack growth experiments. They showed that C1 with the lowest pH value resulted in the highest
weight loss about two times more than NOVATW. They also showed that solutions with lower
pH values caused faster crack growth. (Corrosion rate is time dependent, in the initial days of
exposure the corrosion rate was high and approximately the same for different solutions but after
several days the corrosion rates varied significantly. That is why even in the cases where the
combined factor is less that threshold value, the crack may grow for some initial time but after
that it becomes dormant). They also showed that the environmental dependence of crack growth
with different near-neutral pH solutions is significant only when mechanical loading conditions
were benign, such as when ΔK was less than about 14 √ . Environmental effects also exist
in the loading regime with a ΔK2Kmax/f
0.1 value higher than the threshold value. However, the
difference seems very small and decreases with increasing ΔK2Kmax/f
0.1. This observation is
consistent with the fact that the environmental effect at more aggressive loading conditions is
minimal.
33
The threshold value of ΔK2Kmax/f
0.1 is environmentally dependent and could be material
sensitive, as well (different materials have different α value). The threshold is higher for
NOVATW. This agrees with the fact that NOVATW is less corrosive in terms of the corrosion
rate determined by weight loss.
a) Effect of CO2
Parkins et al. [15] investigated the role of CO2 on SCC susceptibility using SSRT tests and they
showed that CO2 played an important role in the TGSCC of an X-65 steel. The ductility was
shown to reduce significantly by increasing CO2 into the solutions. In the presence of 100% CO2
(pH 5.8), they reported that more cracks initiated beyond the necking area. Since in all their
studies, cases where significant cracking happened beyond the necking point, hydrogen
production was thermodynamically possible, the role of CO2 was attributed to lowering pH to
facilitate H formation.
Gu et al. [48] using SSRT tests also reported that the addition of CO2 into the NS4 solution
increased SCC susceptibility of X-80 and X-52 pipelines, but they observed no difference
between 5% CO2 (pH 6.8) and 100% CO2 (pH 5.4). This is consistent with the new findings that
increasing CO2 concentration does not necessarily increase the hydrogen ingress into steels
because of formation of a thick corrosion product layer at higher CO2 concentrations [49]. In the
same study, it was reported that at a cathodic potential of -1.0 V (SCE), the addition of CO2 had
no effect on the SCC susceptibility. This suggests that at this and more negative potentials, the
mechanism of cracking changes completely to hydrogen embitterment such that the addition of
CO2 and its contribution to hydrogen production would be negligible. In another study which
used cyclic load condition instead of SSRT under different concentrations of CO2, it was
34
reported that crack growth rate increased with increasing the CO2 pressure from 0% to 5% and
then to 15%. However, the difference in crack growth rate between 5% and 15% was minimal
compared to the difference between 0% and 5% CO2 [50].
It can be concluded that although the presence of CO2 is important, its concentration does not
necessarily play an important role in the overall crack growth.
b) Effect of steel potential
The fact that field observations show that 87% of NNpH SCC cases occur in pipelines with
polyethylene coatings [15], which are known to significantly shield cathodic potentials and
reduce the amount of cathodic protection current reaching the pipe surface [51], brings the
conclusion that NNpH SCC is prevalent where no or limited cathode potential reaches the pipe.
This is reasonable as with the normal CO2 levels present in the soil solution, higher CP levels
would increase the pH of soil to high pH levels and the high pH environment promoting classical
SCC is developed instead.
On the other hand, it has been shown that high levels of cathodic potential can change the
mechanism of cracking. For instance, Gu et al. [48] studied TGSCC in X-80 and X-52 steels
using SSRT and showed that TGSCC was the highest around the Ecorr (-750 mV SCE) and at low
enough cathodic potentials (-1 V(SCE)) cracking was controlled by hydrogen induced cracking
(HIC). They also showed that at higher noble potentials, in the anodic region, SCC intensity
decreased significantly because of higher general corrosion rate and the occurrence of ductile
fracture before corrosion reactions occurred.
In a similar work performed by Yamaguchi et al. [52], a threshold value for hydrogen
concentration was determined, above which the mechanism of cracking is SCC and below which
35
the cracking is controlled by HIC. Using SSRT, they found that significant loss in the ductility of
steel happened only when hydrogen concentration was above 10 ppb, which corresponds to a
cathodic potential of -1 V (SCE).
So when considering the range of cathodic potential within which NNpH SCC occurs, two points
should be considered : (1) effect of cathodic potential on the pH of the solution and (2) its effect
on the mechanism of cracking. Most of the laboratory experiments which considered high
cathodic potentials in their tests, especially SSRT, did not necessarily produce NNpH SCC.
Instead, the mechanism of cracking was HIC.
c) Effect of Hydrogen
Besides the effect of CO2 on maintaining the soil pH in the near-neutral range, it plays an
important role in the generation of hydrogen on the pipeline surface as well. Gaseous carbon
dioxide dissolves in water to form carbonic acid, in the following reaction:
→ (2.10)
Carbonic acid is further reduced by electrons either from corrosion of steel or cathodic protection
and generates atomic hydrogen which is adsorbed on the pipeline surface.
𝑒
→ (2.11)
The resulting bicarbonate ions are also further reduced to produce carbonate ions and adsorbed
hydrogen atoms.
→
(2.12)
Part of adsorbed hydrogen atoms on the pipeline surface will undergo an absorption reaction into
the material and then diffuse to high-stress regions inside the metal; whereas, the remaining
36
hydrogen recombines to form gaseous hydrogen molecules. The adsorbed hydrogen produced by
the above reaction is known to have a significant effect on the rate of crack propagation and also
in changing a dormant crack to a propagating one [53]. Qiao et al. [54] were able to prove
experimentally through SIMS (Secondary Ions Mass spectroscopy) that hydrogen enrichment
occurs around the notch tip in X-52 and X-80 pipelines exposed to the dilute bicarbonate
solutions. They showed that this enrichment increases with decreasing pH, more negative
potentials and stress intensity factor. The later was shown to have a very significant effect.
Usually, three mechanisms are used to describe how hydrogen contributes to cracking in metals.
In the following section, a brief description of these mechanisms and how they can be used in
explaining NNpH SCC is provided.
I) Hydrogen Induced Decohesion Model (HIDM)
This model is a well-known model for the hydrogen embrittlement mechanism and it first was
suggested by Troiano [55-56]. It states that dissolved hydrogen accumulates in regions of the
high tri-axial stress plastic zone in the lattice and will act to reduce the cohesive strength of
interatomic metal bonds. This promotes nucleation of microcracks within the plastic enclave.
This model is usually used to explain crack growth under the hydrogen containing environments.
As shown in Figure 2.8, hydrogen damage sites are located at a distance ahead of the crack tip
where maximum hydrostatic tensile stresses exist. When hydrogen reaches a critical level
microcracks are formed due to lowered cohesive strength and then joins the main crack tip and
cause a crack to propagate. The crack propagation is discontinuous and controlled by hydrogen
diffusion near the crack tip; therefore further crack growth needs diffusion of hydrogen to the
region of high stress. This model has been widely used in support of crack propagation in
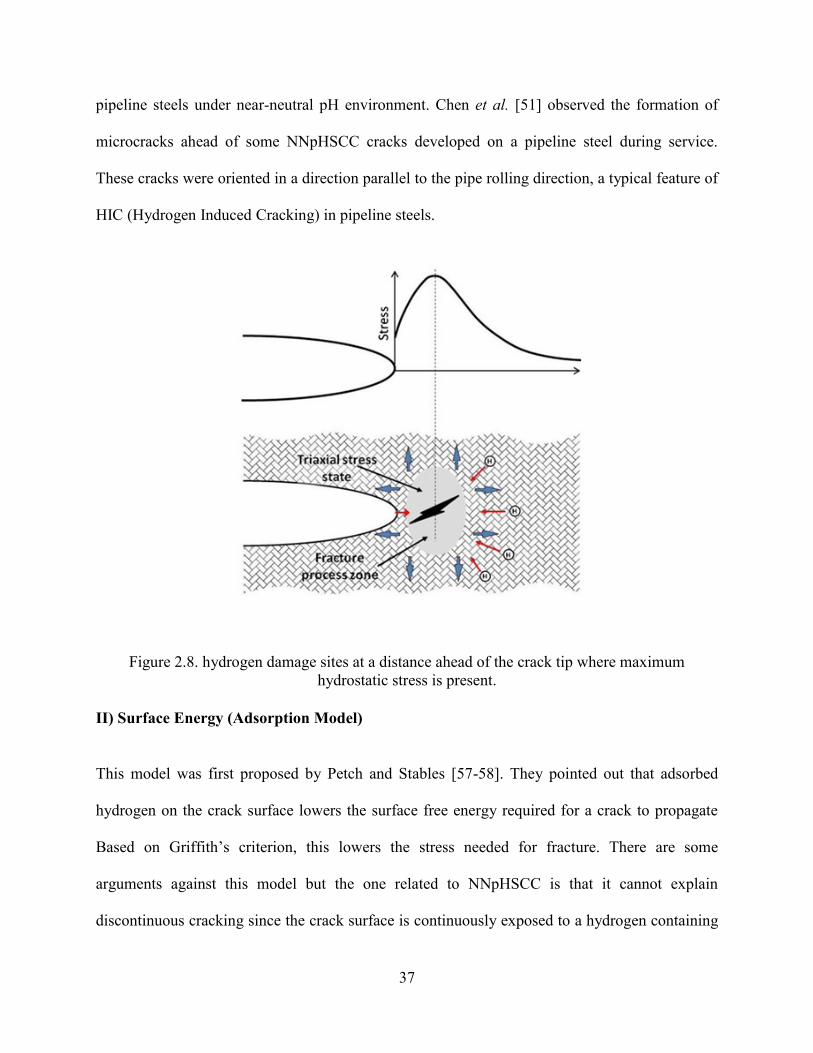
37
pipeline steels under near-neutral pH environment. Chen et al. [51] observed the formation of
microcracks ahead of some NNpHSCC cracks developed on a pipeline steel during service.
These cracks were oriented in a direction parallel to the pipe rolling direction, a typical feature of
HIC (Hydrogen Induced Cracking) in pipeline steels.
Figure 2.8. hydrogen damage sites at a distance ahead of the crack tip where maximum
hydrostatic stress is present.
II) Surface Energy (Adsorption Model)
This model was first proposed by Petch and Stables [57-58]. They pointed out that adsorbed
hydrogen on the crack surface lowers the surface free energy required for a crack to propagate
Based on Griffith‟s criterion, this lowers the stress needed for fracture. There are some
arguments against this model but the one related to NNpHSCC is that it cannot explain
discontinuous cracking since the crack surface is continuously exposed to a hydrogen containing
38
environment. It is believed that crack growth in the near-neutral pH environment is not a
continuous process but it is accompanied by repeated cycles of dormancy and active growth [59].
Also in the same work, it was shown that hydrogen produced at the crack tip is secondary in
terms of crack growth compared to hydrogen diffused to the crack tip from the surface, so this
suggests that this model may not be applied for NNpH SCC alone. Oriani [60] also stated that the
surface adsorption model cannot be considered as a separate mechanism and it would be
applicable to any mechanism involving the breaking of interatomic bonds.
III) Hydrogen Enhanced Localized Plasticity (HELP)
In many cases, hydrogen embrittlement is characterized as a brittle fracture because of loss of
macroscopic ductility (for example decrease in reduction of area), but high resolution
fractography of the fracture surface reveal that hydrogen embrittlement is associated with locally
enhanced plasticity at the crack tip. [61-62]. Beachem first suggested enhanced ductile processes
due to hydrogen interaction [53]. According to him, enough dissolved hydrogen ahead of a crack
tip aids whatever deformation process the microstructure permits. Later Birnbaum [63]
developed the theory and suggested that internal hydrogen increases ease of dislocation motion
and generation, therefore causes localized plastic deformation. He also pointed out that the
increased dislocation motion itself accelerates hydrogen transport which helps in continuous
localized plasticity.
In pipelines, especially oil pipelines which undergo more severe cyclic stress during their service
life, corrosion fatigue is proposed to be the main mechanism for crack propagation of NNpH
SCC [27, 64]. Based on the role of hydrogen in easing dislocation motion and decreasing
39
cohesive strength between bonds, the combined effect of hydrogen and fatigue can be used to
describe crack growth in NNpH SCC.
d) Effect of other species inside the soil
Presence of hydrogen sulphide and generally sulphide has been shown to increase crack growth
in the NNpH environment. It has been reported that presence of H2S resulted in a factor of 5-10
greater crack advance. This effect of sulphide can be attributed to both anodic dissolution and H
corrosion contributions [65].
2.4.3 Laboratory Experiments on Crack Initiation on Pipelines
Since the first rupture of pipelines by NNpH SCC in the 1980s, many investigations tried to
reproduce similar cracks in the laboratory. Initial attempts mostly used SSRT to find the effect of
environmental and microstructure parameters on NNpH SCC. In SSRT, the susceptibility to
NNpH SCC is determined based on the percentage of the reduction in area (RA%). When
comparing different environments and microstructures, the higher RA% means more resistance
to cracking. Liu et al. [66] investigated different microstructures obtained after heat treatment of
X-70 pipeline steel in an extracted Chinese soil solution and their SSR tests showed that
quenched pipeline steel with hard bainite microstructure was more susceptible to SCC than the
as-received and normalized steel with ferrite microstructure. Another investigation on heat
treated [67] X-70 pipeline steel showed that quenched X-70 pipeline steel had greater
susceptibility to NNpH SCC than the as-received one. The quenched steel had a martensitic
microstructure with colonies of pearlite and the microstructure of the as-received steel mainly
consisted of bands of ferrite alternated with bands of cementite.
40
SSRT can also give some good information about nucleation sites of NNpH SCC. As an
example, Kuniya et al. [68] used SSRT in a water environment for four different steel with
Sulphur contents varying from 0.004wt% to 0.016wt%. They suggested that presence of MnS
inclusions whose formation probability increased with S content facilitate SCC initiation. Based
on their results, higher levels of S resulted in elongated inclusions, whereas inclusions tend to be
spherical at lower levels of Sulphur. They showed that dissolution of elongated inclusions can
produce cavities that can cause further cracking. Besides the effect of MnS inclusions on NNpH
SCC initiation, which has been proved by other researchers [69-70], Al-containing inclusions
were also found to contribute to NNpH SCC cracking under cathodic potentials [66]. However,
Si inclusions were shown to have no effect on the cracking. They also indicated that both slightly
anodic (-0.65 VSCE) and cathodic potentials (-0.85 and -1.20 VSCE) during the test and found
that no cracking occurred under anodic potentials which indicates the essential role of hydrogen
in this kind of cracking.
Although SSRT gives quick results, it employs very aggressive loading condition, during which
the real effect of environment cannot be realized. Therefore, NNpH SCC studies under cyclic
loading are considered more realistic both in terms of loading condition that pipelines usually
encounter during their operation and also in displaying real effect of the environment.
Wang et al. in 1998 were first to try produce cracks on polished tensile specimens in NS4
solution using cyclic loads although they used aggressive loading cycles with R=0.4 and
frequency of 1 Hz which is far from real pressure fluctuations that pipelines usually undergo.
They found that pits produced from inclusions, geometrical discontinuities and locations with
localized plastic deformation caused by cyclic loading were preferred sites for crack initiations.
In their research, cracks of similar size exhibited different growth rates so no correlation could be
41
found for the growth of short cracks. They also found that time and stress range rather than
maximum stress are important factors which enhance crack initiation [71-72].
Puiggali et al. [73] also used cyclic loading (90% YS, R = 0.6 and frequency of 2.9 x 10⁻⁴
Hz) to
investigate the effect of CP on the NNpH SCC. Their experiment in NS4 solution suggested that
not only dissolution because of poor CP can produce NNpH SCC cracks but also changing from
underprotection (OCP) to protection level (-0.95 VSCE) and/or overprotection (-1.15 VSCE)
during cyclic loading even facilitates more crack initiation by producing more hydrogen on the
steel surface.
Senigallia et al.‟s [74] work in 1999 used loading cycles with R=0.78 and maximum stress equal
to 90% of real yield stress at two frequency values (high and low). Cracks with the depth of 2-70
microns were initiated in as few as 30 days under a realistic condition of cyclic load ratios and
frequency. These cracks were mostly initiated from pits or corroded areas. Although they
showed crack initiation is easy under the right combination of loading cycles and environment,
they failed to consider the growth of very short cracks.
Parkins et al.‟s work [15] was among those works which could successfully reproduce cracks on
X-65 in NS4 solution using a more realistic loading condition as in the field. They showed that
formation of corrosion pits was a pre-requisite step for crack initiation in the near-neutral pH
environment. They also reported that crack initiation is facilitated by increasing maximum
applied stress.
Fang et al. [75] used either static load or cyclic loads during long-term tests and showed that
constant loads up to 87% of YS do not lead to cracks during long-term testing of X-70 steel. But
higher loads caused straight NNpH SCC cracks. They also showed that under cyclic loading
42
SCC cracks appeared on X-70 samples within limited test duration comparing to constant load
tests. Cyclic loading can facilitate near-neutral pH SCC by enhancing micro-deformation and
promoting crack tip local strain rate.
Guo et al. [76] used mixed mode cyclic loading (tensile stress plus shear stress) to study the NN
pH SCC cracking in X-70 steel. They found that shear stress enhances crack propagation
comparing to pure tensile stresses. They also found that under mode I cyclic loading the
produced cracks are straight, perpendicular to tensile axis while under mixed mode loading
cracks grow in a sinusoidal shape and the chances of interaction between two cracks increases.
Residual stress measurements in various pipes from service have shown that tensile stresses in
the range of 20% SMYS are often found to exist at the surface to a depth of about 1 mm [77]. So
the selection of a higher maximum stress level than normal maximum pressures in the field is
usually explained by consideration of residual stresses in the total stresses contributing to the
crack initiation. But in reality, residual stresses are not uniformly distributed and of the same
sign over the surface of the pipe. For example, residual stresses produced by the welding process
are tensile in the weld and HAZ region but compressive in the base metal a little distance away
from the weld. The presence of both compressive and tensile residual stresses close to each
other can cause galvanic corrosion which enhances crack initiation and growth. Boven et al. [78]
studied the effect of residual stress on NNpH SCC initiation and early growth by using
specimens cut from circumferential direction of pipes and then flattened to produce large
residual stress gradient on the samples. Figure 2.8 shows the frequency of cracking occurrence
with respect to residual stress levels in their specimens. Crack initiation occurrence was found to
be maximum when the surface tensile residual stress was in the range of 150–200 MPa. Unlike
other crack initiation studies, early crack growth rates found in this work were comparable to the
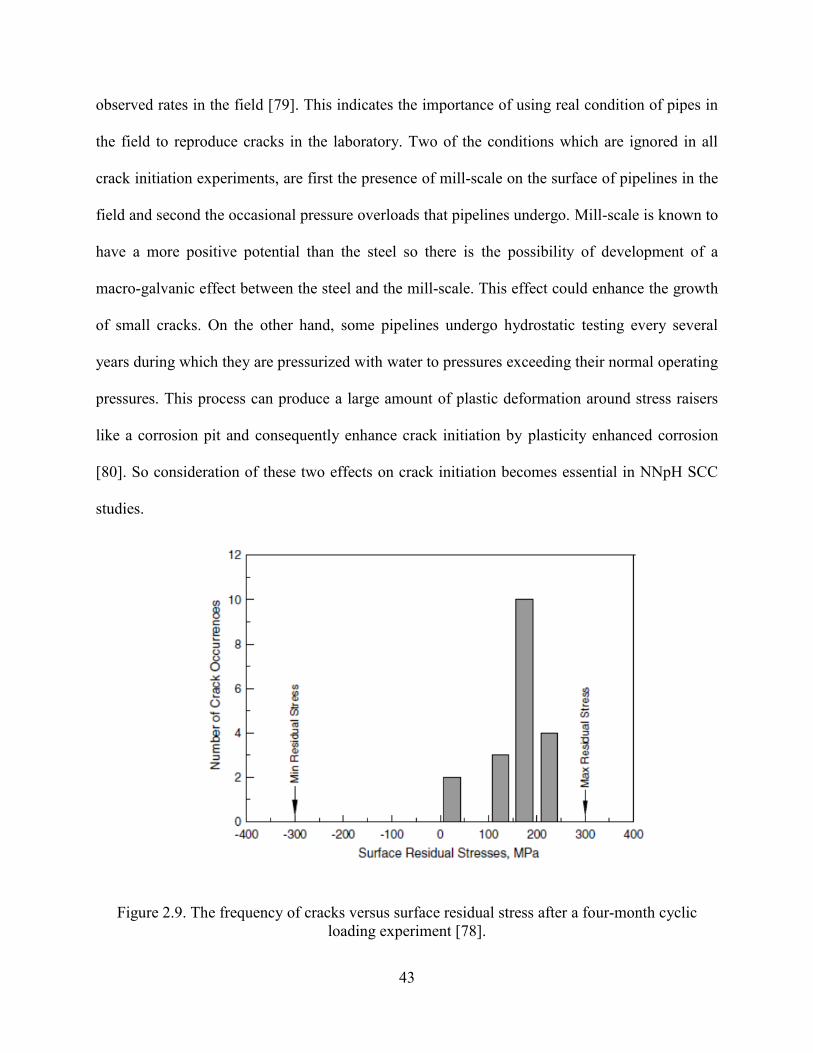
43
observed rates in the field [79]. This indicates the importance of using real condition of pipes in
the field to reproduce cracks in the laboratory. Two of the conditions which are ignored in all
crack initiation experiments, are first the presence of mill-scale on the surface of pipelines in the
field and second the occasional pressure overloads that pipelines undergo. Mill-scale is known to
have a more positive potential than the steel so there is the possibility of development of a
macro-galvanic effect between the steel and the mill-scale. This effect could enhance the growth
of small cracks. On the other hand, some pipelines undergo hydrostatic testing every several
years during which they are pressurized with water to pressures exceeding their normal operating
pressures. This process can produce a large amount of plastic deformation around stress raisers
like a corrosion pit and consequently enhance crack initiation by plasticity enhanced corrosion
[80]. So consideration of these two effects on crack initiation becomes essential in NNpH SCC
studies.
Figure 2.9. The frequency of cracks versus surface residual stress after a four-month cyclic
loading experiment [78].
44
Another parameter whose effect on NNpH SCC cracking is well known among researchers is
hydrogen. Although extensive work has been done to study the effect of this parameter, no study
so far considered the real condition of pipelines under disbonded coating in their studies.
Immersion corrosion and EIS studies have shown that presence of a disbondment can alter
environmental conditions and corrosion scenarios when compared to the condition without a
disbondment [69,81]. Now a question is raised; how can these changes affect hydrogen
generation on and ingress into the steel?
To answer this question and find the importance of considering pipeline real conditions in crack
initiation experiments, this study was divided into two stages, the objectives of which are
described in the next section.
2.5 Research Objectives
1) The first stage of the research attempts to study hydrogen permeation behaviour in pipeline
steel under a simulated coating disbondment. The goal in this stage of the research is to find
out how a coating disbondment on pipelines can influence hydrogen generation and ingress
into pipeline steels. The effect of different parameters including cathodic protection,
disbondment gap size and different concentrations of CO2 on the latter are also investigated.
2) In the second stage of the research, the objective is to find the effect of two conditions,
which pipelines in the field are exposed to but are usually ignored in all NNpH SCC
initiation studies in the laboratory, on the crack initiation in the near-neutral pH
environment. The goal is to discover the influence of occasional over-load cycles, known as
the hydrostatic testing, and mill-scale on the corrosion and, consequently, initiation of
NNpH SCC cracks. The findings of this research will provide a better understanding of the
cracking initiation process in the field.
45
References
[1] http://www.cepa.com/about-pipelines/why-pipelines
[2] https://www.neb-one.gc.ca/sftnvrnmnt/sft/pplnrptr/index-eng.html
[3] D.A. Jones, Principles and Prevention of Corrosion, Upper Saddle River, NJ: Prentice Hal,
1996.
[4] J. R. Davis, Corrosion: Understanding the Basics, ASM International Publication, Materials
Park Ohio, 2000, p.416.
[5] E. S. Menon, Transmission Pipeline Calculations and Simulations Manual, Gulf Professional
Publishing, USA, 2014, p.84.
[6] Final Staff Report on Investigation of Tennessee Gas Transmission Company Pipeline No.
100-1 near Natchitoches, Louisiana, March 1965, Docket No. CP65-267, Federal Power
Commission, Bureau of Natural Gas, Washington, D.C., 1965.
[7] B. Delanty and J.O'Beirne, Major Field Study Compares Pipeline SCC with Coatings, Oil
and Gas Journal, Jun (1992), p.39.
[8] R.N. Parkins, Environment sensitive cracking (low pH SCC) of high-pressure pipelines,
AGA NG-18 report No. 191, AGA catalog No. 51623, 1990.
[9] National Energy Board, Public Enquiry Concerning Stress Corrosion Cracking on Canadian
Oil and Gas Pipelines, report # MH-2-95, 1996.
[10] R.N. Parkins, A review of stress corrosion cracking of high pressure pipelines, Corrosion
2000, Paper No. 00363.
[11] B.Y. Fang, A. Atrens, J.Q. Wang, E.H. Han, Z.Y. Zhu and W. Ke, Review of stress
corrosion cracking of pipeline steels in “low” and “high” pH solutions, J. Mater. Sci.
(2003), p. 127-132.
[12] G. H. Koch, J. A. Beavers, and W. E. Berry, Effect of Temperature on Stress-Corrosion
Cracking of Pre-cracked Pipeline Steels, NG-18 Report No. 148, American Gas
Association, Arlington, VA, 1985, Catalog No. L51491.
[13] F. Song , Overall Mechanisms of High pH and Near-Neutral pH SCC, Models for
Forecasting SCC Susceptible Locations, and Simple Algorithms for Predicting High pH
SCC Crack Growth Rates, NACE 2008, Paper No. 8129.
[14] J. A. Beavers, Integrity Management of Natural Gas and Petroleum Pipelines Subject to
Stress corrosion Cracking, Corrosion 70(1), p.3.
46
[15] R. N. Parkins, W. K. J. Blanchard, and B. S. Delanty, Transgranular Stress Corrosion
Cracking of High-Pressure Pipelines in Contact with Solutions of Near Neutral pH,
Corrosion 50 (5), p. 394-408.
[16] R.N. Parkins and J.A. Beavers, Some Effects of Strain Rate on the Transgranular Stress
Corrosion Cracking of Ferritic Steels in Dilute Near-Neutral-pH Solutions, Corrosion 59
(3), p. 258-273.
[17] J. Zhao, W. Chen, M. Yu, K. Chevil, R. Eadie, G. Van Boven, R. Kania, J. Been, S. Keane,
Crack growth modelling and life prediction of pipeline steels exposed to near-neutral pH
envrionments. Part I: Dissolution crack growth and occurrence of crack dormancy in stage
I. Metallurgical and Materials Transactions A, under consideration.
[18] M.J. Wilmott, R.L. Sutherby, The role of pressure and pressure fluctuations in the growth of
stress corrosion cracks in line pipe steel, Proceeding of 2nd International Pipeline
Conference Vol.1, ASME, New York, 1998, p. 409-421.
[19] W. Chen, An overview of near-neutral pH SCC in pipelines and mitigation strategies for its
initiation and growth, Corrosion 72 (7), p. 962-977.
[20] W. Zhang, F.A. Macleod, R.W. Revie, W.R. Tyson, G. Shen, D. Kiff, M. Skaff, E.W.
Wong, Recent progress in the study of transgranualr SCC in line pipe steels, Corrosion-
Deformation Interactions CDI 96, Editor: T. Magnin, The Institute of Materials publisher,
London, 1996.
[21] S.X. Mao, B. Gu, N. Q. Wu and L. Qiao, The mechanism of hydrogen-facilitated anodic-
dissolution-type stress corrosion cracking: theories and experiments, Philosophical
Magazine A 81(7), p. 1813-1831.
[22] B.T. Lu, L.J. Qiao, J.L. Luo, K.W. Gao, Role of hydrogen in stress corrosion cracking of
austenitic stainless steels. Philosophical Magazine, 91, p.208–228.
[23]. B.T. Lu, J.L. Luo, P.R. Norton, H.Y. Ma, Effects of dissolved hydrogen and elastic and
plastic deformation on active dissolution of pipeline steel in anaerobic groundwater of
near-neutral pH, Acta Materialia 57, p. 41–44.
[24] J. A. Beavers, "Near-neutral pH SCC: Dormancy and re-initiation of stress corrosion
cracks", Final Report for Gas Research Institute, GRI-05/0009, GRI, Des Plaines, IL, USA,
2004.
47
[25] J.A. Beavers, and C.E. Jaske, Effects of Pressure Fluctuations on SCC Propagation, Final
report to PRCI, Project PR 186-9706, Cat. No. L51872, 2002.
[26] X.Y. Zhang, S.B. Lambert, R. Sutherby, A. Plumtree, Transgranular Stress Corrosion
Cracking of X-60 Pipeline Steel in Simulated Ground Water, Corrosion 55 (3), pp. 297-
305.
[27] W. Chen and R. L. Sutherby, Crack Growth Behavior of Pipeline Steel in Near-Neutral pH
Soil Environments, Metallurgical and Materials Transactions A, 38A, p. 1260-1268.
[28] X. Xing, W. Chen, H. Zhang, Prediction of crack propagation under cyclic loading based on
hydrogen diffusion, Materials Letters 52, p. 86-89.
[29] M. Yu, W. Chen, R. Kania, J. Been, G. V. Boven, Depressurization-Induced Crack Growth
Enhancement for Pipeline Steels Exposed to Near-Neutral pH Environments, Proceedings
of the 2014 10th International Pipeline Conference, ASME, Paper No. 33282
[30] A. Egbewande, W. Chen, R. Eadie, R. Kania, G. V. Boven, R. Worthingham, J. Been,
Transgranular crack growth in the pipeline steels exposed to near-neutral pH soil aqueous
solutions: Discontinuous crack growth mechanism, Corr. Sci. 83, p. 343–354
[31] B.W. Williams, S.B. Lambert, A. Plumtree, R. Sutherby, Environmental crack growth under
variable amplitude loading of pipeline steel, Corrosion 60 (1), p. 95-103.
[32] X.-Y. Zhang, S. B. Lambert, R. Sutherby, A. Plumtree, Transgranular Stress Corrosion
Cracking of X-60 Pipeline Steel in Simulated Ground Water, corrosion 55 (3), p. 297-305.
[33] J. Been, B. Carroll, A. Dinovitzer, R. Sutherby, Stress intensification and crack growth in
the presence of dents on pipelines, Proceedings of 2006 International Pipeline Conference,
ASME, New York, NY, paper No. IPC2006-10415.
[34] M.P.H. Brongers, J.A. Beavers, SCC in areas of local deformation, Gas Research Institute
report, 2005, GRI-04/0127
[35] T.R. Walker, R.J. Pick, Approximation of the axial strains developed during the roll forming
of ERW pipe. Journal of Materials Processing Technology, 22 (1), p.29–44.
[36] S.K. Bate, D. Green, D. Buttle, A Review of Residual Stress Distributions in Welded Joints
for the Defect Assessment of Offshore Structures, HSE Books, 1997.
[37] P. Prevéy, and D. Hornbach, Residual Stress in Pipelines, in Oil and Gas Pipelines: Integrity
and Safety Handbook, ed. R. W. Revie, John Wiley & Sons, Inc., New Jersey (2015).
48
[38] J.A. Beavers, and W.V. Harper. Stress Corrosion Cracking Prediction Model. NACE
International Corrosion, 2004, Paper No. 04189.
[39] J.A. Beavers, J.T. Johnson, and R.L. Sutherby, Materials factors influencing the initation of
Near-Neutral pH SCC on underground pipelines, Proceedings of 2000 International
Pipeline Conference Vol. 2, ASME, New York, NY, pp. 979-988.
[40] M. P. H. Brongers, J.A. Beavers, C.E. Jaske, Effect of Hydrostatic Testing on Ductile
Tearing of X-65 Line Pipe Steel with Stress Corrosion Cracks, Corrosion 56 (10), p. 1050-
1058.
[41] J. Li, M. Elboujdaini, M. Gao, R.W. Revie, Investigation of plastic zones near SCC tips in a
pipeline after hydrostatic testing, Materials Science and Engineering A 486, p.496–502.
[42] W. Chen, R. Sutherby, Laboratory Simulation of Hydrostatic Test in Near-Neutral pH Soil
Environments, Proceedings of 2006 International pipeline conference Vol. 2, ASME, New
York, NY, p. 711-724
[43] W. Zheng, W.R. Tyson, R.W. Revie, G. Shen, J.E.M. Braid, effects of hydrostatic testing on
the growth of stress-corrosion cracks, Proceedings of 1998 International pipeline
conference, Vol. 1, p.459.
[44] Y. Kang, W. Chen, R. Kania, G. V. Boven, R. Worthingham, Simulation of crack growth
during hydrostatic testing of pipeline steel in near-neutral pH environment, Corr. Sci. 53,
p. 968–975
[45] T. Kushida, K. Nose, H. Asahi, M. Kimura, Y. Yamane, S. Endo, H. Kawano, Effects of
metallurgical factors and test conditions on near-neutral pH SCC of pipeline steels,
Corrosion 2001, NACE International, Houston, paper No. 01213.
[46] J. Bulger and J. Luo, Effect of microstructure on near-neutral-pH SCC, Proceeding of the
2000 International Pipeline Conference Vol. 2, ASME, New York, NY , p. 947-952.
[47] J.G. Gonzalez-Rodriguez, M. Casales, V.M. Salinas-Bravo, J.L. Albarran, L. Martinez,
Effect of microstructure on the stress corrosion cracking of X-80 pipeline steel in diluted
sodium bicarbonate solutions, Corrosion 58(7), p. 584-590.
[48] B. Gu, W.Z. Yu, J.L. Luo, X. Mao, Transgranular stress corrosion cracking of X-80 and X-
52 pipeline steels in dilute aqueous solution with near-neutral pH, Corrosion 55(3), p. 312-
318.
49
[49] Z. Shirband, J. Luo, W. Chen. R. Eadie, Investigation of Hydrogen permeation along a
simulated coating disbondment, to be submitted.
[50] J.T. Johnson, C.L. Durr, J.A. Beavers, B.S. Delanty, Effects of O2 and CO2 on near-neutral-
pH stress corrosion crack propagation, Proc. Corrosion 2000, NACE International
Houston, TX, paper No. 00356.
[51] W. Chen, F. King, T.R. Jack, Environmental Aspects of Near-Neutral pH Stress Corrosion
Cracking of Pipeline Steel, Metallurgical and Materials Transactions A 33A(5), p. 1429-
1436.
[52] Y. Yamaguchi, H. Nonaka, Y. Nishikawa, Critical cathodic potential and fatigue lifetime
evaluation for hydrogen stress cracking on gas transmission pipelines, Proceeding of 1998
International Gas Research Conf., San Diego, CA, p. 394-404.
[53] C. Beachem, New model for hydrogen-assisted cracking-hydrogen embrittlement, Metall.
Trans. 3 (2), p. 437-451.
[54] L.J. Qiao, J.L. Luo, X. Mao, Hydrogen evolution and enrichment around stress corrosion
crack tips of pipeline steels in dilute bicarbonate solution, Corrosion 54(2), 115-120
[55] J. Morlet, H. Johnson, A. Troiano: A new concept of hydrogen embrittlement in steel,
Journal of Iron and Steel Institute 189, p. 37-44.
[56] M. Whiteman, A. Troiano: Hydrogen embrittlement of austenitic stainless steel, corrosion
21, 1965, p.53-56
[57] N. J. Petch, P. Stables, Delayed Fracture of Metals under Static Load, Nature 169, p.842-43
[58] N. J. Petch, Lowering of Fracture Stress Due to Surface Adsorption, Philos. Mag. 1 (8), ,
p.331-37.
[59] W.Chen , R. Kania, R. Worthingham, G.V. Boven, Transgranular crack growth in the
pipeline steels exposed to near-neutral pH soil aqueous solutions: The role of hydrogen,
Acta Materialia 57, p. 6200–6214.
[60] R. A. Oriani, Hydrogen embrittlement of steels, Ann. Rev. Mater. Sci. 8, p.327-57
[61] X.Gao, L. Qiao, Y. Su, K. Gao, J. Li, W. Chu, displacement burst and hydrogen effect
during loading and holding in nanoindentation of an iron single crystal, Scr. Mater. 53, p.
1315-1320.
[62] V. Venegas, F. Caleyo, J. Gonzalez, T. Baudin, J. Hallen, R. Penelle, EBSD study of
hydrogen-induced cracking in API-5L-X46 pipeline steel, Scr. Mater. 52, p.147-152.
50
[63] H.K. Birnbaum, I.M. Robertson, P. Sofronis, D. Teter, Mechanisms of hydrogen related
fracture. A review, Proc. 2nd International Conf. Corrosion Deformation Interaction, The
Institute of Materials, London,1997, p. 172-195.
[64] B.T. Lu, Crack growth model for pipeline steels exposed to near-neutral pH groundwater.
Fatigue & Fracture of Engineering Materials & Structures 36, 2013, p. 660–669.
[65] R.L. Eadie, K.E. Szklarz, R.L. Sutherby, Corrosion fatigue and near-neutral pH stress
corrosion cracking of pipeline steel and the effect of hydrogen sulfide, Corrosion 61(2), p.
167-173.
[66] Z.Y. Liu, X.G. Li, C.W. Du, G.L. Zhai, Y.F. Cheng, Stress Corrosion Cracking Behavior of
X-70 Pipe Steel in an Acidic Soil Environment, Corr. Sci. 50, p. 2251-2257.
[67] A. Torres-Islas, J.G. Gonzalez-Rodriguez, Effect of Electrochemical Potential and Solution
Concentration on the SCC Behaviour of X-70 Pipeline Steel in NaHCO3, International
Journal of Electrochemistry 4, p. 640-652.
[68] Kuniya, J., H. Anzai, and I. Masaoka, Effect of MnS inclusions on stress corrosion cracking
in low-alloy steels. Corrosion 48(4), p. 419-425
[69] A. Eslami, B. Fang, R. Kania, B. Worthingham, J. Been, R. Eadie, W. Chen, Stress
corrosion cracking initiation under the disbonded coating of pipeline steel in near-neutral
pH environment, Corr. Sci. 52, p. 3750–3756.
[70] B. Fang, R. Eadie, M. Elboujdaini, Stress corrosion crack initiation in X-52 pipeline steel in
near-neutral pH solution, Proceedings of the 2010 8th International Pipeline Conference
Vol. 1, ASME, NY, p. 347-356.
[71] Y.Z. Wang, R.W. Revie, M.T. Shehata, R.N. Parkins, Early stages of stress corrosion crack
development of X-65 pipeline steel in near-neutral pH solution, Proc. Materials for
Resource Recovery and Transport, ed. L. Collins, Metallurgical Society of Canadian
Institute of Mining, Metallurgy and Petroleum (CIM), Montreal, QC, p. 71-93.
[72] Y.Z. Wang, R.W. Revie, M.T. Shehata, R.N. Parkins, K. Krist, Initiation of environment
induced cracking in pipeline steel: microstructural correlations, Proc. of the 1998
International Pipeline Conf. vol. 1, ASME International, New York, NY, p. 529-542.
[73] M. Puiggali, S. Rousserie, M. Touzet, Fatigue crack initiation on low-carbon steel pipes in a
near-neutral-pH environment under potential control conditions, Corrosion 58(11), p. 961-
970.
51
[74] E. Senigallia, M. Pontremoli, Test methodologies for the study of near neutral stress
corrosion cracking in pipeline steels (EPRG), Proc. 12th Biennial Joint Research Meeting
on Pipeline Research, Groningen, The Netherlands, 1999.
[75] B. Y. Fang, E. H. Han, J. Q. Wang and W. Ke, Stress corrosion cracking of X-70 pipeline
steel in near neutral pH solution subjected to constant load and cyclic load testing,
Corrosion Engineering, Science and Technology 42 (2), p.123-129.
[76] H. Guo, G. Li, X. Cai, R. Yang, W. Yang, Effect of Cyclic Loading on Cracking Behaviour
of X-70 Pipeline Steel in Near-Neutral pH Solutions, J. Mater. Sci. Technol. 21(4), p. 459-
64.
[77] G. Roy, D. Kiff, R.W. Revie, E.J. C. Cousineau, G. Williams, E. Sinigaglia, Residual
stresses in linepipe specimens, HTL Report 94-17 (TR), 1994.
[78] W. Chen, G. V. Bovan, R. Rogge, “Role of Residual Stress in SCC Crack Initiation and
Propagation” Part II-Theoretic Analysis, Acta Mater., 55, p. 43-53.
[79] G. Van Boven, W. Chen, R. Rogge, The role of residual stress in neutral pH stress corrosion
cracking of pipelines. Part I: pitting and cracking occurrence, Acta Materialia 55, p. 29-42.
[80] X. Tang, Y.F. Cheng, Micro-electrochemical characterization of the effect of applied stress
on local anodic dissolution behavior of pipeline steel under near-neutral pH condition,
Electrochim. Acta 54, p.1499-1505.
[81] K. Chevil, W. Chen, G.V. Boven, R. Kania, J. Been, Correlating corrosion field data with
experimental findings for the development of pipeline mitigation strategies, Proceedings of
the 2014 International Pipeline Conference, Calgary, Canada, paper No. IPC-2010-33678.
52
Chapter 3: Investigation of Hydrogen Permeation
along a Coating Disbondment
53
3.1 Introduction
Near neutral pH SCC (NNpH SCC) is a transgranular cracking which is considered as an
integrity concern for both the oil and natural gas pipeline industry. Although effective corrosion
prevention measures are employed during the service life of pipelines, this type of cracking still
occurs at sites where a disbondment with a holiday is formed in the coating. It has been reported
that 87% of SCC cases occurs in pipelines which have spirally wrapped polyethylene coatings.
This is the case because not only they shield the cathodic protection but also easily disbond from
the surface of pipelines and cause exposure of the external pipeline surface to the soil solution
[1]. Under a disbonded coating, a near neutral-pH (6 < pH < 8), dilute, carbon dioxide (CO2)-
containing electrolyte is formed and can cause NNpHSCC. The reason for the formation of such
an environment is that cathodic protection cannot reach the pipe under the disbonded coating
because of either the shielding effect of the coating or a highly resistive soil. So the potential
around the NNpH SCC sites is around the open circuit potential of steel in NNpH environment.
Another characteristic of NNpHSCC is their wide crack crevice demonstrating significant lateral
dissolution, which is further evidence of the lack of cathodic protection at cracking sites. Field
observations have shown that not all NNpH SCC cracks have the potential to grow continuously
but only less than 5% of crack colonies had growing cracks. The other 95% crack colonies were
blunt and non-growing [2]. One of the main concerns of NNpH SCC researchers in recent years
has been finding factors which convert blunt cracks to sharp cracks. It is known that hydrogen
plays an important role in sharpening cracks [2-4]. The source of hydrogen is carbonic acid
formed by the combination of CO2 and water in the soil solution surrounding the pipeline.
Reduction of carbonic acid either by electrons provided through the corrosion of pipeline steel
under the disbonded coating or cathodic protection results in the formation of atomic hydrogen
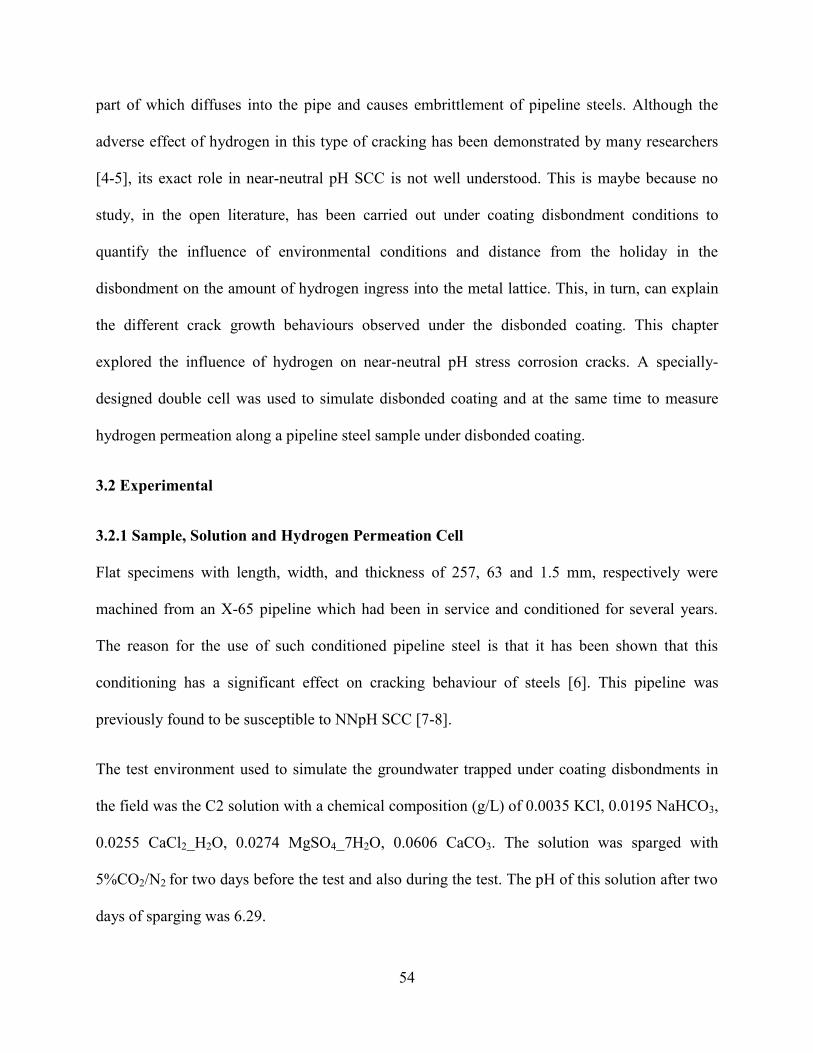
54
part of which diffuses into the pipe and causes embrittlement of pipeline steels. Although the
adverse effect of hydrogen in this type of cracking has been demonstrated by many researchers
[4-5], its exact role in near-neutral pH SCC is not well understood. This is maybe because no
study, in the open literature, has been carried out under coating disbondment conditions to
quantify the influence of environmental conditions and distance from the holiday in the
disbondment on the amount of hydrogen ingress into the metal lattice. This, in turn, can explain
the different crack growth behaviours observed under the disbonded coating. This chapter
explored the influence of hydrogen on near-neutral pH stress corrosion cracks. A specially-
designed double cell was used to simulate disbonded coating and at the same time to measure
hydrogen permeation along a pipeline steel sample under disbonded coating.
3.2 Experimental
3.2.1 Sample, Solution and Hydrogen Permeation Cell
Flat specimens with length, width, and thickness of 257, 63 and 1.5 mm, respectively were
machined from an X-65 pipeline which had been in service and conditioned for several years.
The reason for the use of such conditioned pipeline steel is that it has been shown that this
conditioning has a significant effect on cracking behaviour of steels [6]. This pipeline was
previously found to be susceptible to NNpH SCC [7-8].
The test environment used to simulate the groundwater trapped under coating disbondments in
the field was the C2 solution with a chemical composition (g/L) of 0.0035 KCl, 0.0195 NaHCO3,
0.0255 CaCl2_H2O, 0.0274 MgSO4_7H2O, 0.0606 CaCO3. The solution was sparged with
5%CO2/N2 for two days before the test and also during the test. The pH of this solution after two
days of sparging was 6.29.
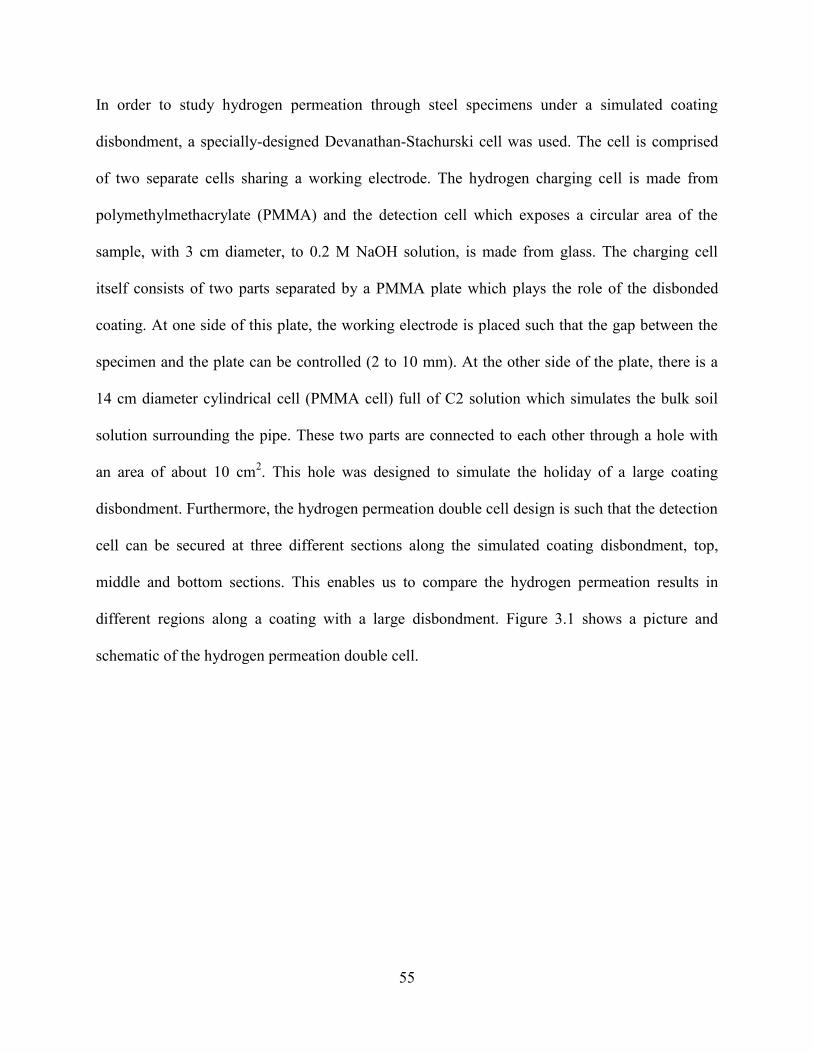
55
In order to study hydrogen permeation through steel specimens under a simulated coating
disbondment, a specially-designed Devanathan-Stachurski cell was used. The cell is comprised
of two separate cells sharing a working electrode. The hydrogen charging cell is made from
polymethylmethacrylate (PMMA) and the detection cell which exposes a circular area of the
sample, with 3 cm diameter, to 0.2 M NaOH solution, is made from glass. The charging cell
itself consists of two parts separated by a PMMA plate which plays the role of the disbonded
coating. At one side of this plate, the working electrode is placed such that the gap between the
specimen and the plate can be controlled (2 to 10 mm). At the other side of the plate, there is a
14 cm diameter cylindrical cell (PMMA cell) full of C2 solution which simulates the bulk soil
solution surrounding the pipe. These two parts are connected to each other through a hole with
an area of about 10 cm2. This hole was designed to simulate the holiday of a large coating
disbondment. Furthermore, the hydrogen permeation double cell design is such that the detection
cell can be secured at three different sections along the simulated coating disbondment, top,
middle and bottom sections. This enables us to compare the hydrogen permeation results in
different regions along a coating with a large disbondment. Figure 3.1 shows a picture and
schematic of the hydrogen permeation double cell.
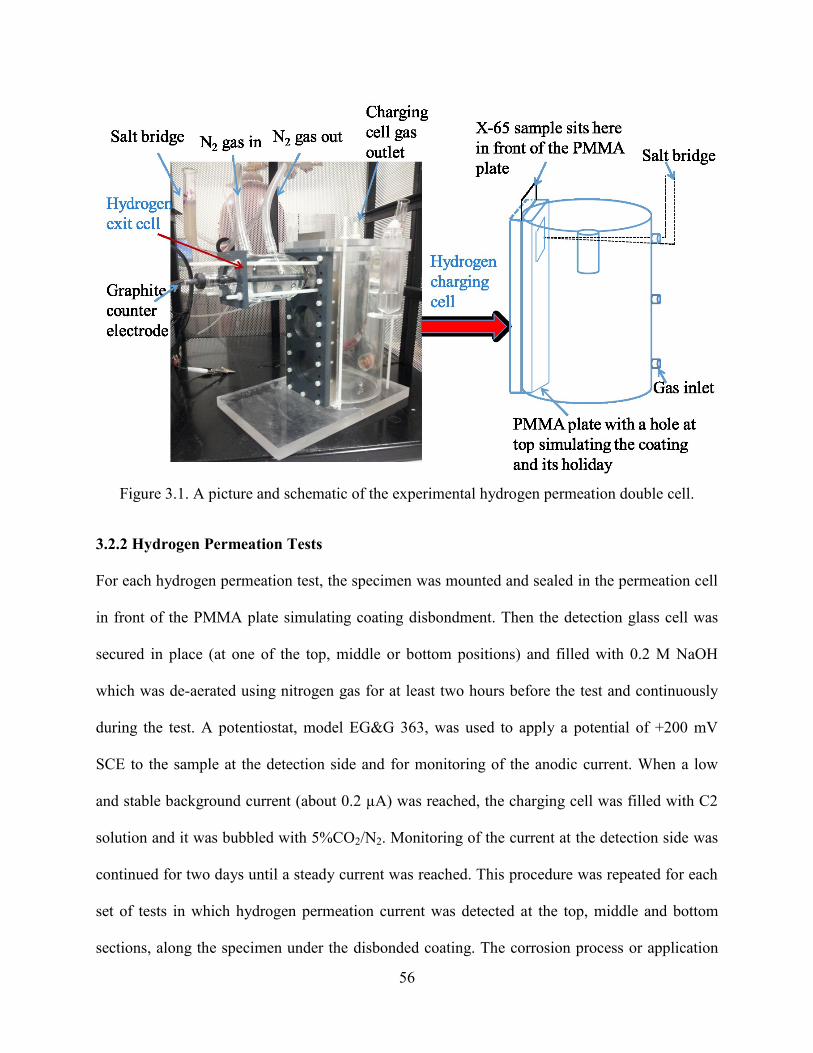
56
Figure 3.1. A picture and schematic of the experimental hydrogen permeation double cell.
3.2.2 Hydrogen Permeation Tests
For each hydrogen permeation test, the specimen was mounted and sealed in the permeation cell
in front of the PMMA plate simulating coating disbondment. Then the detection glass cell was
secured in place (at one of the top, middle or bottom positions) and filled with 0.2 M NaOH
which was de-aerated using nitrogen gas for at least two hours before the test and continuously
during the test. A potentiostat, model EG&G 363, was used to apply a potential of +200 mV
SCE to the sample at the detection side and for monitoring of the anodic current. When a low
and stable background current (about 0.2 µA) was reached, the charging cell was filled with C2
solution and it was bubbled with 5%CO2/N2. Monitoring of the current at the detection side was
continued for two days until a steady current was reached. This procedure was repeated for each
set of tests in which hydrogen permeation current was detected at the top, middle and bottom
sections, along the specimen under the disbonded coating. The corrosion process or application
57
of cathodic potential on the cathode side allows the hydrogen to be charged on the surface of
working electrode and a small portion of produced hydrogen diffuses inside the steel membrane.
Once the hydrogen reaches the other surface of membrane exposed to NaOH solution inside the
detection cell, it is oxidized because of the positive potential applied to the sample surface at this
cell, and the resulting current is measured. Since the amount of hydrogen entering and leaving
the specimen is directly proportional to the current measured, by measuring the anodic currents,
accurate determination of the permeating hydrogen may be obtained. The permeation test was
stopped when a steady state current at the detection cell was established.
3.3 Results and Discussion
3.3.1 Hydrogen Permeation Test Results at 10 mm Gap Size
While the steel surface in the cathode chamber was at corrosion potential, hydrogen permeation
currents were recorded at each section (top, middle and bottom) along the disbondment and a gap
size of 10 mm. The results are shown in Figure 3.2. Since the purpose was to see how disbonded
coating affects the local environment and, consequently, hydrogen ingress under the coating, the
tests were performed for a longer time (about two days) so that changes in the level of hydrogen
with time can be recorded. As can be seen from Figure 3.2, the current at the top section shows
the typical hydrogen permeation current curve usually obtained in permeation experiments in
which after a delay, corresponding to the diffusion barrier inside the sample, the current starts to
increase until it reaches a steady state value, indicating the attainment of constant hydrogen
coverage. Although the hydrogen current at the middle and bottom sections followed a similar
trend in the first six hours of the test, the current gradually decreased to a lower steady state
value which was obtained after about 26 hours. The decrease in the hydrogen permeation current
is usually accounted for by the gradual development of a passive layer on the surface of the steel
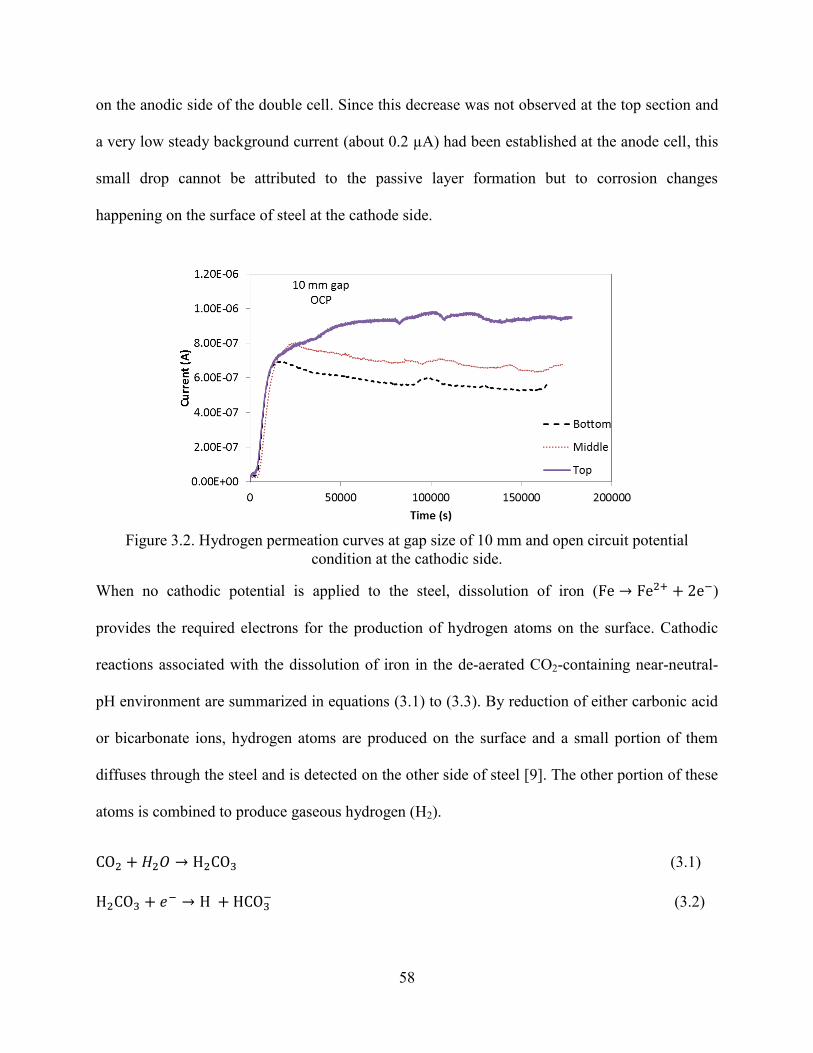
58
on the anodic side of the double cell. Since this decrease was not observed at the top section and
a very low steady background current (about 0.2 µA) had been established at the anode cell, this
small drop cannot be attributed to the passive layer formation but to corrosion changes
happening on the surface of steel at the cathode side.
Figure 3.2. Hydrogen permeation curves at gap size of 10 mm and open circuit potential
condition at the cathodic side.
When no cathodic potential is applied to the steel, dissolution of iron ( → )
provides the required electrons for the production of hydrogen atoms on the surface. Cathodic
reactions associated with the dissolution of iron in the de-aerated CO2-containing near-neutral-
pH environment are summarized in equations (3.1) to (3.3). By reduction of either carbonic acid
or bicarbonate ions, hydrogen atoms are produced on the surface and a small portion of them
diffuses through the steel and is detected on the other side of steel [9]. The other portion of these
atoms is combined to produce gaseous hydrogen (H2).
→ (3.1)
𝑒 → (3.2)
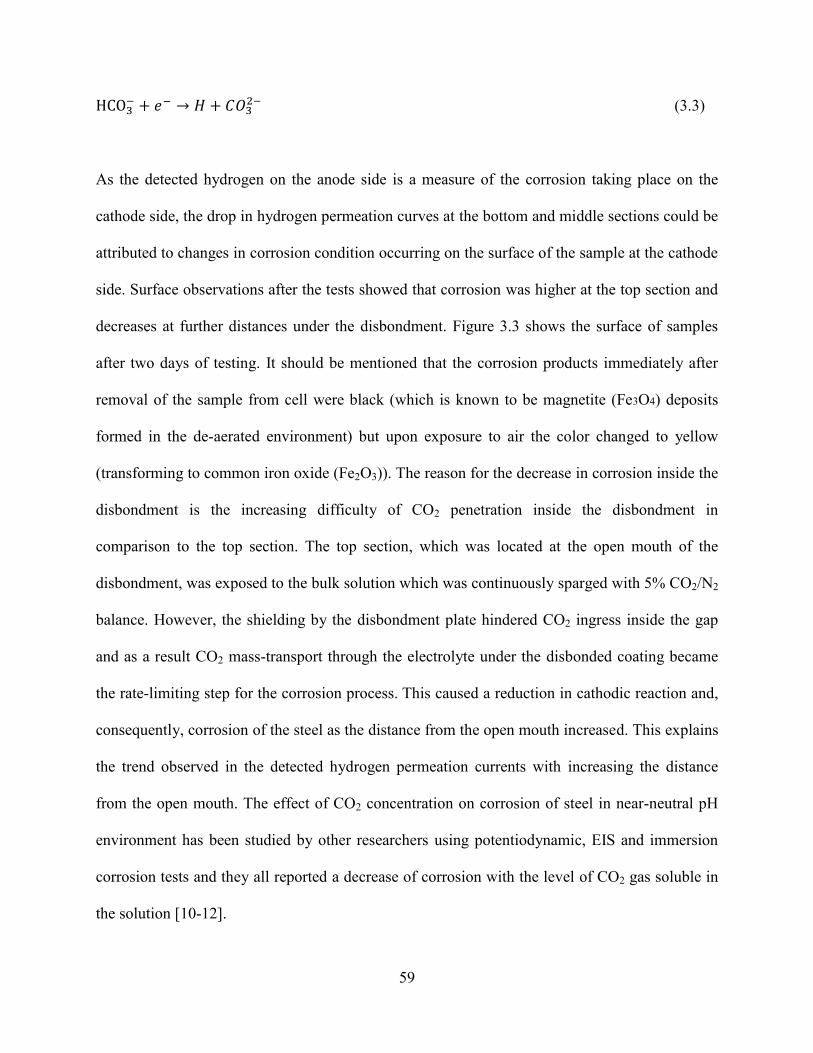
59
𝑒 →
(3.3)
As the detected hydrogen on the anode side is a measure of the corrosion taking place on the
cathode side, the drop in hydrogen permeation curves at the bottom and middle sections could be
attributed to changes in corrosion condition occurring on the surface of the sample at the cathode
side. Surface observations after the tests showed that corrosion was higher at the top section and
decreases at further distances under the disbondment. Figure 3.3 shows the surface of samples
after two days of testing. It should be mentioned that the corrosion products immediately after
removal of the sample from cell were black (which is known to be magnetite (Fe3O4) deposits
formed in the de-aerated environment) but upon exposure to air the color changed to yellow
(transforming to common iron oxide (Fe2O3)). The reason for the decrease in corrosion inside the
disbondment is the increasing difficulty of CO2 penetration inside the disbondment in
comparison to the top section. The top section, which was located at the open mouth of the
disbondment, was exposed to the bulk solution which was continuously sparged with 5% CO2/N2
balance. However, the shielding by the disbondment plate hindered CO2 ingress inside the gap
and as a result CO2 mass-transport through the electrolyte under the disbonded coating became
the rate-limiting step for the corrosion process. This caused a reduction in cathodic reaction and,
consequently, corrosion of the steel as the distance from the open mouth increased. This explains
the trend observed in the detected hydrogen permeation currents with increasing the distance
from the open mouth. The effect of CO2 concentration on corrosion of steel in near-neutral pH
environment has been studied by other researchers using potentiodynamic, EIS and immersion
corrosion tests and they all reported a decrease of corrosion with the level of CO2 gas soluble in
the solution [10-12].
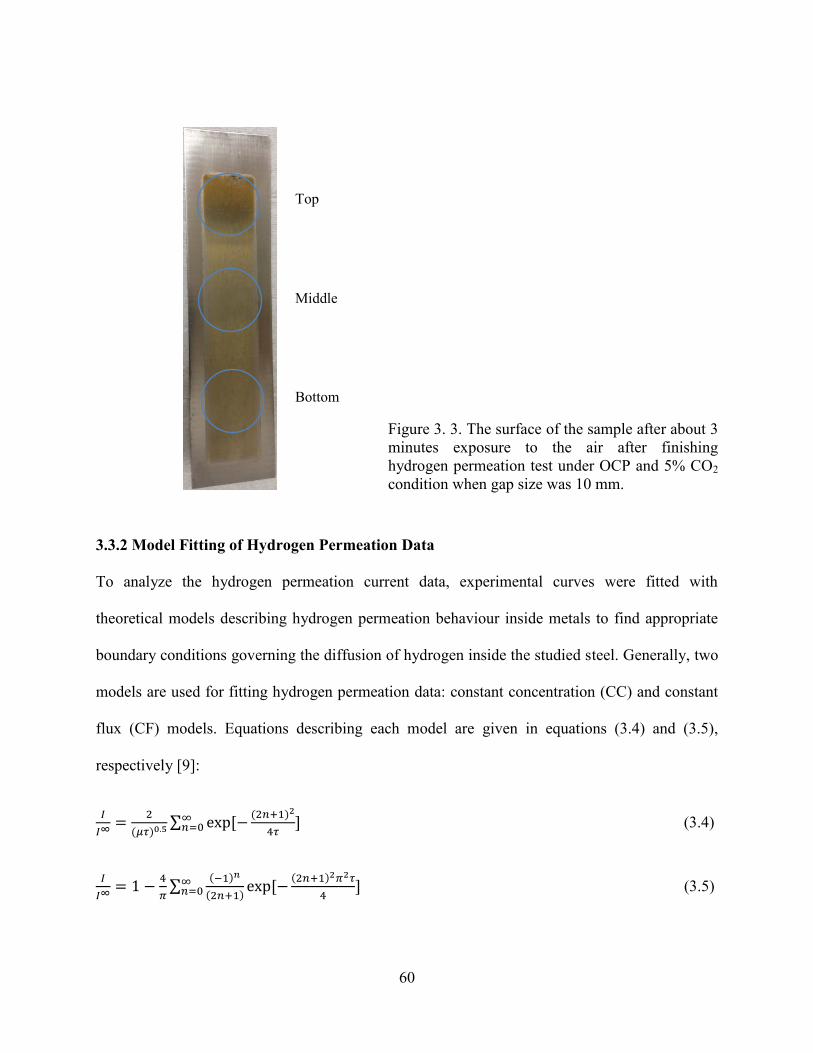
60
Figure 3. 3. The surface of the sample after about 3
minutes exposure to the air after finishing
hydrogen permeation test under OCP and 5% CO2
condition when gap size was 10 mm.
3.3.2 Model Fitting of Hydrogen Permeation Data
To analyze the hydrogen permeation current data, experimental curves were fitted with
theoretical models describing hydrogen permeation behaviour inside metals to find appropriate
boundary conditions governing the diffusion of hydrogen inside the studied steel. Generally, two
models are used for fitting hydrogen permeation data: constant concentration (CC) and constant
flux (CF) models. Equations describing each model are given in equations (3.4) and (3.5),
respectively [9]:
∑
(3.4)
∑
(3.5)
Top
Middle
Bottom
61
Where is instant hydrogen permeation current, is the steady state hydrogen current
established after several hours and dimensionless
(D is hydrogen diffusivity, L is the
sample thickness (1.5 mm in this study) and t is time). In this study, break through time was used
to calculate hydrogen diffusivity and maximum current during the initial seven hours, during
which the rise in the current curve was complete, were considered at all sections for the fitting
purpose. All the currents were normalized with respect to the maximum current at each section.
This selection was based on the fact that there was a drop in currents detected at middle and
bottom sections along the disbondment and steady current was reached with a delay. Figure 3.4
(a-c) shows normalized current curves of the same experimental results presented in Figure 3.2
and their fitted curve based on CC and CF models. It shows the typical case for fitting all
experimental results done in this study. It can be seen that the CC model gives the best fit with
the experimental data at all sections. However, under the disbonded coating at the middle and
bottom sections, changes of CO2 concentration over time and its effect on hydrogen reactions
caused deviation of experimental curves from the fitted model. Nevertheless, the CC model still
gave a better fit than the CF model. Therefore, it can be concluded that corrosion on the surface
of pipeline steels in near-neutral pH solution is best represented by a constant concentration
boundary condition for diffusion of hydrogen inside the steel. According to this model, sub-
surface hydrogen concentration is achieved instantaneously and remains constant. However, in
the present experiments, the presence of the disbonded coating caused local environment
changes with time and, therefore, the final steady concentration of hydrogen would be different
from the initial concentration. So, equations pertaining to the CC model will be used to calculate
the concentration of sub-surface hydrogen after two days, , using the final steady current
achieved after 48 hours rather than the maximum current.
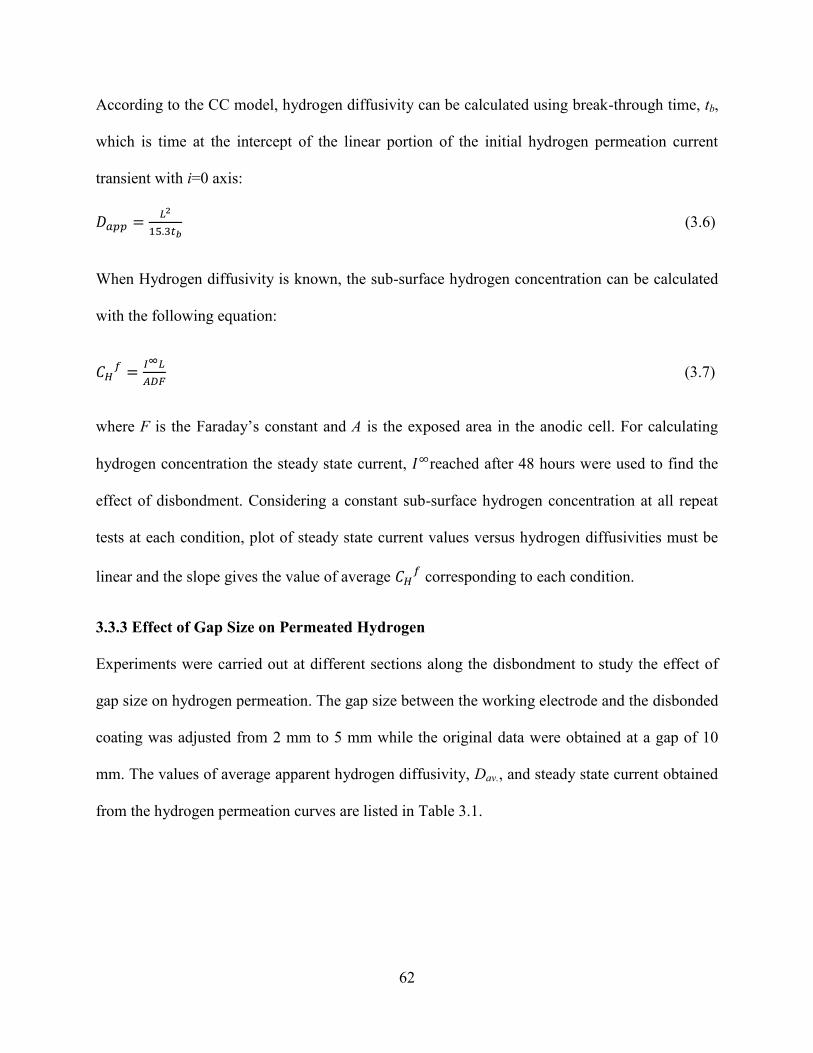
62
According to the CC model, hydrogen diffusivity can be calculated using break-through time, tb,
which is time at the intercept of the linear portion of the initial hydrogen permeation current
transient with i=0 axis:
(3.6)
When Hydrogen diffusivity is known, the sub-surface hydrogen concentration can be calculated
with the following equation:
(3.7)
where F is the Faraday‟s constant and A is the exposed area in the anodic cell. For calculating
hydrogen concentration the steady state current, reached after 48 hours were used to find the
effect of disbondment. Considering a constant sub-surface hydrogen concentration at all repeat
tests at each condition, plot of steady state current values versus hydrogen diffusivities must be
linear and the slope gives the value of average corresponding to each condition.
3.3.3 Effect of Gap Size on Permeated Hydrogen
Experiments were carried out at different sections along the disbondment to study the effect of
gap size on hydrogen permeation. The gap size between the working electrode and the disbonded
coating was adjusted from 2 mm to 5 mm while the original data were obtained at a gap of 10
mm. The values of average apparent hydrogen diffusivity, Dav., and steady state current obtained
from the hydrogen permeation curves are listed in Table 3.1.
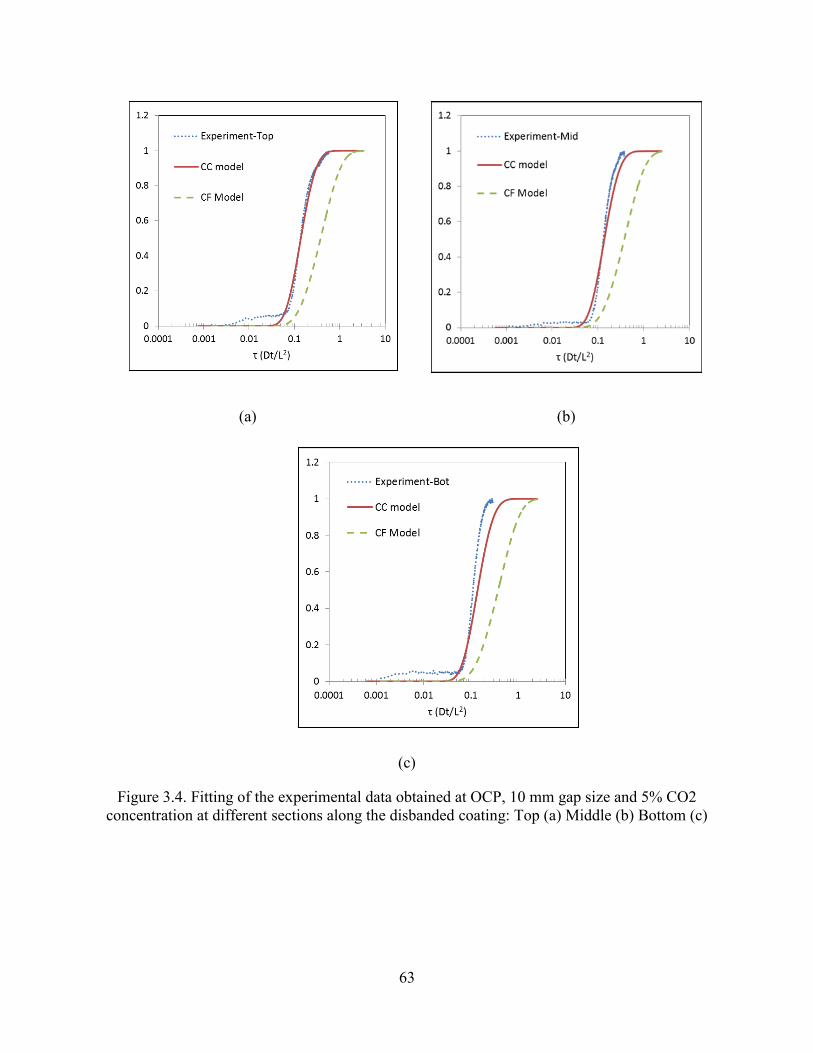
63
(a) (b)
(c)
Figure 3.4. Fitting of the experimental data obtained at OCP, 10 mm gap size and 5% CO2
concentration at different sections along the disbanded coating: Top (a) Middle (b) Bottom (c)
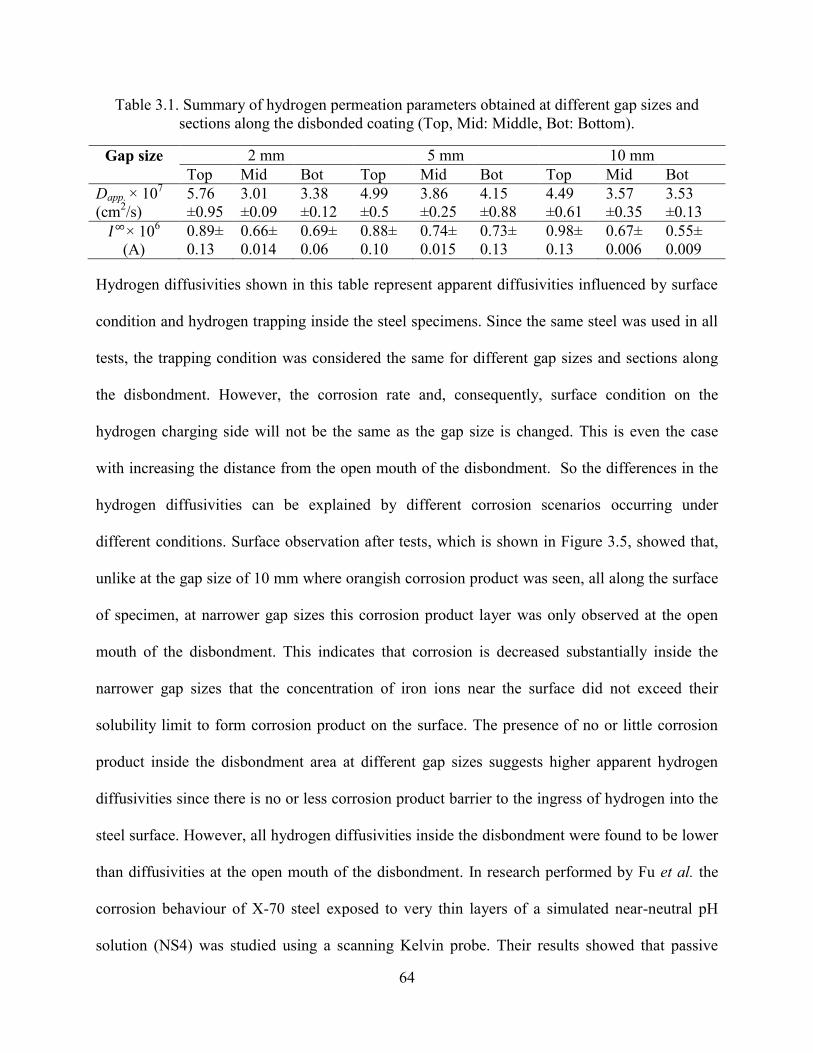
64
Table 3.1. Summary of hydrogen permeation parameters obtained at different gap sizes and
sections along the disbonded coating (Top, Mid: Middle, Bot: Bottom).
Gap size 2 mm 5 mm 10 mm
Top Mid Bot Top Mid Bot Top Mid Bot
Dapp. × 107
(cm2/s)
5.76
±0.95
3.01
±0.09
3.38
±0.12
4.99
±0.5
3.86
±0.25
4.15
±0.88
4.49
±0.61
3.57
±0.35
3.53
±0.13
× 106
(A)
0.89±
0.13
0.66±
0.014
0.69±
0.06
0.88±
0.10
0.74±
0.015
0.73±
0.13
0.98±
0.13
0.67±
0.006
0.55±
0.009
Hydrogen diffusivities shown in this table represent apparent diffusivities influenced by surface
condition and hydrogen trapping inside the steel specimens. Since the same steel was used in all
tests, the trapping condition was considered the same for different gap sizes and sections along
the disbondment. However, the corrosion rate and, consequently, surface condition on the
hydrogen charging side will not be the same as the gap size is changed. This is even the case
with increasing the distance from the open mouth of the disbondment. So the differences in the
hydrogen diffusivities can be explained by different corrosion scenarios occurring under
different conditions. Surface observation after tests, which is shown in Figure 3.5, showed that,
unlike at the gap size of 10 mm where orangish corrosion product was seen, all along the surface
of specimen, at narrower gap sizes this corrosion product layer was only observed at the open
mouth of the disbondment. This indicates that corrosion is decreased substantially inside the
narrower gap sizes that the concentration of iron ions near the surface did not exceed their
solubility limit to form corrosion product on the surface. The presence of no or little corrosion
product inside the disbondment area at different gap sizes suggests higher apparent hydrogen
diffusivities since there is no or less corrosion product barrier to the ingress of hydrogen into the
steel surface. However, all hydrogen diffusivities inside the disbondment were found to be lower
than diffusivities at the open mouth of the disbondment. In research performed by Fu et al. the
corrosion behaviour of X-70 steel exposed to very thin layers of a simulated near-neutral pH
solution (NS4) was studied using a scanning Kelvin probe. Their results showed that passive
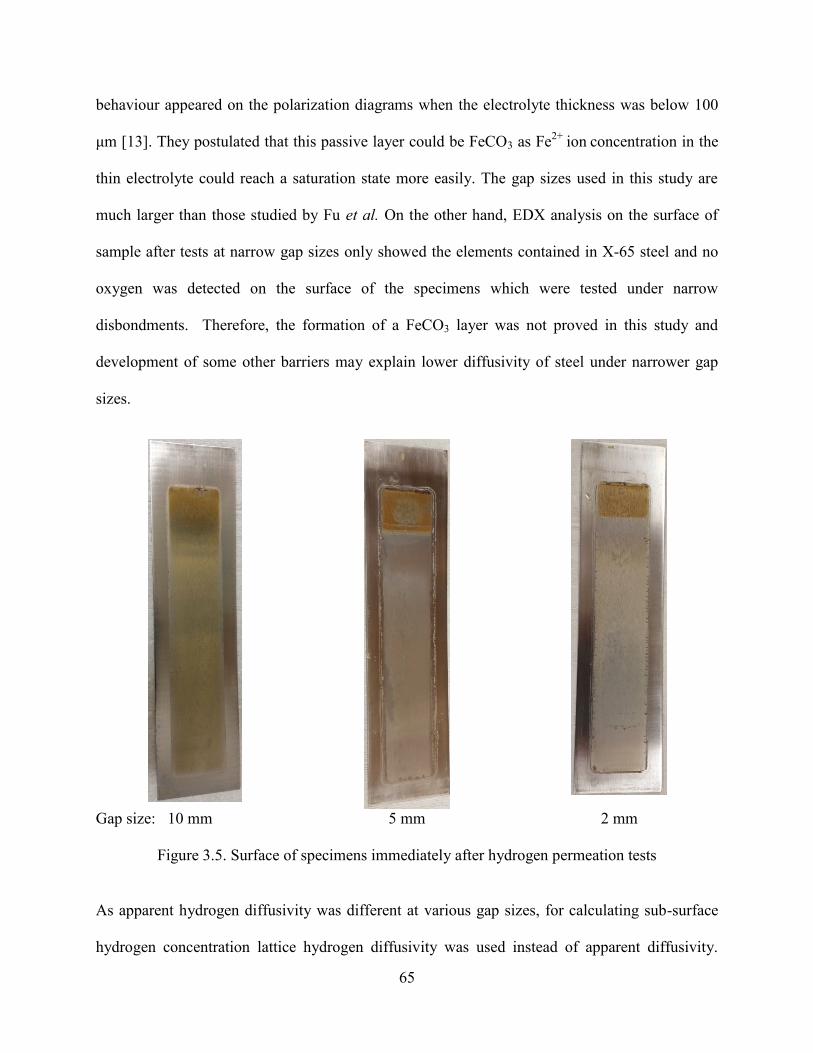
65
behaviour appeared on the polarization diagrams when the electrolyte thickness was below 100
μm [13]. They postulated that this passive layer could be FeCO3 as Fe2+
ion concentration in the
thin electrolyte could reach a saturation state more easily. The gap sizes used in this study are
much larger than those studied by Fu et al. On the other hand, EDX analysis on the surface of
sample after tests at narrow gap sizes only showed the elements contained in X-65 steel and no
oxygen was detected on the surface of the specimens which were tested under narrow
disbondments. Therefore, the formation of a FeCO3 layer was not proved in this study and
development of some other barriers may explain lower diffusivity of steel under narrower gap
sizes.
Gap size: 10 mm 5 mm 2 mm
Figure 3.5. Surface of specimens immediately after hydrogen permeation tests
As apparent hydrogen diffusivity was different at various gap sizes, for calculating sub-surface
hydrogen concentration lattice hydrogen diffusivity was used instead of apparent diffusivity.
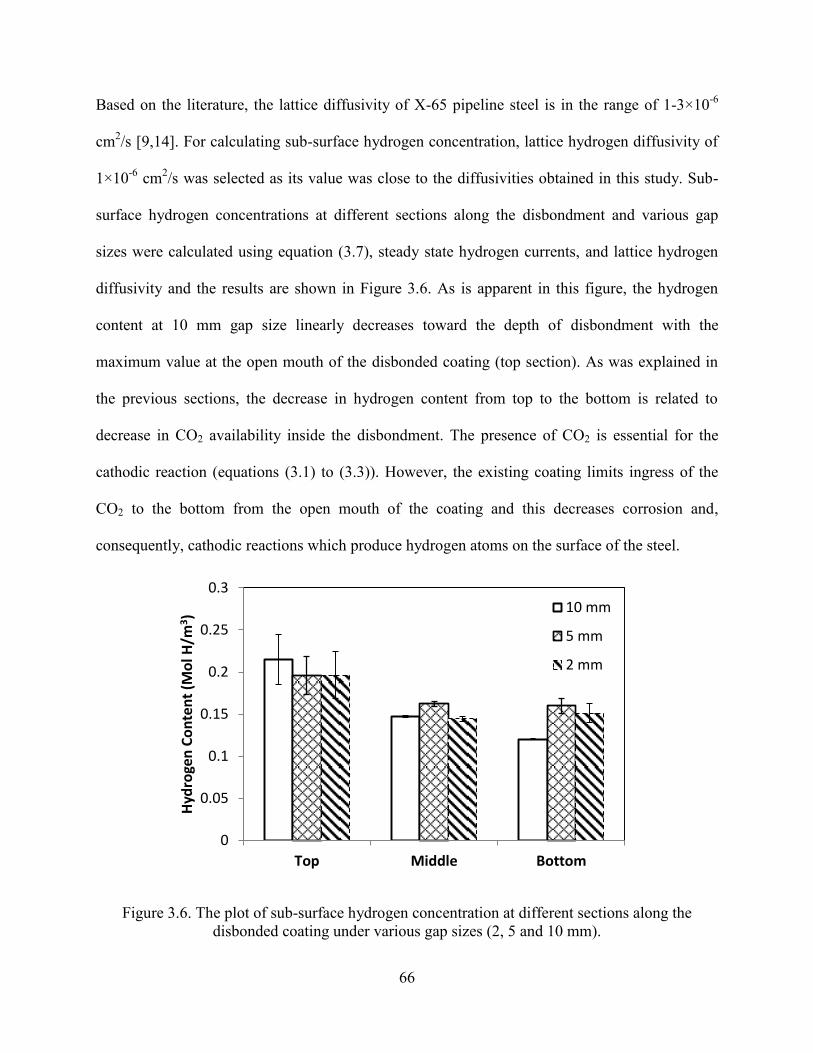
66
Based on the literature, the lattice diffusivity of X-65 pipeline steel is in the range of 1-3×10⁻⁶
cm2/s [9,14]. For calculating sub-surface hydrogen concentration, lattice hydrogen diffusivity of
1×10⁻⁶
cm2/s was selected as its value was close to the diffusivities obtained in this study. Sub-
surface hydrogen concentrations at different sections along the disbondment and various gap
sizes were calculated using equation (3.7), steady state hydrogen currents, and lattice hydrogen
diffusivity and the results are shown in Figure 3.6. As is apparent in this figure, the hydrogen
content at 10 mm gap size linearly decreases toward the depth of disbondment with the
maximum value at the open mouth of the disbonded coating (top section). As was explained in
the previous sections, the decrease in hydrogen content from top to the bottom is related to
decrease in CO2 availability inside the disbondment. The presence of CO2 is essential for the
cathodic reaction (equations (3.1) to (3.3)). However, the existing coating limits ingress of the
CO2 to the bottom from the open mouth of the coating and this decreases corrosion and,
consequently, cathodic reactions which produce hydrogen atoms on the surface of the steel.
Figure 3.6. The plot of sub-surface hydrogen concentration at different sections along the
disbonded coating under various gap sizes (2, 5 and 10 mm).
0
0.05
0.1
0.15
0.2
0.25
0.3
Top Middle Bottom
Hyd
roge
n C
on
ten
t (M
ol H
/m3) 10 mm
5 mm
2 mm
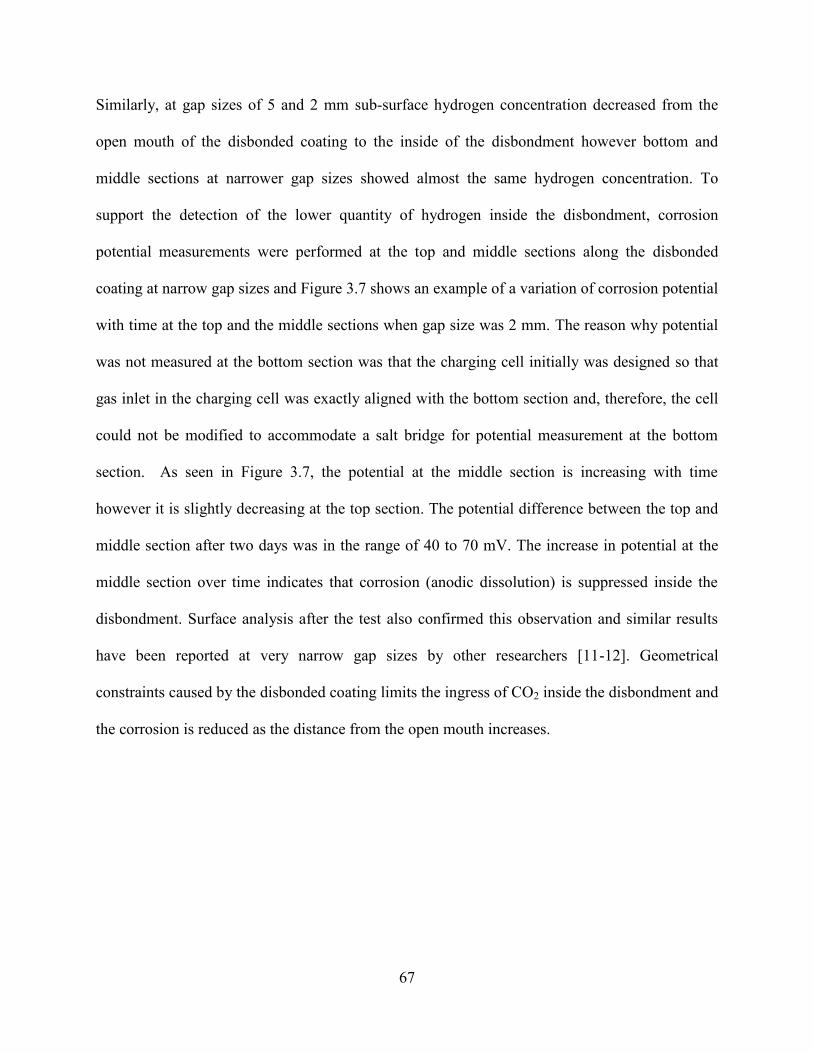
67
Similarly, at gap sizes of 5 and 2 mm sub-surface hydrogen concentration decreased from the
open mouth of the disbonded coating to the inside of the disbondment however bottom and
middle sections at narrower gap sizes showed almost the same hydrogen concentration. To
support the detection of the lower quantity of hydrogen inside the disbondment, corrosion
potential measurements were performed at the top and middle sections along the disbonded
coating at narrow gap sizes and Figure 3.7 shows an example of a variation of corrosion potential
with time at the top and the middle sections when gap size was 2 mm. The reason why potential
was not measured at the bottom section was that the charging cell initially was designed so that
gas inlet in the charging cell was exactly aligned with the bottom section and, therefore, the cell
could not be modified to accommodate a salt bridge for potential measurement at the bottom
section. As seen in Figure 3.7, the potential at the middle section is increasing with time
however it is slightly decreasing at the top section. The potential difference between the top and
middle section after two days was in the range of 40 to 70 mV. The increase in potential at the
middle section over time indicates that corrosion (anodic dissolution) is suppressed inside the
disbondment. Surface analysis after the test also confirmed this observation and similar results
have been reported at very narrow gap sizes by other researchers [11-12]. Geometrical
constraints caused by the disbonded coating limits the ingress of CO2 inside the disbondment and
the corrosion is reduced as the distance from the open mouth increases.
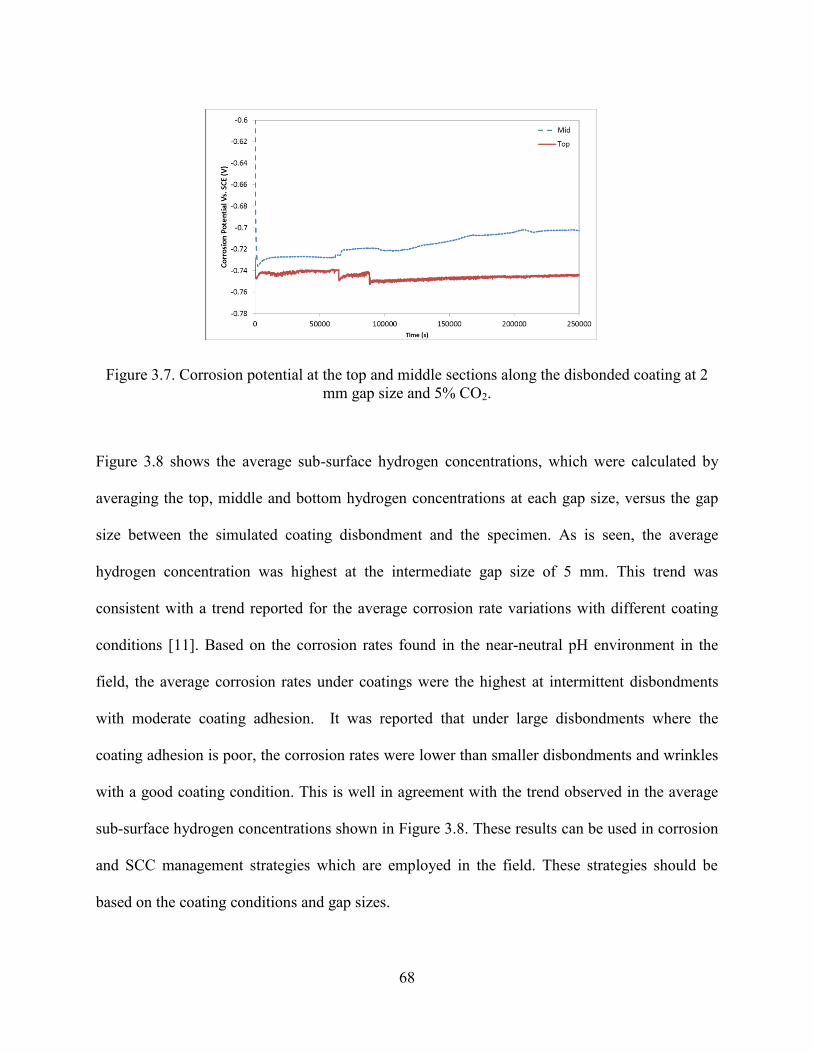
68
Figure 3.7. Corrosion potential at the top and middle sections along the disbonded coating at 2
mm gap size and 5% CO2.
Figure 3.8 shows the average sub-surface hydrogen concentrations, which were calculated by
averaging the top, middle and bottom hydrogen concentrations at each gap size, versus the gap
size between the simulated coating disbondment and the specimen. As is seen, the average
hydrogen concentration was highest at the intermediate gap size of 5 mm. This trend was
consistent with a trend reported for the average corrosion rate variations with different coating
conditions [11]. Based on the corrosion rates found in the near-neutral pH environment in the
field, the average corrosion rates under coatings were the highest at intermittent disbondments
with moderate coating adhesion. It was reported that under large disbondments where the
coating adhesion is poor, the corrosion rates were lower than smaller disbondments and wrinkles
with a good coating condition. This is well in agreement with the trend observed in the average
sub-surface hydrogen concentrations shown in Figure 3.8. These results can be used in corrosion
and SCC management strategies which are employed in the field. These strategies should be
based on the coating conditions and gap sizes.
69
Figure 3.8. Variation of the average sub-surface hydrogen concentration along the disbondment
with the gap size.
Now, this question may arise that with limited access of CO2 inside the narrow disbondments,
how was extra hydrogen needed for the larger number of cathodic reactions than 10 mm gap size
produced? Observation of no orangish corrosion product on the surface of specimens inside the
narrow disbondments indicates that the amount of ferrous from the corrosion process has to be
lower than the solubility limit of iron in the water. Inside narrow disbondments, hydrolysis of
these dissolved iron ions generates H+ ions which can subsequently undergo cathodic reactions
upon transfer of some of the electrons from the dissolution process at the open mouth. This can
explain the higher sub-surface hydrogen levels inside the narrower gap sizes compared to the
wide (10 mm) gap size.
Long-term immersion corrosion tests reported previously showed that at 2 and 5 mm gap sizes
corrosion weight loss at the open mouth of disbondment was higher than 10 mm gap size [11].
The increased corrosion rated at narrower gap sizes was attributed to iron ion concentration
gradients which are developed at narrower gap sizes. This concentration gradient was believed to
result in a concentration of anodic reactions and consequently higher weight loss at the open
mouth of narrower disbondments (2 and 5 mm gap). During a two-day hydrogen permeation test,
0.15
0.155
0.16
0.165
0.17
0.175
0 5 10 15
Ave
rage
Hyd
roge
n
Co
nte
nt
(mo
l H/m
3)
Gap size (mm)
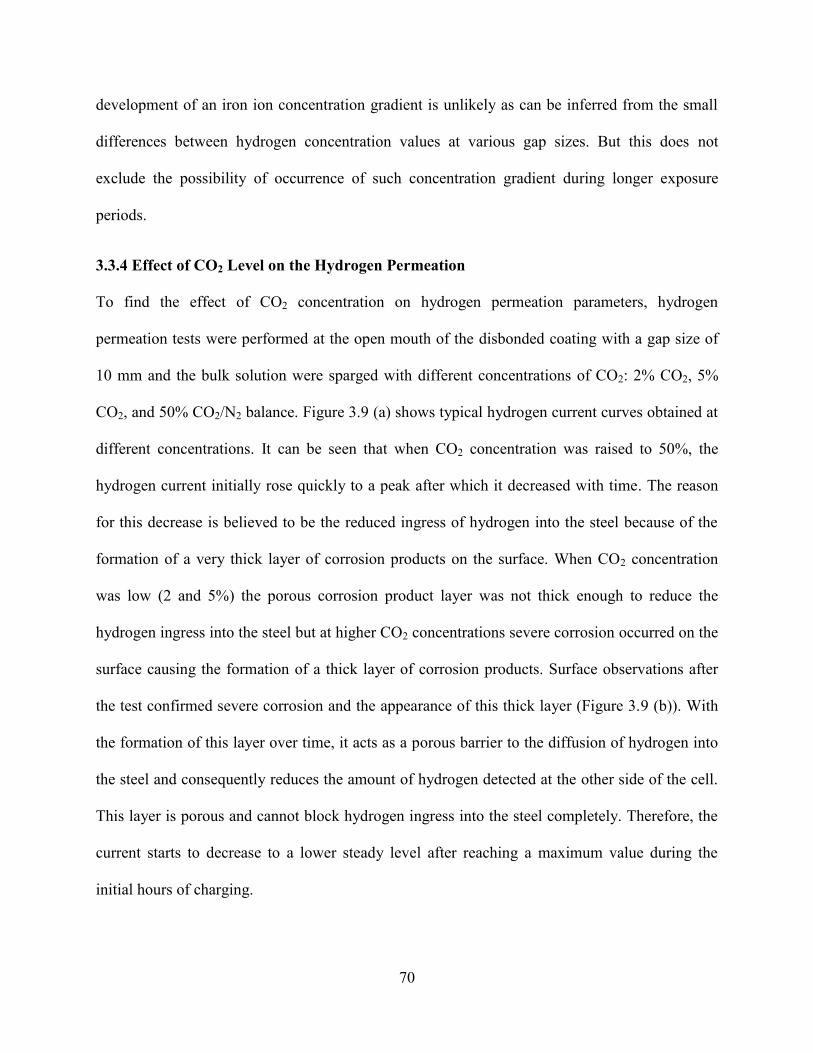
70
development of an iron ion concentration gradient is unlikely as can be inferred from the small
differences between hydrogen concentration values at various gap sizes. But this does not
exclude the possibility of occurrence of such concentration gradient during longer exposure
periods.
3.3.4 Effect of CO2 Level on the Hydrogen Permeation
To find the effect of CO2 concentration on hydrogen permeation parameters, hydrogen
permeation tests were performed at the open mouth of the disbonded coating with a gap size of
10 mm and the bulk solution were sparged with different concentrations of CO2: 2% CO2, 5%
CO2, and 50% CO2/N2 balance. Figure 3.9 (a) shows typical hydrogen current curves obtained at
different concentrations. It can be seen that when CO2 concentration was raised to 50%, the
hydrogen current initially rose quickly to a peak after which it decreased with time. The reason
for this decrease is believed to be the reduced ingress of hydrogen into the steel because of the
formation of a very thick layer of corrosion products on the surface. When CO2 concentration
was low (2 and 5%) the porous corrosion product layer was not thick enough to reduce the
hydrogen ingress into the steel but at higher CO2 concentrations severe corrosion occurred on the
surface causing the formation of a thick layer of corrosion products. Surface observations after
the test confirmed severe corrosion and the appearance of this thick layer (Figure 3.9 (b)). With
the formation of this layer over time, it acts as a porous barrier to the diffusion of hydrogen into
the steel and consequently reduces the amount of hydrogen detected at the other side of the cell.
This layer is porous and cannot block hydrogen ingress into the steel completely. Therefore, the
current starts to decrease to a lower steady level after reaching a maximum value during the
initial hours of charging.
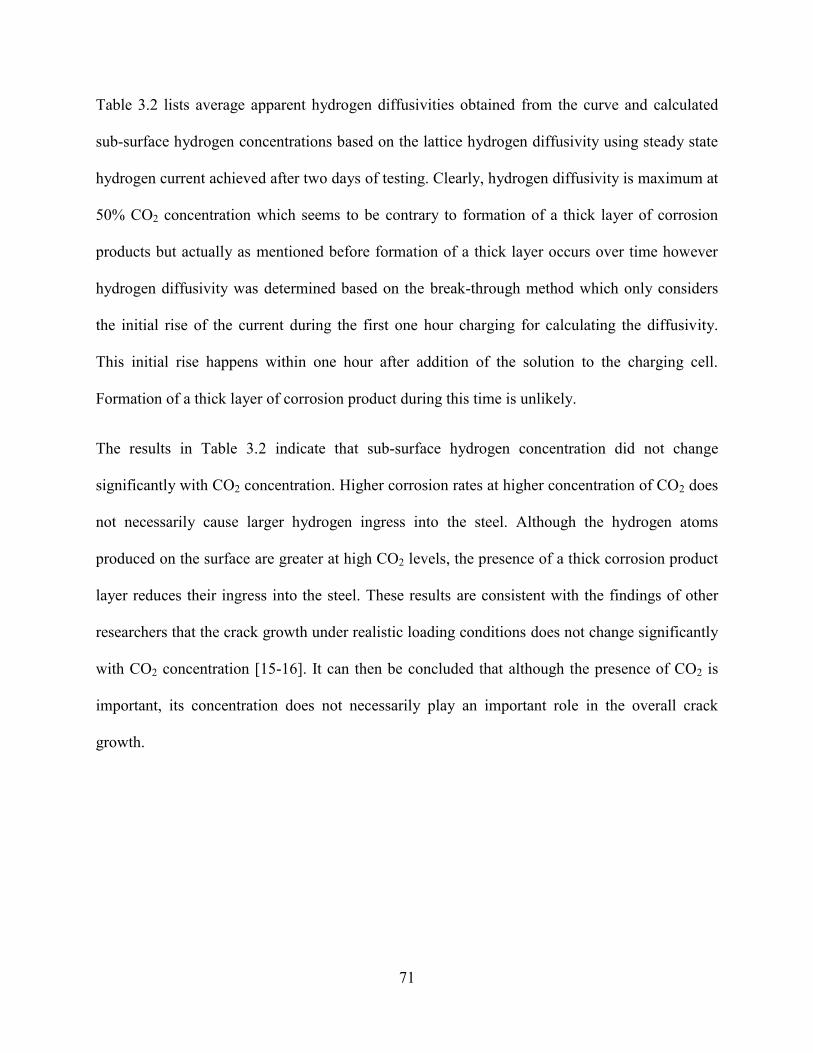
71
Table 3.2 lists average apparent hydrogen diffusivities obtained from the curve and calculated
sub-surface hydrogen concentrations based on the lattice hydrogen diffusivity using steady state
hydrogen current achieved after two days of testing. Clearly, hydrogen diffusivity is maximum at
50% CO2 concentration which seems to be contrary to formation of a thick layer of corrosion
products but actually as mentioned before formation of a thick layer occurs over time however
hydrogen diffusivity was determined based on the break-through method which only considers
the initial rise of the current during the first one hour charging for calculating the diffusivity.
This initial rise happens within one hour after addition of the solution to the charging cell.
Formation of a thick layer of corrosion product during this time is unlikely.
The results in Table 3.2 indicate that sub-surface hydrogen concentration did not change
significantly with CO2 concentration. Higher corrosion rates at higher concentration of CO2 does
not necessarily cause larger hydrogen ingress into the steel. Although the hydrogen atoms
produced on the surface are greater at high CO2 levels, the presence of a thick corrosion product
layer reduces their ingress into the steel. These results are consistent with the findings of other
researchers that the crack growth under realistic loading conditions does not change significantly
with CO2 concentration [15-16]. It can then be concluded that although the presence of CO2 is
important, its concentration does not necessarily play an important role in the overall crack
growth.
72
(a) (b)
Figure 3.9. Hydrogen permeation curves at the open mouth of the disbonded coating under various
concentration of CO2 in the charging cell (a) surface of the sample after the test at 50% CO2.
Table 3.2. Hydrogen permeation parameters under different concentrations of CO2 inside the
purging gas in the charging cell. (Note: Errors indicate standard deviation)
CO2 Concentration Hydrogen Diffusivity
(× 107 (cm
2/s))
Sub-surface Hydrogen
Concentration
(ppm)
2%CO2 4.65±
0.12
0.023±
0.0021
5% CO2 4.49±
0.61
0.027±
0.0033
50% CO2 6.25±
1.88
0.0266±
0.0007
3.3.5 Effect of CP level on the Hydrogen Permeation
To find the influence of various CP levels on the sub-surface hydrogen concentration, CP
potentials ranging from -0.8 to -1.2 V (SCE) were applied at the open mouth of the disbondment
with gap size fixed at 10 mm and exposing specimens to the C2 solution and sparging with 5%
CO2-N2 bal. gas. At each CP level, typical hydrogen permeation curves were obtained and fitted.
Similarly, the CC model resulted in a better fit so equations (3.7)-(3.8) were used to analyze the
73
data. Steady-state currents extracted from the curves and calculated hydrogen diffusivities are
listed in Table 3.3.
Table 3.3. Hydrogen permeation parameters.
As is observed in Table 3.3, the apparent hydrogen diffusivities found at the CP level of -0.8
were higher than diffusivity values at other CP potentials and OCP condition. They are close to
the lattice hydrogen diffusivities reported in the literature [9, 14]. This can be explained by the
fact that application of a small CP level reduces corrosion and corrosion product formation.
Consequently, the effect of corrosion product layer on delaying hydrogen passage from near
surface to the sub-surface layer is minimized and this diffusivity value can be more
representative of the lattice hydrogen diffusivity in X-65 steel. As the applied voltage was made
more negative, gradual formation of CaCO3 on the surface of specimens delayed hydrogen
ingress into the steel. Therefore, with the application of more negative CP levels the apparent
hydrogen diffusivity decreased.
CP level
(V SCE) × 10
6
(A)
Hydrogen Diffusivity
(× 107 (cm
2/s))
CP=0 (OCP) 0.98±0.13 4.49 ± 0.61
CP= -0.8 1.19±0.15 9.51±0.78
CP= -0.9 1.04±0.003 5.24±1.1
CP = -1 1.08 8.43
CP = -1.l 2.39 11.4
CP= -1.2 2.67±0.44 5.52±0.98
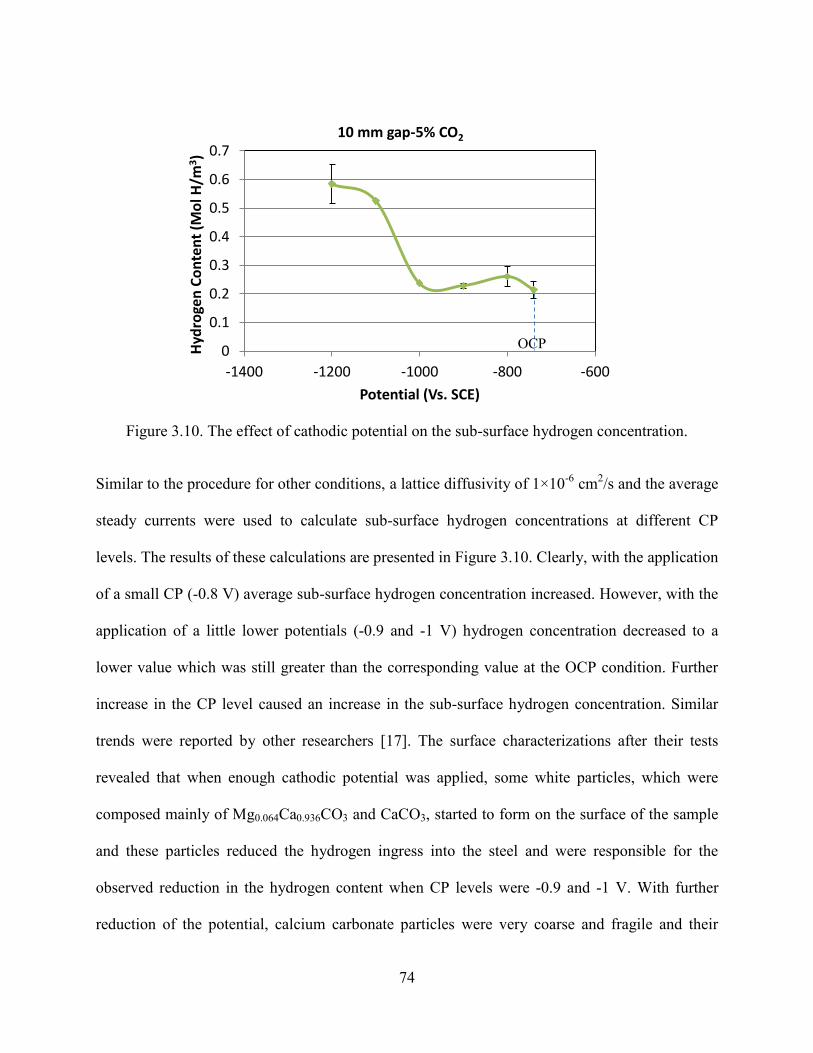
74
Figure 3.10. The effect of cathodic potential on the sub-surface hydrogen concentration.
Similar to the procedure for other conditions, a lattice diffusivity of 1×10⁻⁶
cm2/s and the average
steady currents were used to calculate sub-surface hydrogen concentrations at different CP
levels. The results of these calculations are presented in Figure 3.10. Clearly, with the application
of a small CP (-0.8 V) average sub-surface hydrogen concentration increased. However, with the
application of a little lower potentials (-0.9 and -1 V) hydrogen concentration decreased to a
lower value which was still greater than the corresponding value at the OCP condition. Further
increase in the CP level caused an increase in the sub-surface hydrogen concentration. Similar
trends were reported by other researchers [17]. The surface characterizations after their tests
revealed that when enough cathodic potential was applied, some white particles, which were
composed mainly of Mg0.064Ca0.936CO3 and CaCO3, started to form on the surface of the sample
and these particles reduced the hydrogen ingress into the steel and were responsible for the
observed reduction in the hydrogen content when CP levels were -0.9 and -1 V. With further
reduction of the potential, calcium carbonate particles were very coarse and fragile and their
0
0.1
0.2
0.3
0.4
0.5
0.6
0.7
-1400 -1200 -1000 -800 -600
Hyd
roge
n C
on
ten
t (M
ol H
/m3)
Potential (Vs. SCE)
10 mm gap-5% CO2
OCP
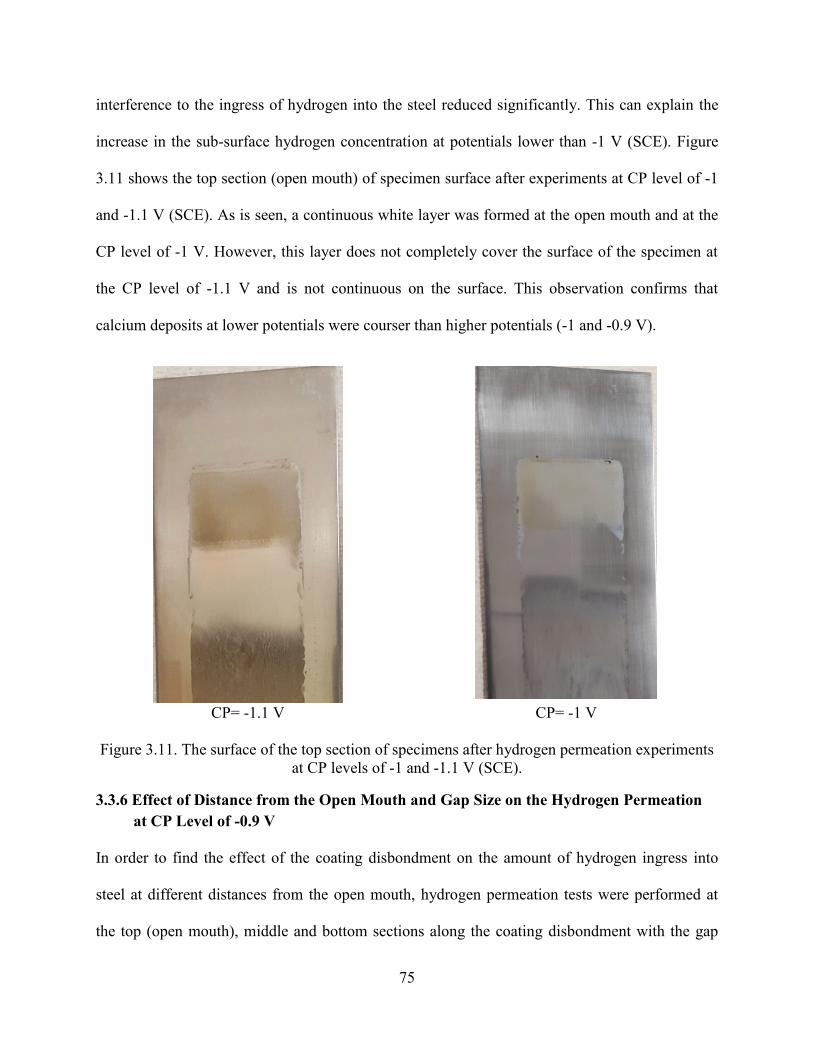
75
interference to the ingress of hydrogen into the steel reduced significantly. This can explain the
increase in the sub-surface hydrogen concentration at potentials lower than -1 V (SCE). Figure
3.11 shows the top section (open mouth) of specimen surface after experiments at CP level of -1
and -1.1 V (SCE). As is seen, a continuous white layer was formed at the open mouth and at the
CP level of -1 V. However, this layer does not completely cover the surface of the specimen at
the CP level of -1.1 V and is not continuous on the surface. This observation confirms that
calcium deposits at lower potentials were courser than higher potentials (-1 and -0.9 V).
CP= -1.1 V CP= -1 V
Figure 3.11. The surface of the top section of specimens after hydrogen permeation experiments
at CP levels of -1 and -1.1 V (SCE).
3.3.6 Effect of Distance from the Open Mouth and Gap Size on the Hydrogen Permeation
at CP Level of -0.9 V
In order to find the effect of the coating disbondment on the amount of hydrogen ingress into
steel at different distances from the open mouth, hydrogen permeation tests were performed at
the top (open mouth), middle and bottom sections along the coating disbondment with the gap
76
size of 10 mm while a cathodic potential of -0.9 V was applied to the open mouth of the
disbondment. Since previous experiments at OCP condition showed that detected hydrogen
concentration differences between the middle and bottom section are not significant at narrower
gap sizes, hydrogen permeation tests were also performed at the top and bottom section at the
narrower gap size of 5 mm and the same CP level. Figure 3.12 shows the variation of subsurface
hydrogen concentration at different locations along the disbondment at two gap size of 10 and 5
mm. At both gap sizes, sub-surface hydrogen content decreased with increasing the distance
from the open mouth of the disbondment. Based on the results presented in the last section, it is
expected that with the shielding of cathodic potential by the coating and consequently increase in
potential with distance from the open mouth, hydrogen content initially increases and then
decreases as the potential reaches OCP potential. Potential measurement at the middle section
along the disbondment showed that after two-day hydrogen permeation test, the potential was
about -760 mV (SCE) which is close to the OCP potentials found in this study (-700 to -745 mV
(SCE)). As the bottom section is located much further from the open mouth, it will have an OCP
potential for sure. So detection of lower sub-surface hydrogen concentration at the middle and
bottom sections is justified based on their potentials. It is also expected that the steel in the half
way from open mouth to the middle section experience a potential close to -0.8 V (SCE) and
therefore will have the highest sub-surface hydrogen content along the disbondment.
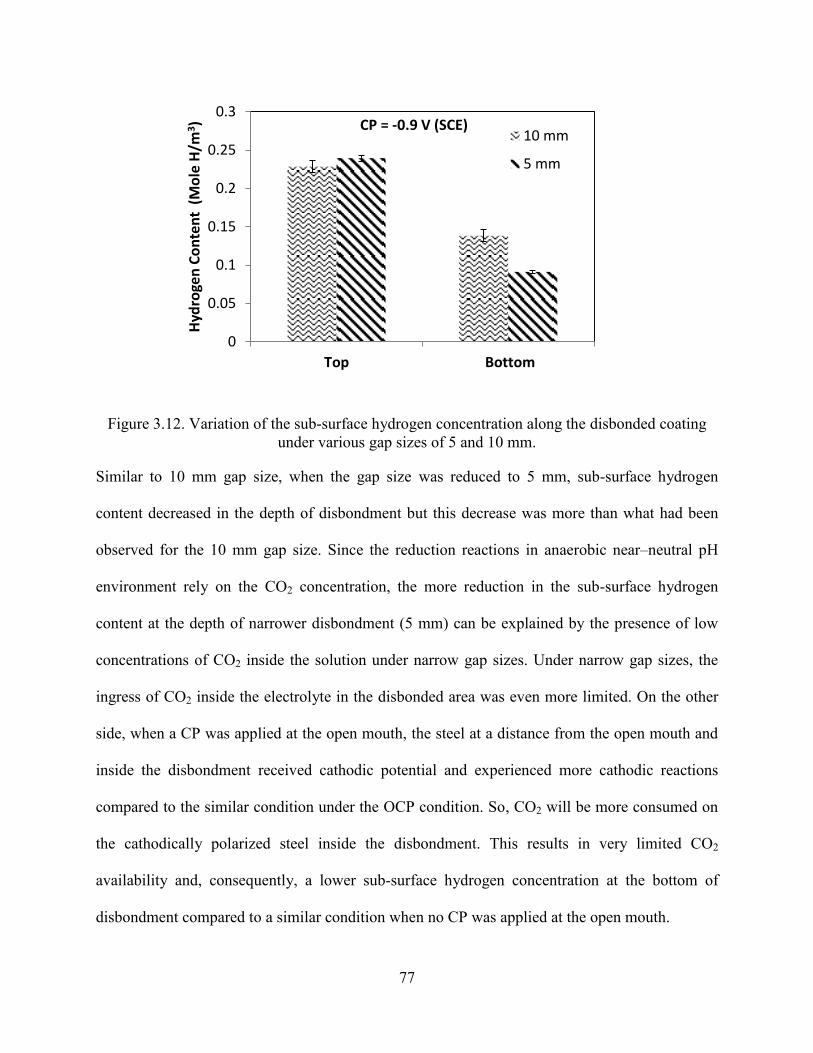
77
Figure 3.12. Variation of the sub-surface hydrogen concentration along the disbonded coating
under various gap sizes of 5 and 10 mm.
Similar to 10 mm gap size, when the gap size was reduced to 5 mm, sub-surface hydrogen
content decreased in the depth of disbondment but this decrease was more than what had been
observed for the 10 mm gap size. Since the reduction reactions in anaerobic near–neutral pH
environment rely on the CO2 concentration, the more reduction in the sub-surface hydrogen
content at the depth of narrower disbondment (5 mm) can be explained by the presence of low
concentrations of CO2 inside the solution under narrow gap sizes. Under narrow gap sizes, the
ingress of CO2 inside the electrolyte in the disbonded area was even more limited. On the other
side, when a CP was applied at the open mouth, the steel at a distance from the open mouth and
inside the disbondment received cathodic potential and experienced more cathodic reactions
compared to the similar condition under the OCP condition. So, CO2 will be more consumed on
the cathodically polarized steel inside the disbondment. This results in very limited CO2
availability and, consequently, a lower sub-surface hydrogen concentration at the bottom of
disbondment compared to a similar condition when no CP was applied at the open mouth.
0
0.05
0.1
0.15
0.2
0.25
0.3
Top Bottom
Hyd
roge
n C
on
ten
t (
Mo
le H
/m3) CP = -0.9 V (SCE)
10 mm
5 mm
78
It is also good to mention that although experiments showed that the potential of -800 mV (SCE)
resulted in the highest sub-surface hydrogen concentration when considering cathodic potentials
near the OCP condition, if this potential occurs deep inside a disbondment, this observation may
not be valid. Depending on the applied potential at the open mouth, the location where
experiences -800 mV potential will change along the disbondment. At higher potentials, it is
expected that this location shifts toward the depth of disbondment. In that case, the lower
availability of CO2 deep inside the disbondment will result in a lower sub-surface hydrogen
concentration compared to the condition where -800 mV occurs at the open mouth or close to it.
3.4 Summary and Conclusions
A specially-designed Devanathan-Stachurski double cell was used in this chapter to simulate a
coating disbondment on X-65 pipeline steel plate exposed to near-neutral pH soil environment
and at the same time to measure hydrogen permeation along the disbondment. This set-up
provided valuable information on the amount of available hydrogen at different regions along a
disbondment. The results of this chapter showed that corrosion behaviour along and hydrogen
concentration inside the steel varied with changing the gap size between the disbonded coating
and pipeline. When the gap size was narrow, corrosion reduced appreciably inside the disbonded
area. However, the average sub-surface hydrogen concentration was the highest at the
intermediate gap size of 5 mm. So the results suggest that coating condition should be considered
in the current corrosion preventive approaches in the field. These approaches can be based on the
information about coating condition which is obtained during digging process.
In addition, the results of this chapter demonstrated that changing CO2 concentration does not
affect hydrogen absorption appreciably. Therefore, higher CO2 levels do not necessarily cause
higher hydrogen concentrations inside the steel. Since corrosion rate is high at very high levels of
79
CO2, an appreciable amount of hydrogen atoms may produce on the surface. However, the
formation of the thick layer of corrosion products reduces absorption of all these hydrogen atoms
on the steel. These results suggest that lower growth rates can be expected when the soil solution
has high CO2 concentrations (during spring) compared to seasons when the CO2 level is low in
the soil (winter) . This can be the case because the amount of absorbed hydrogen, which can
cause crack growth, is almost the same in both conditions but higher corrosion rates occurring at
high CO2 concentrations result in crack bluntness by corrosion and, consequently, reduce the
mechanical driving force for crack growth.
It was also shown that at potentials close to OCP, where NNpH SCC can occur, the highest
average hydrogen content was at a potential about 60 mV cathodic with respect to the OCP
potential. Lower potentials resulted in a decrease in the sub-surface hydrogen concentration.
These findings can be used when selecting an appropriate cathodic potential level for pipelines in
the field.
80
References
[1] R. N. Parkins, W. K. J. Blanchard, and B. S. Delanty, Transgranular Stress Corrosion
Cracking of High-Pressure Pipelines in Contact with Solutions of Near Neutral pH,
Corrosion 50 (5), p. 394-408.
[2] W.Chen , R. Kania, R. Worthingham, G.V. Boven, Transgranular crack growth in the
pipeline steels exposed to near-neutral pH soil aqueous solutions: The role of hydrogen,
Acta Materialia 57, p. 6200–6214.
[3] H.H. Uhlig, T.N. Rhodin, editors. Physical metallurgy of stress corrosion fracture. New
York: Inter science; 1959. p. 6
[4] A. Egbewande, W. Chen, R. Eadie , R. Kania , G. V. Boven , R. Worthingham , J. Been,
Transgranular crack growth in the pipeline steels exposed to near-neutral pH soil aqueous
solutions: Discontinuous crack growth mechanism, Corr. Sci. 83, p. 343–354.
[5] W. Chen, An overview of near-neutral pH SCC in pipelines and mitigation strategies for its
initiation and growth, Corrosion 72 (7), p. 962-977.
[6] L.J. Qiao, J.L. Luo, X. Mao, Hydrogen evolution and enrichment around stress corrosion
crack tips of pipeline steels in dilute bicarbonate solution, Corrosion 54(2), p.115-120.
[7] W. Chen, S.H. Wang, R. Chu, F. King, T.R. Jack, R.R. Fessler, Effect of precyclic loading on
stress-corrosion-cracking initiation in an X-65 pipeline steel exposed to near-neutral pH
soil environment, Metall. Mater. Trans. A 34 , p.2601–2608.
[8] R. Chu, W. Chen, S.H. Wang, F. King, T.R. Jack, R.R. Fessler, Microstructure dependence of
stress corrosion cracking initiation in X-65 pipeline steel exposed to a near-neutral pH soil
environment, Corrosion 60 , p.275–283.
[9] Y.F. Cheng, Analysis of electrochemical hydrogen permeation through X-65 pipeline steel
and its implications on pipeline stress corrosion cracking, International Journal of
Hydrogen Energy 32, p. 1269 – 1276.
[10] M.C. Yan, J.Q. Wang, E.H. Han, W. Ke, Electrochemical measurements using combination
microelectrode in crevice simulating disbonded of pipeline coatings under cathodic
protection, Corros. Eng. Sci. Tec. 42, p.42–49.
[11] K. Chevil, W. Chen, G.V. Boven, R. Kania, J. Been, Correlating corrosion field data with
experimental findings for the development of pipeline mitigation strategies, Proceedings of
the 2014 International Pipeline Conference, Calgary, Canada, paper No. IPC-2010-33678.
81
[12] M. Yan, C Sun, J. Xu, T. Wu, S. Yang, W. Ke, EIS analysis on stress corrosion initiation of
pipeline steel under disbonded coating in near-neutral pH simulated soil electrolyte, Corr.
Sci. 110, p. 23–34.
[13] A.Q. Fu, X. Tang, Y.F. Cheng, Characterization of corrosion of X70 pipeline steel in thin
electrolyte layer under disbonded coating by scanning Kelvin probe, Corr. Sci. 51 , p. 186–
190.
[14] E. Fallahmohammadi, F. Bolzoni, L. Lazzari, Measurement of lattice and apparent diffusion
coefficient of hydrogen in X65 and F22 pipeline steels, International Journal of Hydrogen
Energy 3 8, p. 2531-254.
[15] B. Gu, W.Z. Yu, J.L. Luo, X. Mao, Transgranular stress corrosion cracking of X-80 and X-
52 pipeline steels in dilute aqueous solution with near-neutral pH, Corrosion 55(3), p.312-
318.
[16] J.T. Johnson, C.L. Durr, J.A. Beavers, B.S. Delanty, Effects of O2 and CO2 on near-neutral-
pH stress corrosion crack propagation, Proc. Corrosion 2000, NACE International
(Houston, TX), paper no. 00356.
[17] D.X. He, W. Chen, J.L. Luo, Effect of Cathodic Potential on Hydrogen Contentin a Pipeline
Steel Exposed to NS4 Near-Neutral pH Soil Solution, Corrosion 60 (8), p.778-786.
82
Chapter 4: Developing a Pre-Pitting Procedure
for Near-Neutral pH Stress Corrosion Crack
Initiation Studies on X-52 Pipeline Steel
83
This and next chapters of this thesis present experiments which were performed in the second
stage of the research and focus on crack initiation stage of NNpH SCC cracking. A pre-pitting
procedure is introduced in this chapter which will be used in the following chapter for the crack
initiation experiments to reduce the duration of the crack initiation process.
4.1 Introduction
Stress corrosion cracking (SCC) of pipeline steels has been known to be a major threat for both
gas and oil pipelines since the 1960s when the first rupture of pipelines occurred by SCC. Two
forms of SCC found in pipelines so far are known as high pH SCC and near-neutral pH SCC.
The name of each SCC refers to pH of the aqueous environment found under the coating on
pipelines. In near-neutral pH SCC cases, the crack initiation step takes the main portion of
pipeline life. It takes several years after coating failure for cracks to initiate in the pipelines and
this kind of crack is most likely to initiate from the bottom of corrosion pits [1-3]. Corrosion pits
are known to have two adverse effects which are: 1) producing an aggressive localized
environment inside the pits which can maintain an active state at the pit bottom; whereas, outside
the pit may be passive. This aggressive solution inside the pits is characterized by a higher
aggressive ions concentration and a lower pH [4]. 2) pits acts as stress risers and cause higher
stress levels which sometimes may reach the plasticity limit. As mentioned by some researchers,
plastic deformation around the pits can enhance corrosion since the strained region has a higher
internal energy level and is more prone to corrosion [5].
Crack initiation has been a topic of interest for researchers in the last several years, but since its
experiments are long-term (it takes several years for pits to develop and grow to cause cracking
in the field) the amount of research around crack initiation has been limited. It has been shown in
a recent research paper that no cracks nucleated from the bottom of pits under a realistic

84
condition in the near-neutral pH environment even after three months of loading [6]. Therefore,
some researchers have used accelerated laboratory tests to study the crack initiation process but
under these conditions pits may not grow to critical size before initiation of cracks and in this
way the effect of pits on crack initiation may be underestimated [7]. Conducting crack initiation
tests with pre-pitted specimens can reduce the duration of tests significantly. Therefore, the
objective of this chapter is to develop an electrochemically accelerated method to generate a low
density of pits on the surface of X-52 pipeline steel. These pre-pitted specimens can be used for
subsequent SCC experiments to study crack initiation from pits. It was deemed desirable to learn
more about pit characteristics in bicarbonate/carbonate solution which was used as the pitting
generation solution in this study and is believed to cause high pH SCC in pipelines.
4.2 Experimental
4.2.1 Material
An API 5L X-52 pipeline steel which had been in service for more than ten years was used in
this study. Figure 4.1 shows the SEM image of the pipeline steel microstructure which is mainly
composed of ferrite and pearlite. X-52 pipeline steel with this microstructure has been already
shown to be prone to both types of SCC [1]. The outside diameter and thickness of the pipeline
were 762 and 9.53 mm, respectively. Specimens with dimensions of 25, 10 and 4 mm were cut
from the pipeline for the experiments. The specimens were mounted in epoxy and then ground
up to 1200 grit SiC paper and cleaned in ethanol. To avoid any crevice corrosion at the interface
of samples and epoxy during the experiments, these interfaces were covered with a high-
performance sealant.
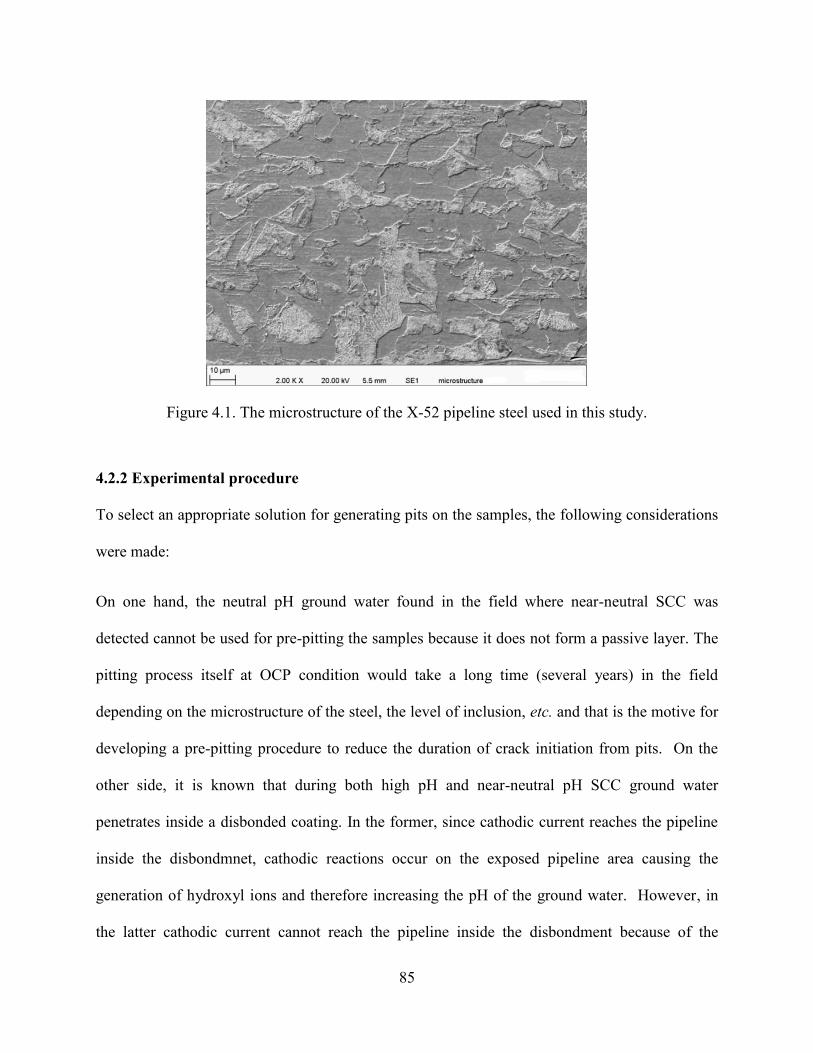
85
Figure 4.1. The microstructure of the X-52 pipeline steel used in this study.
4.2.2 Experimental procedure
To select an appropriate solution for generating pits on the samples, the following considerations
were made:
On one hand, the neutral pH ground water found in the field where near-neutral SCC was
detected cannot be used for pre-pitting the samples because it does not form a passive layer. The
pitting process itself at OCP condition would take a long time (several years) in the field
depending on the microstructure of the steel, the level of inclusion, etc. and that is the motive for
developing a pre-pitting procedure to reduce the duration of crack initiation from pits. On the
other side, it is known that during both high pH and near-neutral pH SCC ground water
penetrates inside a disbonded coating. In the former, since cathodic current reaches the pipeline
inside the disbondmnet, cathodic reactions occur on the exposed pipeline area causing the
generation of hydroxyl ions and therefore increasing the pH of the ground water. However, in
the latter cathodic current cannot reach the pipeline inside the disbondment because of the
86
shielding effect of the coating or high resistance soils surrounding the pipe. Either of these will
cause the pH to remain in the near-neutral range. The difference between these two ground
water solutions in terms of pitting corrosion is that the former, high pH SCC solution, forms a
passive layer on the surface of pipeline steel and pitting process and depth of pits could be
controlled by controlling the potential. But, as mentioned before the latter has no such a
capability. Therefore, using simulated ground water solution in the case of high pH SCC could
have less effect on further crack initiation in near-neutral pH ground water comparing to other
regular acidic solutions which promot pits on the surface of steels. These solutions can cause
hydrogen charging into the specimens and could affect subsequent crack initiation from pits.
After taking these considerations into account a bicarbonate/carbonate solution (0.5 M NaHCO3+
0.25 M Na2CO3) which is believed to cause high pH SCC in pipeline steels was selected as the
base solution. NaCl was added to the base solution to induce pitting on the surface of samples. A
series of cyclic polarization experiments were performed at different concentrations of NaCl to
determine the optimum NaCl concentration. Prior to the cyclic polarization experiments, the
samples were exposed to the solution for one hour and open circuit potential was monitored by a
Gamry PC4/300 potentiostat during this time. Cyclic polarization experiments were then
conducted from an initial potential 50 mV below open circuit potential with a scanning rate of 1
mV/s until a threshold current density of 0.1 mA/cm2 was reached. Each cyclic polarization test
was repeated three times to ensure the reproducibility of results.
After determination of the optimum concentration of NaCl, a series of polarization experiments
were performed inside this solution to generate small pits on the surface of samples. The general
procedure for generation of pits includes passivation of the surface at a passivating potential for a
short period of time and then increasing the potential above the pitting potential for a limited
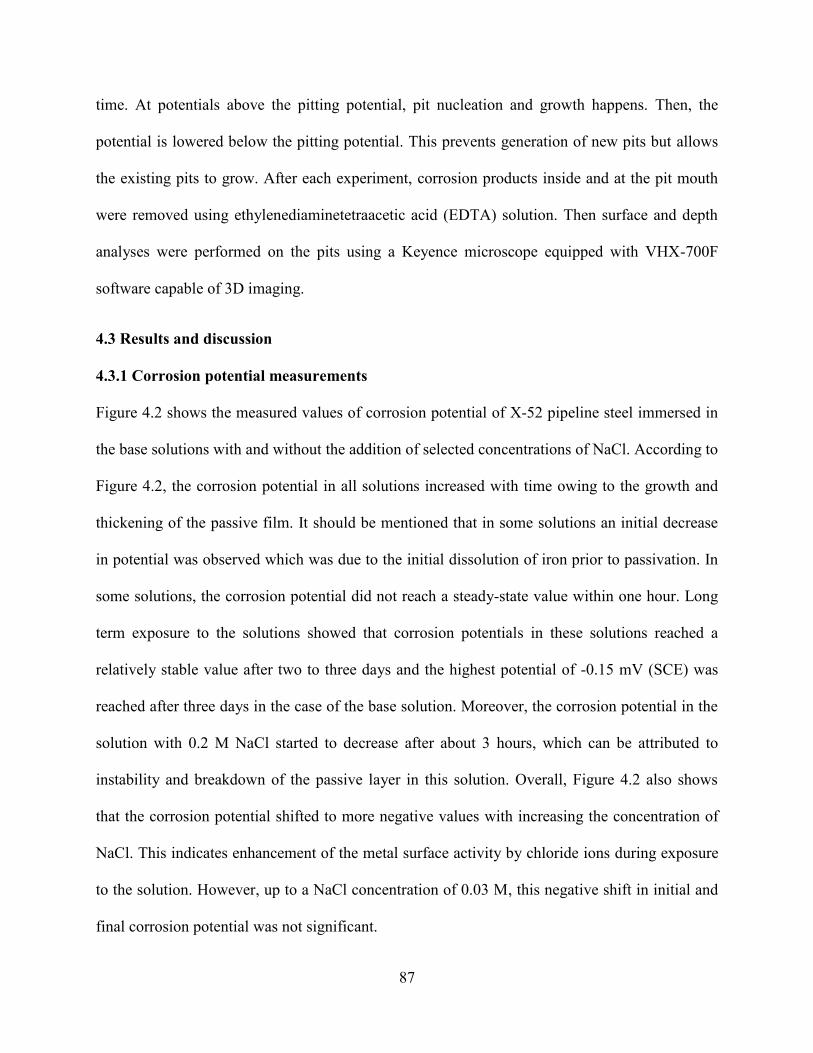
87
time. At potentials above the pitting potential, pit nucleation and growth happens. Then, the
potential is lowered below the pitting potential. This prevents generation of new pits but allows
the existing pits to grow. After each experiment, corrosion products inside and at the pit mouth
were removed using ethylenediaminetetraacetic acid (EDTA) solution. Then surface and depth
analyses were performed on the pits using a Keyence microscope equipped with VHX-700F
software capable of 3D imaging.
4.3 Results and discussion
4.3.1 Corrosion potential measurements
Figure 4.2 shows the measured values of corrosion potential of X-52 pipeline steel immersed in
the base solutions with and without the addition of selected concentrations of NaCl. According to
Figure 4.2, the corrosion potential in all solutions increased with time owing to the growth and
thickening of the passive film. It should be mentioned that in some solutions an initial decrease
in potential was observed which was due to the initial dissolution of iron prior to passivation. In
some solutions, the corrosion potential did not reach a steady-state value within one hour. Long
term exposure to the solutions showed that corrosion potentials in these solutions reached a
relatively stable value after two to three days and the highest potential of -0.15 mV (SCE) was
reached after three days in the case of the base solution. Moreover, the corrosion potential in the
solution with 0.2 M NaCl started to decrease after about 3 hours, which can be attributed to
instability and breakdown of the passive layer in this solution. Overall, Figure 4.2 also shows
that the corrosion potential shifted to more negative values with increasing the concentration of
NaCl. This indicates enhancement of the metal surface activity by chloride ions during exposure
to the solution. However, up to a NaCl concentration of 0.03 M, this negative shift in initial and
final corrosion potential was not significant.
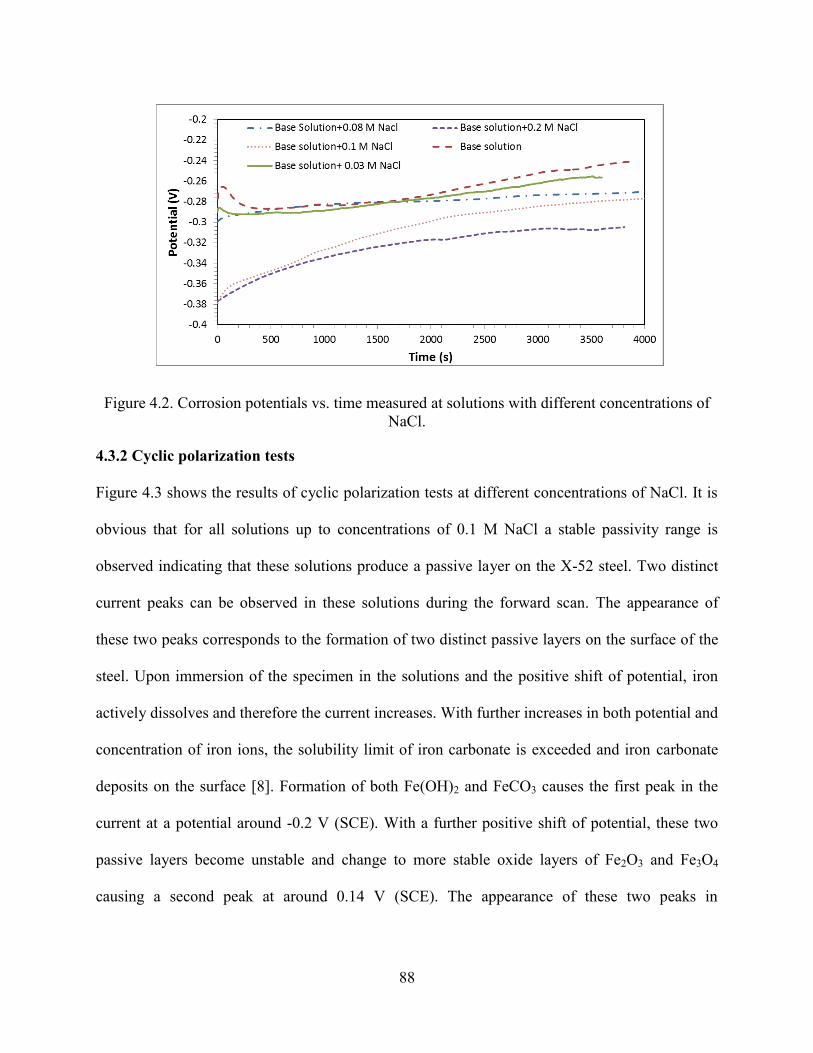
88
Figure 4.2. Corrosion potentials vs. time measured at solutions with different concentrations of
NaCl.
4.3.2 Cyclic polarization tests
Figure 4.3 shows the results of cyclic polarization tests at different concentrations of NaCl. It is
obvious that for all solutions up to concentrations of 0.1 M NaCl a stable passivity range is
observed indicating that these solutions produce a passive layer on the X-52 steel. Two distinct
current peaks can be observed in these solutions during the forward scan. The appearance of
these two peaks corresponds to the formation of two distinct passive layers on the surface of the
steel. Upon immersion of the specimen in the solutions and the positive shift of potential, iron
actively dissolves and therefore the current increases. With further increases in both potential and
concentration of iron ions, the solubility limit of iron carbonate is exceeded and iron carbonate
deposits on the surface [8]. Formation of both Fe(OH)2 and FeCO3 causes the first peak in the
current at a potential around -0.2 V (SCE). With a further positive shift of potential, these two
passive layers become unstable and change to more stable oxide layers of Fe2O3 and Fe3O4
causing a second peak at around 0.14 V (SCE). The appearance of these two peaks in
89
bicarbonate/carbonate solution is in a good agreement with reports in the literature and this has
been well studied before [8-10].
Figure 4.3. Cyclic polarization curves measured in the solutions with different concentrations of
NaCl.
According to Figure 4.3, up to a concentration of 0.08M NaCl, the current measured during the
reverse scan was lower than the current in the forward scan. This indicates that the sample
surface passivated during the reverse scan and no pitting occurs on the surface of the steel.
Surface analysis after the tests also showed no evidence of pitting on the surface of specimens
immersed in these solutions. On the other hand, the addition of chloride ions increased the
passivity current but had no significant effect on the transpassive potential and the passivity
potential range up to concentrations of 0.08 M NaCl. The increase in passivity current caused by
the addition of chloride ions has been attributed to the adsorption of chloride ions on the passive
layer and subsequent thinning of the passive layer and establishment of a new stationary state
90
with higher dissolution of iron [11]. At a concentration of 0.1 M NaCl the passive potential range
was reduced and pitting occurred at a potential around 0.4 V (SCE). This was inferred both from
surface analysis after the test and the fact that current during reverse scan was higher than the
forward scan. Since the reverse scan curve did not intersect the forward current in the passivity
range even at lower threshold current levels, no protection potential was obtained for this
solution (0.5 M NaHCO3+0.25 M Na2CO3+0.1 M NaCl) which is perhaps because of the large
surface area exposed to the solution. With further increase in the concentration of NaCl, the
passivity range decreased further and no passive range was observed at a concentration of 0.2 M
NaCl. X-52 steel showed active metal dissolution behaviour in this solution.
Clearly, solutions with NaCl concentration less than 0.1 M are too passive and solutions with
NaCl concentrations of 0.2 or more are too aggressive. The 0.5 M NaHCO3+0.25 M Na2CO3+0.1
M NaCl solution provided a balance between passivation of and aggressiveness and therefore
was selected for pit generation on X-52 specimens.
4.3.3 Pitting procedure
Broadly speaking, there are two methods for producing pits on the surface of specimens:
galvanostatic (current control) and potentiostatic (potential control). They are considered in turn.
In the galvanostatic method, the specimens are immersed in a pit-promoting solution at the
corrosion potential for a specific period of time during which their surface is passivated. Then a
fixed anodic current is applied to generate pits [12]. The pitting potential in this method depends
on the immersion time. Before reaching the steady-state condition in the passive layer at open
circuit potential, this layer is unstable and surface condition may vary from one sample to
another. In order to generate pits consistently on different specimens, it is essential to keep
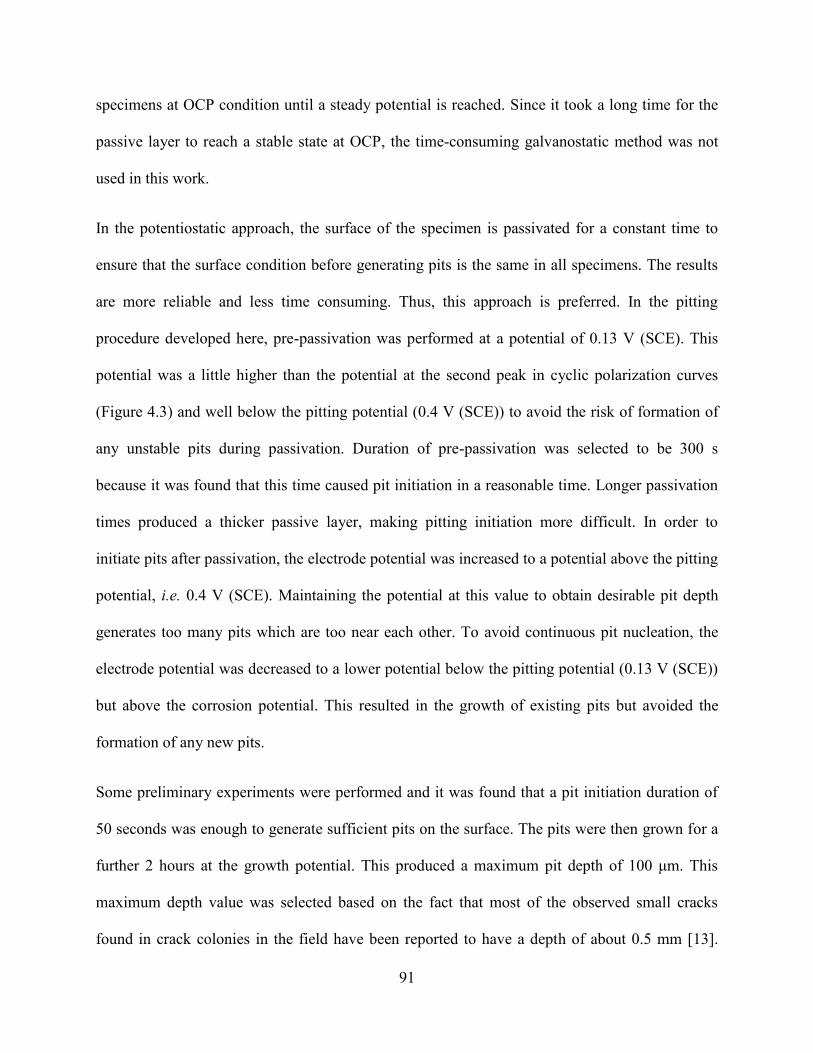
91
specimens at OCP condition until a steady potential is reached. Since it took a long time for the
passive layer to reach a stable state at OCP, the time-consuming galvanostatic method was not
used in this work.
In the potentiostatic approach, the surface of the specimen is passivated for a constant time to
ensure that the surface condition before generating pits is the same in all specimens. The results
are more reliable and less time consuming. Thus, this approach is preferred. In the pitting
procedure developed here, pre-passivation was performed at a potential of 0.13 V (SCE). This
potential was a little higher than the potential at the second peak in cyclic polarization curves
(Figure 4.3) and well below the pitting potential (0.4 V (SCE)) to avoid the risk of formation of
any unstable pits during passivation. Duration of pre-passivation was selected to be 300 s
because it was found that this time caused pit initiation in a reasonable time. Longer passivation
times produced a thicker passive layer, making pitting initiation more difficult. In order to
initiate pits after passivation, the electrode potential was increased to a potential above the pitting
potential, i.e. 0.4 V (SCE). Maintaining the potential at this value to obtain desirable pit depth
generates too many pits which are too near each other. To avoid continuous pit nucleation, the
electrode potential was decreased to a lower potential below the pitting potential (0.13 V (SCE))
but above the corrosion potential. This resulted in the growth of existing pits but avoided the
formation of any new pits.
Some preliminary experiments were performed and it was found that a pit initiation duration of
50 seconds was enough to generate sufficient pits on the surface. The pits were then grown for a
further 2 hours at the growth potential. This produced a maximum pit depth of 100 μm. This
maximum depth value was selected based on the fact that most of the observed small cracks
found in crack colonies in the field have been reported to have a depth of about 0.5 mm [13].
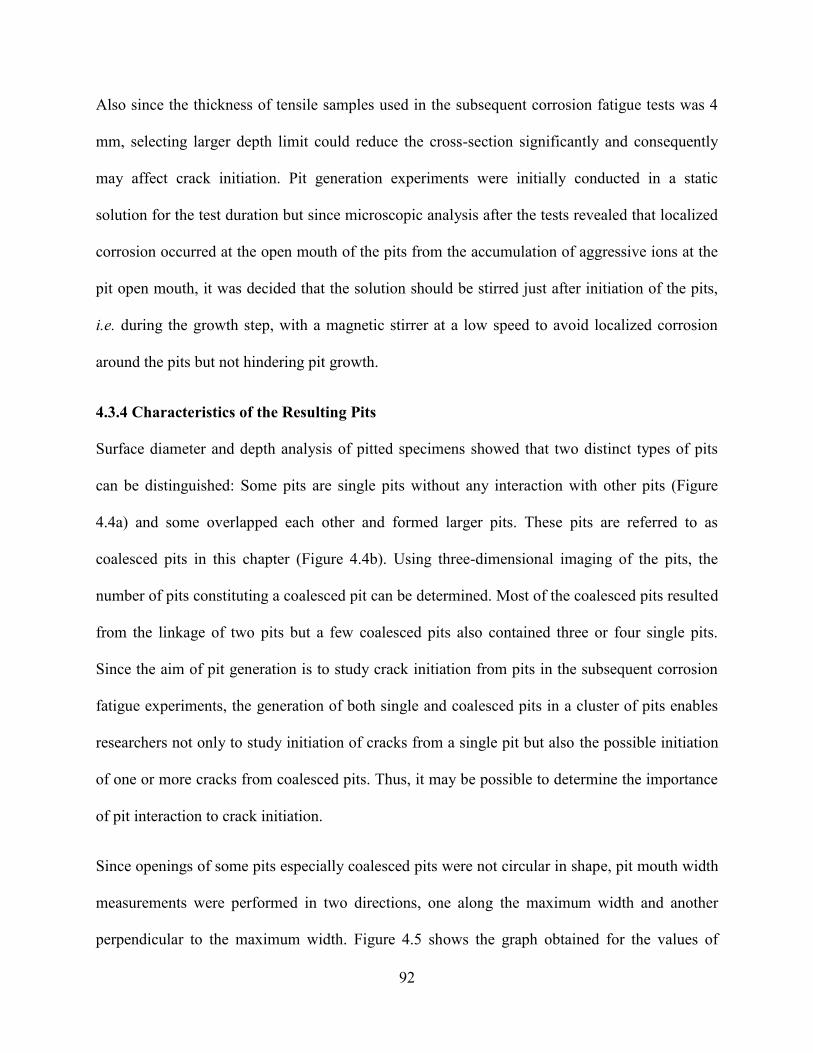
92
Also since the thickness of tensile samples used in the subsequent corrosion fatigue tests was 4
mm, selecting larger depth limit could reduce the cross-section significantly and consequently
may affect crack initiation. Pit generation experiments were initially conducted in a static
solution for the test duration but since microscopic analysis after the tests revealed that localized
corrosion occurred at the open mouth of the pits from the accumulation of aggressive ions at the
pit open mouth, it was decided that the solution should be stirred just after initiation of the pits,
i.e. during the growth step, with a magnetic stirrer at a low speed to avoid localized corrosion
around the pits but not hindering pit growth.
4.3.4 Characteristics of the Resulting Pits
Surface diameter and depth analysis of pitted specimens showed that two distinct types of pits
can be distinguished: Some pits are single pits without any interaction with other pits (Figure
4.4a) and some overlapped each other and formed larger pits. These pits are referred to as
coalesced pits in this chapter (Figure 4.4b). Using three-dimensional imaging of the pits, the
number of pits constituting a coalesced pit can be determined. Most of the coalesced pits resulted
from the linkage of two pits but a few coalesced pits also contained three or four single pits.
Since the aim of pit generation is to study crack initiation from pits in the subsequent corrosion
fatigue experiments, the generation of both single and coalesced pits in a cluster of pits enables
researchers not only to study initiation of cracks from a single pit but also the possible initiation
of one or more cracks from coalesced pits. Thus, it may be possible to determine the importance
of pit interaction to crack initiation.
Since openings of some pits especially coalesced pits were not circular in shape, pit mouth width
measurements were performed in two directions, one along the maximum width and another
perpendicular to the maximum width. Figure 4.5 shows the graph obtained for the values of
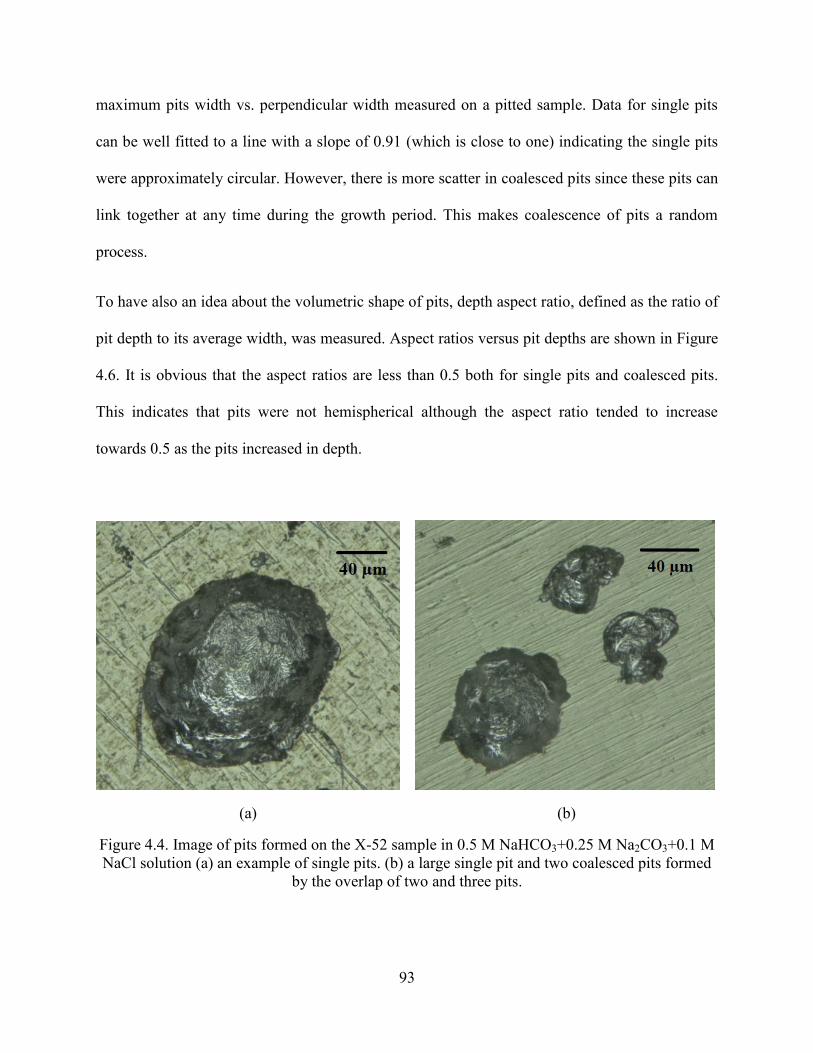
93
maximum pits width vs. perpendicular width measured on a pitted sample. Data for single pits
can be well fitted to a line with a slope of 0.91 (which is close to one) indicating the single pits
were approximately circular. However, there is more scatter in coalesced pits since these pits can
link together at any time during the growth period. This makes coalescence of pits a random
process.
To have also an idea about the volumetric shape of pits, depth aspect ratio, defined as the ratio of
pit depth to its average width, was measured. Aspect ratios versus pit depths are shown in Figure
4.6. It is obvious that the aspect ratios are less than 0.5 both for single pits and coalesced pits.
This indicates that pits were not hemispherical although the aspect ratio tended to increase
towards 0.5 as the pits increased in depth.
(a) (b)
Figure 4.4. Image of pits formed on the X-52 sample in 0.5 M NaHCO3+0.25 M Na2CO3+0.1 M
NaCl solution (a) an example of single pits. (b) a large single pit and two coalesced pits formed
by the overlap of two and three pits.
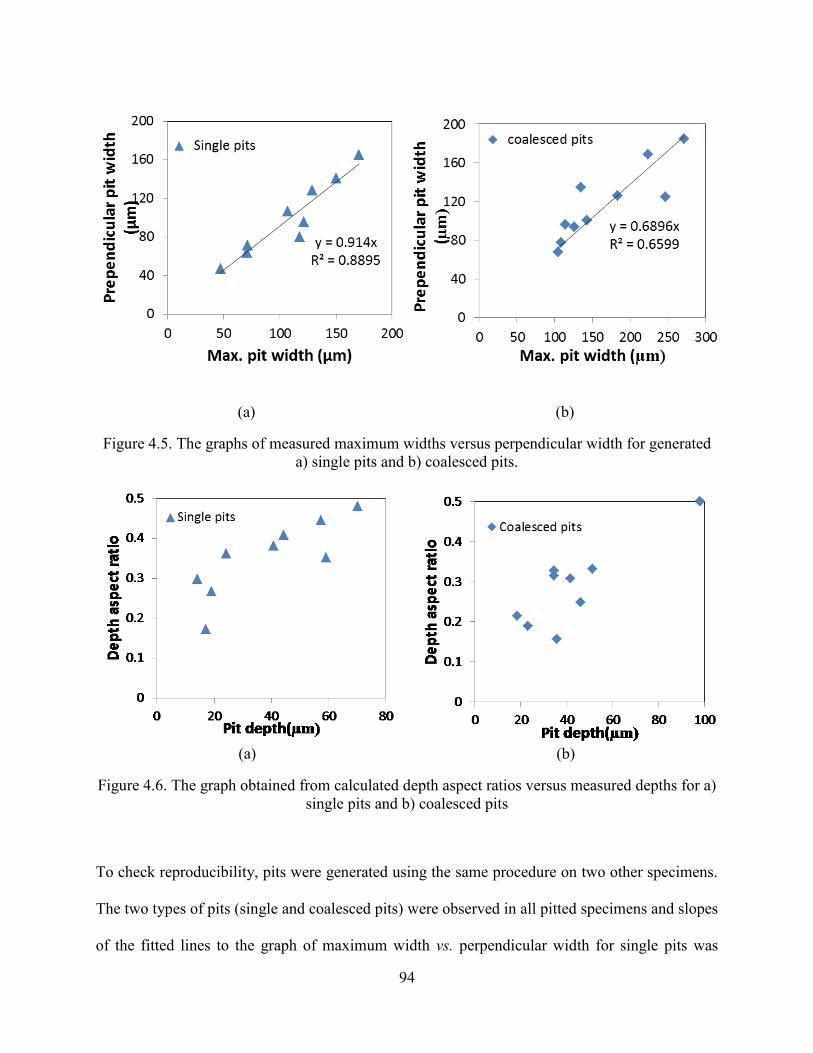
94
(a) (b)
Figure 4.5. The graphs of measured maximum widths versus perpendicular width for generated
a) single pits and b) coalesced pits.
(a) (b)
Figure 4.6. The graph obtained from calculated depth aspect ratios versus measured depths for a)
single pits and b) coalesced pits
To check reproducibility, pits were generated using the same procedure on two other specimens.
The two types of pits (single and coalesced pits) were observed in all pitted specimens and slopes
of the fitted lines to the graph of maximum width vs. perpendicular width for single pits was
95
obtained to be in the range of 0.85 to 0.94 indicating single pits remained almost circular in all
specimens. However, the slopes of the fitted lines for coalesced pits varied in a wide range of
0.35 to 0.76 proving coalescence of pits to be a random process with a range of possible results.
It is also noteworthy that just one coalesced pit generated on the first sample had a depth aspect
ratio of 0.49 (figure 4.6b) but all other coalesced pits in all tested samples had depth aspect ratios
less than 0.4 confirming the generation of non-hemispherical pits during two hours of growth. If
the pits were allowed to grow for a longer time, the aspect ratio would approximate 0.5 and pits
would become hemispherical in shape.
4.3.5 Pitting Mechanism
Several models have been proposed for initiation of pits on the surface of metals, but the
common point in all the models is the adsorption of an aggressive ion, such as chloride, on the
passive surface. The explanation of initiation of pits in bicarbonate/carbonate solution relies on
the point defect model (PDM) because of the observed increase in the donor density of the
passive film with adsorption of chloride ions on the film [14-15]. According to the point defect
model (PDM) [16], chloride ions react with oxygen vacancies and form autocatalytic
cation/oxygen vacancy pairs, which propagate through the passive layer and reach the metal
substrate causing local detachment of the film. This area, with detached passive film, acts as an
initiation site for pitting corrosion on the underlying metal surface. It is believed that, similar to
what has been reported for stainless steels [17-18], the initiation of stable pits starts with the
formation of metastable pits at the micron size level. This was inferred both from the very small
current peaks observed just before the trans-passive potential or pitting potential in
potentiodynamic curves of the solutions with 0.08 M and 0.1 M NaCl, respectively (Figure 4.3),
and also from potentiostatic experiments conducted at more active potentials than the pitting
96
potential but close to it. At potentials below the pitting potential, the depth of metastable pits was
insufficient to maintain an aggressive environment inside the pit for continuous growth.
However, the presence of a salt film cover over the pit mouth acted as a barrier for diffusion and
dilution of the pit environment. If this cover was broken, metastable pit growth would be
terminated and the pit surface would repassivate. This was observed at potentials up to 200 mV
lower than the pitting potential. The transition from metastable to stable pit growth was achieved
when the metastable pit had grown to a sufficient size to maintain an aggressive electrolyte
inside the pit for continuous growth. This was not achieved until the potential was raised to the
pitting potential.
During the pitting procedure, maintaining the potential above the pitting potential, i.e 400 mV
(SCE), allowed metastable pits to grow enough to pass the metastable growth stage. In the stable
growth stage, the metal inside the pit will be active and the pit will continue to grow. Once the
potential is decreased well below the pitting potential to avoid the formation of new metastable
pits, the rate of dissolution starts to decrease. After some time, this rate will become lower than
the rate of diffusion of metal ions outside the pit cavity. Therefore, the environment inside the pit
will not remain aggressive and the pit repassivates [19]. In the developed procedure,
repassivation of pits took place after reaching the maximum depth of 100 μm.
4.4 Applicability of Pre-Pitting Procedure for SCC Studies in Pipelines
Field investigations showed that 95% of the crack population developed in near-neutral pH
environments are blunt cracks and have a depth less than 1 mm [20], which is equal to 10% of
wall thickness for a pipe with a thickness of 10 mm. It is also now believed that the growth of
the other 5 % sharp cracks is not continuous and it involves intervals of dormancy (blunting) and
growth [21]. So, it is reasonable to conclude that the other 5% of cracks population, which may
97
lead to fracture of pipelines, has passed the dormancy stage (depth less than 1 mm) at one time.
Considering these cracks might have been initiated from a pit, the pits should have a depth far
less than 1 mm, i.e. 10% of the wall thickness, and would not be considered significant from an
industrial perspective. The precursor pits to the „small cracks‟ found in association with
NNpHSCC have not been documented so we are not able to compare them with the pits
produced here. However, once a pipeline has failed due to the propagation of cracks beyond the
critical size, some information regarding field pits can be obtained by analyzing regions near the
fracture area. But since the pits observed near these cracking zones are shallow, little accurate
information is available on their sizes. It is planned to show that the pits grown here can be
precursors to the kind of cracks found in pipeline failures associated with near-neutral pH
failures. Figure 7 shows such pitting corrosion in near-neutral environment found near the site of
rupture of a buried pipeline after field service for about 19 years. As you see, some cracks and
pits had been developed on the surface. Even though the observed pits cluster could be large in
length because of overlapping of several pits, they are shallow. In the developed pitting
procedure, both overlapped and single pits were generated similar to what is observed in the
field. But fewer pits were generated and they are more dispersed than observed pits in the field.
This was done intentionally to avoid many interactions between cracks that would initiate from
the pits in SCC tests.
In addition, it was thought that the most likely source of pits in near-neutral environments was a
carbonate/bicarbonate environment which was exposed to cathodic protection conditions during
the progressive failure of the coating. At a later stage of the coating failure, the region may be
shielded when the failed coating configuration changes and the aqueous solution could revert to a
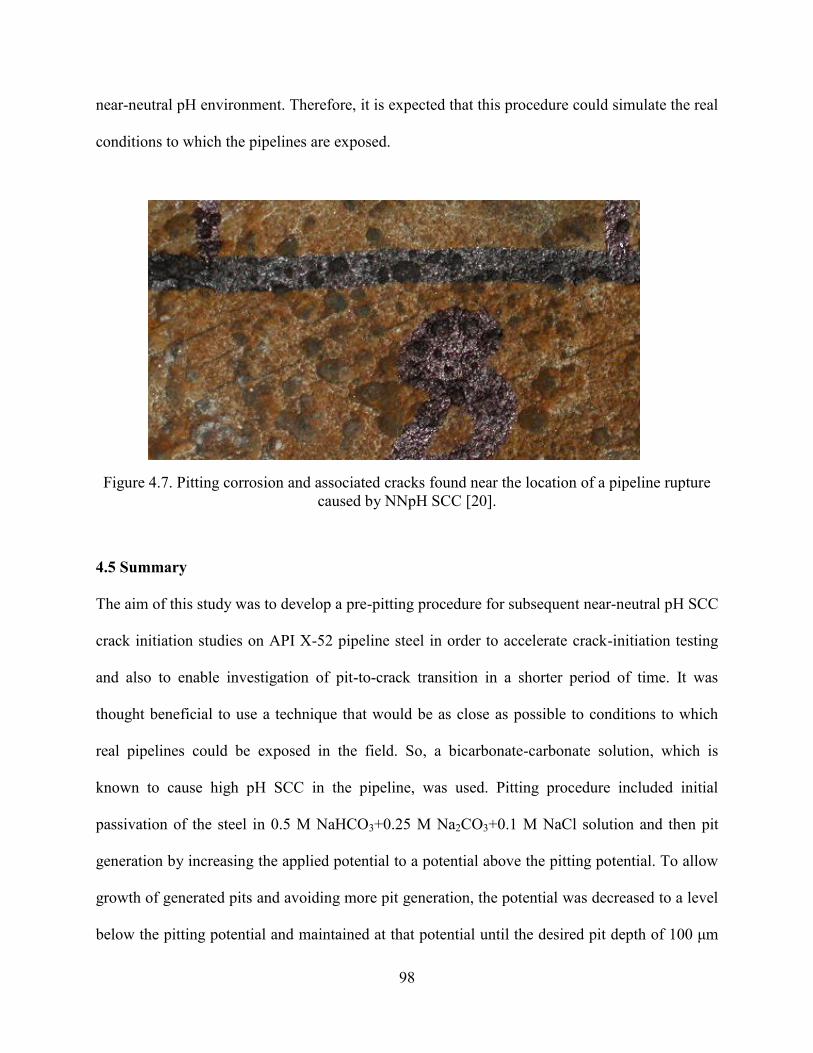
98
near-neutral pH environment. Therefore, it is expected that this procedure could simulate the real
conditions to which the pipelines are exposed.
Figure 4.7. Pitting corrosion and associated cracks found near the location of a pipeline rupture
caused by NNpH SCC [20].
4.5 Summary
The aim of this study was to develop a pre-pitting procedure for subsequent near-neutral pH SCC
crack initiation studies on API X-52 pipeline steel in order to accelerate crack-initiation testing
and also to enable investigation of pit-to-crack transition in a shorter period of time. It was
thought beneficial to use a technique that would be as close as possible to conditions to which
real pipelines could be exposed in the field. So, a bicarbonate-carbonate solution, which is
known to cause high pH SCC in the pipeline, was used. Pitting procedure included initial
passivation of the steel in 0.5 M NaHCO3+0.25 M Na2CO3+0.1 M NaCl solution and then pit
generation by increasing the applied potential to a potential above the pitting potential. To allow
growth of generated pits and avoiding more pit generation, the potential was decreased to a level
below the pitting potential and maintained at that potential until the desired pit depth of 100 μm

99
reached. This procedure produced a suitable density of single and coalesced pits on the surface.
These pits had depth-to-diameter ratios less than those for hemispherical pits.
100
References
[1] National Energy Board (NEB), „Public Enquiry Concerning Stress Corrosion Cracking on
Canadian Oil and Gas Pipelines‟, report #MH-2-95, 1996, p.18.
[2] M. Baker Jr. Inc., Stress Corrosion Cracking Study- Final Report, Department of
Transportation Research and Special Programs Administration Office of Pipeline Safety-
Integrity management program delivery order DTRS56-02-D-70036, 2005, p. 20.
[3] S.Sh. Abedi, A. Abdolmaleki, N. Adibi, Failure analysis of SCC and SRB induced cracking
of a transmission oil products pipeline, Engineering Failure Analysis14 (1), p.250–261.
[4] P. Ernst, R.C. Newman, „Pit growth studies in stainless steel foils. I. Introduction and pit
growth kinetics‟, Corr. Sci.44(5), p.927–941.
[5] B. Fang, R.L. Eadie, M. Elboudjaini, Blunt crack initiation and its transition to sharp cracks
in pipeline steel in near-neutral pH solution, Proceedings of the 2012 International Pipeline
Conference, Canada, Paper No. 90088.
[6] A. Eslami, B. Fang, R. Kania, B. Worthingham, J. Been, R. Eadie, W. Chen, „Stress
corrosion cracking initiation under the disbonded coating of pipeline steel in near-neutral
pH environment‟, Corr. Sci. 52, p.3750–56.
[7] S.Zhou, A. Turnbull, Development of prepitting procedure for turbine disc steel, British
Corrosion 35(1), p. 1-5.
[8] H.B. Xue and Y.F. Cheng, Passivity and Pitting Corrosion of X80 Pipeline Steel in
Carbonate/Bicarbonate Solution Studied by Electrochemical Measurements, Materials
Engineering and Performance19, (9), p.1311.
[9] J.L. Zhou, X.G. Li, C.W. Du, Y. Pan, T. Li and Q. Liu, „Passivation process of X80 pipeline
steel in bicarbonate solutions, Int. J. Minerals, Metallurgy and Materials, 2011,18, (2), 178
[10] F. F. Eliyan, E. Mahdi, A. Alfantazi, „Investigating the Corrosion of API-X100 Pipeline
Steel in Aerated Carbonate Solutions by Electrochemical Methods, Int. J. Electrochem.
Sci. 8, p. 578 – 590.
[11] H. H. Strehblow, „Breakdown of passivity and localized corrosion: Theoretical concepts and
fundamental experimental results‟, Materials and Corrosion 35(10), p.437-448.
[12] S. Frangini, N. De Cristofaro, Analysis of the galvanostatic polarization method for
determining reliable pitting potentials on stainless steels in crevice-free conditions, Corr.
Sci., 45(12), p. 2769–2786.
101
[13] W. Bouaeshi, S. Ironside, and R. Eadie, Research and Cracking Implications from an
Assessment of Two Variants of Near-Neutral pH Crack Colonies in Liquid Pipelines,
Corrosion 63 (7), p. 648.
[14] D.G. Li, Y.R. Feng , Z.Q. Bai, J.W. Zhu, M.S. Zheng, Influence of temperature, chloride
ions and chromium element on the electronic property of passive film formed on carbon
steel in bicarbonate/carbonate buffer solution, Electrochimica Acta 52, p. 7877–84.
[15] G. S. Frankel, „Pitting Corrosion of Metals A Review of the Critical Factors, J.
Electrochem. Soc., 1998 ,145, (6), 2186-98.
[16] D. D. Macdonald, The Point Defect Model for the Passive State, J. Electrochem. Soc.139
(12), p. 3434-49.
[17] D.H. Kang, H.W. Lee, Study of the correlation between pitting corrosion and the component
ratio of the dual phase in duplex stainless steel welds, Corr. Sci.74, p. 396–407.
[18] R.K. Gupta, B.R.W. Hinton, N. Birbilis, The effect of chromate on the pitting susceptibility
of AA7075-T651 studied using potentiostatic transients, Corr. Sci. 82, p.197–207.
[19] G. T. Gaudet, W. T. Mo, T. A. Hatton, J. W. Tester, J. Tilly, H. S. Isaacs, R. C. Newman,
Mass Transfer and Electrochemical Kinetic Interactions in Localized Pitting Corrosion,
AIChE Journal 32 (6), p.949-958.
[20] W. Chen, R. Kania, R. Worthingham, G. V. Boven, „Transgranular crack growth in the
pipeline steels exposed to near-neutral pH soil aqueous solutions: The role of hydrogen‟,
Acta Materialia 57, p. 6200–6214.
[21] A. Egbewande, W. Chen, R. Eadie, R. Kania, G.V. Boven, R.Worthingham , J. Been,
Transgranular crack growth in the pipeline steels exposed to near-neutral pH soil aqueous
solutions: Discontinuous crack growth mechanism, Corr. Sci.83, p. 343–354.
[22] Z. Qin, B. Demko, J. Noël, D. Shoesmith, F. King, R. Worthingham, and K. Keith,
Localized Dissolution of Millscale-Covered Pipeline Steel Surfaces, Corrosion 60 (10),
p.906.
102
Chapter 5: Effect of Hydrostatic Testing on
Crack Initiation in Pipeline Steels in Near-
Neutral pH Environment
103
In this chapter, long-term crack initiation experiments are conducted. The pre-pitting procedure
developed in the previous chapter and is believed to simulate pitting occurrence on pipelines in
the field is used to produce pits on the specimens before the experiments. The presence of pre-
pits on the surface shortens the duration of crack initiation and results in longer cracks in a
specified duration of the experiment. This enables the study of short crack growth after initiation.
5.1 Introduction
Stress corrosion cracking (SCC) has been reported to have a significant contribution to the
failures of buried pipelines all around the world [1]. Between the two forms of SCC observed on
the external surface of pipelines, near-neutral-pH stress corrosion cracking (NNpH SCC) remains
a significant issue largely because the industry‟s understanding of this kind of cracking is still
evolving. In contrast, the mechanism of high pH SCC is well understood and is attributed to
active-passive transitions in a concentrated carbonate-bicarbonate soil solution.
NNpH SCC usually occurs under disbonded coatings where a near-neutral pH (6 < pH < 8),
dilute and carbon dioxide (CO2)-containing electrolyte is developed. The reason for the
formation of such an environment is that cathodic protection cannot reach the pipe under the
disbonded coating. In order for pH to remain near the neutral range, lack of cathodic potential
(CP) is essential. Reaching limited CP level to the pipeline surface causes the pipeline steels
display an active behaviour and have a potential close to the free corrosion potential of steel
exposed to a near-neutral-pH environment. Although corrosion plays an important role in SCC
initiation, it cannot by itself be responsible for the reported crack growth in the field. According
to Parkins [2], crack growth in the field can be more than one order of magnitude higher than
calculated crack growth based on Faraday‟s law. It is believed that synergistic effects of
104
corrosion, dissolved hydrogen and cyclic loading, which is induced by internal pressure
fluctuations, lead to crack growth in the near-neutral pH environment [3].
Since the first discovery of NNpHSCC in the 1980s, many researchers focused on establishing
the contributing factors to initiation of NNpH SCC. As no passive film is developed on the
surface of pipes in the near-neutral-pH environment, crack initiation mostly starts with
preferential corrosion at surface discontinuities including any scratches, grain boundaries,
banded structure, inclusions or persistent slip bands produced by cyclic loading [4]. This
preferential corrosion finally leads to the formation of corrosion pits that act as stress raisers and
generate significant stress concentration. Tensile stress produced by the internal pressure of
pipelines and surface residual stresses when combined with localized anodic dissolution
facilitates the pit-to-crack transition in regions with the highest stress concentration including
those corrosion pits [5-6]. The contribution of tensile stress to the crack initiation process, on one
hand, relies on the acceleration of the corrosion activity of steels by tensile stresses producing
plastic deformation. On the other hand, it is related to enhanced hydrogen permeation and
accumulation at stress concentrated zones [7-8]. However, the internal pressure of all pipelines
are below their yield strength, the presence of surface residual stresses and also defects such as
corrosion pits would concentrate stress to a level producing plastic deformation [9]. This could
be even more pronounced when pipelines undergo very high pressures, for example during a
hydrostatic test. Each pipeline undergoes several hydrotests during which their pressures are
raised to at least 100% of their Specified Minimum Yield Strength; SMYS (Note that normal
operating pressures are usually below 80% of SMYS). This would produce a large amount of
plastic deformation in the stress concentration zones like corrosion pits and enhance pit-to-crack
transition. This could compromise all the benefits of hydrotest that accrue to the pipeline
105
industry. Up to now, no study has considered the effects that hydrotest may have on SCC
initiation and the growth of very small cracks. Therefore, the aim of the current research was to
study these possible effects using a loading procedure similar to what is performed during
hydrotesting in the field.
5.2 Material and Methods
Four dog-bone shaped specimens were machined from intact sections of a 30” OD X-52
underground pipeline steel which had been in service for more than twenty years. The samples
had gauge dimensions of 32, 6 and 4 mm in length, width, and thickness, respectively. The
specimens were cut from pipelines such that their length was oriented in the circumferential
direction of the pipe. With this orientation of the specimens, cracks would initiate in the
longitudinal direction, similar to NNpH SCC cracks found in the field.
The specimens were ground up to 1200 grit SiC paper and cleaned with ethanol. Then all their
surfaces except the front surface of the gauge section, which was closer to the outside surface of
the pipeline, were coated with epoxy.
Since the purpose of the research was to study the effect of hydrotest on crack initiation and
cracks mostly develop from the bottom of pits and require several years in the field for them to
grow and transit to cracks, the crack initiation process was accelerated by generating some pre-
pits on the exposed area of the specimens before long-term mechanical tests. The pre-pitting
procedure was covered in detail in Chapter 4.
Then all the specimens were cleaned of any corrosion product using EDTA
(Ethylenediaminetetraacetic acid) solution and finally they were sealed in corrosion cells and
exposed to a simulated ground water solution, C2 solution, best characterizing the soil solution
found around NNpH SCC cases. The composition of the solution is listed in Table 5.1. The
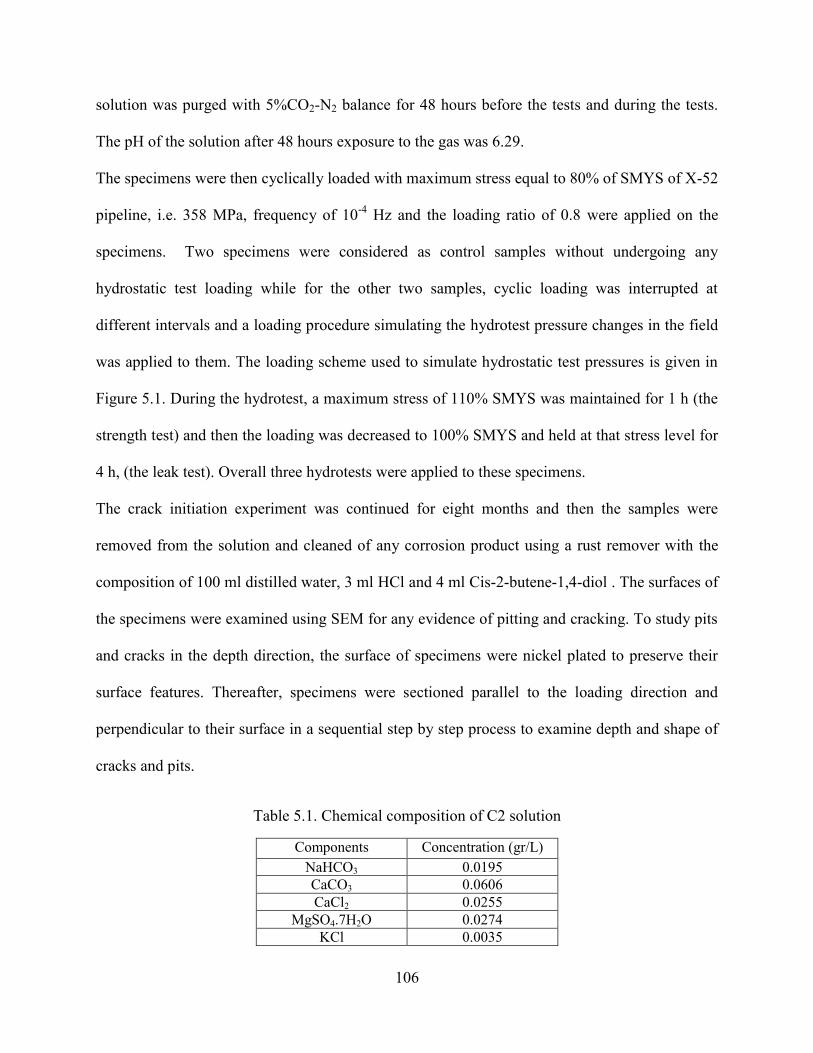
106
solution was purged with 5%CO2-N2 balance for 48 hours before the tests and during the tests.
The pH of the solution after 48 hours exposure to the gas was 6.29.
The specimens were then cyclically loaded with maximum stress equal to 80% of SMYS of X-52
pipeline, i.e. 358 MPa, frequency of 10-4
Hz and the loading ratio of 0.8 were applied on the
specimens. Two specimens were considered as control samples without undergoing any
hydrostatic test loading while for the other two samples, cyclic loading was interrupted at
different intervals and a loading procedure simulating the hydrotest pressure changes in the field
was applied to them. The loading scheme used to simulate hydrostatic test pressures is given in
Figure 5.1. During the hydrotest, a maximum stress of 110% SMYS was maintained for 1 h (the
strength test) and then the loading was decreased to 100% SMYS and held at that stress level for
4 h, (the leak test). Overall three hydrotests were applied to these specimens.
The crack initiation experiment was continued for eight months and then the samples were
removed from the solution and cleaned of any corrosion product using a rust remover with the
composition of 100 ml distilled water, 3 ml HCl and 4 ml Cis-2-butene-1,4-diol . The surfaces of
the specimens were examined using SEM for any evidence of pitting and cracking. To study pits
and cracks in the depth direction, the surface of specimens were nickel plated to preserve their
surface features. Thereafter, specimens were sectioned parallel to the loading direction and
perpendicular to their surface in a sequential step by step process to examine depth and shape of
cracks and pits.
Table 5.1. Chemical composition of C2 solution
Components Concentration (gr/L)
NaHCO3 0.0195
CaCO3 0.0606
CaCl2 0.0255
MgSO4.7H2O 0.0274
KCl 0.0035
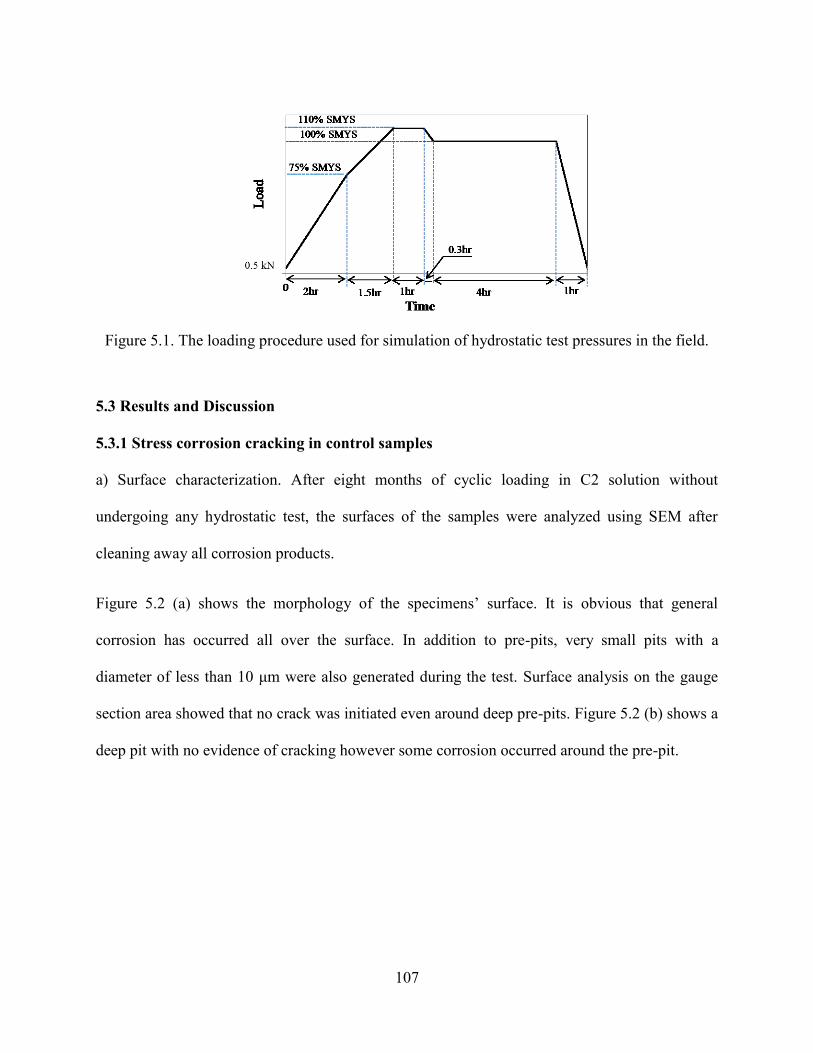
107
Figure 5.1. The loading procedure used for simulation of hydrostatic test pressures in the field.
5.3 Results and Discussion
5.3.1 Stress corrosion cracking in control samples
a) Surface characterization. After eight months of cyclic loading in C2 solution without
undergoing any hydrostatic test, the surfaces of the samples were analyzed using SEM after
cleaning away all corrosion products.
Figure 5.2 (a) shows the morphology of the specimens‟ surface. It is obvious that general
corrosion has occurred all over the surface. In addition to pre-pits, very small pits with a
diameter of less than 10 μm were also generated during the test. Surface analysis on the gauge
section area showed that no crack was initiated even around deep pre-pits. Figure 5.2 (b) shows a
deep pit with no evidence of cracking however some corrosion occurred around the pre-pit.
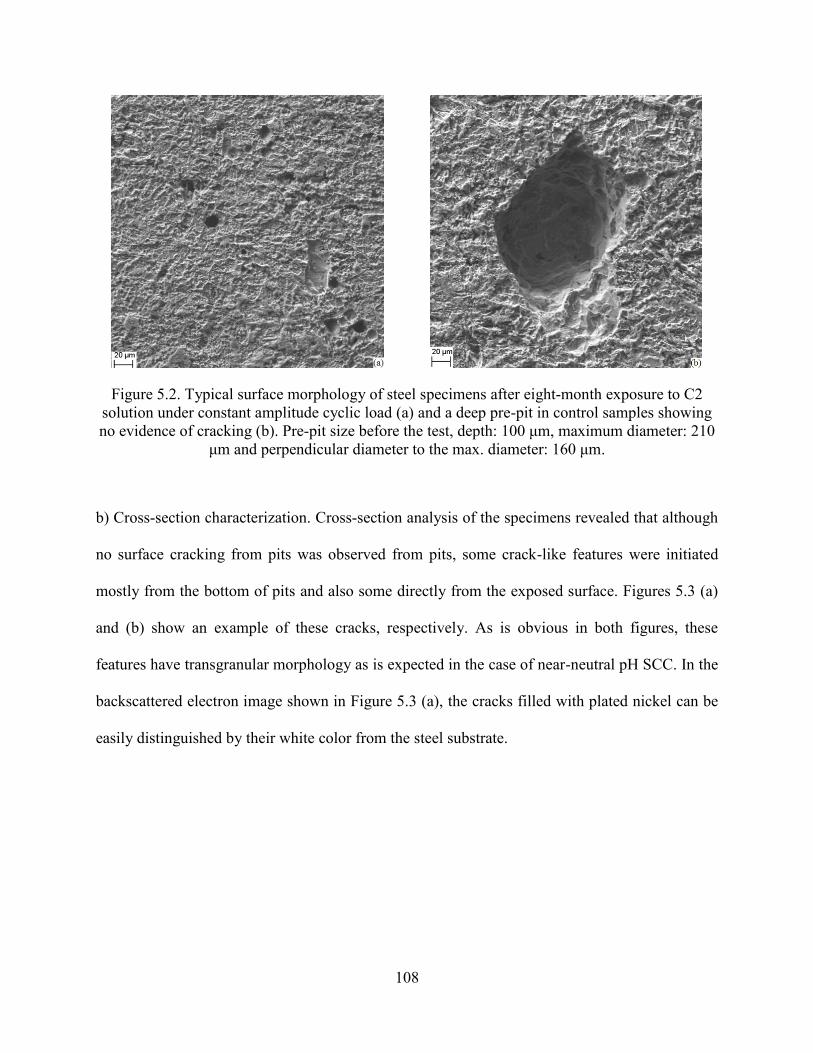
108
Figure 5.2. Typical surface morphology of steel specimens after eight-month exposure to C2
solution under constant amplitude cyclic load (a) and a deep pre-pit in control samples showing
no evidence of cracking (b). Pre-pit size before the test, depth: 100 μm, maximum diameter: 210
μm and perpendicular diameter to the max. diameter: 160 μm.
b) Cross-section characterization. Cross-section analysis of the specimens revealed that although
no surface cracking from pits was observed from pits, some crack-like features were initiated
mostly from the bottom of pits and also some directly from the exposed surface. Figures 5.3 (a)
and (b) show an example of these cracks, respectively. As is obvious in both figures, these
features have transgranular morphology as is expected in the case of near-neutral pH SCC. In the
backscattered electron image shown in Figure 5.3 (a), the cracks filled with plated nickel can be
easily distinguished by their white color from the steel substrate.
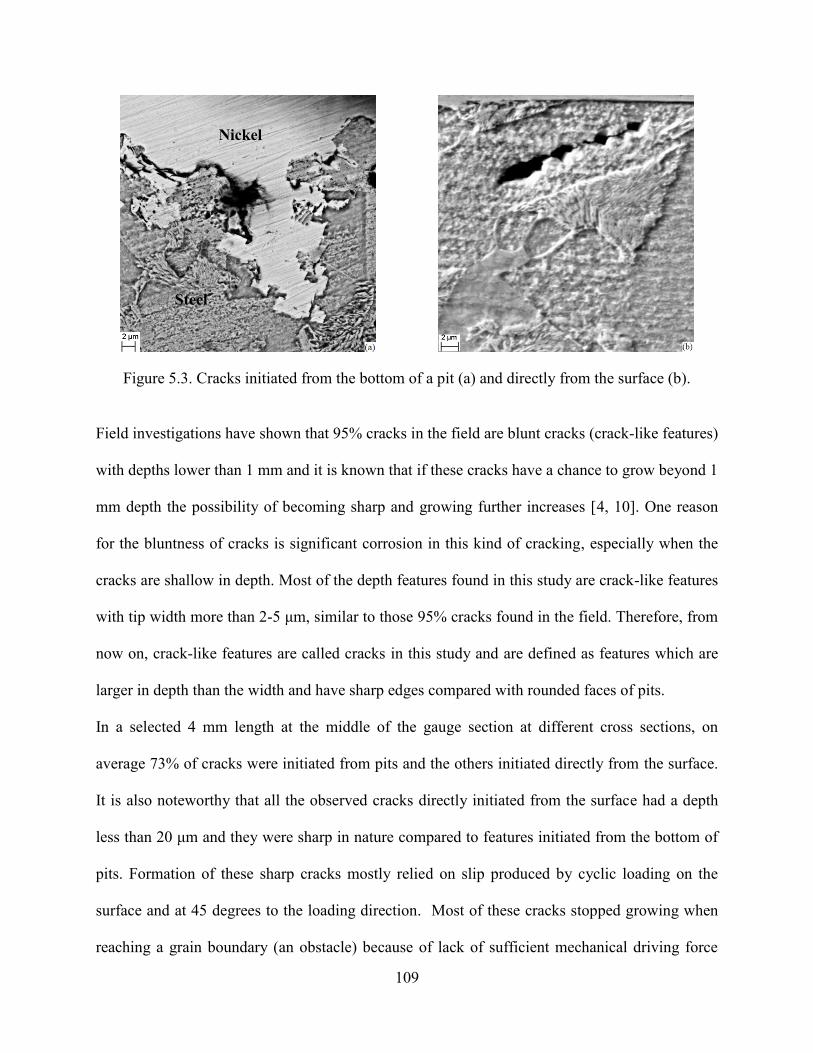
109
Figure 5.3. Cracks initiated from the bottom of a pit (a) and directly from the surface (b).
Field investigations have shown that 95% cracks in the field are blunt cracks (crack-like features)
with depths lower than 1 mm and it is known that if these cracks have a chance to grow beyond 1
mm depth the possibility of becoming sharp and growing further increases [4, 10]. One reason
for the bluntness of cracks is significant corrosion in this kind of cracking, especially when the
cracks are shallow in depth. Most of the depth features found in this study are crack-like features
with tip width more than 2-5 μm, similar to those 95% cracks found in the field. Therefore, from
now on, crack-like features are called cracks in this study and are defined as features which are
larger in depth than the width and have sharp edges compared with rounded faces of pits.
In a selected 4 mm length at the middle of the gauge section at different cross sections, on
average 73% of cracks were initiated from pits and the others initiated directly from the surface.
It is also noteworthy that all the observed cracks directly initiated from the surface had a depth
less than 20 μm and they were sharp in nature compared to features initiated from the bottom of
pits. Formation of these sharp cracks mostly relied on slip produced by cyclic loading on the
surface and at 45 degrees to the loading direction. Most of these cracks stopped growing when
reaching a grain boundary (an obstacle) because of lack of sufficient mechanical driving force
Nickel
Steel
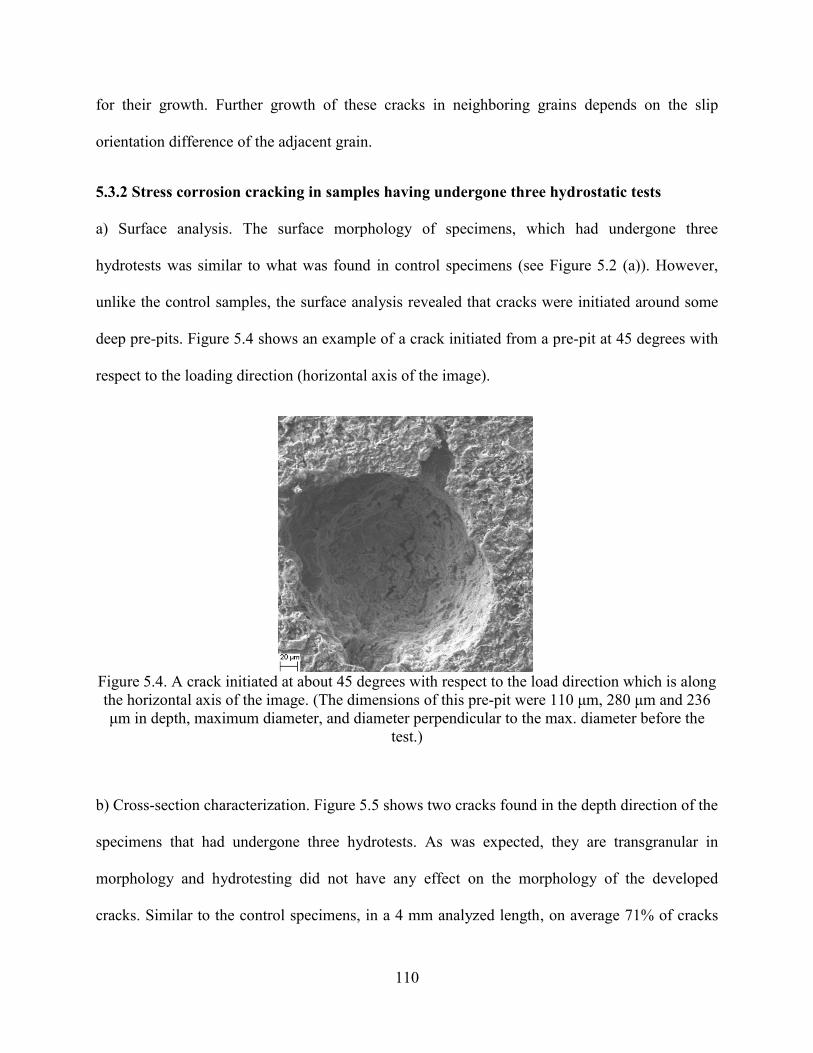
110
for their growth. Further growth of these cracks in neighboring grains depends on the slip
orientation difference of the adjacent grain.
5.3.2 Stress corrosion cracking in samples having undergone three hydrostatic tests
a) Surface analysis. The surface morphology of specimens, which had undergone three
hydrotests was similar to what was found in control specimens (see Figure 5.2 (a)). However,
unlike the control samples, the surface analysis revealed that cracks were initiated around some
deep pre-pits. Figure 5.4 shows an example of a crack initiated from a pre-pit at 45 degrees with
respect to the loading direction (horizontal axis of the image).
Figure 5.4. A crack initiated at about 45 degrees with respect to the load direction which is along
the horizontal axis of the image. (The dimensions of this pre-pit were 110 μm, 280 μm and 236
μm in depth, maximum diameter, and diameter perpendicular to the max. diameter before the
test.)
b) Cross-section characterization. Figure 5.5 shows two cracks found in the depth direction of the
specimens that had undergone three hydrotests. As was expected, they are transgranular in
morphology and hydrotesting did not have any effect on the morphology of the developed
cracks. Similar to the control specimens, in a 4 mm analyzed length, on average 71% of cracks
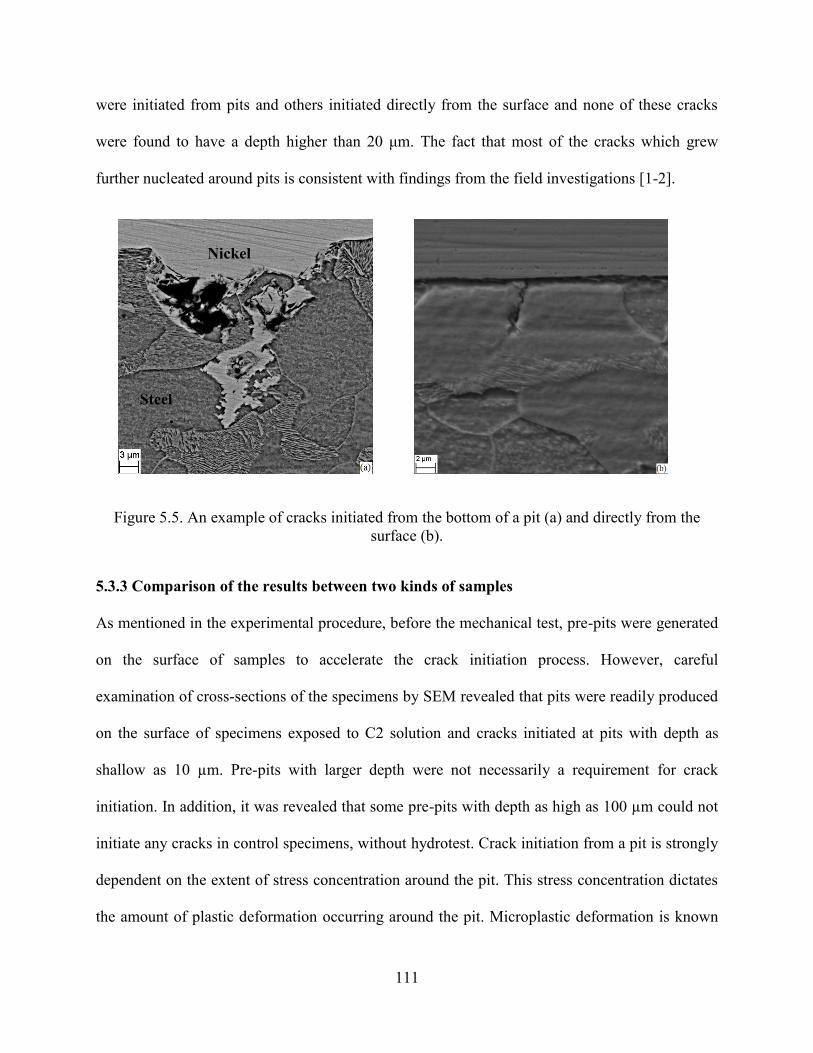
111
were initiated from pits and others initiated directly from the surface and none of these cracks
were found to have a depth higher than 20 μm. The fact that most of the cracks which grew
further nucleated around pits is consistent with findings from the field investigations [1-2].
Figure 5.5. An example of cracks initiated from the bottom of a pit (a) and directly from the
surface (b).
5.3.3 Comparison of the results between two kinds of samples
As mentioned in the experimental procedure, before the mechanical test, pre-pits were generated
on the surface of samples to accelerate the crack initiation process. However, careful
examination of cross-sections of the specimens by SEM revealed that pits were readily produced
on the surface of specimens exposed to C2 solution and cracks initiated at pits with depth as
shallow as 10 µm. Pre-pits with larger depth were not necessarily a requirement for crack
initiation. In addition, it was revealed that some pre-pits with depth as high as 100 µm could not
initiate any cracks in control specimens, without hydrotest. Crack initiation from a pit is strongly
dependent on the extent of stress concentration around the pit. This stress concentration dictates
the amount of plastic deformation occurring around the pit. Microplastic deformation is known
Nickel
Steel
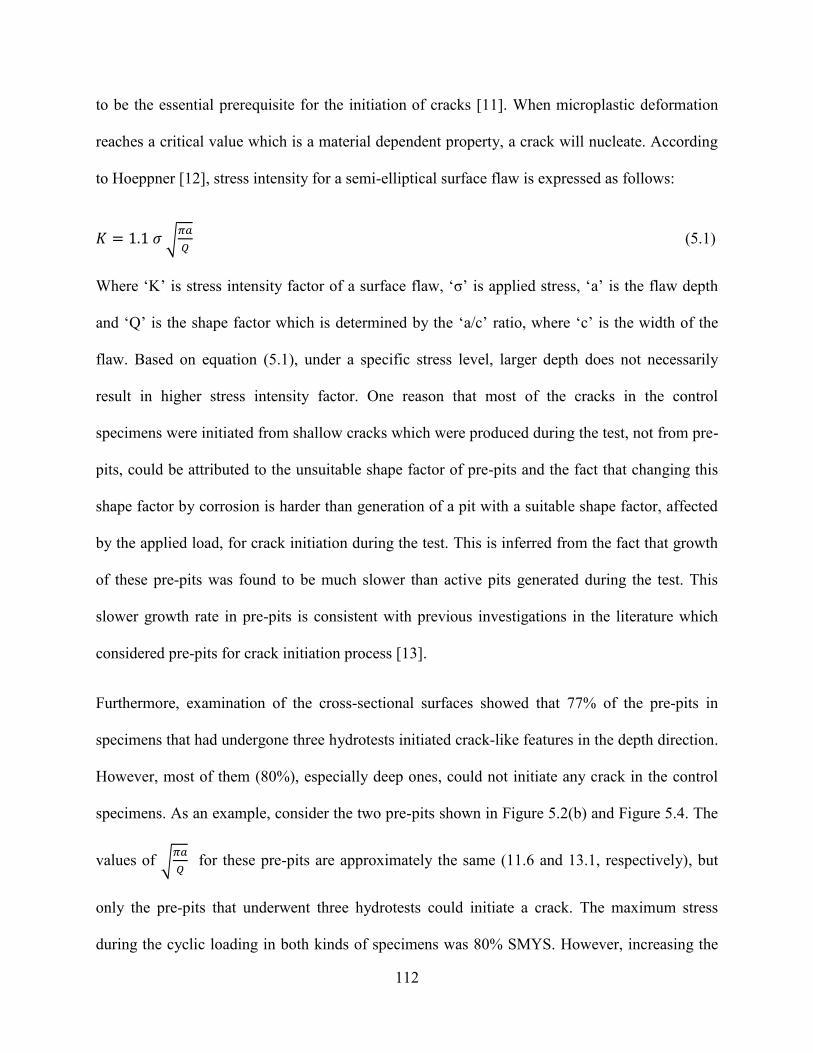
112
to be the essential prerequisite for the initiation of cracks [11]. When microplastic deformation
reaches a critical value which is a material dependent property, a crack will nucleate. According
to Hoeppner [12], stress intensity for a semi-elliptical surface flaw is expressed as follows:
√
(5.1)
Where „K‟ is stress intensity factor of a surface flaw, „σ‟ is applied stress, „a‟ is the flaw depth
and „Q‟ is the shape factor which is determined by the „a/c‟ ratio, where „c‟ is the width of the
flaw. Based on equation (5.1), under a specific stress level, larger depth does not necessarily
result in higher stress intensity factor. One reason that most of the cracks in the control
specimens were initiated from shallow cracks which were produced during the test, not from pre-
pits, could be attributed to the unsuitable shape factor of pre-pits and the fact that changing this
shape factor by corrosion is harder than generation of a pit with a suitable shape factor, affected
by the applied load, for crack initiation during the test. This is inferred from the fact that growth
of these pre-pits was found to be much slower than active pits generated during the test. This
slower growth rate in pre-pits is consistent with previous investigations in the literature which
considered pre-pits for crack initiation process [13].
Furthermore, examination of the cross-sectional surfaces showed that 77% of the pre-pits in
specimens that had undergone three hydrotests initiated crack-like features in the depth direction.
However, most of them (80%), especially deep ones, could not initiate any crack in the control
specimens. As an example, consider the two pre-pits shown in Figure 5.2(b) and Figure 5.4. The
values of √
for these pre-pits are approximately the same (11.6 and 13.1, respectively), but
only the pre-pits that underwent three hydrotests could initiate a crack. The maximum stress
during the cyclic loading in both kinds of specimens was 80% SMYS. However, increasing the

113
stress to 110% SMYS during hydrotestest caused a large increase in the stress intensity factor,
with the increased local plastic deformation causing initiation of cracks at pre-pits. This
conclusion was also based on the fact that pre-pits even smaller and shallower than the pre-pit
shown in Figure 5.2 (b) initiated cracks in specimens that had undergone a hydrotest.
For further crack analysis, a 4 mm length at the middle of the gauge section was selected and all
cracks in this 4 mm length along different cross-sections were measured and investigated since
sufficient statistics can be found in this area.
When selecting 4 mm length, those cross-sections with pre-pits leading to crack initiation were
not considered such that the difference in the depth of cracks can be attributed to the effect of
hydrotests and not the effect of pre-pits. Figure 5.6 shows the number of cracks for the selected 4
mm length at different crack depth intervals. As is seen, the number of initiated cracks with a
depth smaller than 20 μm is a little bit higher in the specimens without Hydrotest, but most of
these cracks did not grow further. On average, only 5.5 % of them exceeded this depth.
However, the percentage of cracks exceeding 20 μm for specimens which had undergone
hydrotesting is, on average, 26%, which is about 5 times more.
Consequently, all the cracks with a depth lower than 20 microns along the total gauge length
were ignored, and the frequency of cracks with depth larger than 20 microns was counted in all
specimens and the statistics of these results are listed in Table 5.2.
This table shows that maximum crack depth found in specimens which had undergone three
hydrotests is approximately 70% more than in control specimens. In addition, the frequency of
these cracks is also higher in hydrotested specimens. At first glance, approximately 40 µm more
growth, 70% increase, in hydrotested specimens seems to be minor from engineering point of
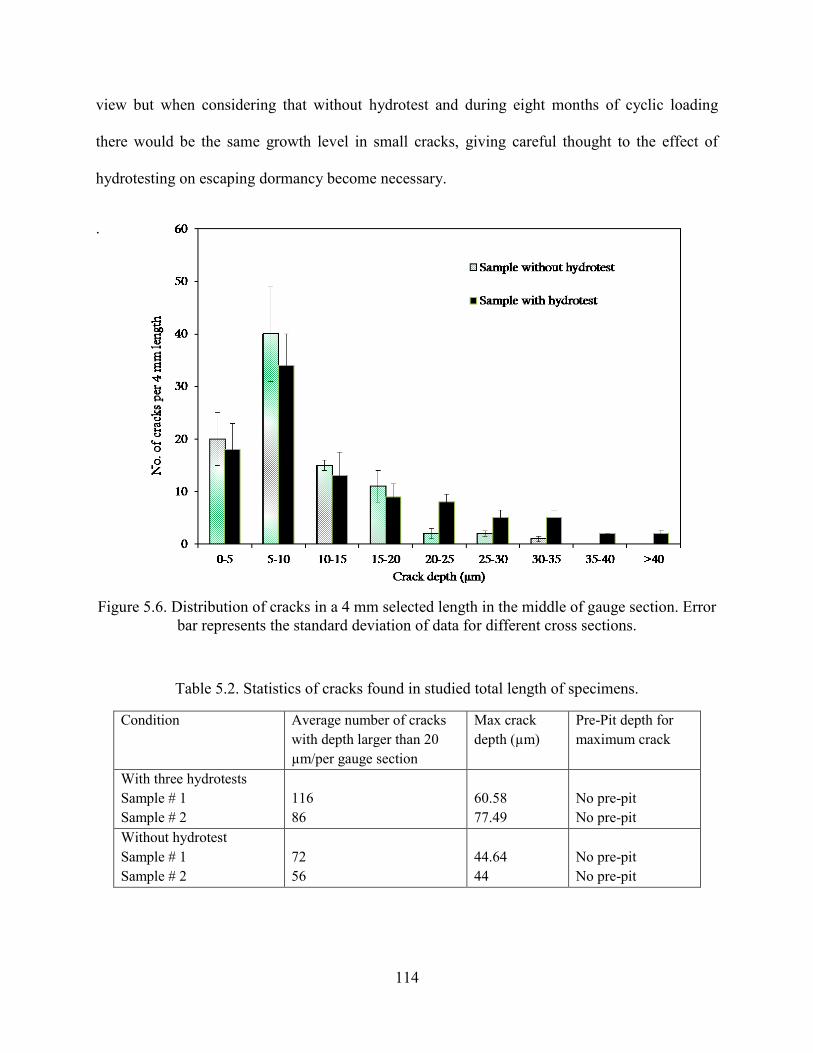
114
view but when considering that without hydrotest and during eight months of cyclic loading
there would be the same growth level in small cracks, giving careful thought to the effect of
hydrotesting on escaping dormancy become necessary.
.
Figure 5.6. Distribution of cracks in a 4 mm selected length in the middle of gauge section. Error
bar represents the standard deviation of data for different cross sections.
Table 5.2. Statistics of cracks found in studied total length of specimens.
Condition Average number of cracks
with depth larger than 20
µm/per gauge section
Max crack
depth (µm)
Pre-Pit depth for
maximum crack
With three hydrotests
Sample # 1
Sample # 2
116
86
60.58
77.49
No pre-pit
No pre-pit
Without hydrotest
Sample # 1
Sample # 2
72
56
44.64
44
No pre-pit
No pre-pit
115
Hydrotest has been proven to retard growth of long NNpH SCC cracks whose growth depends
primarily on mechanical factors. This retardation effect for long cracks is attributed to the
bluntness of cracks caused by hydrotest. This bluntness becomes important when the cracks are
deep and usually sharp in nature because the contribution of mechanical growth diminishes as
stress intensity decreases with crack bluntness. However, this is not the case for small cracks.
Small NNpH SCC cracks with a depth lower than 1 mm, those that passed grain boundaries, are
usually blunt as seen in Figure 5.5 (a) and their growth mostly relies on corrosion rather than
mechanical factors [2]. Since the corrosion rate in ground water is on the order of 10-10
mm/s,
their growth is slow and the growth period contributes to a large portion of the time to failure in
pipelines. Thus it would be significant if they can grow further and eventually cause failure.
One factor that has been proven to increase corrosion of pipeline steels is plastic deformation.
Previous research demonstrated increasing corrosion rate with plastic deformation. For example,
Li et al. [8] and Tang et al. [14] both showed the enhanced anodic dissolution of X-52 and X-70
pipeline steels with applied tensile stresses in the plastic range in near neutral pH environment. It
was also proven that the conditions that produce and/or enhance local plasticity either on the pipe
surface or at a crack tip would favor SCC [15] because of this enhanced dissolution. The
enhanced dissolution of steel is attributed to mechanoelectrochemical interactions as proposed by
Gutman. According to Gutman‟s mechanoelectrochemical interactions theory, both plastic and
elastic deformations can cause a shift in corrosion potential. However, the shift caused by elastic
deformation is usually insignificant and can be ignored. The potential shift produced by plastic
deformation results in an increase in anodic current ( which is proportional to the plastic
strain by Equation (2) [16]:
116
(5.2)
Where ν is the orientation-dependent factor, 0.4 to 0.5 for tensile deformation, is the initial
density of dislocations prior to plastic deformation, is a coefficient ranging from 109 to 10
11
cm-2
, is plastic deformation strain and is the anodic dissolution current without applying
load.
Since the time to crack initiation is not known, estimation of crack growth rate would be
inaccurate. However considering the same initiation time for both kinds of conditions, the
growth rate in hydrotested specimens would be about two times the growth in control specimens.
During the hydrotest, the tensile load was increased to 110% SMYS and micro-plastic
deformation occurred easily around stress concentration zones likes pits or already initiated
cracks. This plastic deformation plays a key role in initiation and growth of small cracks. It also
has been reported about small fatigue cracks, that many microstructurally small cracks grow
under relatively large applied stresses, which further magnifies near-tip plasticity effects [16].
When the crack or pit size is very small (smaller than grain size), their plastic zone radius is
comparable to their size considering that yield strength is usually lower on surface grains
because of lower constraints with the surrounding material [16-17]. Application of a hydrotest at
this stage would cause enhanced corrosion of the plastic zone, which eventually resulted in the
crack being corroded away leaving a pit behind or the pit becoming deeper since the radius of the
plastic zone was on the same order of magnitude as that crack or pit size. This can be a reason
for the low density of cracks with a depth lower than 20 µm in specimens that had undergone a
hydrotest. In contrast, when these stress concentration zones are well developed with sufficient
depth (for example pre-pits or cracks with a depth higher than 1-2 grain sizes), the reduced yield
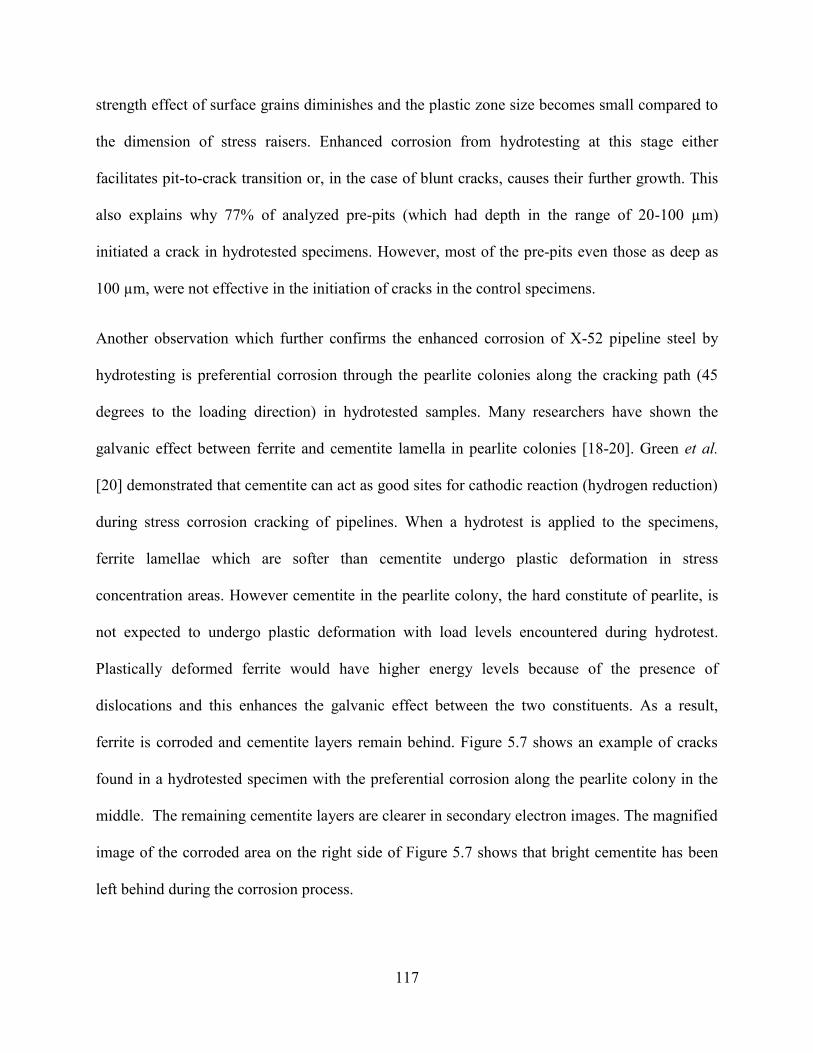
117
strength effect of surface grains diminishes and the plastic zone size becomes small compared to
the dimension of stress raisers. Enhanced corrosion from hydrotesting at this stage either
facilitates pit-to-crack transition or, in the case of blunt cracks, causes their further growth. This
also explains why 77% of analyzed pre-pits (which had depth in the range of 20-100 µm)
initiated a crack in hydrotested specimens. However, most of the pre-pits even those as deep as
100 µm, were not effective in the initiation of cracks in the control specimens.
Another observation which further confirms the enhanced corrosion of X-52 pipeline steel by
hydrotesting is preferential corrosion through the pearlite colonies along the cracking path (45
degrees to the loading direction) in hydrotested samples. Many researchers have shown the
galvanic effect between ferrite and cementite lamella in pearlite colonies [18-20]. Green et al.
[20] demonstrated that cementite can act as good sites for cathodic reaction (hydrogen reduction)
during stress corrosion cracking of pipelines. When a hydrotest is applied to the specimens,
ferrite lamellae which are softer than cementite undergo plastic deformation in stress
concentration areas. However cementite in the pearlite colony, the hard constitute of pearlite, is
not expected to undergo plastic deformation with load levels encountered during hydrotest.
Plastically deformed ferrite would have higher energy levels because of the presence of
dislocations and this enhances the galvanic effect between the two constituents. As a result,
ferrite is corroded and cementite layers remain behind. Figure 5.7 shows an example of cracks
found in a hydrotested specimen with the preferential corrosion along the pearlite colony in the
middle. The remaining cementite layers are clearer in secondary electron images. The magnified
image of the corroded area on the right side of Figure 5.7 shows that bright cementite has been
left behind during the corrosion process.
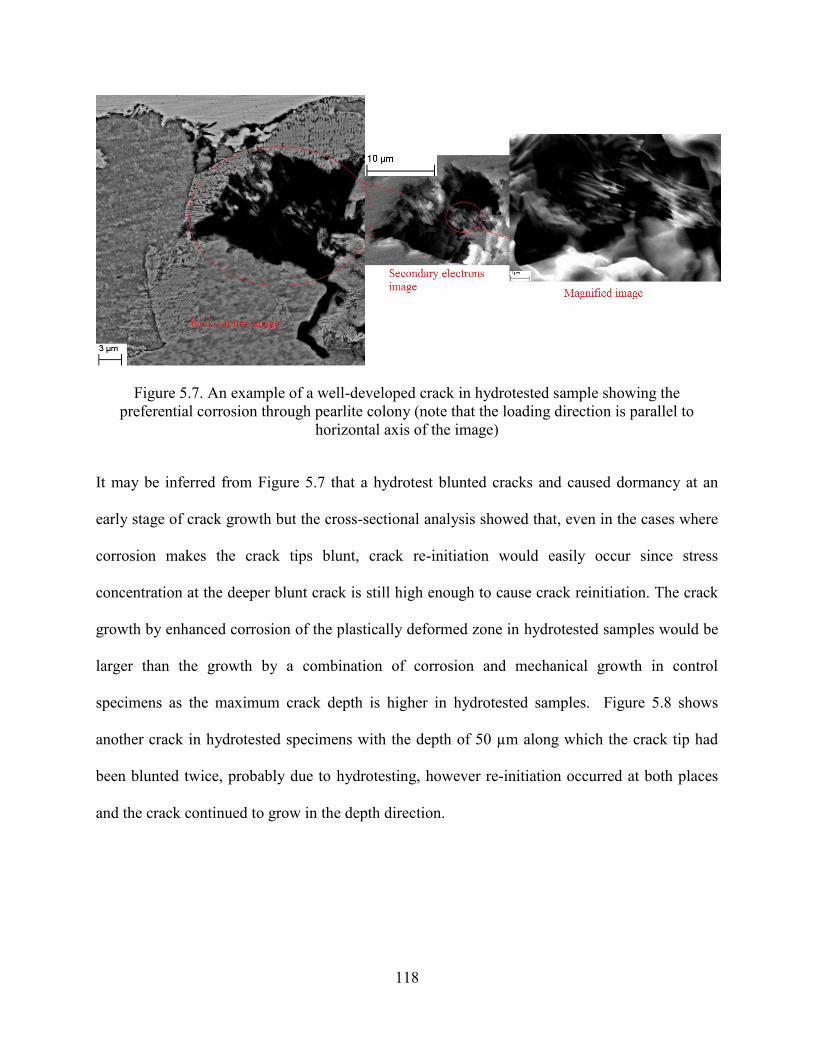
118
Figure 5.7. An example of a well-developed crack in hydrotested sample showing the
preferential corrosion through pearlite colony (note that the loading direction is parallel to
horizontal axis of the image)
It may be inferred from Figure 5.7 that a hydrotest blunted cracks and caused dormancy at an
early stage of crack growth but the cross-sectional analysis showed that, even in the cases where
corrosion makes the crack tips blunt, crack re-initiation would easily occur since stress
concentration at the deeper blunt crack is still high enough to cause crack reinitiation. The crack
growth by enhanced corrosion of the plastically deformed zone in hydrotested samples would be
larger than the growth by a combination of corrosion and mechanical growth in control
specimens as the maximum crack depth is higher in hydrotested samples. Figure 5.8 shows
another crack in hydrotested specimens with the depth of 50 µm along which the crack tip had
been blunted twice, probably due to hydrotesting, however re-initiation occurred at both places
and the crack continued to grow in the depth direction.
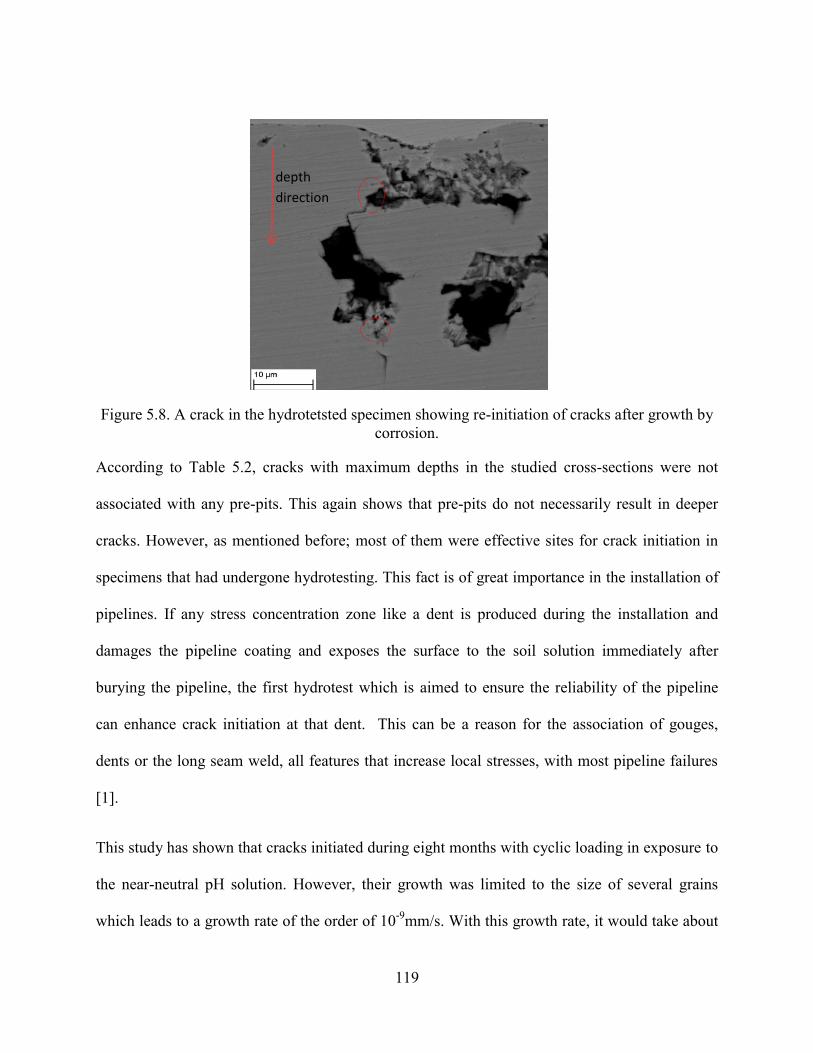
119
Figure 5.8. A crack in the hydrotetsted specimen showing re-initiation of cracks after growth by
corrosion.
According to Table 5.2, cracks with maximum depths in the studied cross-sections were not
associated with any pre-pits. This again shows that pre-pits do not necessarily result in deeper
cracks. However, as mentioned before; most of them were effective sites for crack initiation in
specimens that had undergone hydrotesting. This fact is of great importance in the installation of
pipelines. If any stress concentration zone like a dent is produced during the installation and
damages the pipeline coating and exposes the surface to the soil solution immediately after
burying the pipeline, the first hydrotest which is aimed to ensure the reliability of the pipeline
can enhance crack initiation at that dent. This can be a reason for the association of gouges,
dents or the long seam weld, all features that increase local stresses, with most pipeline failures
[1].
This study has shown that cracks initiated during eight months with cyclic loading in exposure to
the near-neutral pH solution. However, their growth was limited to the size of several grains
which leads to a growth rate of the order of 10-9
mm/s. With this growth rate, it would take about
depth
direction
120
15 years for small cracks to grow to the depth of 0.5 mm, which is close to the dormancy point of
cracks. Considering the lifespan of 20-30 years for a pipeline and an incubation period of 12
years for disbonding of the coating and subsequent exposure of pipeline to the ground water
solution [21], the overall process of cracking would take less than 8-18 years to cause fracture of
pipelines. Knowing that recent research in this area showed that the growth of long cracks with
depth higher than 0.5 mm is a discontinuous process with dormancy and sharpening intervals
which could takes several years [3,4], the initial stages of cracking including crack initiation and
small crack growth is expected to be much shorter than the estimated 15 years based on the
growth rates in this study. However, all research reviewed by the authors on crack initiation on
polished smooth surfaces in near-neutral pH environment which eventually leaded to
longitudinal cracks parallel to the axial direction of pipes, similar to the majority of cracks in the
field, produced very short cracks with growth rates similar to what was found in this research
[5,6, 23-24]. This brings the conclusion that the crack initiation studies on polished surfaces
without considering real pipeline surface and stress condition underestimates the growth of short
initiated cracks. For instance, it has been proved in other studies that mill-scale and residual
stress developed macro galvanic cells which resulted in higher growth rates of small cracks [25-
26]. Research on the effect of residual stress showed that this galvanic effect can produce cracks
up to a depth of 0.7 mm during four months of cyclic loading [26]. Although the formation of
galvanic cells by the presence of mill-scale has been shown in previous corrosion studies but no
study has focused on its effect on crack initiation. So the purpose of next chapter will be to
investigate
121
5.4 Conclusions
In this study, a long-term mechanical test was designed to investigate the effect of hydrostatic
testing on SCC initiation in the near-neutral pH environment. Based on the results, the following
conclusions were made:
1) In both conditions, i.e. with and without hydrotest loads, cracks were initiated directly from
the surface and from corrosion pits. Pits were associated with about 70% of cracks. This
emphasizes the role of stress raisers in this kind of cracking.
2) Hydrostatic test loads facilitated the pit-to-crack transition by increasing the stress
concentration around pre-pits. This suggests that application of hydrotesting on pipeline sections
which have dents and gouges on their surface should be restricted in the field.
3) By application of three hydrotests, the depth of cracks that grew past grain boundaries was
70% larger than those in the control samples.
4) Hydrotests promoted crack growth along pearlite colonies by enhanced corrosion of
plastically deformed ferrite lamella. Most of the cracks found in the field are blunt cracks with a
depth lower than 1 mm. As the cracks depth reached this level, the possibility of becoming sharp
was higher and they can grow faster afterward. Based on the results, hydrotesting can help short
blunt cracks to grow beyond that critical depth.
122
References
[1] National Energy Board, 1996, "Public Enquiry Concerning Stress Corrosion Cracking on
Canadian Oil and Gas Pipelines," report #MH-2-95.
[2] R.N. Parkins, A review of stress corrosion cracking of high pressure pipelines, Corrosion
2000, Paper No. 00363.
[3] A. Egbewande , W. Chen, R. Eadie , R. Kania , G. V. Boven , R.Worthingham, J. Been,
Transgranular crack growth in the pipeline steels exposed to near-neutral pH soil aqueous
solutions: Discontinuous crack growth mechanism, Corr. Sci. 83, p.343–354.
[4] W.Chen , R. Kania, R. Worthingham, G.V. Boven, Transgranular crack growth in the
pipeline steels exposed to near-neutral pH soil aqueous solutions: The role of hydrogen,
Acta Materialia 57, p. 6200–6214.
[5] A. Eslami, B. Fang, R. Kania, B. Worthingham, J. Been, R. Eadie, W. Chen, Stress corrosion
cracking initiation under the disbonded coating of pipeline steel in near-neutral pH
environment, Corr. Sci.52, p.3750–3756.
[6] B. Fang, R. Eadie, W. Chen, and M. Elboujdaini, A Passivation/Acid-Immersion Technique
to Grow Pits in Pipeline Steel and a Study of the Resulting Pit Nucleation and Growth,
Corrosion Engineering, Science and Technology, 44(1), p.32-42.
[7] L.Y. Xu, Y.F. Cheng, Corrosion of X100 pipeline steel under plastic strain in a neutral pH
bicarbonate solution, Corr.Sci. 64, p.145–152.
[8] X. C. Li, R. L. Eadie and J. L. Luo, Influence of plasticity on corrosion and stress corrosion
cracking behaviour in near neutral pH environment, Corrosion Engineering, Science and
Technology (43), p. 297-303.
[9] J. Li, M. Elboujdaini, M. Gao, R.W. Revie, Investigation of plastic zones near SCC tips in a
pipeline after hydrotest testing, Materials Science and Engineering A 486, p.496–502.
[10] B. Fang, R.L. Eadie, M. Elboujdaini, Blunt crack initiation and its transition to sharp cracks
in pipeline steel in near-neutral pH solution, Proceedings of the 2012 9th International
Pipeline Conference, paper No. IPC2012-90088.
[11] B.T. Lu, J.L. Luo, P.R. Norton, Environmentally assisted cracking mechanism of pipeline
steel in near-neutral pH groundwater, Corr. Sci. 52, p.1787–1795.
[12] D.W. Hoeppner, Model for prediction of fatigue lives based upon a pitting corrosion fatigue
process, fatigue mechanisms, ASTM STP 675, 1979, p.841–870.
123
[13] Kimberli Jones, David W. Hoeppner, Pit-to-crack transition in pre-corroded 7075-T6
aluminum alloy under cyclic loading, Corr. Sci. 47, p.2185–2198.
[14] X. Tanga, Y.F. Cheng, Micro-electrochemical characterization of the effect of applied stress
on local anodic dissolution behavior of pipeline steel under near-neutral pH condition,
Electrochimica Acta 54, p.1499–1505.
[15] Y. Frank Cheng, Stress Corrosion Cracking of Pipelines, Wiley, 2013.
[16] ASM metals Handbook, Fatigue and Fracture, ASM International, 1996.
[17] William F. Hosford, Mechanical Behavior of Materials, Cambridge University Press, 2005.
[18] C.W. Du, X.G. Li, P. Liang, Z.Y. Liu, G.F. Jia, and Y.F. Cheng, Effects of Microstructure
on Corrosion of X70 Pipe Steel in an Alkaline Soil, Journal of Materials Engineering and
Performance, Corrosion (2000), paper No. 00023.
[19] J. Li, M. Elboujdaini, B. Fang, R.W. Revie and M.W. Phaneuf. Microscopy Study of
Intergranular Stress Corrosion Cracking of X-52 Line Pipe Steel, Corrosion 62 (4), p. 316-
322.
[20] J.A.S. Green, R.N. parkins, Electrochemical properties of ferrite and cementite in relation to
stress corrosion cracking of mild steels in nitrate solution, Corrosion 24 (3), p.66-69.
[21] K. Chevil, W. Chen, G. V. Boven, R. Kania, J. Been, Correlating corrosion field data with
experimental findings for the development of pipeline mitigation strategies, Proceeding of
the 2014 International Pipeline Conference, ASME ,paper No. IPC2014-33678.
[22] A. Egbewande, W. Chen, R. Eadie, R. Kania, G. V. Boven, R. Worthingham, J. Been,
Transgranular crack growth in the pipeline steels exposed to near-neutral pH soil aqueous
solutions: Discontinuous crack growth mechanism, Corr. Sci. 83, p. 343–354.
[23] W. CHEN, S.-H. WANG, R. CHU, F. KING, T.R. JACK, and R.R. FESSLER, Effect of
Precyclic Loading on Stress-Corrosion-Cracking Initiation in an X-65 Pipeline Steel
Exposed to Near-Neutral pH Soil Environment, Metallurgical & Materials Transactions A
34A, p.2601-08.
[24] W. Zheng, D. Bibby, J.Li, J.T. Bowker, J.A. Gianetto, R.W. Revie, G. Williams, Near-
neutral pH SCC of two pipeline steel under quasi-static stressing conditions, Proceeding of
the 2006 International Pipeline Conference, ASME, paper No. IPC2006-10084.
[25] Z. Qin, B. Demko, J. Noël, D. Shoesmith, F. King, R. Worthingham, K. Keith, Localized
Dissolution of Millscale-Covered Pipeline Steel Surfaces, Corrosion 60(10), p. 906-914.

124
[26] G. Van Boven, W. Chen, R. Rogge, The role of residual stress in neutral pH stress corrosion
cracking of pipeline steels. Part I: Pitting and cracking occurrence, Acta Materialia 55,
p.29–42.
125
Chapter 6: Mill-scale Effect on Crack Initiation
in Pipeline Steels in Near-Neutral pH
Environment
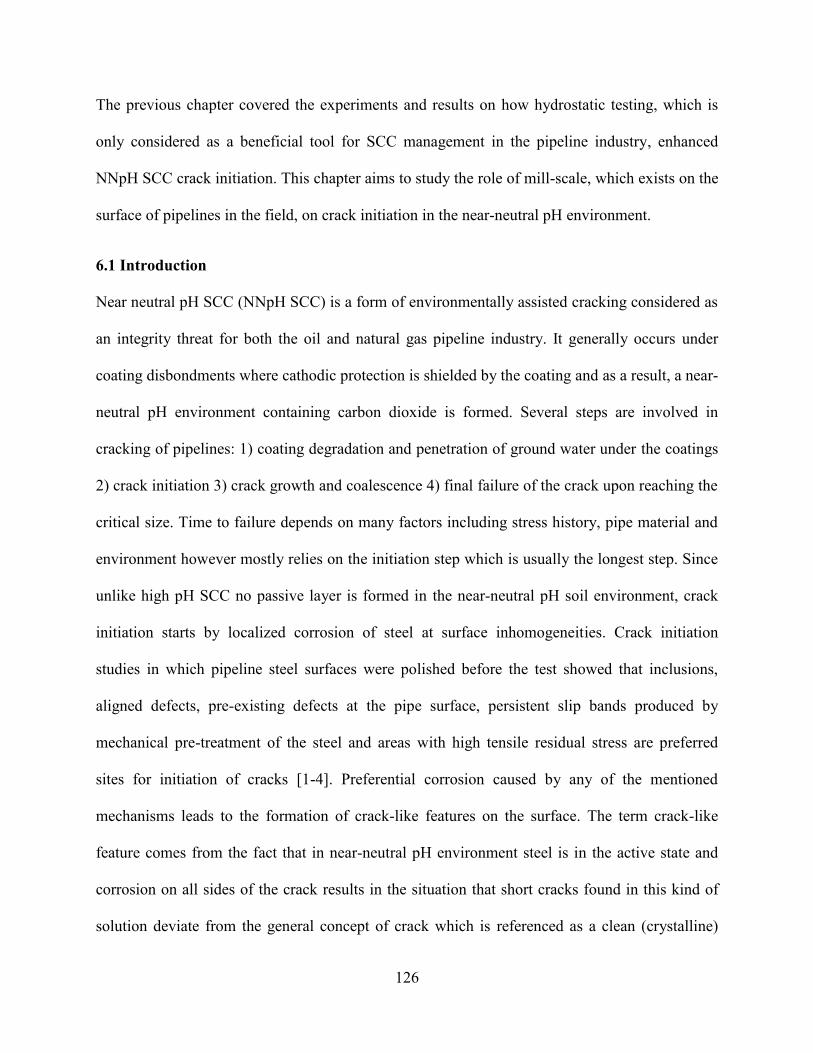
126
The previous chapter covered the experiments and results on how hydrostatic testing, which is
only considered as a beneficial tool for SCC management in the pipeline industry, enhanced
NNpH SCC crack initiation. This chapter aims to study the role of mill-scale, which exists on the
surface of pipelines in the field, on crack initiation in the near-neutral pH environment.
6.1 Introduction
Near neutral pH SCC (NNpH SCC) is a form of environmentally assisted cracking considered as
an integrity threat for both the oil and natural gas pipeline industry. It generally occurs under
coating disbondments where cathodic protection is shielded by the coating and as a result, a near-
neutral pH environment containing carbon dioxide is formed. Several steps are involved in
cracking of pipelines: 1) coating degradation and penetration of ground water under the coatings
2) crack initiation 3) crack growth and coalescence 4) final failure of the crack upon reaching the
critical size. Time to failure depends on many factors including stress history, pipe material and
environment however mostly relies on the initiation step which is usually the longest step. Since
unlike high pH SCC no passive layer is formed in the near-neutral pH soil environment, crack
initiation starts by localized corrosion of steel at surface inhomogeneities. Crack initiation
studies in which pipeline steel surfaces were polished before the test showed that inclusions,
aligned defects, pre-existing defects at the pipe surface, persistent slip bands produced by
mechanical pre-treatment of the steel and areas with high tensile residual stress are preferred
sites for initiation of cracks [1-4]. Preferential corrosion caused by any of the mentioned
mechanisms leads to the formation of crack-like features on the surface. The term crack-like
feature comes from the fact that in near-neutral pH environment steel is in the active state and
corrosion on all sides of the crack results in the situation that short cracks found in this kind of
solution deviate from the general concept of crack which is referenced as a clean (crystalline)
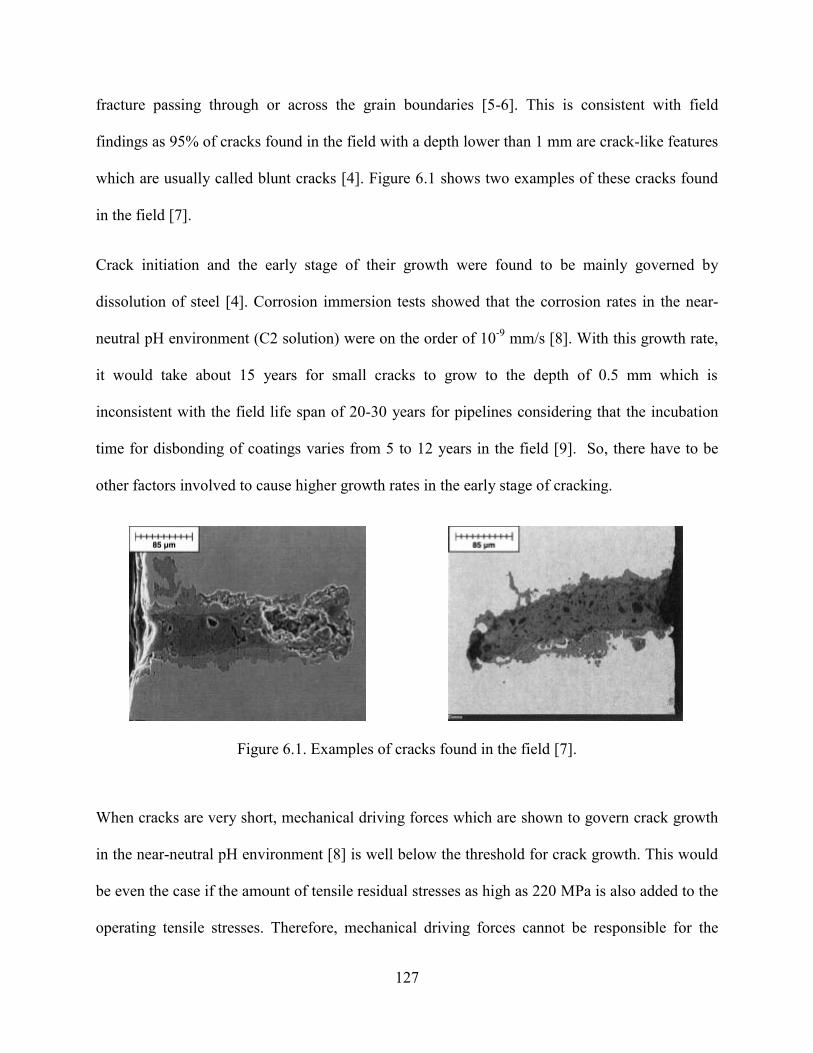
127
fracture passing through or across the grain boundaries [5-6]. This is consistent with field
findings as 95% of cracks found in the field with a depth lower than 1 mm are crack-like features
which are usually called blunt cracks [4]. Figure 6.1 shows two examples of these cracks found
in the field [7].
Crack initiation and the early stage of their growth were found to be mainly governed by
dissolution of steel [4]. Corrosion immersion tests showed that the corrosion rates in the near-
neutral pH environment (C2 solution) were on the order of 10-9
mm/s [8]. With this growth rate,
it would take about 15 years for small cracks to grow to the depth of 0.5 mm which is
inconsistent with the field life span of 20-30 years for pipelines considering that the incubation
time for disbonding of coatings varies from 5 to 12 years in the field [9]. So, there have to be
other factors involved to cause higher growth rates in the early stage of cracking.
Figure 6.1. Examples of cracks found in the field [7].
When cracks are very short, mechanical driving forces which are shown to govern crack growth
in the near-neutral pH environment [8] is well below the threshold for crack growth. This would
be even the case if the amount of tensile residual stresses as high as 220 MPa is also added to the
operating tensile stresses. Therefore, mechanical driving forces cannot be responsible for the
128
high growth rate of short cracks, compared to the dissolution rate in the near-neutral pH
environment.
One factor which is usually ignored in crack initiation and early growth studies is the effect of
mill-scale on the crack initiation process. Mill scale is believed to be cathodic with respect to
pipeline steel. When soil solution passes through mill scale pores and cracks and reaches the
steel substrate, this galvanic effect causes enhanced anodic dissolution of steel [10]. The
localized enhanced dissolution under mill scale promotes crack-like-features initiation. Mill scale
also has been shown to accelerate long crack growth by providing cathodic current for
dissolution of the crack tip [11]. The effect of mill-scale has only been investigated through
electrochemical tests or short term accelerated tests but not in long-term experiments and under
more realistic pipeline condition. Therefore, this study aimed to investigate the effect of mill
scale on crack initiation and growth of short cracks under a cyclic loading condition.
6.2 Experimental Procedure
To study the effect of mill-scale, a 30” OD X-52 pipeline with thickness 9.5 mm, which had been
in service for several years but the coating layer was intact on its surface, was selected. Two dog-
bone shaped and one long plate specimens were machined from the pipeline such that their
length was oriented in the longitudinal direction of the pipe so that specimens were covered with
coating and mill scale. For comparison purpose, two other dog-bone shaped specimens were cut
in the same direction but from the thickness of the pipe so that mill scale had been removed from
their surfaces.
In order to remove the coating layer on the specimens, pre-treatment was first performed on the
samples cut from the long plate and a procedure involved various sequences of immersion in
toluene, gentle brushing, and ultrasonic agitation was used to remove the coating on the samples.
129
After each sequence, the surface analysis was performed to determine if any coating has
remained on the surface. When all the coating was removed from the surface of samples, then the
same procedure was employed to remove the coating on the tensile specimens covered with the
mill scale. EDX and Raman Spectroscopy were used to characterize the mill scale on the samples
after the surface pre-treatment.
All samples had gauge dimensions of 32, 6 and 4 mm in length, width, and thickness,
respectively after the coating layer removal procedure.
The two specimens without mill scale were ground up to 1200 grit SiC paper and cleaned with
ethanol. Then all their surfaces except the front surface of the gauge section which was close to
the outside surface of the pipeline were coated with epoxy.
Then all tensile specimens were sealed in corrosion cells and exposed to a simulated ground
water solution, C2 solution, best characterizing the soil solution found around NNpH SCC cases.
The composition of the solution is listed in Table 6.1. The solution was purged with 5%CO2-N2
balance during and for 48 hours before the tests. The solution reached the pH value of 6.29.
Table 6.1. Chemical composition of C2 solution
Components Concentration (gr/L)
NaHCO3 0.0195
CaCO3 0.0606
CaCl2 0.0255
MgSO4.7H2O 0.0274
KCl 0.0035
The tensile specimens were then cyclically loaded under a triangular waveform with a maximum
stress equal to 100% of SMYS of X-52 pipeline, i.e. 358 MPa, a frequency of 10-4
Hz and a
loading ratio of 0.8. Pipelines usually operate at a maximum operating pressure equal to 75% of
their SMYS values, but the specimens in this study were cyclically loaded with a maximum
stress of 100% SMYS to include the effect of tensile residual stresses on the pipeline surface.
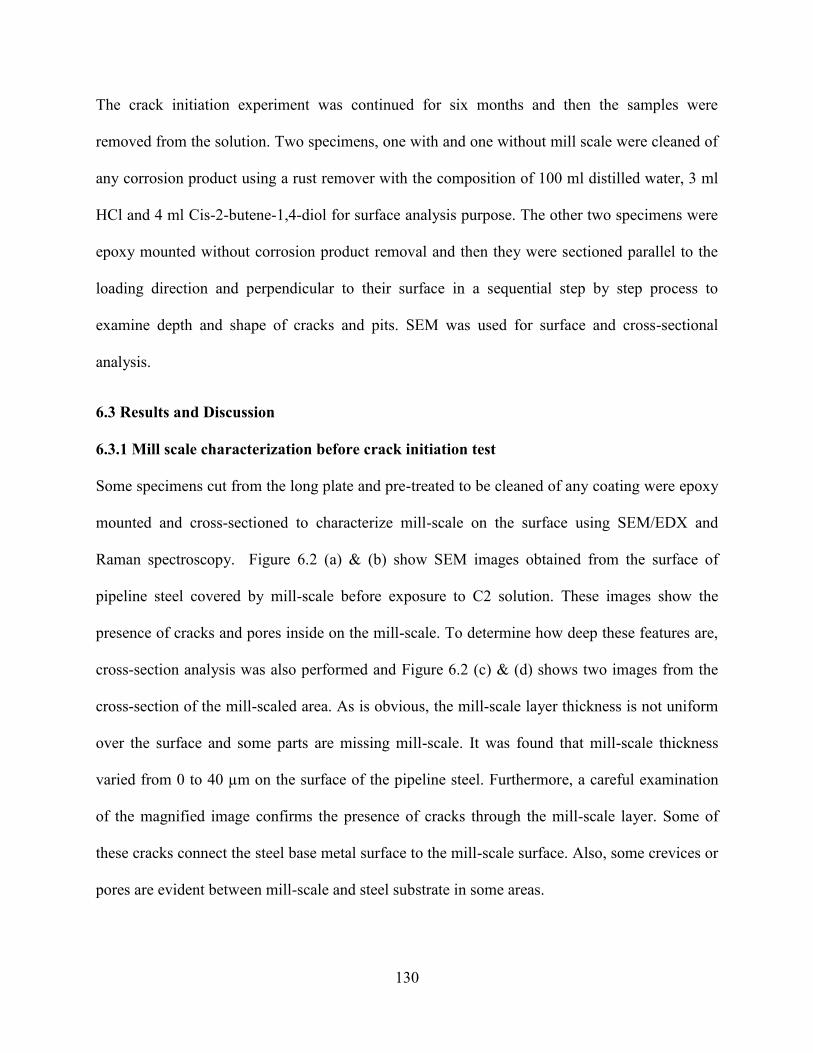
130
The crack initiation experiment was continued for six months and then the samples were
removed from the solution. Two specimens, one with and one without mill scale were cleaned of
any corrosion product using a rust remover with the composition of 100 ml distilled water, 3 ml
HCl and 4 ml Cis-2-butene-1,4-diol for surface analysis purpose. The other two specimens were
epoxy mounted without corrosion product removal and then they were sectioned parallel to the
loading direction and perpendicular to their surface in a sequential step by step process to
examine depth and shape of cracks and pits. SEM was used for surface and cross-sectional
analysis.
6.3 Results and Discussion
6.3.1 Mill scale characterization before crack initiation test
Some specimens cut from the long plate and pre-treated to be cleaned of any coating were epoxy
mounted and cross-sectioned to characterize mill-scale on the surface using SEM/EDX and
Raman spectroscopy. Figure 6.2 (a) & (b) show SEM images obtained from the surface of
pipeline steel covered by mill-scale before exposure to C2 solution. These images show the
presence of cracks and pores inside on the mill-scale. To determine how deep these features are,
cross-section analysis was also performed and Figure 6.2 (c) & (d) shows two images from the
cross-section of the mill-scaled area. As is obvious, the mill-scale layer thickness is not uniform
over the surface and some parts are missing mill-scale. It was found that mill-scale thickness
varied from 0 to 40 µm on the surface of the pipeline steel. Furthermore, a careful examination
of the magnified image confirms the presence of cracks through the mill-scale layer. Some of
these cracks connect the steel base metal surface to the mill-scale surface. Also, some crevices or
pores are evident between mill-scale and steel substrate in some areas.
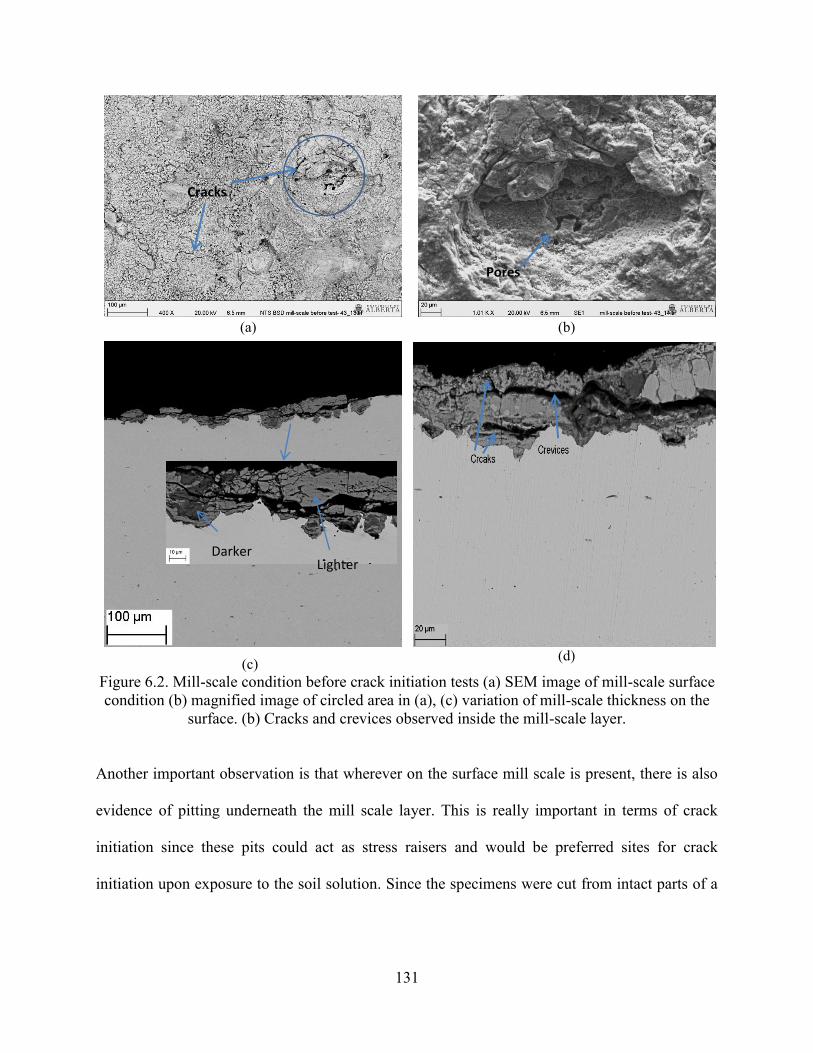
131
Another important observation is that wherever on the surface mill scale is present, there is also
evidence of pitting underneath the mill scale layer. This is really important in terms of crack
initiation since these pits could act as stress raisers and would be preferred sites for crack
initiation upon exposure to the soil solution. Since the specimens were cut from intact parts of a
(a)
(b)
(c) (d)
Figure 6.2. Mill-scale condition before crack initiation tests (a) SEM image of mill-scale surface
condition (b) magnified image of circled area in (a), (c) variation of mill-scale thickness on the
surface. (b) Cracks and crevices observed inside the mill-scale layer.
Darker Lighter
Pores
Cracks
132
pipeline with evidence of coating presence on their surface, it may be inferred that formation of
mill-scale on the pipeline is accompanied by the formation of pits on the pipeline steel surface.
Higher magnification SEM micrograph shown in Figure 6.2 (c) indicates that the mill scale layer
consists of two regions, which can be clearly distinguished in the backscattered electron images
as dark and light layers. The EDS analyses showed that these layers mainly consist of iron and
oxygen but their atomic ratio (O/Fe) are different. Table 6.2 lists the chemical composition of
elements found in the darker and lighter regions. The lighter area inside the mill-scale
consistently had lower O/Fe ratio compared to the darker area in all cross-sections studied.
Table 6.2. Chemical composition (at%) of dark and light regions inside the mill-scale obtained
by EDX.
Fe O Mn Si S Al
Lighter area 42 57 0.58 _ 0.23 _
Darker area 33 65 0.45 0.34 0.27 0.32
Raman spectroscopy analysis was also used to identify different areas inside the mill scale.
Figure 6.3 shows Raman spectroscopy results at darker and lighter areas. This figure indicates
that the darker area contains hematite (Fe2O3) with peak values (215, 273, 386, 480, 590)
compared to reference peak positions of 226, 292, 406, 495, 600 [12]. Raman spectroscopy
recorded at lighter regions inside the mill scale showed weak Raman peaks similar to the ones
found in the darker areas. In addition extra strong peaks at positions of 500 and 690 cm-1
were
seen in the Raman results which indicate the presence of magnetite (Fe3O4) in the lighter area.
Raman peaks for magnetite occurs at positions of 299, 523 and 678 cm-1
with the most intense
peak at 678 cm-1
[13]. The presence of hematite and magnetite in the mill scale on pipeline steels
has been also reported in other References [13-14].
133
Figure 6.3. Raman Spectroscopy results obtained at darker and lighter areas in the mill-scale.
6.3.2 Surface characterizations after crack initiation tests
After six months exposure to the C2 solution under cyclic load, the surface of one sample from
each condition were cleaned of any corrosion product using rust remover and surface analysis
was performed using SEM. Figure 6.4(a) shows typical surface features found on the surface of
mill-scaled specimens. In addition to the general corrosion, some large pits are also observed on
the surface. Surface analysis showed that crack initiation occurred at some of these large pits.
Figures 6.4 (b) & (c) show two examples of cracks initiated at these corrosion pits. Figure 6.4 (b)
shows a crack initiated through a pit, however, crack in Figure 6.4(b) was initiated at the bottom
of the pit.
For comparison, Figure 6.5 shows typical surface features found on the surface of specimens
without mill scale after six month exposure to the C2 solution. Similar to the mill-scaled
specimen, the occurrence of general corrosion on the whole surface is evident. In addition,
preferential corrosion in the form of very small pits is also observed in some regions on the
surface. The diameters of these pits were found to be less than 40 µm. In addition, pit surface
coverage was only 2% on average however this value was 12% for the mill-scaled specimens.
Since mill scale characterization in the last section demonstrated the presence of pits under the
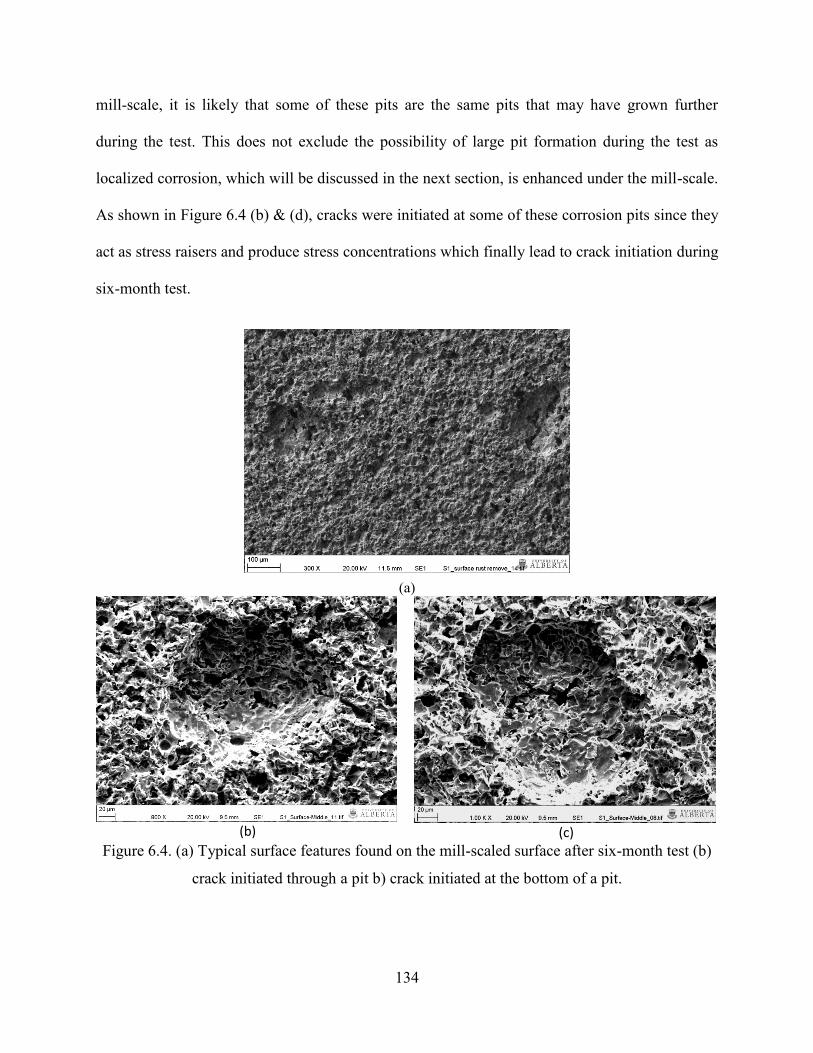
134
mill-scale, it is likely that some of these pits are the same pits that may have grown further
during the test. This does not exclude the possibility of large pit formation during the test as
localized corrosion, which will be discussed in the next section, is enhanced under the mill-scale.
As shown in Figure 6.4 (b) & (d), cracks were initiated at some of these corrosion pits since they
act as stress raisers and produce stress concentrations which finally lead to crack initiation during
six-month test.
(a)
(b)
(c)
Figure 6.4. (a) Typical surface features found on the mill-scaled surface after six-month test (b)
crack initiated through a pit b) crack initiated at the bottom of a pit.
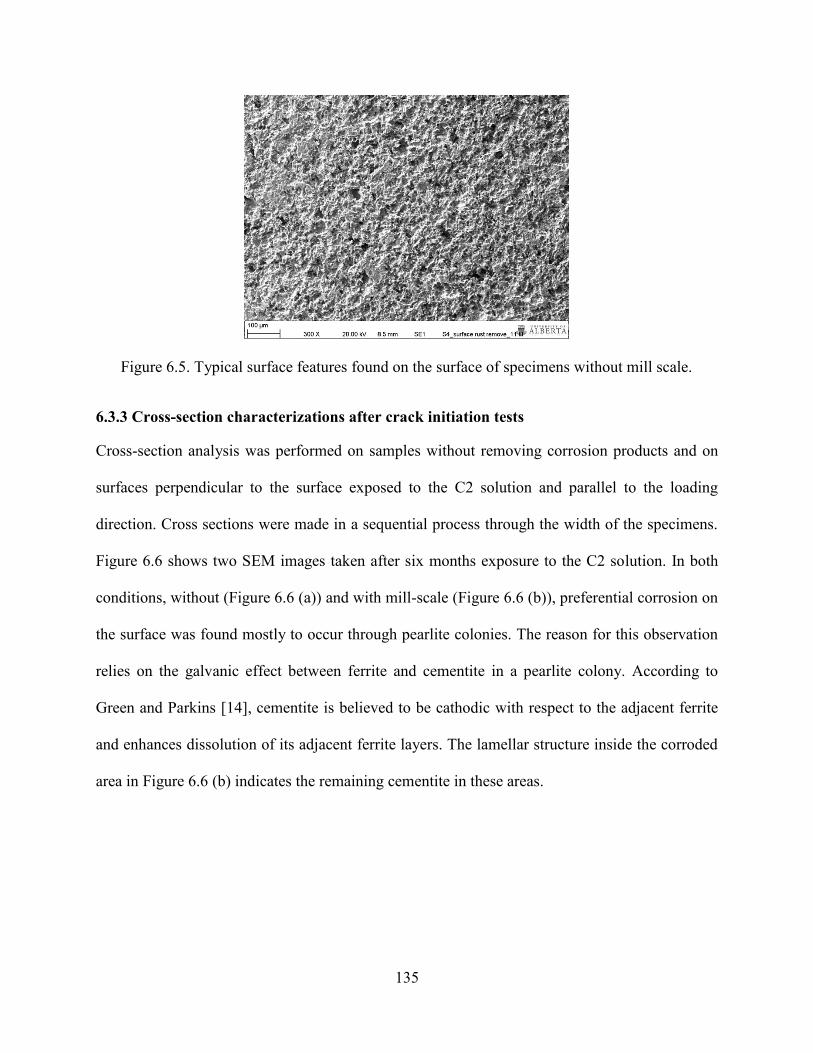
135
Figure 6.5. Typical surface features found on the surface of specimens without mill scale.
6.3.3 Cross-section characterizations after crack initiation tests
Cross-section analysis was performed on samples without removing corrosion products and on
surfaces perpendicular to the surface exposed to the C2 solution and parallel to the loading
direction. Cross sections were made in a sequential process through the width of the specimens.
Figure 6.6 shows two SEM images taken after six months exposure to the C2 solution. In both
conditions, without (Figure 6.6 (a)) and with mill-scale (Figure 6.6 (b)), preferential corrosion on
the surface was found mostly to occur through pearlite colonies. The reason for this observation
relies on the galvanic effect between ferrite and cementite in a pearlite colony. According to
Green and Parkins [14], cementite is believed to be cathodic with respect to the adjacent ferrite
and enhances dissolution of its adjacent ferrite layers. The lamellar structure inside the corroded
area in Figure 6.6 (b) indicates the remaining cementite in these areas.
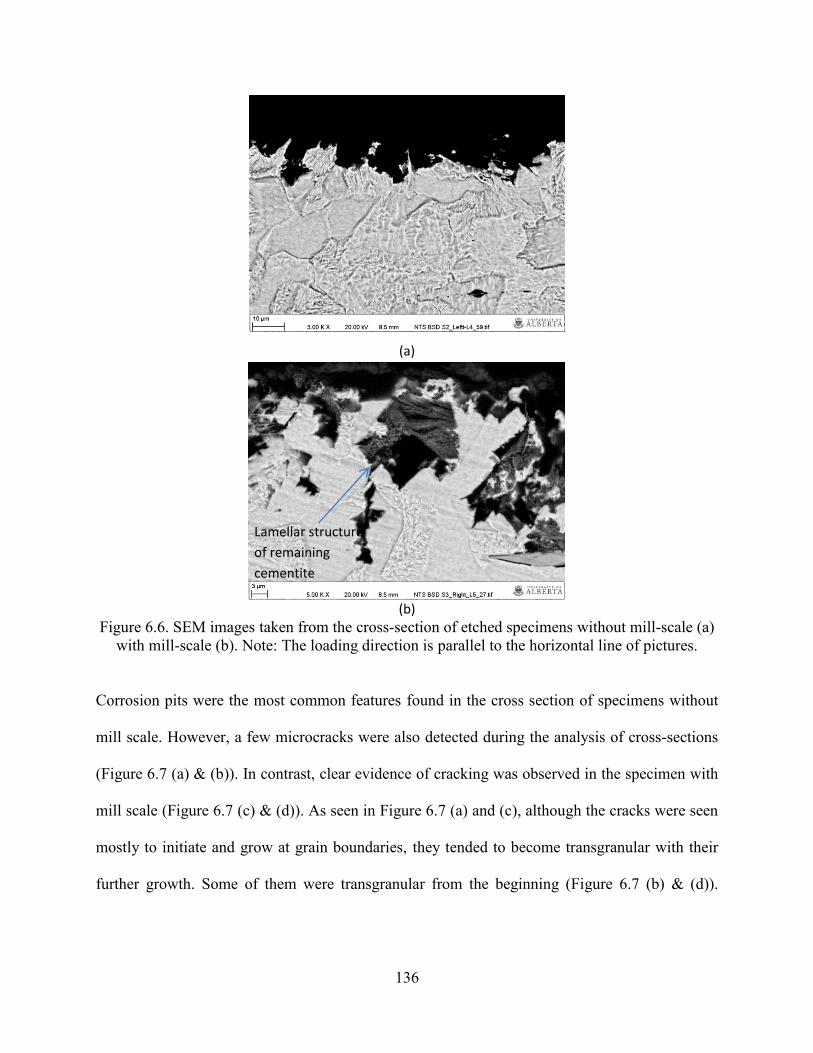
136
(a)
(b)
Figure 6.6. SEM images taken from the cross-section of etched specimens without mill-scale (a)
with mill-scale (b). Note: The loading direction is parallel to the horizontal line of pictures.
Corrosion pits were the most common features found in the cross section of specimens without
mill scale. However, a few microcracks were also detected during the analysis of cross-sections
(Figure 6.7 (a) & (b)). In contrast, clear evidence of cracking was observed in the specimen with
mill scale (Figure 6.7 (c) & (d)). As seen in Figure 6.7 (a) and (c), although the cracks were seen
mostly to initiate and grow at grain boundaries, they tended to become transgranular with their
further growth. Some of them were transgranular from the beginning (Figure 6.7 (b) & (d)).
Lamellar structure
of remaining
cementite
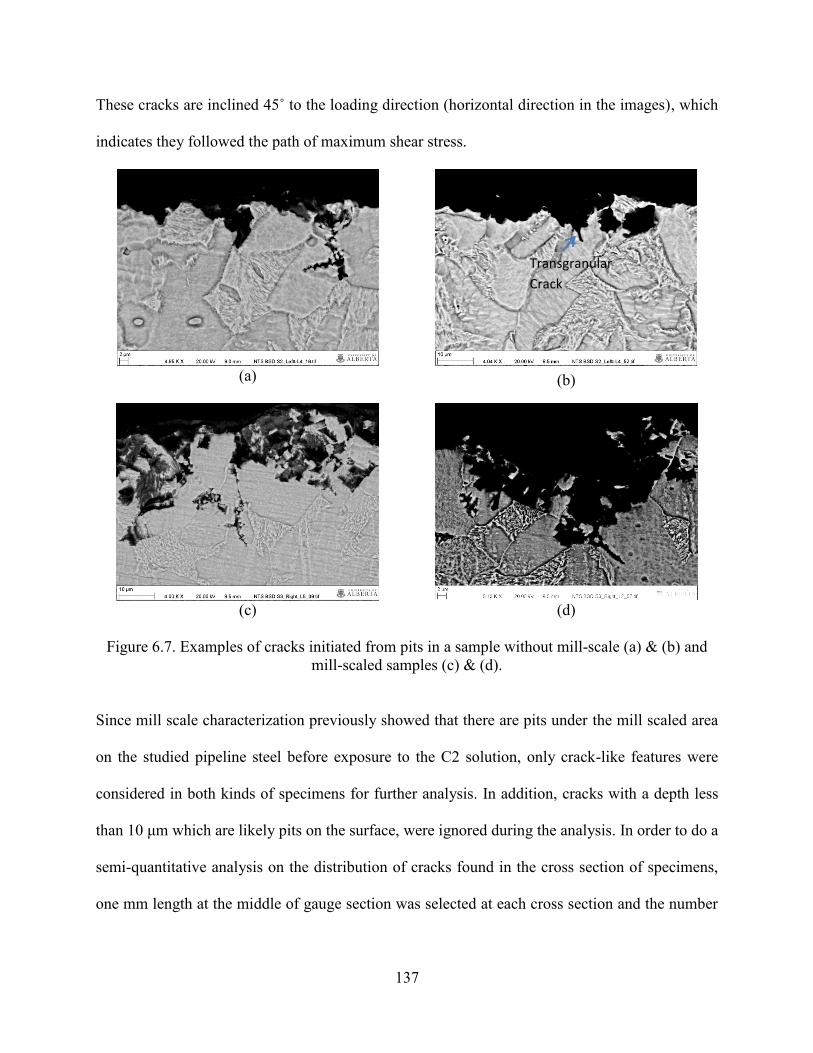
137
These cracks are inclined 45˚ to the loading direction (horizontal direction in the images), which
indicates they followed the path of maximum shear stress.
(a)
(b)
(b)
(c) (d)
Figure 6.7. Examples of cracks initiated from pits in a sample without mill-scale (a) & (b) and
mill-scaled samples (c) & (d).
Since mill scale characterization previously showed that there are pits under the mill scaled area
on the studied pipeline steel before exposure to the C2 solution, only crack-like features were
considered in both kinds of specimens for further analysis. In addition, cracks with a depth less
than 10 μm which are likely pits on the surface, were ignored during the analysis. In order to do a
semi-quantitative analysis on the distribution of cracks found in the cross section of specimens,
one mm length at the middle of gauge section was selected at each cross section and the number
Transgranular
Crack
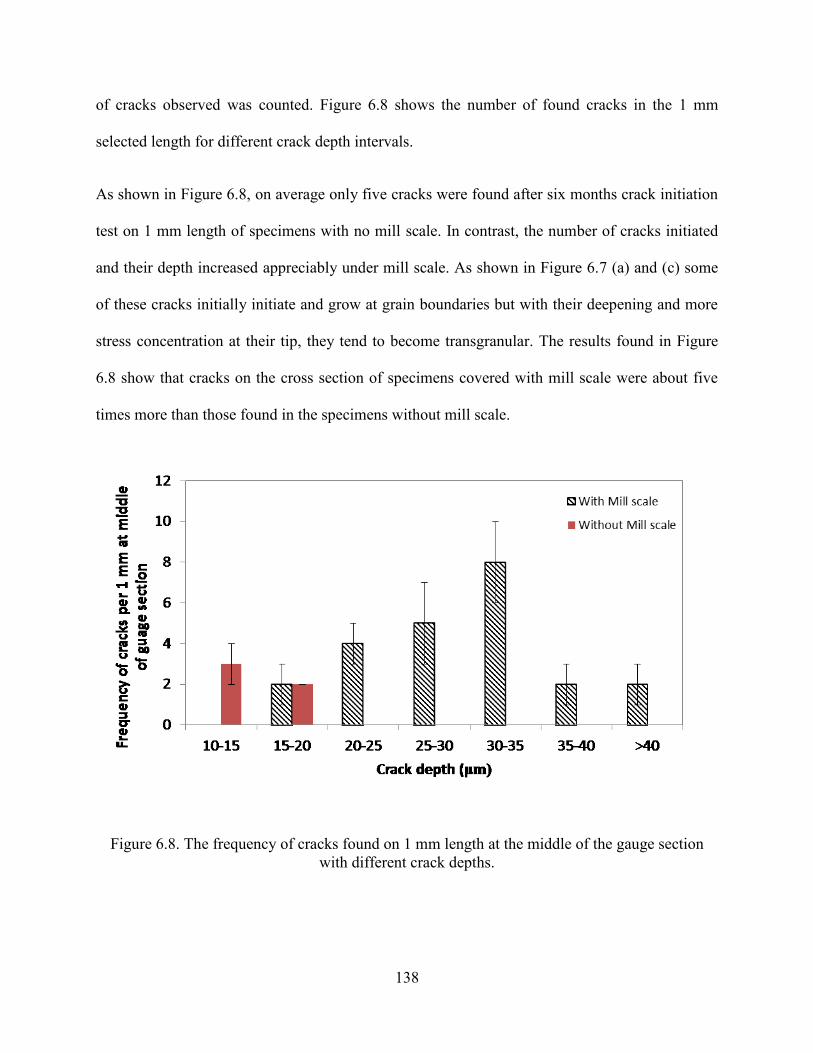
138
of cracks observed was counted. Figure 6.8 shows the number of found cracks in the 1 mm
selected length for different crack depth intervals.
As shown in Figure 6.8, on average only five cracks were found after six months crack initiation
test on 1 mm length of specimens with no mill scale. In contrast, the number of cracks initiated
and their depth increased appreciably under mill scale. As shown in Figure 6.7 (a) and (c) some
of these cracks initially initiate and grow at grain boundaries but with their deepening and more
stress concentration at their tip, they tend to become transgranular. The results found in Figure
6.8 show that cracks on the cross section of specimens covered with mill scale were about five
times more than those found in the specimens without mill scale.
Figure 6.8. The frequency of cracks found on 1 mm length at the middle of the gauge section
with different crack depths.
139
As shown in all images of the cross-sections of the mill-scaled specimens after six-month
immersion into the C2 solution, the mill-scale detached from the surface during the test in many
regions of the surface. Mill-scaled steel is known to have a potential more noble than the steel
[10,15] so it is cathodic with respect to the steel substrate and will undergo a cathodic reaction
when it is coupled with the anodic dissolution of the underlying steel. In the mill-scale
characterization before the long term test, it was shown that the mill-scale contained cracks and
pores some of which connected the surface to the base metal. During the exposure to the
solution, it gradually penetrates through these cracks and pores and reaches the steel substrate
where promotes localized dissolution of the steel (Fe →Fe2+
+2e-) underneath the mill-scale.
This localized corrosion is enhanced by the galvanic coupling between the mill-scale and the
steel substrates. The large area of mill-scale compared to the small area of anodic sites
underneath the cracked mill-scale causes more corrosion enhancement. During initial days of
exposure to the solution that pores and cracks are still narrow, two cathodic reactions have been
proposed, both of which lead to dissolution of iron oxides [10,16-17]:
→ (6.1)
→ (6.2)
This reductive dissolution of oxide layers will result in the opening of cracks and crevices as the
mill-scale oxides are dissolved. So, the porosity of the mill-scale increases over time. This has
been shown by other researchers during 42 days exposure to the near-neutral pH environment
[10]. Over time, as cracks open up and more solution is exposed to the base metal, active
corrosion of steel dominates and hydrogen (carbonic acid) reduction reaction occurs on either the
steel surface or the mill-scale. As faster hydrogen reduction rates have been reported on the mill-
140
scale surface compared to the mill-scale free steel surface [18-19], localized dissolution of steel
under the large area of mill-scale remains enhanced during the active dissolution of steel. This
improved localized corrosion underneath the mill-scale results in deep pits, which act as stress
raisers for initiation of cracks, in a shorter time. The increased frequency of cracking on the mill-
scaled specimens, shown in Figure 6.8, also confirms this statement. In contrast, in specimens
with a polished surface which undergo a more uniform type of corrosion, a longer time is needed
to form deep pits at surface discontinuities that could eventually initiate any crack.
As long as the mill-scale is in contact with the surface, the enhanced localized corrosion because
of enhanced cathodic reactions on mill-scale continues. However, with the formation of
corrosion products at the cracked area inside the mill-scale and opening up of the crevices
between mill-scale and steel substrate, a detachment of the mill-scale from the surface under the
effect of applied loads will eventually happen. This also can explain the absence of mill-scale on
most of the specimen surface after six-month test. 42-day immersion tests without application of
any load conducted by other researchers showed that the mill-scale was still present on the
surface after the test [10] however detachment of the mill-scale from the surface could be faster
under loading condition. Further investigation is needed to determine how long mill-scale will be
stable on the surface to find the duration of enhanced corrosion rates.
Tape coating systems on pipelines, which are more conducive to SCC, usually consist of two or
three layers. A primer which is applied directly to the pipeline surface is an essential part of the
coating system. If a pipeline with a disbonded coating is considered in the field, adhesive primer
layer on the mill-scaled pipeline and the detached coating, which is confined by soil, would keep
the mill-scale in contact with the steel for a longer period of time. Therefore, the enhanced
corrosion on the pipeline surface in contact with the mill-scale would continue during the
141
operation of pipelines. In addition, larger short crack propagation than what observed in this
study is also expected in the field. One thing that should be considered in future studies is that
the galvanic effect between steel and mill-scale can also be present in the later stage of cracking
and during long crack propagation. This can result in higher long crack grow rates in stage II of
cracking, which is governed by the corrosion fatigue mechanism. This is needed to be addressed
in future studies.
6.4 Conclusions
In this study, a six-month corrosion test under cyclic load condition was conducted to investigate
the effect of mill scale on NNpH SCC initiation on X-52 pipeline steel. The summary of
conclusions is as follows:
Mill-scale characterization before exposure to the solution showed that the mill-scale on
the surface of pipelines was porous and cracked. Upon exposure to the solution, these
cracks result in penetration of the solution through the mill-scale surface to the steel
substrate and cause localized corrosion under the mill-scale.
After crack initiation experiments, a larger percentage of pit coverage was observed on
the surface of the mill-scaled specimens. Some of the large pits observed on these
specimens were shown to initiate crack by acting as stress raisers on the specimen
surface.
On the mill-scaled specimens, corrosion was observed to be more pronounced and
primary sites for localized corrosion were along pearlite colonies.
Cracks in the near-neutral pH environment can initiate along grain boundaries but with
their further growth, they tend to become transgranular.

142
Enhanced corrosion under the mill scale increased crack initiation frequency by about
five times. This enhanced corrosion can be continued as long as the mill-scale is in
contact with the steel substrate. Given that pipelines in the field are confined by soil and
the mill-scale is covered by primer, higher crack growth is expected in the field.
143
Reference
[1] F. King, T. Jack, W. Chen, S.-H. Wang, M. Elboujdaini, W. Revie, R. Worthingham, P.
Dusek, Development of a predictive model for the initiation and early-stage growth of
near-neutral pH SCC of pipeline steels, Proc. Corrosion 2001, NACE International
(Houston, TX), paper no. 01214.
[2] Y.Z. Wang, R.W. Revie, M.T. Shehata, R.N. Parkins, Early stages of stress corrosion crack
development of X-65 pipeline steel in near-neutral pH solution, Proc. Materials for
Resource Recovery and Transport, L. Collins (ed.), Metallurgical Society of Canadian
Institute of Mining, Metallurgy and Petroleum (CIM), Montreal, QC, p. 71-93.
[3] Y.Z. Wang, R.W. Revie, M.T. Shehata, R.N. Parkins, K. Krist, Initiation of environment
induced cracking in pipeline steel: microstructural correlations, Proc. the 1998
International Pipeline Conf. vol. 1, ASME International, New York, NY, p. 529-542
[4] W. Chen, An overview of near-neutral pH SCC in pipelines and mitigation strategies for its
initiation and growth, Corrosion 72 (7), p. 962-977.
[5] ISO 6157-1:1988, Fasteners -Surface discontinuities -Part 1: Bolts, screws and studs for
general requirements
[6] ASTM A788, Standard Specification for Steel Forgings, General Requirements
[7] W. Chen, F. King, E. Vokes, Characteristics of Near-Neutral-pH Stress Corrosion Cracks in
an X-65 Pipeline, Corrosion 58(3), p. 267-275.
[8] W. Chen and R. L. Sutherby, Crack Growth Behavior of Pipeline Steel in Near-Neutral pH
Soil Environments, Metall. Maters Tran. 38 A, p.1260-68.
[9] K. Chevil, W. Chen, G.V. Boven, R. Kania, J. been, Correlating corrosion field data with
experimental findings for the development of pipeline mitigation strategies, Proc. the 2014
Inter. Pipeline. Conf., ASME, Paper no. IPC2014-33678.
[10] Z. Qin, B. Demko, J. Noel, D. Shoesmith, F. King, Localized Dissolution of Millscale-
Covered Pipeline Steel Surfaces, Corrosion 60(10), p.906.
[11] J. Been, H. Lu, F. King, T. Jack, R. Sutherby, The role of hydrogen in EAC of pipeline
steels in near-neutral pH environments, in Environment-Induced Cracking of Materials,
Edited by: S.A. Shipilov, R.H. Jones, J.-M. Olive and R.B. Rebak, 2008, p.255.
[12] M.A. Legodi, D. de Waal, The preparation of magnetite, goethite, hematite and maghemite
of pigment quality from mill scale iron waste, Dyes and Pigments 74, p.161-168.

144
[13] B.W.A. Sherar, P.G. Keech , D.W. Shoesmith, The effect of sulfide on the aerobic corrosion
of carbon steel in near-neutral pH saline solutions, Corr. Sci. 66 , p.256–262.
[14] J.A.S. Green, R.N. Parkin, Electrochemical properties of ferrite and cementite in relation to
stress corrosion of mild steels in Nitrate solutions, Corrosion 24(3), p.66-69.
[15] P.A. Schweitzer, Corrosion and Corrosion Protection Handbook, Second Edition, Marcel
Dekker Inc. 1988, p. 6.
[16] D.S. Mancey, The Dissolution of Magnetite Films from Carbon Steel Surfaces, Ph.D. thesis,
Univ. of Manitoba, Canada, 1985.
[17] M.J. Pryor, U.R. Evans, The reductive dissolution of ferric oxide in acid. Part I. The
reductive dissolution of oxide films present on iron, J. Chem. Soc. (1950) p. 1259.
[18] T.R. Jack, F. King, L. Yang, R. Sutherby, Kinetic Isotope Effects in the Corrosion and
Hydrogen Loading of Line Pipe Steel: Implications for Stress Corrosion Cracking, Proc.
Environmental Degradation of Materials and Corrosion Control in Metals, eds. J. Luo, M.
Elboujdaini, D. Shoesmith, P.C. Patnaik, Montreal, PQ: Canadian Inst. of Mining,
Metallurgy, and Petroleum, 2003, p. 205.
[19] J. Been, H. Lu, F. King, T. Jack, R. Sutherby, The role of hydrogen in EAC of pipeline
steels in near-neutral pH environments, in Environment-Induced Cracking of Materials,
Edited by: S.A. Shipilov, R.H. Jones, J.-M. Olive and R.B. Rebak, 2008, p.255.

145
Chapter 7: Conclusions and Recommendations
146
7.1 Summary and Conclusions
In the first stage of the research, hydrogen permeation experiments were performed using a
specially-designed double cell which simulated the coating disbondment in the hydrogen
charging side of the cell. This cell enabled the author to study and compare the effects of
different parameters on hydrogen permeation behavior at various sections with specified distance
from the open mouth of the simulated disbondment. Summary of the conclusions of this stage of
the research is as follows:
1) Hydrogen permeation behaviour at different sections along the disbondment under OCP
and CP levels was governed by the constant concentration boundary condition.
2) Under OCP condition at wide disbondments, development of a CO2 gradient inside the
disbondment caused the corrosion to decrease inside the disbondment and as a result sub-
surface hydrogen reduced as the distance from the open mouth of the disbondment
increases.
3) Under OCP condition at narrow disbondments, corrosion inside the disbondment was
even more suppressed in contrast to wide disbondments. However, the average sub-
surface hydrogen concentration was the highest at the intermediate gap sizes (5 mm).
This suggests that current corrosion and SCC preventive approaches should be based on
the coating condition in the field.
4) Immediately after disbondment of coating from the pipe while the gap size between the
pipe and the coating is still narrow, the corrosion would be limited inside the disbodment
because of the limited availability of CO2 there. However, continuous absorption of
hydrogen into the pipe under these disbondments can contribute to the growth of nearby
cracks.
147
5) Increasing the CO2 gas concentration in the solution had no significant effect on the sub-
surface hydrogen concentration. The initial increase from 2 to 5% slightly increased the
hydrogen concentration. With further increase in the CO2 concentration,a thick corrosion
product layer was formed that reduced the ingress of the hydrogen into the steel and,
consequently, final sub-surface hydrogen concentration remained almost unchanged.
6) Since surface condition on the pipe surface under the disbonded condition can change
over time, as evidenced by the formation of a corrosion product layer that inhibited
hydrogen ingress at high CO2 concentrations, it is essential to conduct long-term
hydrogen permeation experiments to identify the true role of the environment.
7) Considering CP levels applicable to NNpH SCC cases, potentials about 60 mV cathodic
to the OCP condition results in the highest sub-surface hydrogen concentration. With
further increase in the CP level, the sub-surface hydrogen concentration decreases
because of formation of calcium carbonate on the surface. Assuming a CP potential close
to those applied in the field, in the range of -0.9 to -1 V (SCE), at the open mouth of the
disbondment, this observation suggests that the highest level of hydrogen is generated at
regions a little away from the open mouth which receive poor cathodic potential. This is
consistent with the results from the field and literature that cracking is dominant in poorly
protected regions.
8) CP levels higher that than -1 V (SCE) resulted in a large increase in sub-surface hydrogen
concentration. However, these levels of CP are not applicable to NNpH SCC cases.
In the second stage of the research, the goal was to find the effect of hydrostatic testing and mill-
scale on the crack initiation process. For studying the first parameter, some pre-pits were
generated on the tensile specimens using a developed procedure which was described in Chapter
148
4. The purpose of these pre-pits was to enhance the crack initiation process as well as simulating
some possible stress raisers in the field. For studying the mill-scale effect, tensile specimens of
the same size with mill-scale and without mill-scale were tested. The following conclusions were
made based on the results from this stage of the research:
1) On pre-pitted specimens, corrosion pits were found to be the preferred crack initiation
sites for 70% of the cracks. This percentage was higher than 80% when the effect of mill-
scale was considered.
2) 77% of the studied pre-pits that had undergone three hydrotests initiated cracks in the
depth direction. However, only 20% of pre-pits initiated cracks in the control specimens
on which no hydrotesting had been applied. Higher stress concentration produced during
the hydrotesting which subsequently increases the level of plastic deformation around
pits was responsible for initiation of more cracks from pre-pits in the hydrotested
specimens. This suggests that application of hydrotesting on pipeline sections which have
dents and gouges on their surface should be prevented or limited in the field.
3) The maximum crack depth found in the specimens which had undergone three hydrotests
was approximately 70% more than in the control specimens. Moreover, the frequency of
these cracks was also higher in hydrotested specimens. The larger growth of short cracks
in hydrotested specimens was attributed to the plastic deformation-enhanced corrosion.
4) The presence of cracks and pores in the mill scale caused localized corrosion of the
underlying steel upon exposure to the soil solution. This localized corrosion was
accelerated by the enhanced cathodic reactions on the mill-scale which resulted in the
formation of deep pits. These pits were shown to facilitate crack initiation.
149
5) Crack occurrence in specimens with mill-scale was found to be five times more than that
of without mill-scale. In addition, these cracks were deeper than cracks found in
specimens with a polished surface. This indicated the higher crack growth rates in mill-
scaled specimens.
6) The presence of primer on the mill-scale and confinement of pipelines by soil are
expected to result in higher and prolonged enhanced corrosion under the mill-scale in the
field pipelines.
7.2 Recommendations for Future Work
1) In this study, mill-scale and hydrostatic test were considered separately. If any synergistic
effects exist between these two conditions, it can only be observed when both are
considered together. Their combined effect may result in the much higher growth of short
cracks in the NNpH environment. It is recommended to consider both conditions
simultaneously.
2) The observed effects of mill-scale and hydrotest on crack initiation were found at OCP
condition in this study, assuming that the CP is fully shielded. Since their effects mainly
are attributed to the increased corrosion levels, it would be interesting to know their
effects when complete or poor cathodic protection is provided. In this condition presence
of higher levels of hydrogen from CP can change the observed scenario.
3) Since the gap size of real disbondments in the field changes along the length of
disbondment. It is recommended that for conducting similar hydrogen permeation
experiments, a disbondment geometry more close to the field be used.
4) In the crack initiation experiments conducted in this study, a constant amplitude loading
condition was used. Actual pipelines do not typically experience constant amplitude and

150
frequency pressure fluctuations, so it is recommended a loading condition more close to
pressure changes in the field pipelines in selected in future crack initiation experiments.
5) Since the mill-scale after six-month crack initiation test had been removed from most of areas
on the specimens‟ surface, it is recommended to run shorter time tests to determine for how
long mill-scale would be stable on the specimen. This may provide more information
regarding the effect of mill-scale on the corrosion rate of its underlying steel.
151
References
Chapter 1
[1] https://www.neb-one.gc.ca/sftnvrnmnt/sft/pplnrptr/index-eng.html
[2] National Energy Board, 1996, "Public Enquiry Concerning Stress Corrosion Cracking on
Canadian Oil and Gas Pipelines," report #MH-2-95.
[3] W. Chen, An overview of near-neutral pH SCC in pipelines and mitigation strategies for its
initiation and growth, Corrosion 72 (7), p. 962-977.
[4] Z. Qin, B. Demko, J. Noel, D. Shoesmith, F. King, Localized Dissolution of Millscale-
Covered Pipeline Steel Surfaces, Corrosion, 60 (10), p. 906.
[5] J. Li, M. Elboujdaini, M. Gao, R.W. Revie, Investigation of plastic zones near SCC tips in a
pipeline after hydrostatic testing, Materials Science and Engineering A 486, p. 496–502
[6] B.T. Lu, J.L. Luo, P.R. Norton, Environmentally assisted cracking mechanism of pipeline
steel in near-neutral pH groundwater, Corrosion Science 52, p. 1787–1795.
[7] B. Fang, R. Eadie, W. Chen, and M. Elboujdaini, A Passivation/Acid-Immersion Technique
to Grow Pits in Pipeline Steel and a Study of the Resulting Pit Nucleation and Growth,
Corrosion Engineering, Science and Technology 44(1), p.32-42.
Chapter 2
[1] http://www.cepa.com/about-pipelines/why-pipelines
[2] https://www.neb-one.gc.ca/sftnvrnmnt/sft/pplnrptr/index-eng.html
[3] D.A. Jones, Principles and Prevention of Corrosion, Upper Saddle River, NJ: Prentice Hal,
1996.
[4] J. R. Davis, Corrosion: Understanding the Basics, ASM International Publication, Materials
Park Ohio, 2000, p.416.
[5] E. S. Menon, Transmission Pipeline Calculations and Simulations Manual, Gulf Professional
Publishing, USA, 2014, p.84.
[6] Final Staff Report on Investigation of Tennessee Gas Transmission Company Pipeline No.
100-1 near Natchitoches, Louisiana, March 1965, Docket No. CP65-267, Federal Power
Commission, Bureau of Natural Gas, Washington, D.C., 1965.
[7] B. Delanty and J.O'Beirne, Major Field Study Compares Pipeline SCC with Coatings, Oil
and Gas Journal, Jun (1992), p.39.
152
[8] R.N. Parkins, Environment sensitive cracking (low pH SCC) of high-pressure pipelines,
AGA NG-18 report No. 191, AGA catalog No. 51623, 1990.
[9] National Energy Board, Public Enquiry Concerning Stress Corrosion Cracking on Canadian
Oil and Gas Pipelines, report # MH-2-95, 1996.
[10] R.N. Parkins, A review of stress corrosion cracking of high pressure pipelines, Corrosion
2000, Paper No. 00363.
[11] B.Y. Fang, A. Atrens, J.Q. Wang, E.H. Han, Z.Y. Zhu and W. Ke, Review of stress
corrosion cracking of pipeline steels in “low” and “high” pH solutions, J. Mater. Sci.
(2003), p. 127-132.
[12] G. H. Koch, J. A. Beavers, and W. E. Berry, Effect of Temperature on Stress-Corrosion
Cracking of Pre-cracked Pipeline Steels, NG-18 Report No. 148, American Gas
Association, Arlington, VA, 1985, Catalog No. L51491.
[13] F. Song , Overall Mechanisms of High pH and Near-Neutral pH SCC, Models for
Forecasting SCC Susceptible Locations, and Simple Algorithms for Predicting High pH
SCC Crack Growth Rates, NACE 2008, Paper No. 8129.
[14] J. A. Beavers, Integrity Management of Natural Gas and Petroleum Pipelines Subject to
Stress corrosion Cracking, Corrosion 70(1), p.3.
[15] R. N. Parkins, W. K. J. Blanchard, and B. S. Delanty, Transgranular Stress Corrosion
Cracking of High-Pressure Pipelines in Contact with Solutions of Near Neutral pH,
Corrosion 50 (5), p. 394-408.
[16] R.N. Parkins and J.A. Beavers, Some Effects of Strain Rate on the Transgranular Stress
Corrosion Cracking of Ferritic Steels in Dilute Near-Neutral-pH Solutions, Corrosion 59
(3), p. 258-273.
[17] J. Zhao, W. Chen, M. Yu, K. Chevil, R. Eadie, G. Van Boven, R. Kania, J. Been, S. Keane,
Crack growth modelling and life prediction of pipeline steels exposed to near-neutral pH
envrionments. Part I: Dissolution crack growth and occurrence of crack dormancy in stage
I. Metallurgical and Materials Transactions A, under consideration.
[18] M.J. Wilmott, R.L. Sutherby, The role of pressure and pressure fluctuations in the growth of
stress corrosion cracks in line pipe steel, Proceeding of 2nd International Pipeline
Conference Vol.1, ASME, New York, 1998, p. 409-421.
153
[19] W. Chen, An overview of near-neutral pH SCC in pipelines and mitigation strategies for its
initiation and growth, Corrosion 72 (7), p. 962-977.
[20] W. Zhang, F.A. Macleod, R.W. Revie, W.R. Tyson, G. Shen, D. Kiff, M. Skaff, E.W.
Wong, Recent progress in the study of transgranualr SCC in line pipe steels, Corrosion-
Deformation Interactions CDI 96, Editor: T. Magnin, The Institute of Materials publisher,
London, 1996.
[21] S.X. Mao, B. Gu, N. Q. Wu and L. Qiao, The mechanism of hydrogen-facilitated anodic-
dissolution-type stress corrosion cracking: theories and experiments, Philosophical
Magazine A 81(7), p. 1813-1831.
[22] B.T. Lu, L.J. Qiao, J.L. Luo, K.W. Gao, Role of hydrogen in stress corrosion cracking of
austenitic stainless steels. Philosophical Magazine, 91, p.208–228.
[23]. B.T. Lu, J.L. Luo, P.R. Norton, H.Y. Ma, Effects of dissolved hydrogen and elastic and
plastic deformation on active dissolution of pipeline steel in anaerobic groundwater of
near-neutral pH, Acta Materialia 57, p. 41–44.
[24] J. A. Beavers, "Near-neutral pH SCC: Dormancy and re-initiation of stress corrosion
cracks", Final Report for Gas Research Institute, GRI-05/0009, GRI, Des Plaines, IL, USA,
2004.
[25] J.A. Beavers, and C.E. Jaske, Effects of Pressure Fluctuations on SCC Propagation, Final
report to PRCI, Project PR 186-9706, Cat. No. L51872, 2002.
[26] X.Y. Zhang, S.B. Lambert, R. Sutherby, A. Plumtree, Transgranular Stress Corrosion
Cracking of X-60 Pipeline Steel in Simulated Ground Water, Corrosion 55 (3), pp. 297-
305.
[27] W. Chen and R. L. Sutherby, Crack Growth Behavior of Pipeline Steel in Near-Neutral pH
Soil Environments, Metallurgical and Materials Transactions A, 38A, p. 1260-1268.
[28] X. Xing, W. Chen, H. Zhang, Prediction of crack propagation under cyclic loading based on
hydrogen diffusion, Materials Letters 52, p. 86-89.
[29] M. Yu, W. Chen, R. Kania, J. Been, G. V. Boven, Depressurization-Induced Crack Growth
Enhancement for Pipeline Steels Exposed to Near-Neutral pH Environments, Proceedings
of the 2014 10th International Pipeline Conference, ASME, Paper No. 33282
154
[30] A. Egbewande, W. Chen, R. Eadie, R. Kania, G. V. Boven, R. Worthingham, J. Been,
Transgranular crack growth in the pipeline steels exposed to near-neutral pH soil aqueous
solutions: Discontinuous crack growth mechanism, Corr. Sci. 83, p. 343–354
[31] B.W. Williams, S.B. Lambert, A. Plumtree, R. Sutherby, Environmental crack growth under
variable amplitude loading of pipeline steel, Corrosion 60 (1), p. 95-103.
[32] X.-Y. Zhang, S. B. Lambert, R. Sutherby, A. Plumtree, Transgranular Stress Corrosion
Cracking of X-60 Pipeline Steel in Simulated Ground Water, corrosion 55 (3), p. 297-305.
[33] J. Been, B. Carroll, A. Dinovitzer, R. Sutherby, Stress intensification and crack growth in
the presence of dents on pipelines, Proceedings of 2006 International Pipeline Conference,
ASME, New York, NY, paper No. IPC2006-10415.
[34] M.P.H. Brongers, J.A. Beavers, SCC in areas of local deformation, Gas Research Institute
report, 2005, GRI-04/0127
[35] T.R. Walker, R.J. Pick, Approximation of the axial strains developed during the roll forming
of ERW pipe. Journal of Materials Processing Technology, 22 (1), p.29–44.
[36] S.K. Bate, D. Green, D. Buttle, A Review of Residual Stress Distributions in Welded Joints
for the Defect Assessment of Offshore Structures, HSE Books, 1997.
[37] P. Prevéy, and D. Hornbach, Residual Stress in Pipelines, in Oil and Gas Pipelines: Integrity
and Safety Handbook, ed. R. W. Revie, John Wiley & Sons, Inc., New Jersey (2015).
[38] J.A. Beavers, and W.V. Harper. Stress Corrosion Cracking Prediction Model. NACE
International Corrosion, 2004, Paper No. 04189.
[39] J.A. Beavers, J.T. Johnson, and R.L. Sutherby, Materials factors influencing the initation of
Near-Neutral pH SCC on underground pipelines, Proceedings of 2000 International
Pipeline Conference Vol. 2, ASME, New York, NY, pp. 979-988.
[40] M. P. H. Brongers, J.A. Beavers, C.E. Jaske, Effect of Hydrostatic Testing on Ductile
Tearing of X-65 Line Pipe Steel with Stress Corrosion Cracks, Corrosion 56 (10), p. 1050-
1058.
[41] J. Li, M. Elboujdaini, M. Gao, R.W. Revie, Investigation of plastic zones near SCC tips in a
pipeline after hydrostatic testing, Materials Science and Engineering A 486, p.496–502.
[42] W. Chen, R. Sutherby, Laboratory Simulation of Hydrostatic Test in Near-Neutral pH Soil
Environments, Proceedings of 2006 International pipeline conference Vol. 2, ASME, New
York, NY, p. 711-724
155
[43] W. Zheng, W.R. Tyson, R.W. Revie, G. Shen, J.E.M. Braid, effects of hydrostatic testing on
the growth of stress-corrosion cracks, Proceedings of 1998 International pipeline
conference, Vol. 1, p.459.
[44] Y. Kang, W. Chen, R. Kania, G. V. Boven, R. Worthingham, Simulation of crack growth
during hydrostatic testing of pipeline steel in near-neutral pH environment, Corr. Sci. 53,
p. 968–975
[45] T. Kushida, K. Nose, H. Asahi, M. Kimura, Y. Yamane, S. Endo, H. Kawano, Effects of
metallurgical factors and test conditions on near-neutral pH SCC of pipeline steels,
Corrosion 2001, NACE International, Houston, paper No. 01213.
[46] J. Bulger and J. Luo, Effect of microstructure on near-neutral-pH SCC, Proceeding of the
2000 International Pipeline Conference Vol. 2, ASME, New York, NY , p. 947-952.
[47] J.G. Gonzalez-Rodriguez, M. Casales, V.M. Salinas-Bravo, J.L. Albarran, L. Martinez,
Effect of microstructure on the stress corrosion cracking of X-80 pipeline steel in diluted
sodium bicarbonate solutions, Corrosion 58(7), p. 584-590.
[48] B. Gu, W.Z. Yu, J.L. Luo, X. Mao, Transgranular stress corrosion cracking of X-80 and X-
52 pipeline steels in dilute aqueous solution with near-neutral pH, Corrosion 55(3), p. 312-
318.
[49] Z. Shirband, J. Luo, W. Chen. R. Eadie, Investigation of Hydrogen permeation along a
simulated coating disbondment, to be submitted.
[50] J.T. Johnson, C.L. Durr, J.A. Beavers, B.S. Delanty, Effects of O2 and CO2 on near-neutral-
pH stress corrosion crack propagation, Proc. Corrosion 2000, NACE International
Houston, TX, paper No. 00356.
[51] W. Chen, F. King, T.R. Jack, Environmental Aspects of Near-Neutral pH Stress Corrosion
Cracking of Pipeline Steel, Metallurgical and Materials Transactions A 33A(5), p. 1429-
1436.
[52] Y. Yamaguchi, H. Nonaka, Y. Nishikawa, Critical cathodic potential and fatigue lifetime
evaluation for hydrogen stress cracking on gas transmission pipelines, Proceeding of 1998
International Gas Research Conf., San Diego, CA, p. 394-404.
[53] C. Beachem, New model for hydrogen-assisted cracking-hydrogen embrittlement, Metall.
Trans. 3 (2), p. 437-451.
156
[54] L.J. Qiao, J.L. Luo, X. Mao, Hydrogen evolution and enrichment around stress corrosion
crack tips of pipeline steels in dilute bicarbonate solution, Corrosion 54(2), 115-120
[55] J. Morlet, H. Johnson, A. Troiano: A new concept of hydrogen embrittlement in steel,
Journal of Iron and Steel Institute 189, p. 37-44.
[56] M. Whiteman, A. Troiano: Hydrogen embrittlement of austenitic stainless steel, corrosion
21, 1965, p.53-56
[57] N. J. Petch, P. Stables, Delayed Fracture of Metals under Static Load, Nature 169, p.842-43
[58] N. J. Petch, Lowering of Fracture Stress Due to Surface Adsorption, Philos. Mag. 1 (8), ,
p.331-37.
[59] W.Chen , R. Kania, R. Worthingham, G.V. Boven, Transgranular crack growth in the
pipeline steels exposed to near-neutral pH soil aqueous solutions: The role of hydrogen,
Acta Materialia 57, p. 6200–6214.
[60] R. A. Oriani, Hydrogen embrittlement of steels, Ann. Rev. Mater. Sci. 8, p.327-57
[61] X.Gao, L. Qiao, Y. Su, K. Gao, J. Li, W. Chu, displacement burst and hydrogen effect
during loading and holding in nanoindentation of an iron single crystal, Scr. Mater. 53, p.
1315-1320.
[62] V. Venegas, F. Caleyo, J. Gonzalez, T. Baudin, J. Hallen, R. Penelle, EBSD study of
hydrogen-induced cracking in API-5L-X46 pipeline steel, Scr. Mater. 52, p.147-152.
[63] H.K. Birnbaum, I.M. Robertson, P. Sofronis, D. Teter, Mechanisms of hydrogen related
fracture. A review, Proc. 2nd International Conf. Corrosion Deformation Interaction, The
Institute of Materials, London,1997, p. 172-195.
[64] B.T. Lu, Crack growth model for pipeline steels exposed to near-neutral pH groundwater.
Fatigue & Fracture of Engineering Materials & Structures 36, 2013, p. 660–669.
[65] R.L. Eadie, K.E. Szklarz, R.L. Sutherby, Corrosion fatigue and near-neutral pH stress
corrosion cracking of pipeline steel and the effect of hydrogen sulfide, Corrosion 61(2), p.
167-173.
[66] Z.Y. Liu, X.G. Li, C.W. Du, G.L. Zhai, Y.F. Cheng, Stress Corrosion Cracking Behavior of
X-70 Pipe Steel in an Acidic Soil Environment, Corr. Sci. 50, p. 2251-2257.
[67] A. Torres-Islas, J.G. Gonzalez-Rodriguez, Effect of Electrochemical Potential and Solution
Concentration on the SCC Behaviour of X-70 Pipeline Steel in NaHCO3, International
Journal of Electrochemistry 4, p. 640-652.
157
[68] Kuniya, J., H. Anzai, and I. Masaoka, Effect of MnS inclusions on stress corrosion cracking
in low-alloy steels. Corrosion 48(4), p. 419-425
[69] A. Eslami, B. Fang, R. Kania, B. Worthingham, J. Been, R. Eadie, W. Chen, Stress
corrosion cracking initiation under the disbonded coating of pipeline steel in near-neutral
pH environment, Corr. Sci. 52, p. 3750–3756.
[70] B. Fang, R. Eadie, M. Elboujdaini, Stress corrosion crack initiation in X-52 pipeline steel in
near-neutral pH solution, Proceedings of the 2010 8th International Pipeline Conference
Vol. 1, ASME, NY, p. 347-356.
[71] Y.Z. Wang, R.W. Revie, M.T. Shehata, R.N. Parkins, Early stages of stress corrosion crack
development of X-65 pipeline steel in near-neutral pH solution, Proc. Materials for
Resource Recovery and Transport, ed. L. Collins, Metallurgical Society of Canadian
Institute of Mining, Metallurgy and Petroleum (CIM), Montreal, QC, p. 71-93.
[72] Y.Z. Wang, R.W. Revie, M.T. Shehata, R.N. Parkins, K. Krist, Initiation of environment
induced cracking in pipeline steel: microstructural correlations, Proc. of the 1998
International Pipeline Conf. vol. 1, ASME International, New York, NY, p. 529-542.
[73] M. Puiggali, S. Rousserie, M. Touzet, Fatigue crack initiation on low-carbon steel pipes in a
near-neutral-pH environment under potential control conditions, Corrosion 58(11), p. 961-
970.
[74] E. Senigallia, M. Pontremoli, Test methodologies for the study of near neutral stress
corrosion cracking in pipeline steels (EPRG), Proc. 12th Biennial Joint Research Meeting
on Pipeline Research, Groningen, The Netherlands, 1999.
[75] B. Y. Fang, E. H. Han, J. Q. Wang and W. Ke, Stress corrosion cracking of X-70 pipeline
steel in near neutral pH solution subjected to constant load and cyclic load testing,
Corrosion Engineering, Science and Technology 42 (2), p.123-129.
[76] H. Guo, G. Li, X. Cai, R. Yang, W. Yang, Effect of Cyclic Loading on Cracking Behaviour
of X-70 Pipeline Steel in Near-Neutral pH Solutions, J. Mater. Sci. Technol. 21(4), p. 459-
64.
[77] G. Roy, D. Kiff, R.W. Revie, E.J. C. Cousineau, G. Williams, E. Sinigaglia, Residual
stresses in linepipe specimens, HTL Report 94-17 (TR), 1994.
[78] W. Chen, G. V. Bovan, R. Rogge, “Role of Residual Stress in SCC Crack Initiation and
Propagation” Part II-Theoretic Analysis, Acta Mater., 55, p. 43-53.
158
[79] G. Van Boven, W. Chen, R. Rogge, The role of residual stress in neutral pH stress corrosion
cracking of pipelines. Part I: pitting and cracking occurrence, Acta Materialia 55, p. 29-42.
[80] X. Tang, Y.F. Cheng, Micro-electrochemical characterization of the effect of applied stress
on local anodic dissolution behavior of pipeline steel under near-neutral pH condition,
Electrochim. Acta 54, p.1499-1505.
[81] K. Chevil, W. Chen, G.V. Boven, R. Kania, J. Been, Correlating corrosion field data with
experimental findings for the development of pipeline mitigation strategies, Proceedings of
the 2014 International Pipeline Conference, Calgary, Canada, paper No. IPC-2010-33678.
Chapter 3
[1] R. N. Parkins, W. K. J. Blanchard, and B. S. Delanty, Transgranular Stress Corrosion
Cracking of High-Pressure Pipelines in Contact with Solutions of Near Neutral pH,
Corrosion 50 (5), p. 394-408.
[2] W.Chen , R. Kania, R. Worthingham, G.V. Boven, Transgranular crack growth in the
pipeline steels exposed to near-neutral pH soil aqueous solutions: The role of hydrogen,
Acta Materialia 57, p. 6200–6214.
[3] H.H. Uhlig, T.N. Rhodin, editors. Physical metallurgy of stress corrosion fracture. New
York: Inter science; 1959. p. 6
[4] A. Egbewande, W. Chen, R. Eadie , R. Kania , G. V. Boven , R. Worthingham , J. Been,
Transgranular crack growth in the pipeline steels exposed to near-neutral pH soil aqueous
solutions: Discontinuous crack growth mechanism, Corr. Sci. 83, p. 343–354.
[5] W. Chen, An overview of near-neutral pH SCC in pipelines and mitigation strategies for its
initiation and growth, Corrosion 72 (7), p. 962-977.
[6] L.J. Qiao, J.L. Luo, X. Mao, Hydrogen evolution and enrichment around stress corrosion
crack tips of pipeline steels in dilute bicarbonate solution, Corrosion 54(2), p.115-120.
[7] W. Chen, S.H. Wang, R. Chu, F. King, T.R. Jack, R.R. Fessler, Effect of precyclic loading on
stress-corrosion-cracking initiation in an X-65 pipeline steel exposed to near-neutral pH
soil environment, Metall. Mater. Trans. A 34 , p.2601–2608.
[8] R. Chu, W. Chen, S.H. Wang, F. King, T.R. Jack, R.R. Fessler, Microstructure dependence of
stress corrosion cracking initiation in X-65 pipeline steel exposed to a near-neutral pH soil
environment, Corrosion 60 , p.275–283.
159
[9] Y.F. Cheng, Analysis of electrochemical hydrogen permeation through X-65 pipeline steel
and its implications on pipeline stress corrosion cracking, International Journal of
Hydrogen Energy 32, p. 1269 – 1276.
[10] M.C. Yan, J.Q. Wang, E.H. Han, W. Ke, Electrochemical measurements using combination
microelectrode in crevice simulating disbonded of pipeline coatings under cathodic
protection, Corros. Eng. Sci. Tec. 42, p.42–49.
[11] K. Chevil, W. Chen, G.V. Boven, R. Kania, J. Been, Correlating corrosion field data with
experimental findings for the development of pipeline mitigation strategies, Proceedings of
the 2014 International Pipeline Conference, Calgary, Canada, paper No. IPC-2010-33678.
[12] M. Yan, C Sun, J. Xu, T. Wu, S. Yang, W. Ke, EIS analysis on stress corrosion initiation of
pipeline steel under disbonded coating in near-neutral pH simulated soil electrolyte, Corr.
Sci. 110, p. 23–34.
[13] A.Q. Fu, X. Tang, Y.F. Cheng, Characterization of corrosion of X70 pipeline steel in thin
electrolyte layer under disbonded coating by scanning Kelvin probe, Corr. Sci. 51 , p. 186–
190.
[14] E. Fallahmohammadi, F. Bolzoni, L. Lazzari, Measurement of lattice and apparent diffusion
coefficient of hydrogen in X65 and F22 pipeline steels, International Journal of Hydrogen
Energy 3 8, p. 2531-254.
[15] B. Gu, W.Z. Yu, J.L. Luo, X. Mao, Transgranular stress corrosion cracking of X-80 and X-
52 pipeline steels in dilute aqueous solution with near-neutral pH, Corrosion 55(3), p.312-
318.
[16] J.T. Johnson, C.L. Durr, J.A. Beavers, B.S. Delanty, Effects of O2 and CO2 on near-neutral-
pH stress corrosion crack propagation, Proc. Corrosion 2000, NACE International
(Houston, TX), paper no. 00356.
[17] D.X. He, W. Chen, J.L. Luo, Effect of Cathodic Potential on Hydrogen Contentin a Pipeline
Steel Exposed to NS4 Near-Neutral pH Soil Solution, Corrosion 60 (8), p.778-786.
Chapter 4
[1] National Energy Board (NEB), „Public Enquiry Concerning Stress Corrosion Cracking on
Canadian Oil and Gas Pipelines‟, report #MH-2-95, 1996, p.18.
160
[2] M. Baker Jr. Inc., Stress Corrosion Cracking Study- Final Report, Department of
Transportation Research and Special Programs Administration Office of Pipeline Safety-
Integrity management program delivery order DTRS56-02-D-70036, 2005, p. 20.
[3] S.Sh. Abedi, A. Abdolmaleki, N. Adibi, Failure analysis of SCC and SRB induced cracking
of a transmission oil products pipeline, Engineering Failure Analysis14 (1), p.250–261.
[4] P. Ernst, R.C. Newman, „Pit growth studies in stainless steel foils. I. Introduction and pit
growth kinetics‟, Corr. Sci.44(5), p.927–941.
[5] B. Fang, R.L. Eadie, M. Elboudjaini, Blunt crack initiation and its transition to sharp cracks
in pipeline steel in near-neutral pH solution, Proceedings of the 2012 International Pipeline
Conference, Canada, Paper No. 90088.
[6] A. Eslami, B. Fang, R. Kania, B. Worthingham, J. Been, R. Eadie, W. Chen, „Stress
corrosion cracking initiation under the disbonded coating of pipeline steel in near-neutral
pH environment‟, Corr. Sci. 52, p.3750–56.
[7] S.Zhou, A. Turnbull, Development of prepitting procedure for turbine disc steel, British
Corrosion 35(1), p. 1-5.
[8] H.B. Xue and Y.F. Cheng, Passivity and Pitting Corrosion of X80 Pipeline Steel in
Carbonate/Bicarbonate Solution Studied by Electrochemical Measurements, Materials
Engineering and Performance19, (9), p.1311.
[9] J.L. Zhou, X.G. Li, C.W. Du, Y. Pan, T. Li and Q. Liu, „Passivation process of X80 pipeline
steel in bicarbonate solutions, Int. J. Minerals, Metallurgy and Materials, 2011,18, (2), 178
[10] F. F. Eliyan, E. Mahdi, A. Alfantazi, „Investigating the Corrosion of API-X100 Pipeline
Steel in Aerated Carbonate Solutions by Electrochemical Methods, Int. J. Electrochem.
Sci. 8, p. 578 – 590.
[11] H. H. Strehblow, „Breakdown of passivity and localized corrosion: Theoretical concepts and
fundamental experimental results‟, Materials and Corrosion 35(10), p.437-448.
[12] S. Frangini, N. De Cristofaro, Analysis of the galvanostatic polarization method for
determining reliable pitting potentials on stainless steels in crevice-free conditions, Corr.
Sci., 45(12), p. 2769–2786.
[13] W. Bouaeshi, S. Ironside, and R. Eadie, Research and Cracking Implications from an
Assessment of Two Variants of Near-Neutral pH Crack Colonies in Liquid Pipelines,
Corrosion 63 (7), p. 648.
161
[14] D.G. Li, Y.R. Feng , Z.Q. Bai, J.W. Zhu, M.S. Zheng, Influence of temperature, chloride
ions and chromium element on the electronic property of passive film formed on carbon
steel in bicarbonate/carbonate buffer solution, Electrochimica Acta 52, p. 7877–84.
[15] G. S. Frankel, „Pitting Corrosion of Metals A Review of the Critical Factors, J.
Electrochem. Soc., 1998 ,145, (6), 2186-98.
[16] D. D. Macdonald, The Point Defect Model for the Passive State, J. Electrochem. Soc.139
(12), p. 3434-49.
[17] D.H. Kang, H.W. Lee, Study of the correlation between pitting corrosion and the component
ratio of the dual phase in duplex stainless steel welds, Corr. Sci.74, p. 396–407.
[18] R.K. Gupta, B.R.W. Hinton, N. Birbilis, The effect of chromate on the pitting susceptibility
of AA7075-T651 studied using potentiostatic transients, Corr. Sci. 82, p.197–207.
[19] G. T. Gaudet, W. T. Mo, T. A. Hatton, J. W. Tester, J. Tilly, H. S. Isaacs, R. C. Newman,
Mass Transfer and Electrochemical Kinetic Interactions in Localized Pitting Corrosion,
AIChE Journal 32 (6), p.949-958.
[20] W. Chen, R. Kania, R. Worthingham, G. V. Boven, „Transgranular crack growth in the
pipeline steels exposed to near-neutral pH soil aqueous solutions: The role of hydrogen‟,
Acta Materialia 57, p. 6200–6214.
[21] A. Egbewande, W. Chen, R. Eadie, R. Kania, G.V. Boven, R.Worthingham , J. Been,
Transgranular crack growth in the pipeline steels exposed to near-neutral pH soil aqueous
solutions: Discontinuous crack growth mechanism, Corr. Sci.83, p. 343–354.
[22] Z. Qin, B. Demko, J. Noël, D. Shoesmith, F. King, R. Worthingham, and K. Keith,
Localized Dissolution of Millscale-Covered Pipeline Steel Surfaces, Corrosion 60 (10),
p.906.
Chapter 5
[1] National Energy Board, 1996, "Public Enquiry Concerning Stress Corrosion Cracking on
Canadian Oil and Gas Pipelines," report #MH-2-95.
[2] R.N. Parkins, A review of stress corrosion cracking of high pressure pipelines, Corrosion
2000, Paper No. 00363.
[3] A. Egbewande , W. Chen, R. Eadie , R. Kania , G. V. Boven , R.Worthingham, J. Been,
Transgranular crack growth in the pipeline steels exposed to near-neutral pH soil aqueous
solutions: Discontinuous crack growth mechanism, Corr. Sci. 83, p.343–354.
162
[4] W.Chen , R. Kania, R. Worthingham, G.V. Boven, Transgranular crack growth in the
pipeline steels exposed to near-neutral pH soil aqueous solutions: The role of hydrogen,
Acta Materialia 57, p. 6200–6214.
[5] A. Eslami, B. Fang, R. Kania, B. Worthingham, J. Been, R. Eadie, W. Chen, Stress corrosion
cracking initiation under the disbonded coating of pipeline steel in near-neutral pH
environment, Corr. Sci.52, p.3750–3756.
[6] B. Fang, R. Eadie, W. Chen, and M. Elboujdaini, A Passivation/Acid-Immersion Technique
to Grow Pits in Pipeline Steel and a Study of the Resulting Pit Nucleation and Growth,
Corrosion Engineering, Science and Technology, 44(1), p.32-42.
[7] L.Y. Xu, Y.F. Cheng, Corrosion of X100 pipeline steel under plastic strain in a neutral pH
bicarbonate solution, Corr.Sci. 64, p.145–152.
[8] X. C. Li, R. L. Eadie and J. L. Luo, Influence of plasticity on corrosion and stress corrosion
cracking behaviour in near neutral pH environment, Corrosion Engineering, Science and
Technology (43), p. 297-303.
[9] J. Li, M. Elboujdaini, M. Gao, R.W. Revie, Investigation of plastic zones near SCC tips in a
pipeline after hydrotest testing, Materials Science and Engineering A 486, p.496–502.
[10] B. Fang, R.L. Eadie, M. Elboujdaini, Blunt crack initiation and its transition to sharp cracks
in pipeline steel in near-neutral pH solution, Proceedings of the 2012 9th International
Pipeline Conference, paper No. IPC2012-90088.
[11] B.T. Lu, J.L. Luo, P.R. Norton, Environmentally assisted cracking mechanism of pipeline
steel in near-neutral pH groundwater, Corr. Sci. 52, p.1787–1795.
[12] D.W. Hoeppner, Model for prediction of fatigue lives based upon a pitting corrosion fatigue
process, fatigue mechanisms, ASTM STP 675, 1979, p.841–870.
[13] Kimberli Jones, David W. Hoeppner, Pit-to-crack transition in pre-corroded 7075-T6
aluminum alloy under cyclic loading, Corr. Sci. 47, p.2185–2198.
[14] X. Tanga, Y.F. Cheng, Micro-electrochemical characterization of the effect of applied stress
on local anodic dissolution behavior of pipeline steel under near-neutral pH condition,
Electrochimica Acta 54, p.1499–1505.
[15] Y. Frank Cheng, Stress Corrosion Cracking of Pipelines, Wiley, 2013.
[16] ASM metals Handbook, Fatigue and Fracture, ASM International, 1996.
[17] William F. Hosford, Mechanical Behavior of Materials, Cambridge University Press, 2005.
163
[18] C.W. Du, X.G. Li, P. Liang, Z.Y. Liu, G.F. Jia, and Y.F. Cheng, Effects of Microstructure
on Corrosion of X70 Pipe Steel in an Alkaline Soil, Journal of Materials Engineering and
Performance, Corrosion (2000), paper No. 00023.
[19] J. Li, M. Elboujdaini, B. Fang, R.W. Revie and M.W. Phaneuf. Microscopy Study of
Intergranular Stress Corrosion Cracking of X-52 Line Pipe Steel, Corrosion 62 (4), p. 316-
322.
[20] J.A.S. Green, R.N. parkins, Electrochemical properties of ferrite and cementite in relation to
stress corrosion cracking of mild steels in nitrate solution, Corrosion 24 (3), p.66-69.
[21] K. Chevil, W. Chen, G. V. Boven, R. Kania, J. Been, Correlating corrosion field data with
experimental findings for the development of pipeline mitigation strategies, Proceeding of
the 2014 International Pipeline Conference, ASME ,paper No. IPC2014-33678.
[22] A. Egbewande, W. Chen, R. Eadie, R. Kania, G. V. Boven, R. Worthingham, J. Been,
Transgranular crack growth in the pipeline steels exposed to near-neutral pH soil aqueous
solutions: Discontinuous crack growth mechanism, Corr. Sci. 83, p. 343–354.
[23] W. CHEN, S.-H. WANG, R. CHU, F. KING, T.R. JACK, and R.R. FESSLER, Effect of
Precyclic Loading on Stress-Corrosion-Cracking Initiation in an X-65 Pipeline Steel
Exposed to Near-Neutral pH Soil Environment, Metallurgical & Materials Transactions A
34A, p.2601-08.
[24] W. Zheng, D. Bibby, J.Li, J.T. Bowker, J.A. Gianetto, R.W. Revie, G. Williams, Near-
neutral pH SCC of two pipeline steel under quasi-static stressing conditions, Proceeding of
the 2006 International Pipeline Conference, ASME, paper No. IPC2006-10084.
[25] Z. Qin, B. Demko, J. Noël, D. Shoesmith, F. King, R. Worthingham, K. Keith, Localized
Dissolution of Millscale-Covered Pipeline Steel Surfaces, Corrosion 60(10), p. 906-914.
[26] G. Van Boven, W. Chen, R. Rogge, The role of residual stress in neutral pH stress corrosion
cracking of pipeline steels. Part I: Pitting and cracking occurrence, Acta Materialia 55,
p.29–42.
Chapter 6
[1] F. King, T. Jack, W. Chen, S.-H. Wang, M. Elboujdaini, W. Revie, R. Worthingham, P.
Dusek, Development of a predictive model for the initiation and early-stage growth of
near-neutral pH SCC of pipeline steels, Proc. Corrosion 2001, NACE International
(Houston, TX), paper no. 01214.
164
[2] Y.Z. Wang, R.W. Revie, M.T. Shehata, R.N. Parkins, Early stages of stress corrosion crack
development of X-65 pipeline steel in near-neutral pH solution, Proc. Materials for
Resource Recovery and Transport, L. Collins (ed.), Metallurgical Society of Canadian
Institute of Mining, Metallurgy and Petroleum (CIM), Montreal, QC, p. 71-93.
[3] Y.Z. Wang, R.W. Revie, M.T. Shehata, R.N. Parkins, K. Krist, Initiation of environment
induced cracking in pipeline steel: microstructural correlations, Proc. the 1998
International Pipeline Conf. vol. 1, ASME International, New York, NY, p. 529-542
[4] W. Chen, An overview of near-neutral pH SCC in pipelines and mitigation strategies for its
initiation and growth, Corrosion 72 (7), p. 962-977.
[5] ISO 6157-1:1988, Fasteners -Surface discontinuities -Part 1: Bolts, screws and studs for
general requirements
[6] ASTM A788, Standard Specification for Steel Forgings, General Requirements
[7] W. Chen, F. King, E. Vokes, Characteristics of Near-Neutral-pH Stress Corrosion Cracks in
an X-65 Pipeline, Corrosion 58(3), p. 267-275.
[8] W. Chen and R. L. Sutherby, Crack Growth Behavior of Pipeline Steel in Near-Neutral pH
Soil Environments, Metall. Maters Tran. 38 A, p.1260-68.
[9] K. Chevil, W. Chen, G.V. Boven, R. Kania, J. been, Correlating corrosion field data with
experimental findings for the development of pipeline mitigation strategies, Proc. the 2014
Inter. Pipeline. Conf., ASME, Paper no. IPC2014-33678.
[10] Z. Qin, B. Demko, J. Noel, D. Shoesmith, F. King, Localized Dissolution of Millscale-
Covered Pipeline Steel Surfaces, Corrosion 60(10), p.906.
[11] J. Been, H. Lu, F. King, T. Jack, R. Sutherby, The role of hydrogen in EAC of pipeline
steels in near-neutral pH environments, in Environment-Induced Cracking of Materials,
Edited by: S.A. Shipilov, R.H. Jones, J.-M. Olive and R.B. Rebak, 2008, p.255.
[12] M.A. Legodi, D. de Waal, The preparation of magnetite, goethite, hematite and maghemite
of pigment quality from mill scale iron waste, Dyes and Pigments 74, p.161-168.
[13] B.W.A. Sherar, P.G. Keech , D.W. Shoesmith, The effect of sulfide on the aerobic corrosion
of carbon steel in near-neutral pH saline solutions, Corr. Sci. 66 , p.256–262.
[14] J.A.S. Green, R.N. Parkin, Electrochemical properties of ferrite and cementite in relation to
stress corrosion of mild steels in Nitrate solutions, Corrosion 24(3), p.66-69.

165
[15] P.A. Schweitzer, Corrosion and Corrosion Protection Handbook, Second Edition, Marcel
Dekker Inc. 1988, p. 6.
[16] D.S. Mancey, The Dissolution of Magnetite Films from Carbon Steel Surfaces, Ph.D. thesis,
Univ. of Manitoba, Canada, 1985.
[17] M.J. Pryor, U.R. Evans, The reductive dissolution of ferric oxide in acid. Part I. The
reductive dissolution of oxide films present on iron, J. Chem. Soc. (1950) p. 1259.
[18] T.R. Jack, F. King, L. Yang, R. Sutherby, Kinetic Isotope Effects in the Corrosion and
Hydrogen Loading of Line Pipe Steel: Implications for Stress Corrosion Cracking, Proc.
Environmental Degradation of Materials and Corrosion Control in Metals, eds. J. Luo, M.
Elboujdaini, D. Shoesmith, P.C. Patnaik, Montreal, PQ: Canadian Inst. of Mining,
Metallurgy, and Petroleum, 2003, p. 205.
[19] J. Been, H. Lu, F. King, T. Jack, R. Sutherby, The role of hydrogen in EAC of pipeline
steels in near-neutral pH environments, in Environment-Induced Cracking of Materials,
Edited by: S.A. Shipilov, R.H. Jones, J.-M. Olive and R.B. Rebak, 2008, p.255.
166
Appendix A: Nickel Electroplating Procedure
For a better cross-section characterization, some of the specimens were plated with nickel prior
to mounting and cross-sectioning to preserve surface features. Nickel plating was performed
using a two-electrode system and a power supply. The anode used was pure nickel and the
cathode was the corroded pipeline steel specimen. An electrolyte containing 270g/ml
NiSO4.6H2O, 45g/ml NiCl.5H2O, 35g/ml Boric Acid, 0.2g/ml Sodium Dodecyl Sulfate (SDS)
and 0.3g/ml Saccharin was used as the solution. This solution had a pH=4 at the time of Nickel
plating. The corroded surface of specimens was initially cleaned of any corrosion product and
then polished gently. Only the corroded surface was exposed to the Nickel plating solution and
other surfaces were covered with a resin. A current density of 50 mA/cm2 was employed to
deposit Nickel on the steel sample and the desired thickness of plated Nickel was achieved by
selecting an appropriate time based on the Faraday‟s law [1].
Reference:
[1] V.S. Bagotsky, Electrochemistry, and Environment, in Fundamentals of electrochemistry 2nd
Edition, John Wiley & Sons, 2005.